Correlation Analysis to Identify the Effective Data in Machine Learning: Prediction of Depressive Disorder and Emotion States

Abstract
1. Introduction
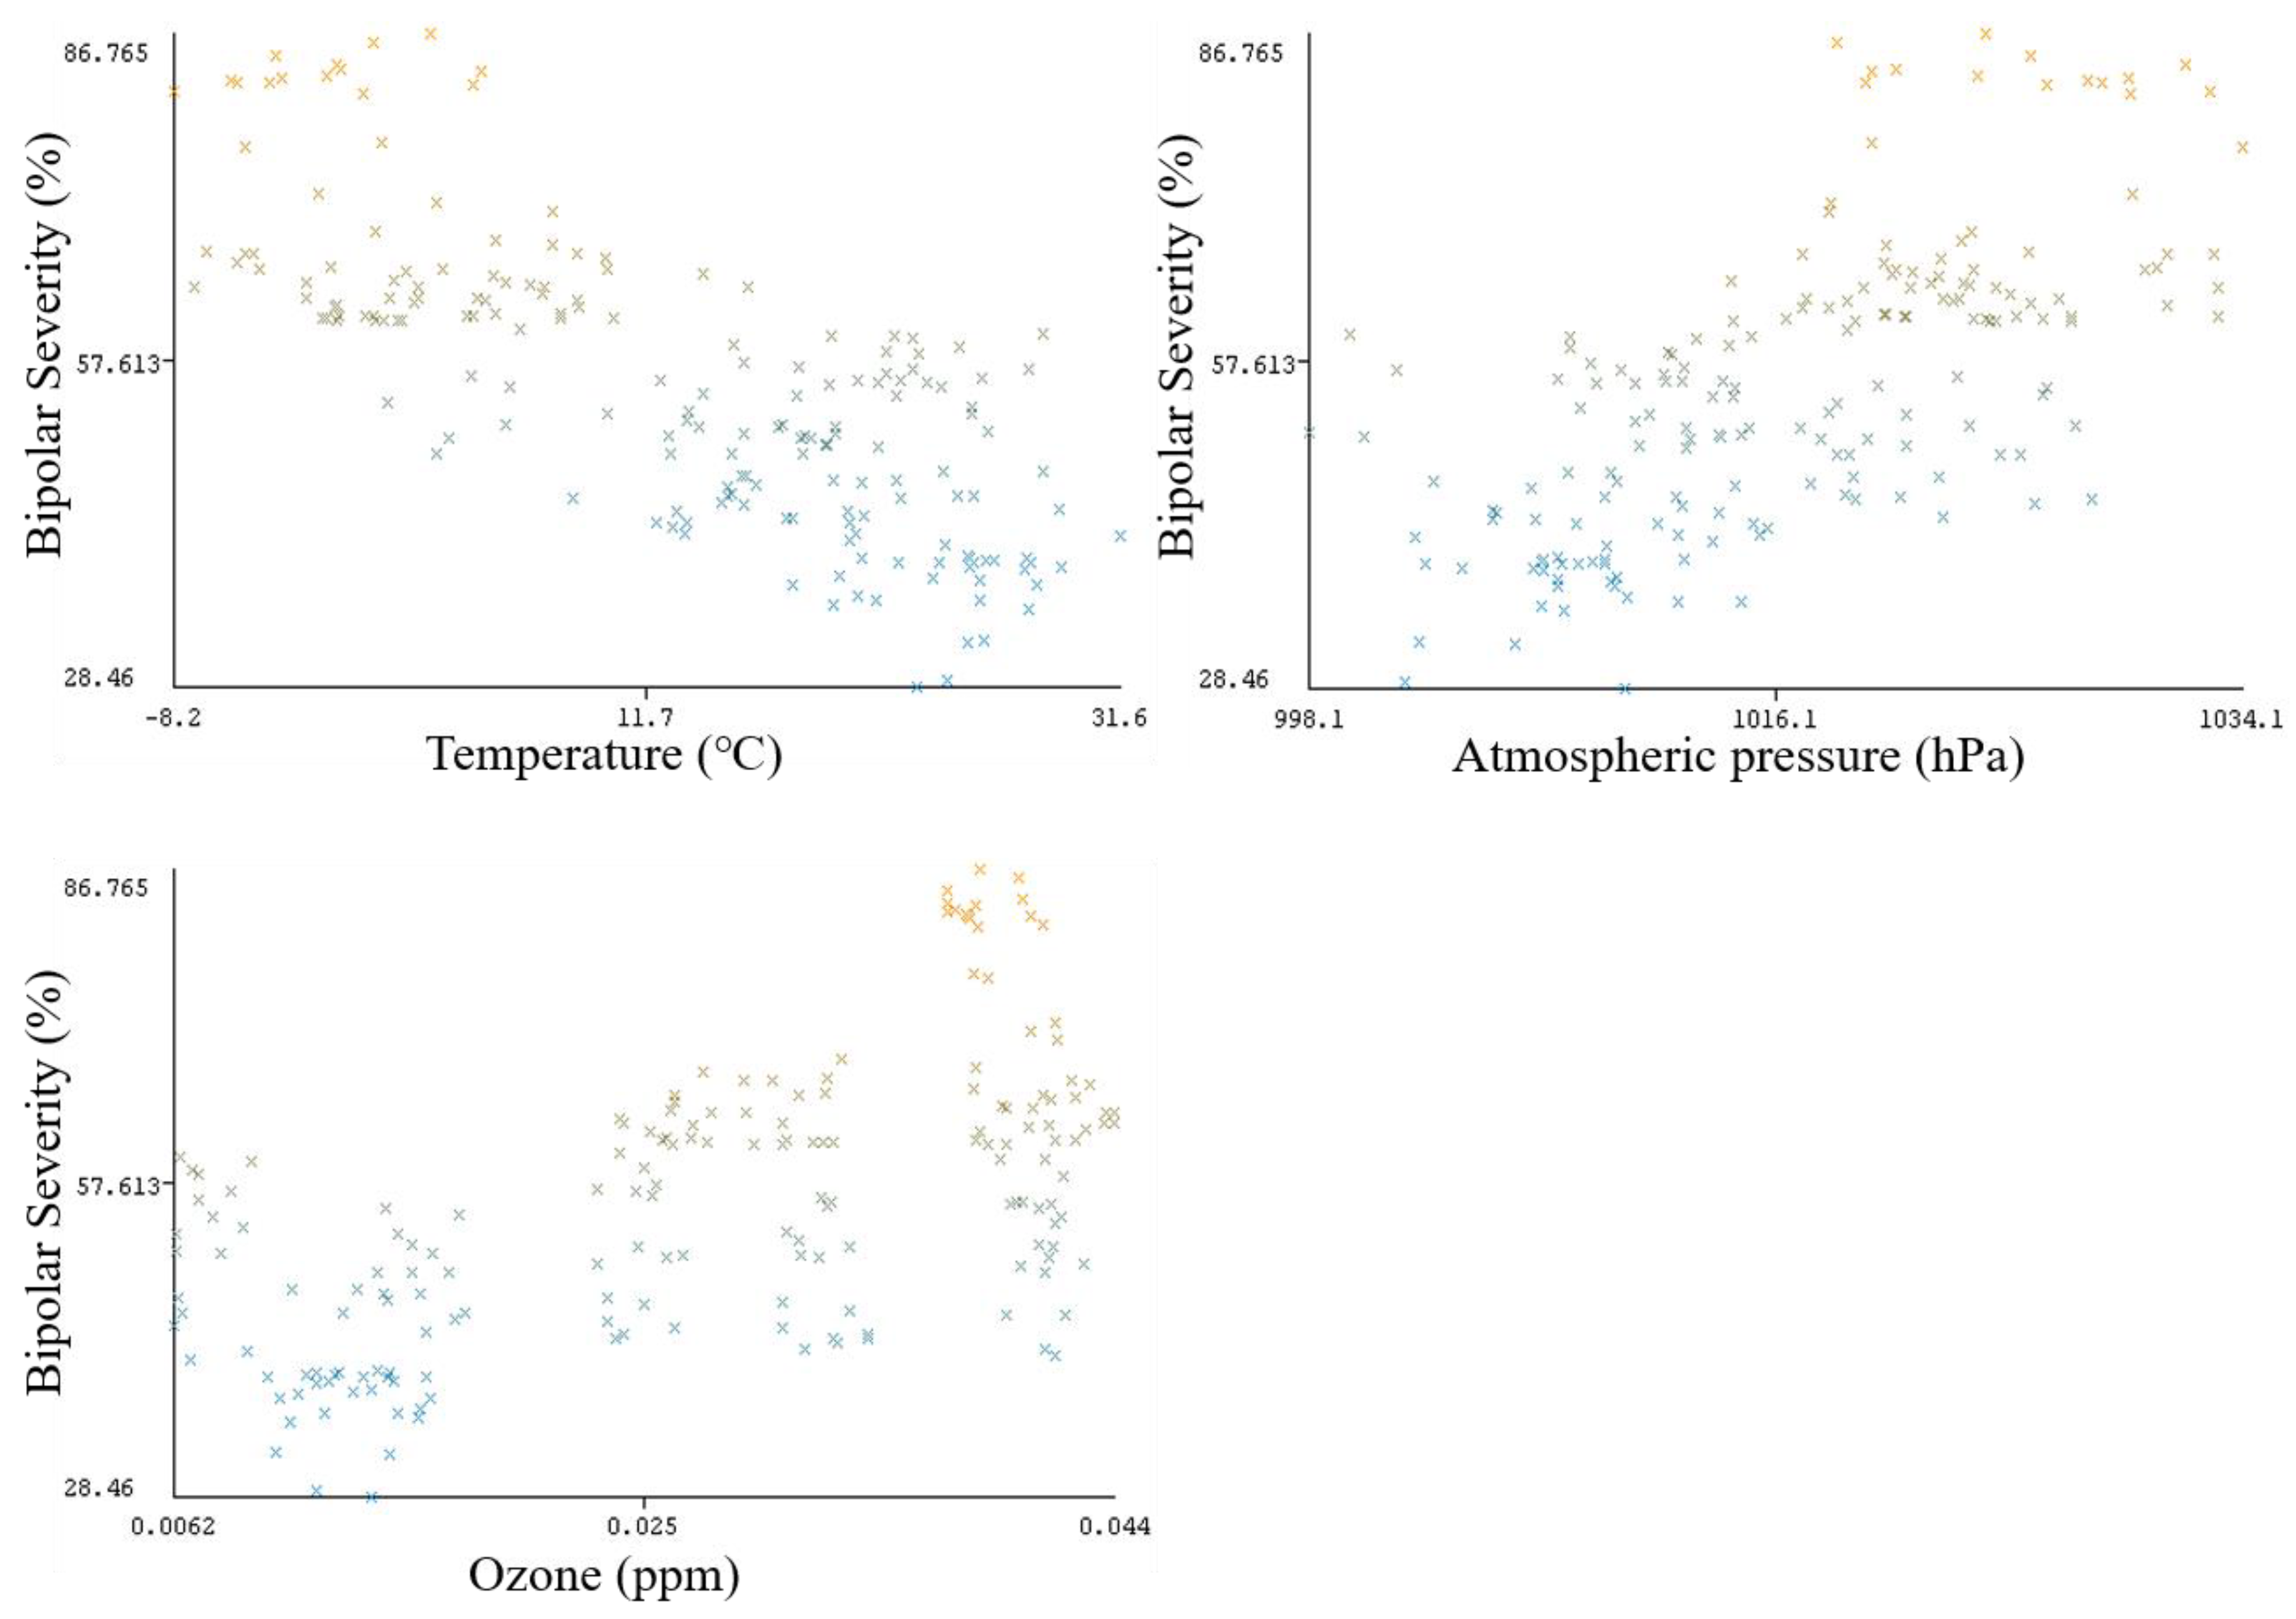
- Analyzing the impact of weather on two types of depressive disorder; Bipolar and Melancholia disorder.
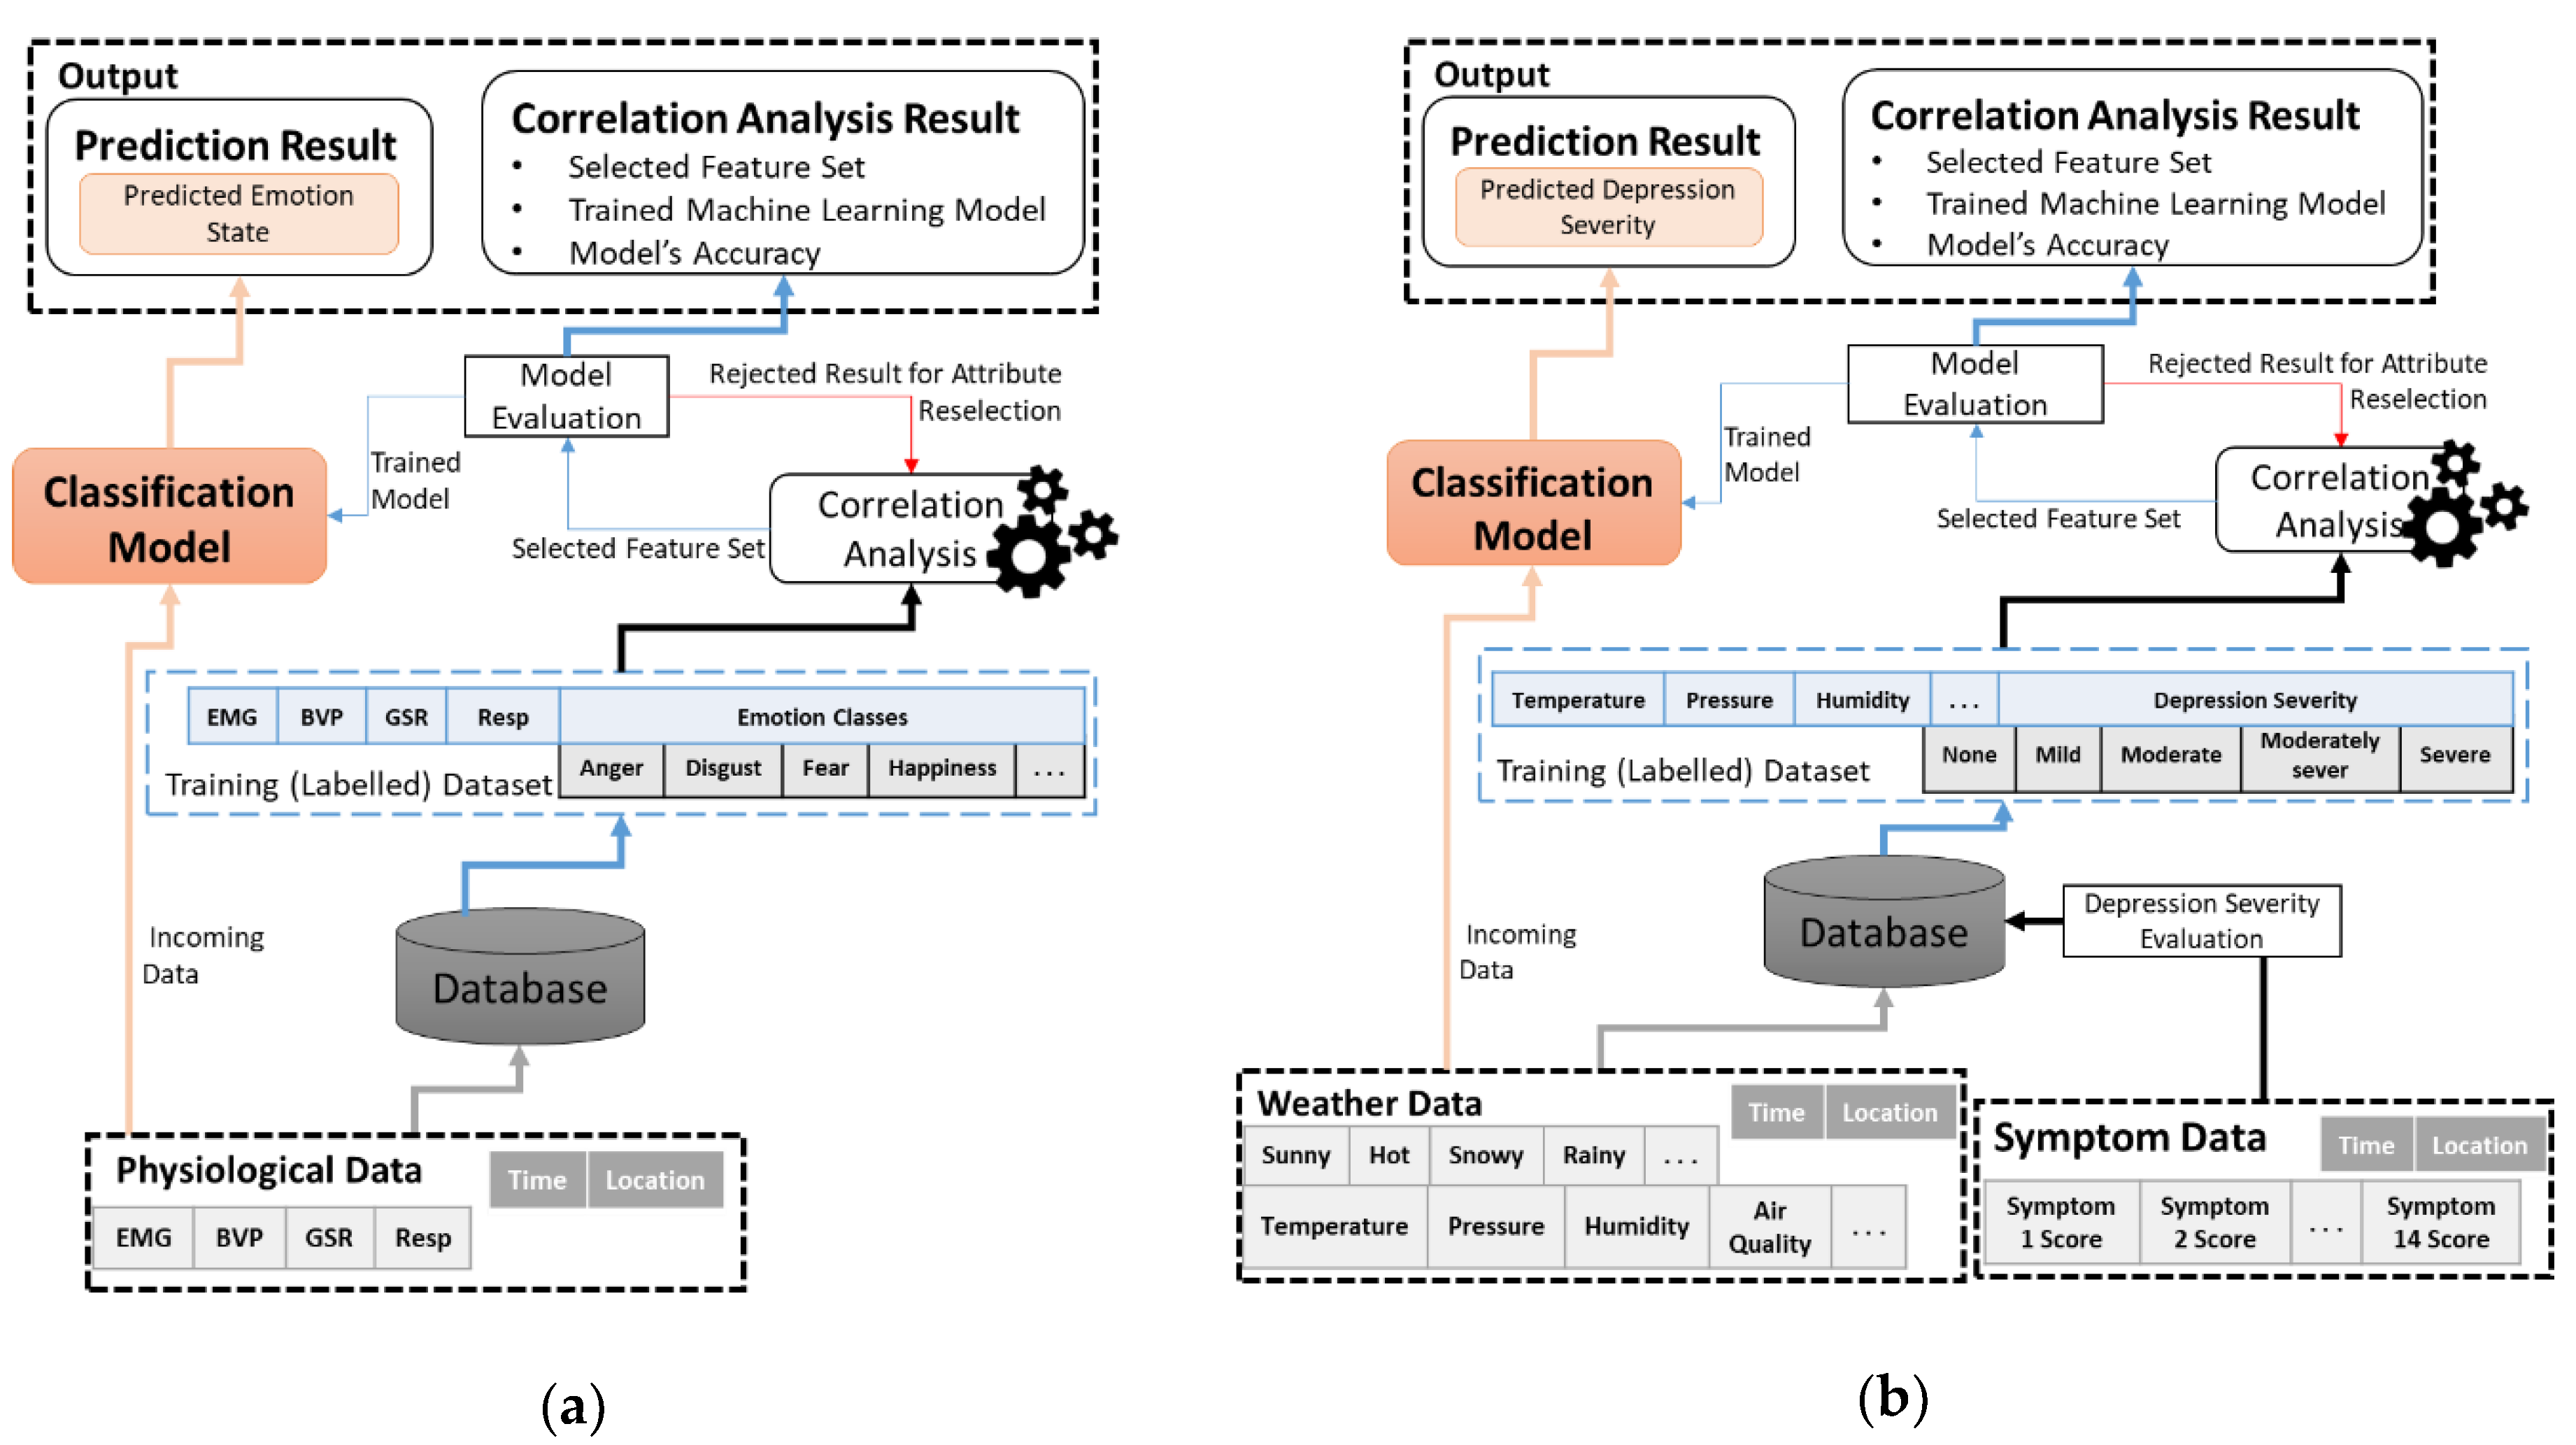
- Analyzing the impact of physiological data on emotions, as well as identifying patient’s health status, using machine learning with strong correlated attributes.
- Experimentation for data acquisition and analysis.
- Achieving higher accuracies from the proposed methodology and discussing the results based on highly correlated data.
2. Related Works
3. Correlation Analysis Methodology
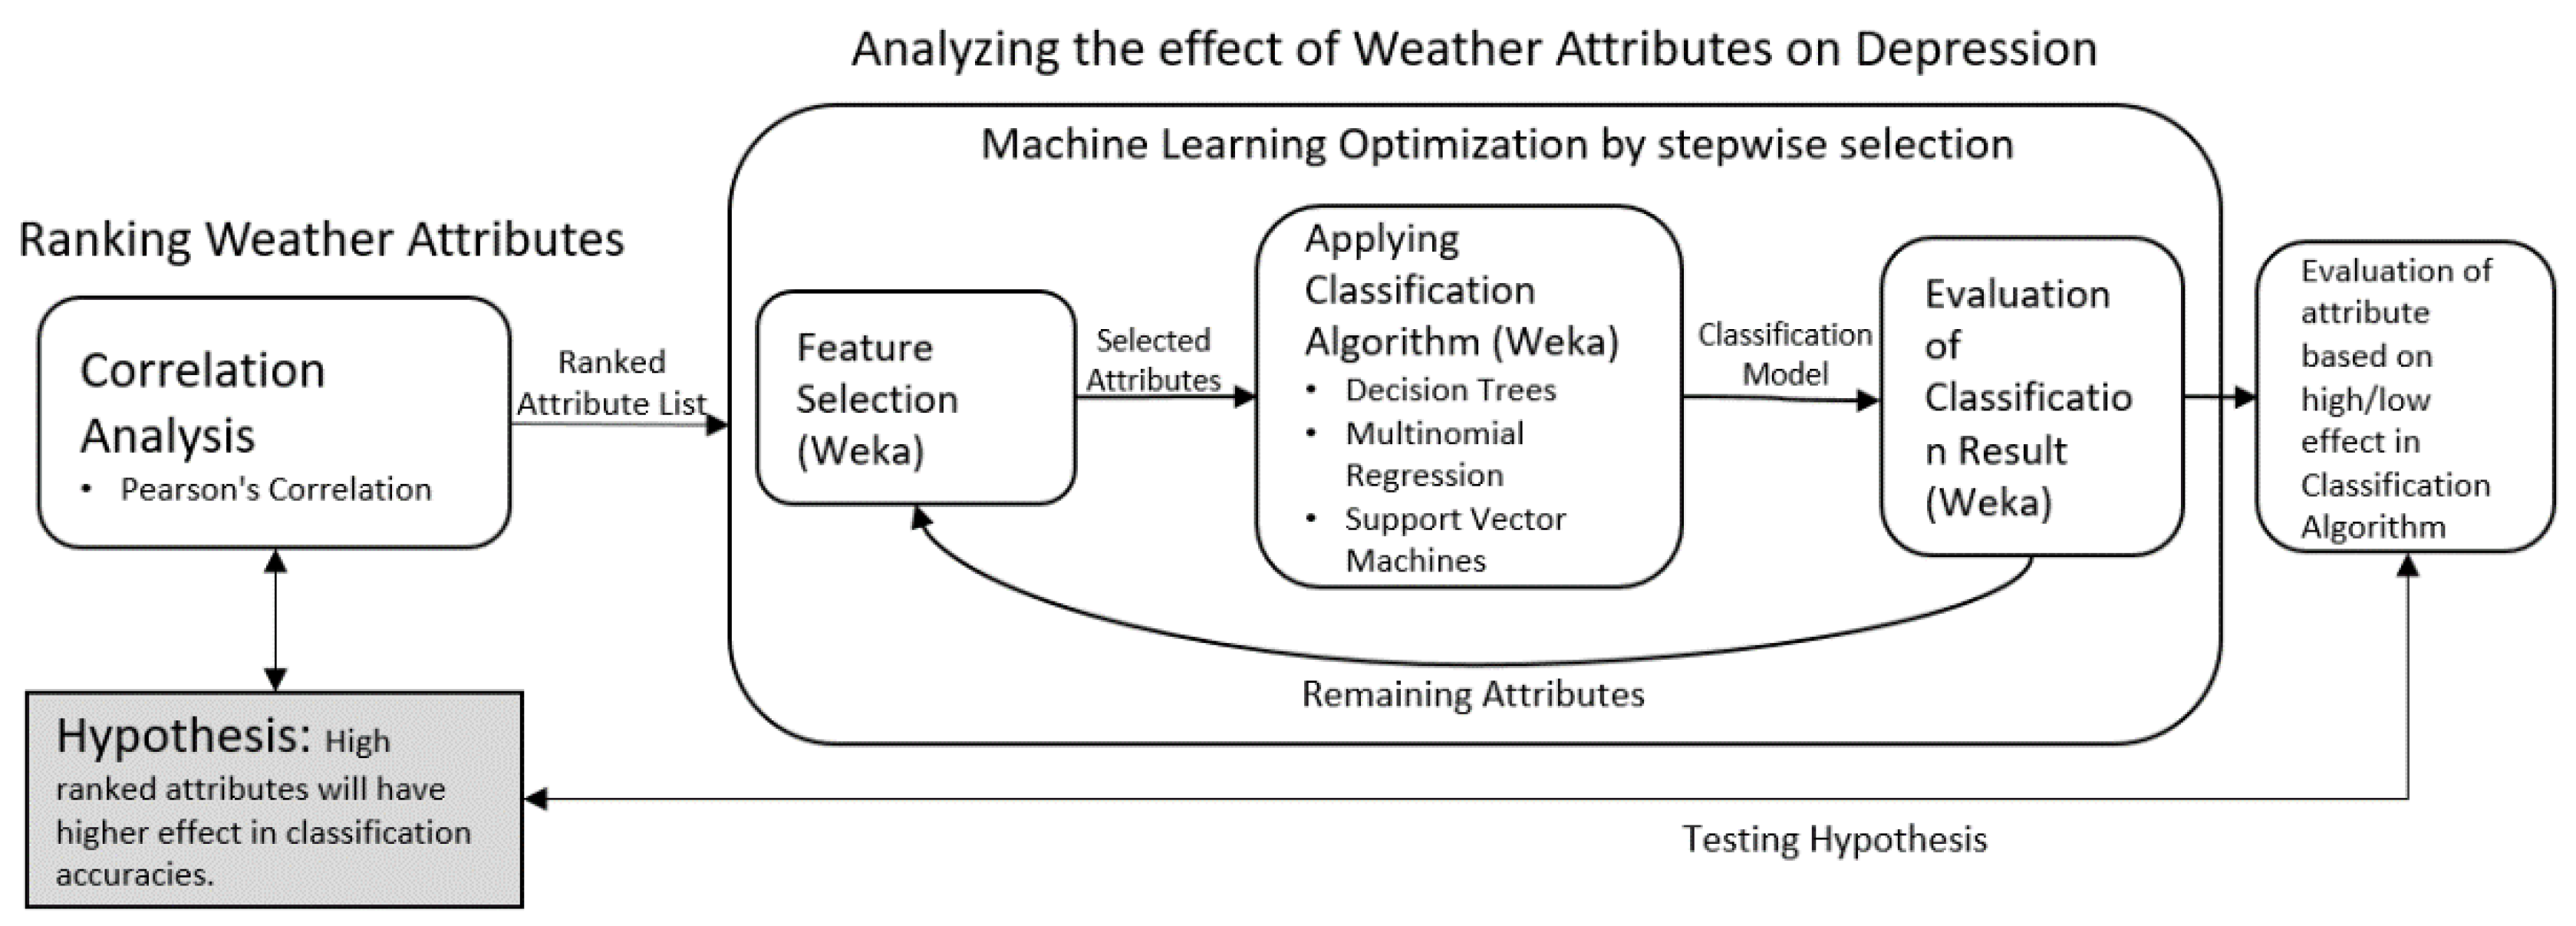
3.1. Methodology to Identify Strong Predictor Attributes
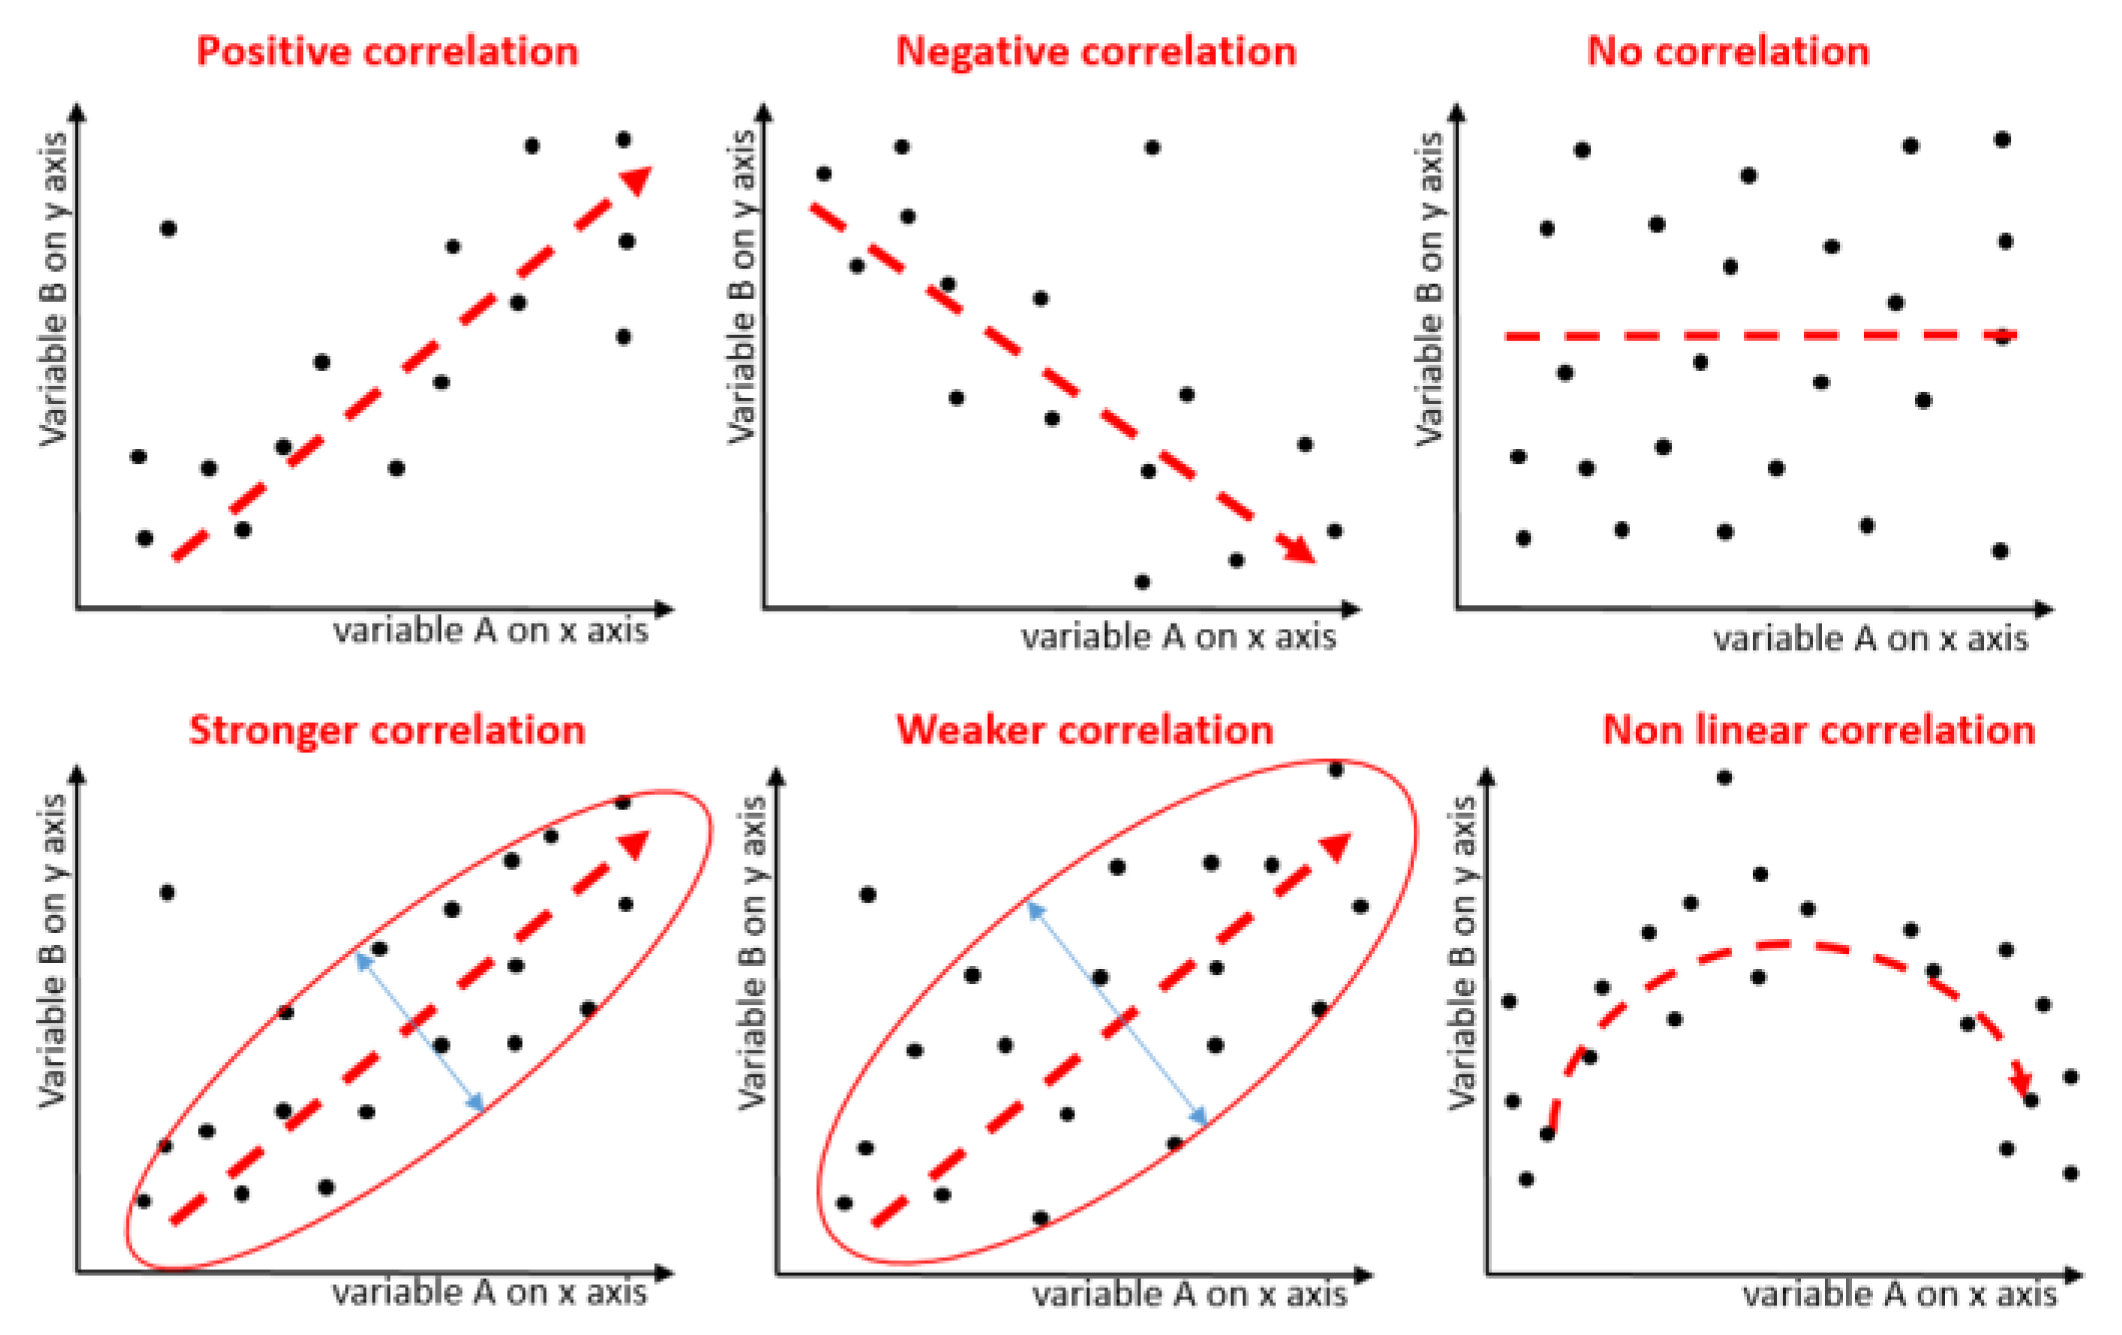
3.2. Correlation-based Attribute Ranking
- Higher correlations among the features indicate lower correlation between the feature set and dependent class.
- Higher correlations between the features and the dependent class indicate higher correlation between the feature set and dependent class.
- Higher number of features indicate higher correlation between the feature set and dependent class.
3.3. Prediction based on Ranked Attributes
4. Dataset Description used for Correlation Analytics
- Depressive disorder symptom dataset for evaluating depression severity.
- Local weather dataset for classifying depression severity.
- Physiological sensor dataset for emotion detection.
4.1. Depressive Disorder Symptom Dataset
4.2. Local Weather Dataset
4.3. Physiological Sensor Dataset
Feature Extracted from Raw Data
5. Experimentation and Results
5.1. Experimentation Use Case: Depressive Disorder for Teens
5.2. Results of Correlation Analysis
5.3. Machine Learning Results
6. Discussions
7. Conclusions
Author Contributions
Funding
Conflicts of Interest
References
- Han, J.; Kamber, M. Data Mining: Concepts and Techniques, 2nd ed.; University of Illinois at Urbana-Champaign: Champaign, IL, USA, 2006; ISBN 9781558609013. [Google Scholar]
- Bauman, A.E.; Sallis, J.F.; Dzewaltowski, D.A.; Owen, N. Toward a better understanding of the influences on physical activity: The role of determinants, correlates, causal variables, mediators, moderators, and confounders. Am. J. Prev. Med. 2002, 23, 5–14. [Google Scholar] [CrossRef]
- Park, J.N.; Han, M.A.; Park, J.; Ryu, S.Y. Prevalence of Depressive Symptoms and Related Factors in Korean Employees: The Third Korean Working Conditions Survey (2011). Int. J. Environ. Res. Public Health 2011, 13, 424. [Google Scholar] [CrossRef] [PubMed]
- Choi, K.-S.; Kang, S.-K. Occupational Psychiatric Disorders in Korea. J. Korean Med. Sci. 2010, 25, 87–93. [Google Scholar] [CrossRef] [PubMed]
- Jeong, B.G.; Veenstra, G. The intergenerational production of depression in South Korea: Results from a cross-sectional study. Jeong Veenstra Int. J. Equity Heal. 2017, 16, 13. [Google Scholar] [CrossRef] [PubMed]
- Jarwar, M.A.; Abbasi, R.A.; Mushtaq, A.; Maqbool, O.; Aljohani, N.R.; Daud, A.; Alowibdi, J.S.; Cano, J.R.; García, S.; Chong, I. Undefined CommuniMents: A Framework for Detecting Community Based Sentiments for Events. 2017. Available online: https://www.igi-global.com (accessed on 19 July 2018).
- Pantic, M.; Patras, I. Dynamics of facial expression: Recognition of facial actions and their temporal segments from face profile image sequences. IEEE Trans. Syst. Man Cybern. Part B 2006, 36, 433–449. [Google Scholar] [CrossRef]
- El Ayadi, M.; Kamel, M.S.; Karray, F. Survey on speech emotion recognition: Features, classification schemes, and databases. Pattern Recognit. 2011, 44, 572–587. [Google Scholar] [CrossRef]
- Kessous, L.; Castellano, G.; Caridakis, G. Multimodal emotion recognition in speech-based interaction using facial expression, body gesture and acoustic analysis. J. Multimodal User Interfaces 2010, 3, 33–48. [Google Scholar] [CrossRef]
- Batliner, A.; Seppi, D.; Steidl, S.; Schuller, B. Segmenting into Adequate Units for Automatic Recognition of Emotion-Related Episodes: A Speech-Based Approach. Adv. Hum.-Comput. Interact. 2010, 2010, 1–15. [Google Scholar] [CrossRef]
- Syllignakis, M.N.; Kouretas, G.P. Dynamic correlation analysis of financial contagion: Evidence from the Central and Eastern European markets. Int. Rev. Econ. Financ. 2011, 20, 717–732. [Google Scholar] [CrossRef]
- Sandoval Junior, L. Correlation of financial markets in times of crisis. Phys. A Stat. Mech. Appl. 2012, 391, 187–208. [Google Scholar] [CrossRef]
- Inamdar, D.; Leblanc, G.; Soffer, R.J.; Kalacska, M. The correlation coefficient as a simple tool for the localization of errors in spectroscopic imaging data. Remote Sens. 2018, 10, 231. [Google Scholar] [CrossRef]
- Vavliakis, K.N.; Gemenetzi, K.; Mitkas, P.A. A Correlation Analysis of Web Social Media. In Proceedings of the International Conference on Web Intelligence, Mining and Semantics, Sogndal, Norway, 25–27 May 2011. [Google Scholar]
- Erdem, O.; Ceyhan, E.; Varli, Y. A new correlation coefficient for bivariate time-series data. Phys. A 2014, 414, 274–284. [Google Scholar] [CrossRef]
- Abhang, P.A.; Gawali, B.W. Correlation of EEG Images and Speech Signals for Emotion Analysis. Br. J. Appl. Sci. Technol. 2015, 10, 1–13. [Google Scholar] [CrossRef]
- Huibers, M.J.H.; de Graaf, L.E.; Peeters, F.P.M.L.; Arntz, A. Does the weather make us sad? Meteorological determinants of mood and depression in the general population. Psychiatry Res. 2010, 180, 143–146. [Google Scholar] [CrossRef] [PubMed]
- Yang, W.; Mu, L.; Shen, Y. Effect of climate and seasonality on depressed mood among twitter users. Appl. Geogr. 2015, 63, 184–191. [Google Scholar] [CrossRef]
- Molin, J.; Mellerup, E.; Bolwig, T.; Scheike, T. The influence of climate on development of winter depression. J. Affect. Disord. 1996, 37, 151–155. [Google Scholar] [CrossRef]
- Blanchard, E.B.; Buckley, T.C.; Hickling, E.J.; Taylor, A.E. Posttraumatic Stress Disorder and Comorbid Major Depression: Is the Correlation an Illusion? J. Anxiety Disord. 1998, 12, 21–37. [Google Scholar] [CrossRef]
- Mitani, H.; Shirayama, Y.; Yamada, T.; Maeda, K.; Ashby, C.R.; Kawahara, R. Correlation between plasma levels of glutamate, alanine and serine with severity of depression. Prog. Neuro-Psychopharmacol. Biol. Psychiatry 2006, 30, 1155–1158. [Google Scholar] [CrossRef]
- Khalili, Z.; Moradi, M.H. Emotion recognition system using brain and peripheral signals: Using correlation dimension to improve the results of EEG. In Proceedings of the 2009 International Joint Conference on Neural Networks, Atlanta, GA, USA, 14–19 June 2009; pp. 1571–1575. [Google Scholar]
- Albert, P.S.; Rosen, L.N.; Alexander, J.R., Jr.; Rosenthal, N.E. Effect of daily variation in weather and sleep on seasonal affective disorder. Psychiatry Res. 1991, 36, 51–63. [Google Scholar] [CrossRef]
- Spasova, Z. The effect of weather and its changes on emotional state—Individual characteristics that make us vulnerable. Adv. Sci. Res. 2012, 6, 281–290. [Google Scholar] [CrossRef]
- Bulbena, A.; Pailhez, G.; Acena, R.; Cunillera, J.; Rius, A.; Garcia-Ribera, C.; Gutiérrez, J.; Rojo, C. Panic anxiety, under the weather? Int. J. Biometeorol. 2005, 49, 238–243. [Google Scholar] [CrossRef] [PubMed]
- Frank, E.; Hall, M.A.; Witten, I.H. The WEKA Workbench. Online Appendix for “Data Mining: Practical Machine Learning Tools and Techniques”; Morgan Kaufmann: Burlington, MA, USA, 2016. [Google Scholar]
- Hall, M.A. Correlation-Based Feature Selection for Machine Learning; The University of Waikato: Hamilton, New Zealand, 1999. [Google Scholar]
- Sun, F.-T.; Kuo, C.; Cheng, H.-T.; Buthpitiya, S.; Collins, P.; Griss, M. Activity-Aware Mental Stress Detection Using Physiological Sensors; Springer: Berlin/Heidelberg, Germany, 2012; pp. 282–301. [Google Scholar]
- Burns, M.N.; Begale, M.; Duffecy, J.; Gergle, D.; Karr, C.J.; Giangrande, E.; Mohr, D.C. Harnessing context sensing to develop a mobile intervention for depression. J. Med. Internet Res. 2011, 13, e55. [Google Scholar] [CrossRef] [PubMed]
- Zeng, L.-L.; Shen, H.; Liu, L.; Wang, L.; Li, B.; Fang, P.; Zhou, Z.; Li, Y.; Hu, D. Identifying major depression using whole-brain functional connectivity: A multivariate pattern analysis. Brain 2012, 135, 1498–1507. [Google Scholar] [CrossRef] [PubMed]
- Van der Gaag, M.; Hoffman, T.; Remijsen, M.; Hijman, R.; de Haan, L.; van Meijel, B.; van Harten, P.N.; Valmaggia, L.; de Hert, M.; Cuijpers, A.; et al. The five-factor model of the Positive and Negative Syndrome Scale II: A ten-fold cross-validation of a revised model. Schizophr. Res. 2006, 85, 280–287. [Google Scholar] [CrossRef]
- Wählby, U.; Jonsson, E.N.; Karlsson, M.O. Comparison of stepwise covariate model building strategies in population pharmacokinetic-pharmacodynamic analysis. AAPS PharmSciTech 2002, 4, 68–79. [Google Scholar] [CrossRef] [PubMed]
- Li, J.; Zhang, Z.; Rosenzweig, J.; Wang, Y.Y.; Chan, D.W. Proteomics and bioinformatics approaches for identification of serum biomarkers to detect breast cancer. Clin. Chem. 2002, 48, 1296–1304. [Google Scholar]
- Ambroise, C.; McLachlan, G.J. Selection bias in gene extraction on the basis of microarray gene-expression data. Proc. Natl. Acad. Sci. USA 2002, 99, 6562–6566. [Google Scholar] [CrossRef]
- Breiman, L. Random Forests. Mach. Learn. 2001, 45, 5–32. [Google Scholar] [CrossRef]
- Le Cessie, S.; Van Houwelingen, J.C.; Le Cessiet, S.; Van Houwelingen, J.C. Ridge Estimators in Logistic Regression. Source J. R. Stat. Soc. Ser. C (Appl. Stat. Appl. Stat.) 1992, 41, 191–201. [Google Scholar] [CrossRef]
- Friedman, J.; Hastie, T.; Tibshirani, R. Additive logistic regression: A statistical view of boosting (With discussion and a rejoinder by the authors). Ann. Stat. 2000, 28, 337–407. [Google Scholar] [CrossRef]
- Manzalawy, Y.; Weka, V.H. LibSVM (WLSVM): Integrating LibSVM into Weka Environment. Available online: http://ailab.ist.psu.edu/yasser/wlsvm.html (accessed on 29 May 2018).
- American Psychiatric Association. Diagnostic and Statistical Manual of Mental Disorders; American Psychiatric Association: Philadelphia, PA, USA, 2013; ISBN 089042554X. [Google Scholar]
- World Health Organization. The ICD-10 Classification of Mental and Behavioural Disorders Clinical Descriptions and Diagnostic Guidelines; World Health Organization: Geneva, Switzerland, 1992. [Google Scholar]
- Smith, M.; Segal, J. “Bipolar Disorder Signs and Symptoms: Recognizing and Getting Help for Mania and Bipolar Depression”. Available online: https://www.helpguide.org/articles/bipolar-disorder/bipolar-disorder-signs-and-symptoms.htm (accessed on 18 December 2018).
- Kerr, M. Melancholic Depression: Symptoms, Treatment, Tests and More. Available online: https://www.healthline.com/health/depression/melancholic-depression#symptoms (accessed on 15 June 2018).
- Doryab, A.; Min, J.K.; Wiese, J.; Zimmerman, J.; Hong, J.I. Detection of Behavior Change in People with Depression. In AAAI Workshop: Modern Artificial Intelligence for Health Analytics. June 2014. Available online: https://www.aaai.org/ocs/index.php/WS/AAAIW14/paper/viewFile/8850/8303 (accessed on 29 May 2018).
- Helm, S.V.; Pollitt, A.; Barnett, M.A.; Curran, M.A.; Craig, Z.R. Differentiating environmental concern in the context of psychological adaption to climate change. Glob. Environ. Chang. 2018, 48, 158–167. [Google Scholar] [CrossRef]
- Chattopadhyay, S.; Rabhi, F.A.; Bhanjachaudhuri, S.; Jena, S.K. Mining important symptoms of adult depression. Int. J. Comput. Appl. 2012, 57. Available online: https://www.ijcaonline.org/archives/volume57/number5/9108-3258 (accessed on 29 May 2018).
- Climate SUWON-Climate Data (471190). Available online: https://en.tutiempo.net/climate/ws-471190.html (accessed on 29 May 2018).
- Airkorea. Available online: http://www.airkorea.or.kr/eng/index (accessed on 4 December 2018).
- Vyzas, E. Recognition of Emotional and Cognitive State Using Physiological Data; Massachusetts Institute of Technology: Cambridge, MA, USA, 1999. [Google Scholar]
- Ortony, A.; Clore, G.L.; Collins, A. The Cognitive Structure of Emotions; Cambridge University Press: Cambridge, UK, 1988; ISBN 0521386640. [Google Scholar]
- Wagner, J.; Kim, J.; Andre, E. From Physiological Signals to Emotions: Implementing and Comparing Selected Methods for Feature Extraction and Classification. In Proceedings of the 2005 IEEE International Conference on Multimedia and Expo, Amsterdam, The Netherlands, 6–8 July 2005; pp. 940–943. [Google Scholar]
- Picard, R.W.; Vyzas, E.; Healey, J. Toward machine emotional intelligence: Analysis of affective\nphysiological state. IEEE Trans. Pattern Anal. Mach. Intell. 2001, 23, 1175–1191. [Google Scholar] [CrossRef]
- Zong, S. A study on adolescent suicide ideation in South Korea. Procedia-Soc. Behav. Sci. 2015, 174, 1949–1956. [Google Scholar] [CrossRef]
- Park, H.Y.; Heo, J.; Subramanian, S.V.; Kawachi, I.; Oh, J. Socioeconomic Inequalities in Adolescent Depression in South Korea: A Multilevel Analysis. PLoS ONE 2012, 7, e47025. [Google Scholar] [CrossRef] [PubMed]
- Scherer, K.R. What are emotions? and how can they be measured? Soc. Sci. Inf. 2005, 44, 695–729. [Google Scholar] [CrossRef]
- Ali, S.; Kibria, M.G.; Jarwar, M.A.; Kumar, S.; Chong, I. Microservices Model in WoO based IoT Platform for Depressive Disorder Assistance. In Proceedings of the International Conference on Information and Communication Technology Convergence (ICTC 2017), Jeju Island, Korea, 18–20 October 2017. [Google Scholar]
- Jarwar, M.A.; Ali, S.; Chong, I.Y. Exploring Web Objects enabled Data-Driven Microservices for E-Health Service Provision in IoT Environment. In Proceedings of the 9th International Conference on Information and Communication Technology Convergence (ICTC 2018), Jeju Island, Korea, 17–19 October 2018; pp. 112–117. [Google Scholar] [CrossRef]
- Kumar, S.; Kibria, M.G.; Ali, S.; Jarwar, M.A.; Chong, I. Smart spaces recommending service provisioning in WoO platform. In Proceedings of the 2017 International Conference on Information and Communications (ICIC), Hanoi, Vietnam, 26–28 June 2017; pp. 311–313. [Google Scholar]
- Jarwar, M.; Kibria, M.; Ali, S.; Chong, I. Microservices in Web Objects Enabled IoT Environment for Enhancing Reusability. Sensors 2018, 18, 352. [Google Scholar] [CrossRef]
- Ali, S.; Kim, H.-S.; Chong, I. Implementation model of WoO based smart assisted living IoT service. In Proceedings of the 2016 International Conference on Information and Communication Technology Convergence (ICTC), Jeju Island, Korea, 19–21 October 2016; pp. 816–818. [Google Scholar]
- Ali, S.; Kibria, M.G.; Chong, I. WoO enabled IoT service provisioning based on learning user preferences and situation. In Proceedings of the 2017 International Conference on Information Networking (ICOIN), Da Nang, Vietnam, 11–13 January 2017; pp. 474–476. [Google Scholar]
- Hosseinifard, B.; Moradi, M.H.; Rostami, R. Classifying depression patients and normal subjects using machine learning techniques and nonlinear features from EEG signal. Comput. Methods Progr. Biomed. 2013, 109, 339–345. [Google Scholar] [CrossRef]
- Khodayari-Rostamabad, A.; Reilly, J.P.; Hasey, G.M.; de Bruin, H.; MacCrimmon, D.J. A machine learning approach using EEG data to predict response to SSRI treatment for major depressive disorder. Clin. Neurophysiol. 2013, 124, 1975–1985. [Google Scholar] [CrossRef]
- Knott, V.; Mahoney, C.; Kennedy, S.; Evans, K. EEG power, frequency, asymmetry and coherence in male depression. Psychiatry Res. Neuroimaging 2001, 106, 123–140. [Google Scholar] [CrossRef]
- Khowaja, S.A.; Prabono, A.G.; Setiawan, F.; Yahya, B.N.; Lee, S.-L. Contextual activity based Healthcare Internet of Things, Services, and People (HIoTSP): An architectural framework for healthcare monitoring using wearable sensors. Comput. Netw. 2018, 145, 190–206. [Google Scholar] [CrossRef]
- Breusch, T.S.; Pagan, A.R. A Simple Test for Heteroscedasticity and Random Coefficient Variation. Econometrica 1979, 47, 1287. [Google Scholar] [CrossRef]
- White, H. A Heteroskedasticity-Consistent Covariance Matrix Estimator and a Direct Test for Heteroskedasticity. Econometrica 1980, 48, 817. [Google Scholar] [CrossRef]


| Data Types | Dependent Variables | ||||
|---|---|---|---|---|---|
| Categorical | Quantitative | ||||
| Nominal | Ordinal | ||||
| Independent variables | Categorical | Nominal | Chi square test of Independence | Analysis of variance (ANOVA) | |
| Ordinal | Chi square test of Independence | Spearman’s Correlation | |||
| Quantitative | Lift, X2 test of Independence (Categorized Quantitative variable) | Pearson product moment correlation, Spearman’s Correlation | |||
| Symptom ID | Symptoms | Bipolar Disorder | Melancholia Disorder |
|---|---|---|---|
| dds.01 | Sadness/Worthless/Hopeless | (major) | (major) |
| dds.02 | Insomnia | (major) | (major) |
| dds.03 | Retardation | (major) | (major) |
| dss.05 | Elevated feelings and energy for activity | (major) | |
| dds.16 | Isolation | (minor) | |
| dds.12 | Loss of Interest | (minor) | (major) |
| dds.22 | Fatigue | (major) | (major) |
| dds.10 | Anxiety | (minor) | |
| dds.08 | Suicide | (major) | |
| dds.11 | Weight Loss/Gain | (minor) | (major) |
| dds.07 | Irritation | (major) | (minor) |
| Question ID | Question | Response and Score | ||
|---|---|---|---|---|
| dds.01.q1 | Do you consider objects and situations as unimportant as you think you are (e.g., homework, grooming, waking up in the morning etc.)? | Yes, always | Yes, sometimes | No, never |
| 30 | 15 | 0 | ||
| dds.01.q2 | Do you feel that you have no value? | Yes, always | Yes, sometimes | No, never |
| 30 | 15 | 0 | ||
| dds.01.q3 | Do you usually walk with you head down? | Yes, always | Yes, sometimes | No, never |
| 5 | 2.5 | 0 | ||
| dds.01.q4 | Do you often have negative statements? | Yes, always | Yes, sometimes | No, never |
| 5 | 2.5 | 0 | ||
| dds.01.q5 | Do you often use gestures that are dramatic and out of context? | Yes, always | Yes, sometimes | No, never |
| 5 | 2.5 | 0 | ||
| dds.01.q6 | Do you feel loss of interest in doing activities? | Yes, always | Yes, sometimes | No, never |
| 5 | 2.5 | 0 | ||
| dds.01.q7 | Do you often perceive your skill set as inadequate for the task at hand? | Yes, always | Yes, sometimes | No, never |
| 5 | 2.5 | 0 | ||
| dds.01.q8 | Do you mostly have negative anticipation about your future? | Yes, always | Yes, sometimes | No, never |
| 5 | 2.5 | 0 | ||
| dds.01.q9 | Do you feel losing affection in things? | Yes, always | Yes, sometimes | No, never |
| 5 | 2.5 | 0 | ||
| dds.01.q10 | Have you ever mentioned some of the following or similar statements:
| Yes, always | Yes, sometimes | No, never |
| 5 | 2.5 | 0 | ||
| Attribute | Type | Unit | Min Value | Max Value | Mean | Std. Dev |
|---|---|---|---|---|---|---|
| Season | Nominal | - | - | - | - | - |
| Temperature | Numeric | C | −8.2 | 31.6 | 12.748 | 10.551 |
| Atmospheric Pressure | Numeric | hPa | 998.1 | 1034.1 | 1016.88 | 8.083 |
| Humidity | Numeric | % | 32 | 99 | 64.621 | 15.665 |
| Visibility | Numeric | km | 1.8 | 20 | 12.82 | 5.071 |
| Wind Speed | Numeric | km/h | 1.9 | 15.2 | 6.481 | 2.488 |
| Rain | Nominal | - | - | - | - | - |
| Snow | Nominal | - | - | - | - | - |
| Storm | Nominal | - | - | - | - | - |
| Fog | Nominal | - | - | - | - | - |
| Ozone | Numeric | ppm | 0.006 | 0.044 | 0.027 | 0.012 |
| Carbon Monoxide | Numeric | ppm | 0.48 | 0.82 | 0.64 | 0.098 |
| Nitrogen dioxide | Numeric | ppm | 0.02 | 0.043 | 0.033 | 0.007 |
| Depression Severity | Nominal | - | - | - | - | - |
| Emotion Class | Source to Trigger | Description | Arousal and Valence Scale |
|---|---|---|---|
| No Emotion | Blank | Boredom | Low arousal and neutral valence |
| Anger | Images of people arousing anger | Feeling of fighting | Very high arousal and very negative valence |
| Hate | Image of injustice and cruelty | Anger of lesser severity | Low arousal and negative valence |
| Grief | Image of deformed child or thought of loss of mother | Sadness | High arousal and negative valence |
| Platonic Love | Images of family summer | Happiness and peace | Low arousal and positive valence |
| Romantic Love | Erotic imagery | Lust and feeling for romance | Very high arousal and positive valence |
| Joy | Song of joy | Stronger feelings of happiness | Medium high arousal and positive valence |
| Reverence | Images for holly places and reciting prayers | Calm and peaceful feelings | Very low arousal and neutral valence |
| Feature Label | Description |
|---|---|
| f1 | Windowed means of the raw signals. |
| f2 | Standard deviations of the raw signals, based on windowed means. |
| f3 | Windowed means of absolute values of the first forward differences of the raw signals. |
| f4 | Windowed means of absolute values of the first forward differences of the normalized signals. |
| f5 | Windowed means of absolute values of the second forward differences of the raw signals. |
| f6 | Windowed means of absolute values of the second forward differences of the normalized signals. |
| Attribute | Type | Min Value | Max Value | Mean | Std. Dev |
|---|---|---|---|---|---|
| EMG-f1 | Numeric | 1.24 | 329.11 | 3.644 | 6.438 |
| EMG-f2 | Numeric | 0 | 192.05 | 1.147 | 5.582 |
| EMG-f3 | Numeric | 0 | 50.115 | 0.017 | 0.196 |
| EMG-f4 | Numeric | 0 | 7.29 | 0.003 | 0.022 |
| EMG-f5 | Numeric | 0 | 50.594 | 0.014 | 0.188 |
| EMG-f6 | Numeric | 0 | 7.29 | 0.003 | 0.021 |
| BVP-f1 | Numeric | 20.717 | 58.378 | 33.545 | 0.82 |
| BVP-f2 | Numeric | 1.002 | 48.439 | 9.023 | 4.736 |
| BVP-f3 | Numeric | 0 | 36.351 | 0.085 | 0.47 |
| BVP-f4 | Numeric | 0 | 0.493 | 0.008 | 0.022 |
| BVP-f5 | Numeric | 0 | 37.159 | 0.076 | 0.614 |
| BVP-f6 | Numeric | 0 | 0.417 | 0.007 | 0.018 |
| GSR-f1 | Numeric | 1.41 | 12.996 | 4.905 | 2.318 |
| GSR-f2 | Numeric | 0 | 0.973 | 0.025 | 0.051 |
| GSR-f3 | Numeric | 0 | 12.108 | 0.002 | 0.071 |
| GSR-f4 | Numeric | 0 | 3.358 | 0.001 | 0.013 |
| GSR-f5 | Numeric | 0 | 12.113 | 0.002 | 0.1 |
| GSR-f6 | Numeric | 0 | 3.362 | 0 | 0.018 |
| Respiration-f1 | Numeric | 37.853 | 64.598 | 56.82 | 6.802 |
| Respiration-f2 | Numeric | 0 | 3.252 | 0.297 | 0.319 |
| Respiration-f3 | Numeric | 0 | 63.365 | 0.016 | 0.707 |
| Respiration-f4 | Numeric | 0 | 3.306 | 0.009 | 0.023 |
| Respiration-f5 | Numeric | 0 | 63.365 | 0.018 | 0.999 |
| Respiration-f6 | Numeric | 0 | 3.33 | 0.001 | 0.016 |
| Emotion | Nominal | - | - | - | - |
| Rank | Bipolar-Disorder | Merit | Melancholia-Disorder | Merit |
|---|---|---|---|---|
| 1 | Temperature | 0.526 | Season | 243.18 |
| 2 | Atmospheric Pressure | 0.421 | Ozone | 182.8 |
| 3 | Season | 0.38 | Carbon-monoxide | 155.3 |
| 4 | Ozone | 0.31 | Temperature | 102.6 |
| 5 | Nitrogen-dioxide | 0.29 | Nitrogen-dioxide | 94.4 |
| 6 | Carbon-monoxide | 0.264 | Atmospheric Pressure | 33.6 |
| 7 | Snow | 0.204 | Fog | 15.2 |
| 8 | Humidity | 0.179 | Snow | 10.2 |
| 9 | Fog | 0.13 | Storm | 6.5 |
| 10 | Rain | 0.125 | Humidity | 2.43 |
| 11 | Visibility | 0.122 | Visibility | 1.7 |
| 12 | Storm | 0.105 | Wind speed | 0.008 |
| 13 | Wind speed | 0.07 | Rain | 0.003 |
| Physiological Sensor | Emotion | p-Value |
|---|---|---|
| EMG | −0.085599801 | <0.001 |
| BVP | −0.001507079 | 0.39 |
| GSR | −0.073850046 | <0.001 |
| RESP | −0.023263153 | <0.001 |
| Feature | EMG-f1 | EMG-f3 | EMG-f5 | BVP-f3 | BVP-f5 | GSR-f3 | GSR-f4 | GSR-f5 | Resp-f3 |
|---|---|---|---|---|---|---|---|---|---|
| EMG-f1 | 1 | ||||||||
| EMG-f2 | 0.9095 | ||||||||
| EMG-f4 | 0.0200 | 0.6472 | |||||||
| EMG-f6 | −0.0219 | 0.2994 | 0.6227 | ||||||
| BVP-f5 | 4.09 × 10⁻⁵ | 0.16253 | 0.336666 | 0.647586 | 1 | ||||
| GSR-f3 | 0.0037 | 0.2420 | 0.2529 | 0.7875 | 0.6084 | 1 | |||
| GSR-f5 | 0.0001 | 0.1733 | 0.3592 | 0.5576 | 0.8610 | 0.7066 | 0.3286 | 1 | |
| GSR-f6 | 0.0002 | 0.0867 | 0.1793 | 0.1491 | 0.2309 | 0.333 | 0.6973 | 0.4712 | |
| Resp-f3 | 0.0006 | 0.2431 | 0.25349 | 0.86176 | 0.66583 | 0.90413 | 0.23156 | 0.64011 | 1 |
| Resp-f5 | 6.76 × 10⁻⁵ | 0.17323 | 0.35939 | 0.609938 | 0.941885 | 0.639795 | 0.163974 | 0.905452 | 0.706954 |
| Rank | Feature | Weight for Ranking | Rank | Feature | Weight for Ranking |
|---|---|---|---|---|---|
| 1 | BVP-f2 | 0.12407258 | 13 | BVP-f3 | 5.1806 × 10⁻⁴ |
| 2 | GSR-f1 | 0.09261232 | 14 | Resp-f5 | 6.639 × 10⁻⁵ |
| 3 | EMG-f1 | 0.07958459 | 15 | BVP-f5 | 5.092 × 10⁻⁵ |
| 4 | GSR-f2 | 0.0676282 | 16 | GSR-f5 | 3.489 × 10⁻⁵ |
| 5 | EMG-f2 | 0.0629491 | 17 | Resp-f3 | 3.022 × 10⁻⁵ |
| 6 | Resp-f2 | 0.05206328 | 18 | Resp-f6 | 2.369 × 10⁻⁵ |
| 7 | Resp-f1 | 8.8696 × 10⁻³ | 19 | EMG-f3 | 2.314 × 10⁻⁵ |
| Number of Predictors | Logit Boost (%) | SVM (%) | Random Forest (%) | Logistic Regression (%) |
|---|---|---|---|---|
| 13 | 85.16 | 80.77 | 87.36 | 79.12 |
| 12 | 85.16 | 80.77 | 87.91 | 80.22 |
| 11 | 86.26 | 81.32 | 88.46 | 83.52 |
| 10 | 86.26 | 82.42 | 89.01 | 84.07 |
| 9 | 86.26 | 81.32 | 88.46 | 85.16 |
| 8 | 85.71 | 84.07 | 89.01 | 84.62 |
| 7 | 85.71 | 84.62 | 87.91 | 84.07 |
| 6 | 84.62 | 84.62 | 87.91 | 81.87 |
| 5 | 85.71 | 84.62 | 85.16 | 84.07 |
| 4 | 82.42 | 84.62 | 84.07 | 81.87 |
| 3 | 74.18 | 72.53 | 67.58 | 72.53 |
© 2018 by the authors. Licensee MDPI, Basel, Switzerland. This article is an open access article distributed under the terms and conditions of the Creative Commons Attribution (CC BY) license (http://creativecommons.org/licenses/by/4.0/).
Share and Cite
Kumar, S.; Chong, I. Correlation Analysis to Identify the Effective Data in Machine Learning: Prediction of Depressive Disorder and Emotion States. Int. J. Environ. Res. Public Health 2018, 15, 2907. https://doi.org/10.3390/ijerph15122907
Kumar S, Chong I. Correlation Analysis to Identify the Effective Data in Machine Learning: Prediction of Depressive Disorder and Emotion States. International Journal of Environmental Research and Public Health. 2018; 15(12):2907. https://doi.org/10.3390/ijerph15122907
Chicago/Turabian StyleKumar, Sunil, and Ilyoung Chong. 2018. "Correlation Analysis to Identify the Effective Data in Machine Learning: Prediction of Depressive Disorder and Emotion States" International Journal of Environmental Research and Public Health 15, no. 12: 2907. https://doi.org/10.3390/ijerph15122907
APA StyleKumar, S., & Chong, I. (2018). Correlation Analysis to Identify the Effective Data in Machine Learning: Prediction of Depressive Disorder and Emotion States. International Journal of Environmental Research and Public Health, 15(12), 2907. https://doi.org/10.3390/ijerph15122907