Health Risk in Urbanizing Regions: Examining the Nexus of Infrastructure, Hygiene and Health in Tashkent Province, Uzbekistan


Abstract
1. Introduction
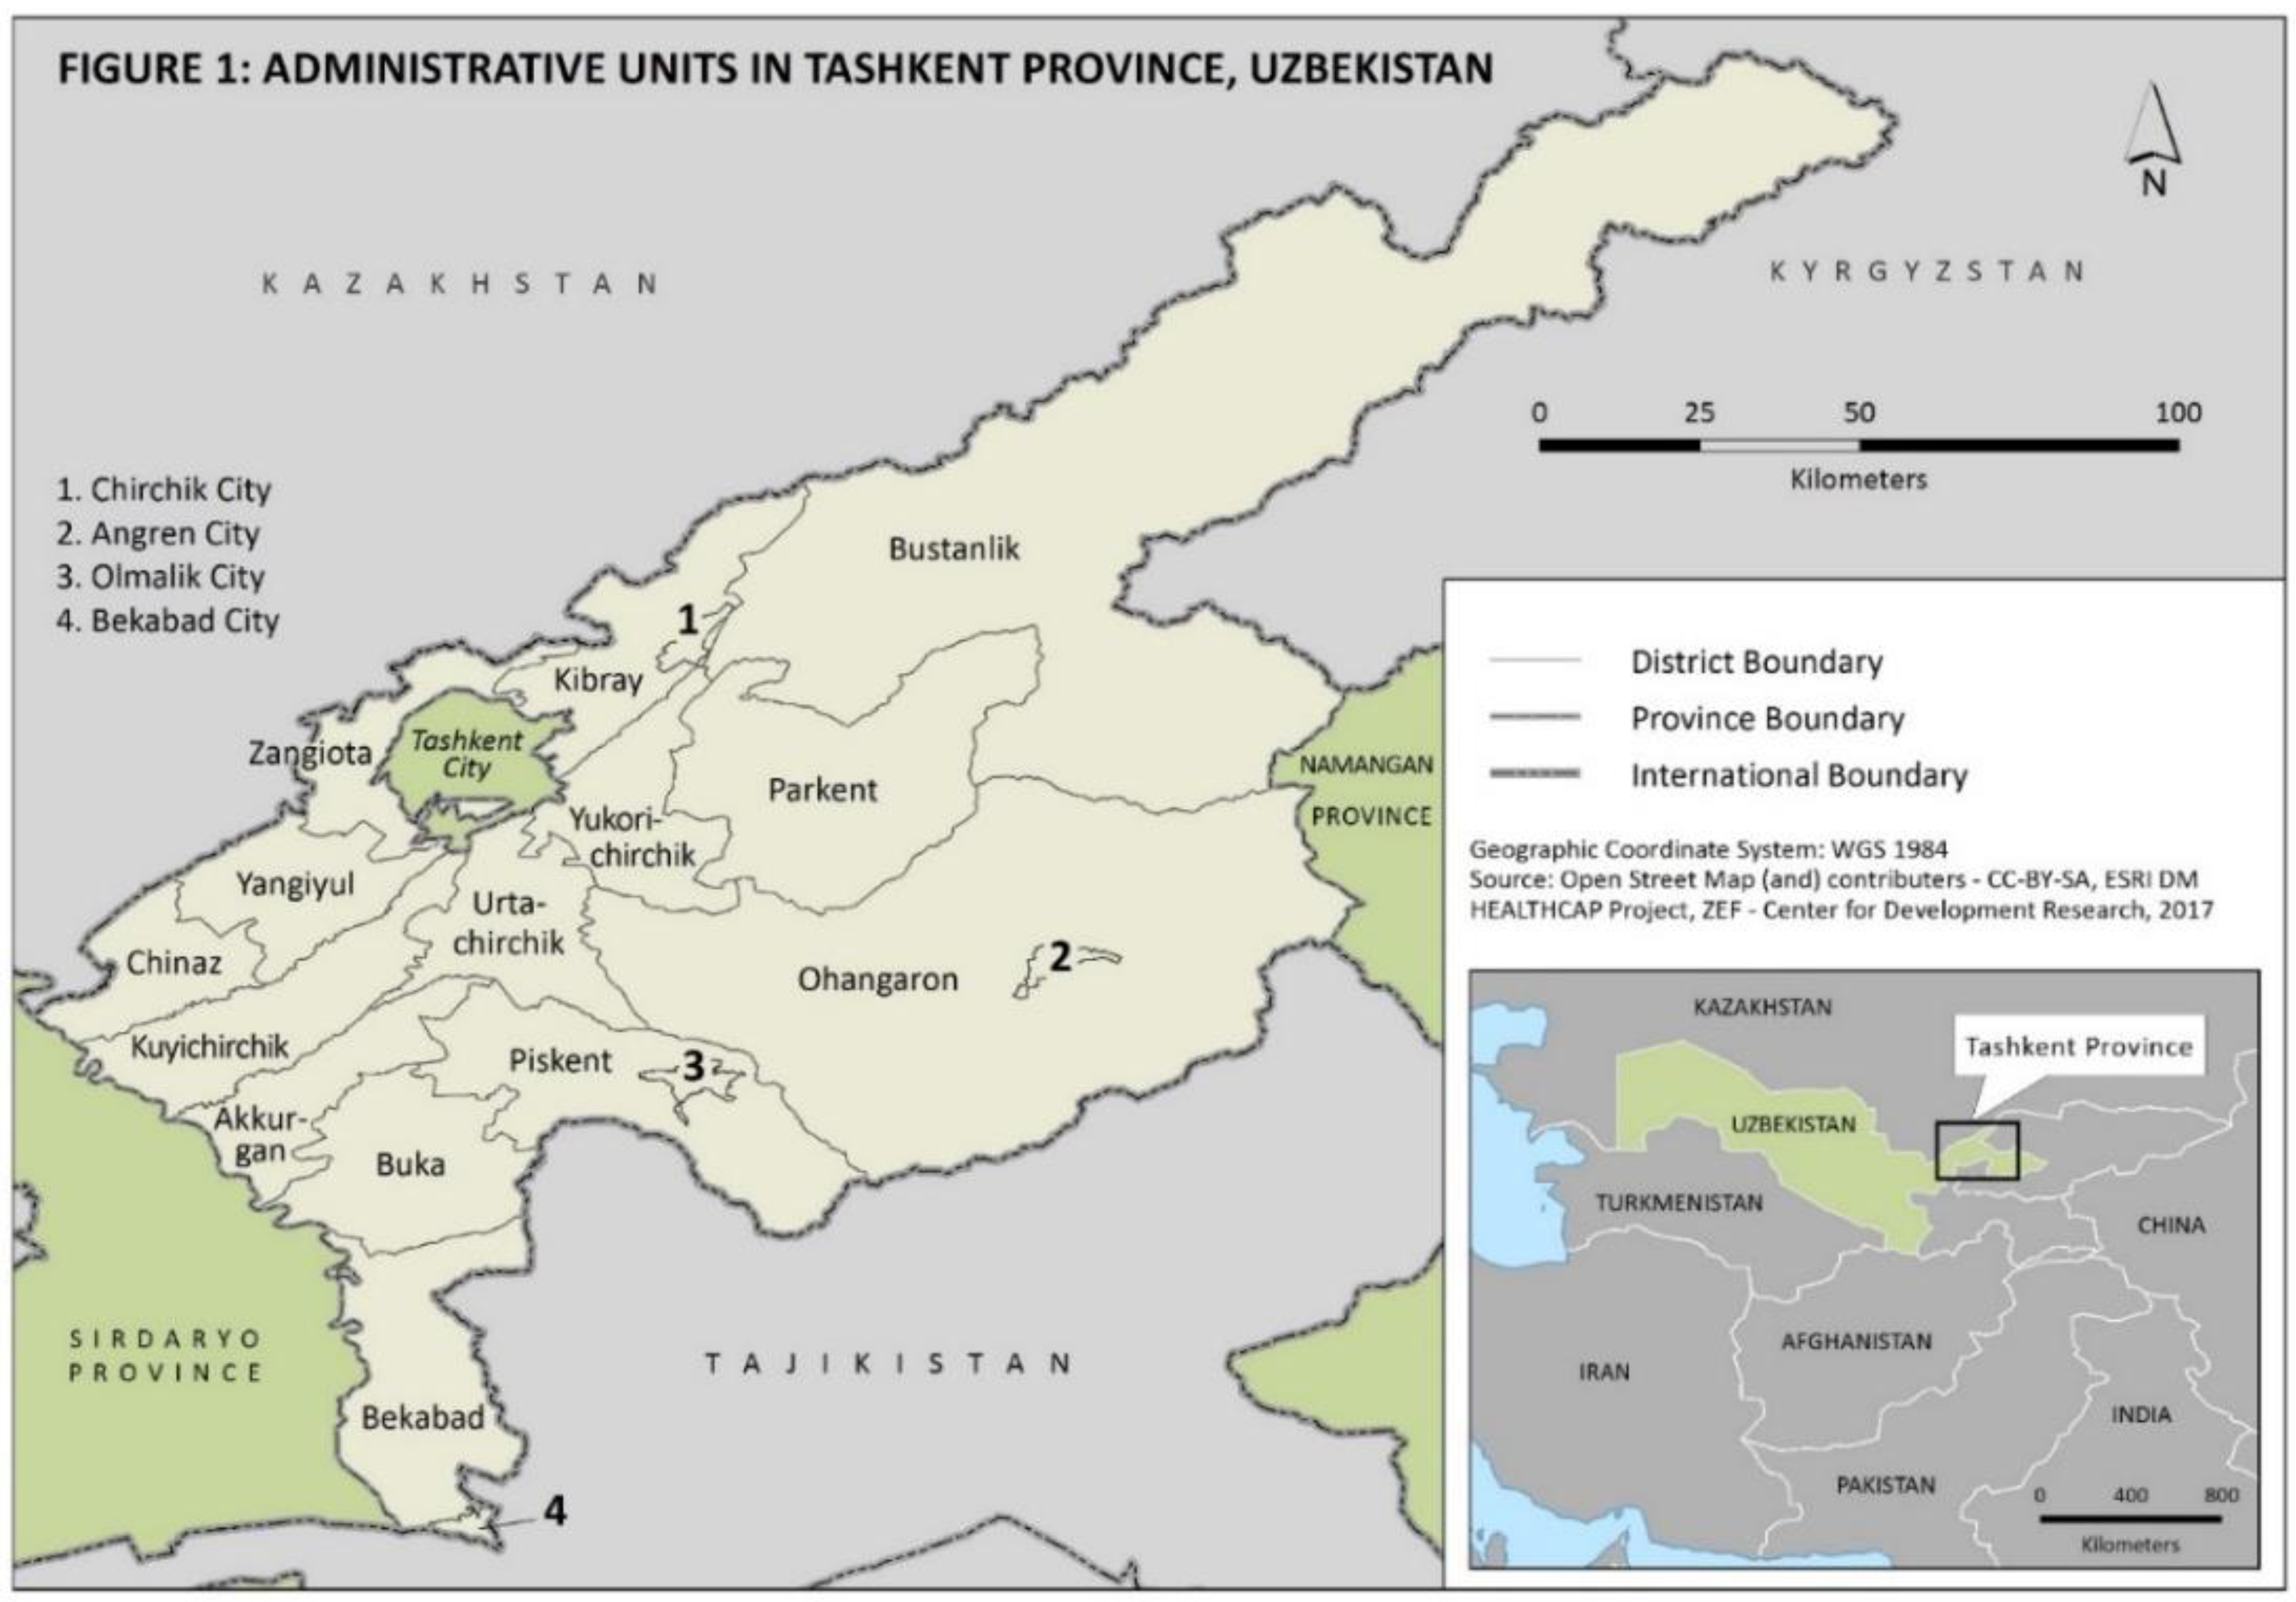
2. Study Background
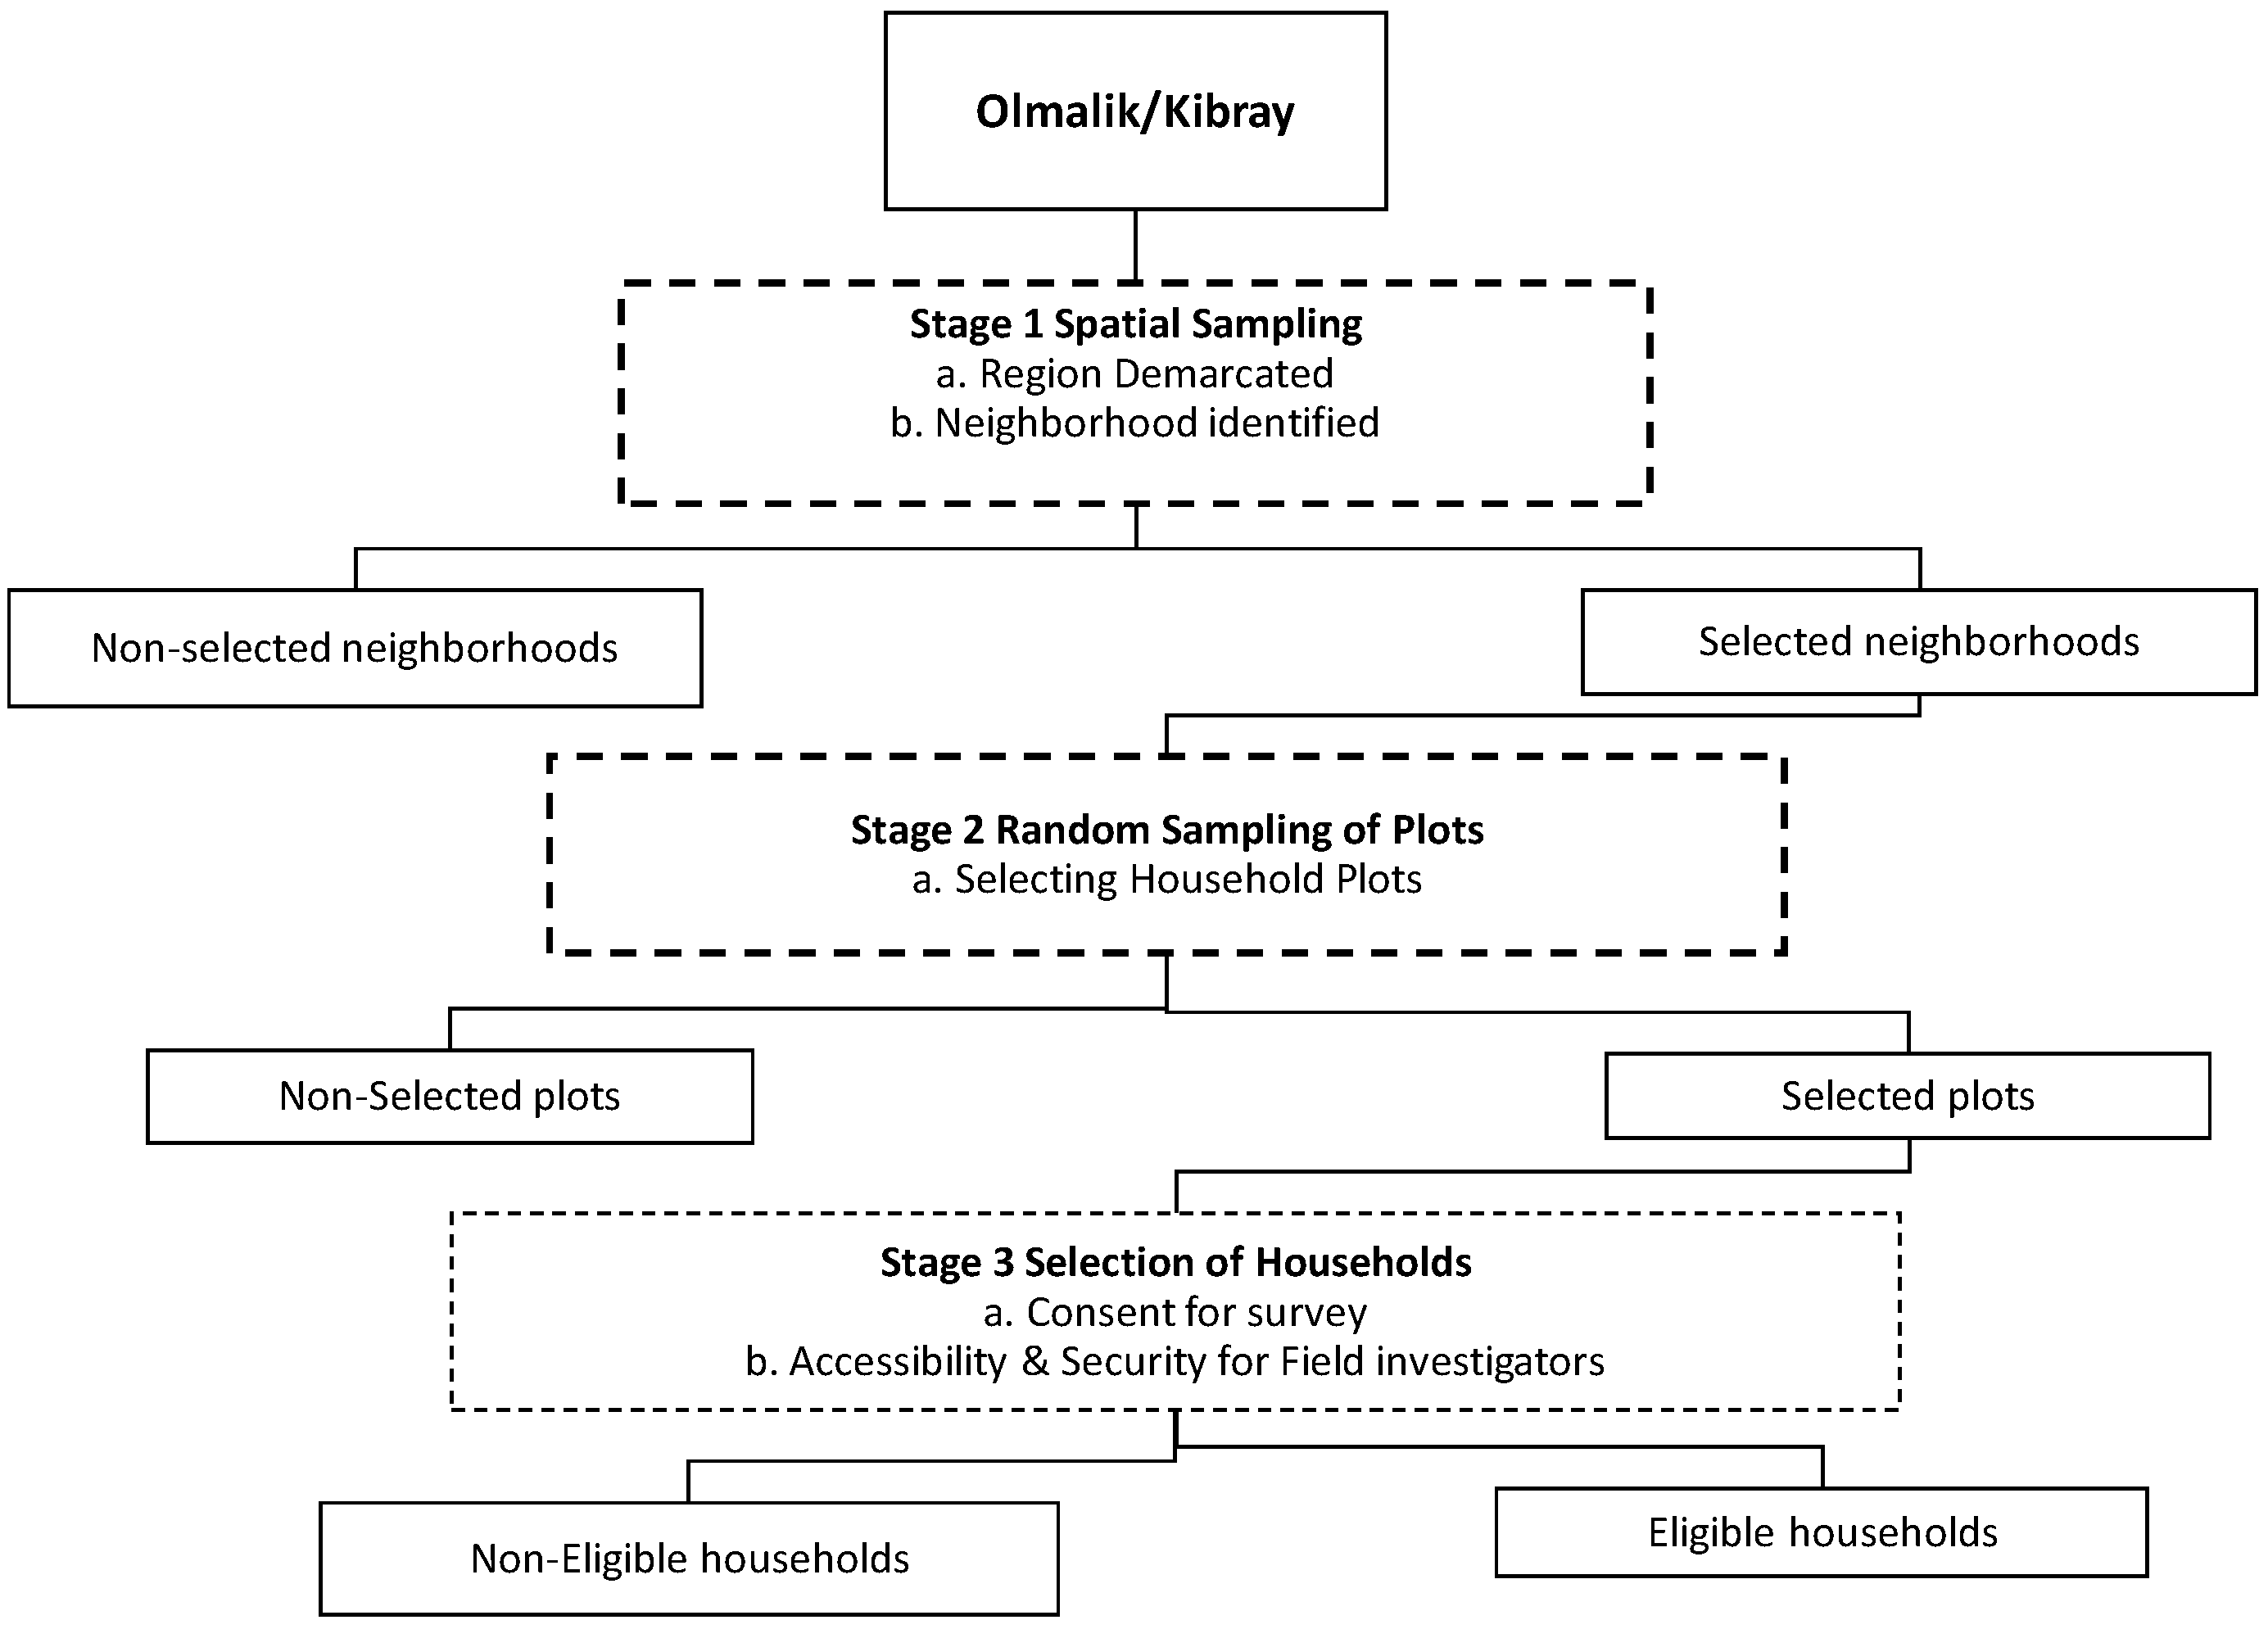
3. Methods
4. Results
4.1. Demographic and Socio-Economic Characteristics of Households
4.2. Socio-Economic Characteristics of Households
4.3. Housing Characteristics
4.4. Hygiene Indicators
4.5. Water Transmitted Disease (WTD) Burden
4.6. Determinants of WTD Burden
5. Discussion
6. Conclusions
Author Contributions
Funding
Acknowledgments
Conflicts of Interest
Appendix A

| Indicators | 2011 | 20012 | 2013 | 2014 | 2015 |
|---|---|---|---|---|---|
| pH | 6.47 | 6.92 | 6.74 | 6.12 | 6.43 |
| Suspended substances, mg/L | 475.9 | 488.8 | 492.2 | 527.7 | 512.9 |
| Chlorides, mg/L | 265.5 | 294.4 | 276.7 | 292.2 | 266.7 |
| Sulphates, mg/L | 624.4 | 697.7 | 677.9 | 687.8 | 692.7 |
| Dry residue, mg/L | 2674 | 2927 | 2889 | 2764 | 2991 |
| Ammonia, mg/L | 122.8 | 102.0 | 104.9 | 74.2 | 83.9 |
| Nitrite, mg/L | 131.3 | 135.1 | 133.9 | 127.7 | 90.7 |
| Nitrates. mg/L | 1951 | 1950 | 1883 | 1903 | 1973 |
| BOD5, mg02/L | 88.7 | 93.3 | 77.4 | 76.3 | 66.0 |
| COD, mg02/L | 552.2 | 511.9 | 485.0 | 455 | 429.2 |
| Petroleum products | 17.9 | 14.2 | 12.3 | 13.4 | 13.6 |
| Cyclohexane | 3.67 | 3.74 | 3.92 | 3.12 | 3.06 |
References
- Suhrcke, M.; Rocco, L.; Mckee, M. Health: A Vital Investment for Economic Development in Eastern Europe and Central Asia; World Health Organization: Copenhagen, Denmark, 2007; p. 280. Available online: http://www.euro.who.int/observatory/Publications/20070618_1 (accessed on 12 August 2011).
- Bekturganov, Z.; Tussupova, K.; Berndtsson, R.; Sharapatova, N.; Aryngazin, K.; Zhanasova, M. Water related health problems in central Asia—A review. Water 2016, 8, 219. [Google Scholar] [CrossRef]
- Ashbolt, N.J. Microbial contamination of drinking water and disease outcomes in developing regions. Toxicology 2004, 198, 229–238. [Google Scholar] [CrossRef] [PubMed]
- AZERNEWS. WB, Uzbekistan Discuss Reforms in Water Sector. Available online: https://www.azernews.az/region/121881.html (accessed on 28 March 2018).
- Saravanan, V.S.; Gondhalekar, D. Water supply and sanitation as a ‘preventive medicine’: Challenges in rapidly growing economies. Water Int. 2013, 38, 867–874. [Google Scholar] [CrossRef]
- Ananga, E.O.; Njoh, A.J.; Pappas, C.; Ananga, G.O. Examining the relationship between community participation and water handling hygiene practices in the informal neighborhoods of Kisumu, Kenya. Habitat Int. 2017, 62, 1–10. [Google Scholar] [CrossRef]
- WHO. Public Health Risk Assessment and Interventions: Kyrgyzstan and Uzbekistan; WHO: Geneva, Switzerland, 2010. [Google Scholar]
- WHO/UNICEF. Joint Monitoring Program for Water Supply and Sanitation—Estimates on the Use of Water Sources and Sanitation Facilities; World Health Organization/UNICEF: New York, NY, USA, 2015. [Google Scholar]
- Semenza, J.C.; Roberts, L.; Henderson, A.; Bogan, J.; Rubin, C.H. Water distribution system and diarrheal disease transmission: A case study in Uzbekistan. Am. J. Trop. Med. Hyg. 1998, 59, 941–946. [Google Scholar] [CrossRef] [PubMed]
- Gungoren, B.; Latipov, R.; Regallet, G.; Musabaev, E. Effect of hygiene promotion on the risk of reinfection rate of intestinal parasites in children in rural Uzbekistan. Trans. R. Soc. Trop. Med. Hyg. 2007, 101, 564–569. [Google Scholar] [CrossRef] [PubMed]
- Sharapov, M.B.; Favorov, M.O.; Yashina, T.L.; Brown, M.S.; Onischenko, G.G.; Margolis, H.S.; Chorba, T.L. Acute viral hepatitis morbidity and mortality associated with hepatitis E virus infection: Uzbekistan surveillance data. BMC Infect. Dis. 2009, 9, 1–9. [Google Scholar] [CrossRef] [PubMed]
- Herbst, S.; Fayzieva, D.; Kistemann, T. Risk factor analysis of diarrhoeal diseases in the Aral Sea area (Khorezm, Uzbekistan). Int. J. Environ. Health Res. 2008, 18, 305–321. [Google Scholar] [CrossRef] [PubMed]
- Mirshina, O. Water and hygiene in Uzbekistan: An overview. In Global Environmental Change and Water-related Diseases: Improving Risk Assessment Strategies for Public Health Care in Uzbekistan; UNDP: Tashkent, Uzbekistan, 2011. [Google Scholar]
- UNDP. Water: Crtical Resource for Uzbekistan’s Future; UNDP: Tashkent, Uzbekistan, 2007. [Google Scholar]
- Charyev, R.; Ismailova, A.; Mirzaev, G. Pollution of surface water of the Tashkent region of the Uzbekistan Republic. Вестник Оренбургскoгo Гoсударственнoгo Университета (Bull. Orenburg State Univ.) 2017, 12, 212. [Google Scholar]
- Saravanan, V.S.; Cho, M.J.; Tan, S.Z.; Fayzieva, D.; Sebaly, C. Spatial Distribution and Trends of Waterborne Diseases in Tashkent Province. Cent. Asian J. Glob. Health 2017, 6. [Google Scholar] [CrossRef]
- Kirby, A. Uzbeks Promise Smelter Clean-Up. One-Minute World News. 3 January 2005. Available online: http://news.bbc.co.uk/2/hi/science/nature/4117897.stm (accessed on 20 April 2018).
- Kist, A.A.; Danilova, E.A.; Khusniddninova, S.K.; Mukhina, A. Activation determination of the form of chlorine in water. Atom. Energy 2011, 109, 428–430. [Google Scholar] [CrossRef]
- Nasedjanov, M.; Watanabe, H.; Watanabe, I.; Kawabata, Y. Water Quality Monitoring of the Chirchik River Basin, Uzbekistan. J. Arid Land Stud. 2012, 22, 195–198. [Google Scholar]
- ADB. $120 Million ADB Loan to Improve Water Supply in Tashkent Province. 2016. Available online: https://www.adb.org/news/120-million-adb-loan-improve-water-supply-tashkent-province (accessed on 5 April 2017).
- Kondo, M.C.; Bream, K.D.; Barg, F.K.; Branas, C.C. A random spatial sampling method in a rural developing nation. BMC Public Health 2014, 14, 1–8. [Google Scholar] [CrossRef] [PubMed]
- Ulikpan, A.; Mirzoev, T.; Jimenez, E.; Malik, A.; Hill, P.S. Central Asian Post-Soviet health systems in transition: Has different aid engagement produced different outcomes? Glob. Health Action 2014, 7. [Google Scholar] [CrossRef] [PubMed]
- Levy, P.; Lemeshow, S. Sampling of Populations, Methods and Applications; Wiley-Interscience Publication: New York, NY, USA, 1999. [Google Scholar]
- Bostoen, K.; Bilukha, O.O.; Fenn, B.; Morgan, O.W.; Tam, C.C.; Ter Veen, A.; Checchi, F. Methods for health surveys in difficult settings: Charting progress, moving forward. Emerg. Themes Epidemiol. 2007, 4, 1–4. [Google Scholar] [CrossRef]
- Rajput, Z.A.; Mbugua, S.; Amadi, D.; Chepnǵeno, V.; Saleem, J.J.; Anokwa, Y.; Hartung, C.; Borriello, G.; Mamlin, B.W.; Ndege, S.K.; et al. Evaluation of an Android-based mHealth system for population surveillance in developing countries. J. Am. Med. Inform. Assoc. 2012, 19, 655–659. [Google Scholar] [CrossRef] [PubMed]
- Hartung, C.; Anokwa, Y.B.; Brunette, W.; Lerer, A.; Tseng, C.; Boriello, G. Open Data Kit: Tools to build information services for developing regions. Presented at the Information and Communication Technologies and Development (ICTD) 2010 Conference, London, UK, 13–15 December 2010; Available online: http://www.cs.washington.edu/homes/yanokwa/publications/2010_ICTD_OpenDataKit_Paper.pdf (accessed on 23 June 2015).
- King, C.; Hall, J.; Banda, M.; Beard, J.; Bird, J.; Kazembe, P.; Fottrell, E. Electronic data capture in a rural African setting: Evaluating experiences with different systems in Malawi. Glob. Health Action 2014, 7, 1. [Google Scholar] [CrossRef] [PubMed]
- McLean, E.; Dube, A.; Saul, J.; Branson, K.; Luhanga, M.; Mwiba, O.; Kalobekamo, F.; Geis, S.; Crampin, A.C. Implementing electronic data capture at a well-established health and demographic surveillance site in rural Northern Malawi. Glob. Health Action 2017, 10, 1. [Google Scholar] [CrossRef] [PubMed]
- Style, S.; Beard, B.J.; Harris-Fry, H.; Sengupta, A.; Jha, S.; Shrestha, B.P.; Rai, A.; Paudel, V.; Thondoo, M.; Pulkki-Brannstrom, A.; et al. Experiences in running a complex electronic data capture system using mobile phones in a large-scale population trial in southern Nepal. Glob. Health Action 2017, 10, 1. [Google Scholar] [CrossRef] [PubMed]
- Kassié, D.; Roudot, A.; Dessay, N.; Piermay, J.; Salem, G.; Fournet, F. Development of a spatial sampling protocol using GIS to measure health disparities in Bobo-Dioulasso, Burkina Faso, a medium-sized African city. Int. J. Health Geogr. 2017, 16. [Google Scholar] [CrossRef] [PubMed]
- McCullagh, P.; Nelder, J.A. Generalized Linear Models, 2nd ed.; Chapman & Hall: London, UK, 1989. [Google Scholar]
- Hosmer, D.W.; Lemeshow, S.; Sturdivant, R.X. Applied Logistic Regression, 3rd ed.; Wiley: New York, NY, USA, 2013. [Google Scholar]
- Danjuma, J.; Emmanuel, I. Statistical Modelling of Diarrhea Prevalence among Infants in Adamawa State, Nigeria. Am. J. Math. Stat. 2017, 7, 27–31. [Google Scholar]
- Bataineh, A.L.; Oswald, B.P.; Bataineh, M.; Unger, D.; Hung, I.; Scognamillo, D. Spatial autocorrelation and pseudoreplication in fire ecology. Fire Ecol. 2006, 2, 107–118. [Google Scholar] [CrossRef]
- Dormann, C.F.; McPherson, J.M.; Araüjo, M.B.; Bivand, R.; Bollger, J.; Carl, G.; Davies, R.G.; Hirzel, A.; Jetz, W.; Kissling, W.D.; et al. Methods to account for spatial autocorrelation in the analysis of species distributional data: A review. Ecography 2007, 30, 609–628. [Google Scholar] [CrossRef]
- Salimova, H.K. Housing Options in Tashkent: Journeys of Young People in Establishing Their Households in Independent Uzbekistan; Ball State University: Muncie, Indiana, 2010; Available online: https://cardinalscholar.bsu.edu/bitstream/handle/123456789/194655/SalimovaH_2010-1_BODY.pdf?sequence = 1 (accessed on 25 May 2018).
- Issa, M.; McHenry, M.; Issa, A.A.; Blackwood, R.A. Access to safe and personal hygiene practices in the Kulandia Refugee camp (Jerusalem). Infect. Dis. Rep. 2015, 7. [Google Scholar] [CrossRef] [PubMed]
- Prüss-Ustün, A.; Wolf, J.; Corvalán, C.; Bos, M.; Neira, M. Mpreventing Disease through Healthy Environments: A Global Assessment of the Burden of Disease from Environmental Risks; World Health Organization: Geneva, Switzerland, 2016; Available online: http://www.who.int/quantifying_ehimpacts/publications/preventing-disease/en/ (accessed on 25 November 2017).
- Wolf, J.; Prüss-Ustün, A.; Cumming, O.; Bartram, J.; Bonjour, S.; Cairncross, S.; Higgins, J.P.T. Systematic review: Assessing the impact of drinking water and sanitation on diarrhoeal disease in low- and middle-income settings: Systematic review and meta-regression. Trop. Med. Int. Health 2014, 19, 928–942. [Google Scholar] [CrossRef] [PubMed]
- Prüss-Ustün, A.; Wolf, J.; Corvalán, C.; Neville, T.; Bos, R.; Neira, M. Diseases due to unhealthy environments: An updated estimate of the global burden of disease attributable to environmental determinants of health. J. Public Health 2016, 39, 464–475. [Google Scholar] [CrossRef] [PubMed]
- Mitra, R.; Buliung, R.N. The influence of neighborhood environment and household level interactions on school travel behaviour: An exploratino using geographically-weighted modesl. J. Transp. Geogr. 2014, 36, 69–78. [Google Scholar] [CrossRef]
- Wheeler, D.; Calder, C. An assessment of coefficient accuracy in linear regression models with spatially varying coefficients. J. Geogr. Syst. 2007, 9, 145–166. [Google Scholar] [CrossRef]
- Wheeler, D.; Tiefelsdorf, M. Multicollinearity and correlation among local regression coefficients in geographically weighted regression. J. Geogr. Syst. 2007, 7, 161–187. [Google Scholar] [CrossRef]
- Wheeler, D.; Waller, L. Comparing spatially varying coefficient models: A case study examining violent crime rates and their relationships to alcohol outlets and illegal drug arrests. J. Geogr. Syst. 2009, 11, 1–22. [Google Scholar] [CrossRef]
- Chaves, L.F. An entomologist guide to demystify pseudoreplication: Data analysis of field studies with design constraints. J. Med. Entomol. 2010, 47, 291–298. [Google Scholar] [CrossRef] [PubMed]
- Ferriman, A. BMJ readers choose the “sanitary revolution” as greatest medical advance since 1840. Br. Med. J. 2007, 334, 111. [Google Scholar] [CrossRef]
- Ercumen, A.; Gruber, J.S.; Colford, J.M. Water distribution system deficiencies and gastrointestinal illness: A systematic review and meta-analysis. Environ. Health Perspect. 2014, 122, 651–660. [Google Scholar] [CrossRef] [PubMed]
- Singer, M.; Bulled, N.; Ostrach, B.; Mendenhall, E. Syndemics and the biosocial conception of health. Lancet 2017, 389, 941–950. [Google Scholar] [CrossRef]


| Olmalik (n = 207) | Kibray (n = 200) | |||||||
|---|---|---|---|---|---|---|---|---|
| Variable | Mean | Std. Dev | Min | Max | Mean | Std. Dev | Min | Max |
| Household members (size) | 3.35 | 1.62 | 1 | 9 | 5.04 | 2.24 | 1 | 13 |
| Average rooms per household | 3.65 | 0.97 | 2 | 7 | 6.55 | 2.60 | 1 | 15 |
| Number of rooms available for sleeping | 1.91 | 0.76 | 1 | 5 | 3.92 | 2.36 | 1 | 14 |
| Amenities in the house (Sum of amenities score) | 3.96 | 1.38 | 1 | 6 | 3.62 | 0.98 | 1 | 6 |
| Number of persons using a toilet | 3.20 | 1.50 | 1 | 9 | 4.55 | 2.11 | 0.33 | 13 |
| Olmalik (n = 207) | Kibray (n = 200) | ||
|---|---|---|---|
| Variable definition | Categories | % distribution | % distribution |
| Socio-economic | |||
| Household head gender | 0 = female | 19.3 | 30.5 |
| 1 = male | 80.7 | 69.5 | |
| Household head education | 1 = Primary education | 6.1 | 7.8 |
| 2 = Secondary vocational education | 61.0 | 52.0 | |
| 3 = University | 12.2 | 17.2 | |
| 4 = others (including graduate) | 11.7 | 9.6 | |
| 5 = unknown | 9.0 | 13.4 | |
| Households perceiving themselves as ‘middle and above’ income category (%) | 0 = ‘below middle’ | 6.3 | 7.0 |
| 1 = ‘middle or above’ | 93.7 | 93.0 | |
| Households perceiving themselves as native (%) | 0 = native | 40.6 | 85.5 |
| 1 = non-native | 59.4 | 14.5 | |
| No of Households having children under 10 years | 0 = no | 63.8 | 42.5 |
| 1 = yes | 36.2 | 57.5 | |
| Housing Characteristics | |||
| Households renovated (%) | 0 = old traditional | 95.7 | 43.5 |
| 1 = New renovated | 4.3 | 56.5 | |
| Households constructed or purchased the house with own savings (%) | 0 = no | 92.3 | 22.0 |
| 1 = yes | 7.7 | 78.0 | |
| Piped water into the dwelling is the main source of drinking water (%) | 0 = no | 12.6 | 10.5 |
| 1 = yes | 87.4 | 89.5 | |
| Household connected sewage network (%) | 0 = No sewage network | 16.4 | 41.0 |
| 1 = sewage network | 83.6 | 59.0 | |
| Household using flush Toilets (%) | 0 = other including dry toilet sink hole | 5.8 | 6.5 |
| 1 = septic tank | 22.7 | 25.5 | |
| 2 = flush toilet | 71.0 | 68.0 | |
| Hygiene Indicators of the Households | |||
| Children defecating in potty box and diapers (%) | 0 = No | 21.3 | 68.0 |
| 1 = yes | 78.7 | 32.0 | |
| Children defecating at the same place as adults | 0 = no | 77.3 | 68.5 |
| 1 = yes | 22.7 | 31.5 | |
| Frequency of eating out | 0 = do not eat out | 57.0 | 50.0 |
| 1 = occasionally | 22.7 | 37.5 | |
| 2 = frequently | 20.3 | 12.5 | |
| Households using boiling method to make water safe to drink | 0 = no | 30.9 | 29.0 |
| 1 = yes | 69.1 | 71.0 | |
| Households storing water in plastic containers (%) | 0 = no | 59.9 | 58.5 |
| 1 = yes | 40.1 | 41.5 | |
| Household covering the drinking water containers (%) | 0 = no | 52.7 | 26.0 |
| 1 = yes | 47.3 | 74.0 | |
| Households using other methods (aeration, filter, freezing) to treat water (%) | 0 = no | 44.4 | 88.0 |
| 1 = yes | 55.6 | 12.0 | |
| Households perceiving handwashing can prevent illness (%) | 0 = no | 29.5 | 11.5 |
| 1 = yes | 70.5 | 88.5 | |
| Households reporting death in family in the last 5 years | 0 = no | 85.0 | 94.5 |
| 1 = yes | 15.0 | 5.5 | |
| Olmalik (n = 207) | Kibray (n = 200) | ||||||||
|---|---|---|---|---|---|---|---|---|---|
| Variable | Mean | Std. Dev | Min | Max | Mean | Std. Dev | Min | Max | |
| Households reporting ‘no’ cases of WTDs | 3.18 | 3.17 | 0 | 16 | 1.71 | 2.41 | 0 | 12 | |
| Olmalik (n = 207) | Kibray (n = 200) | ||||||||
| Categories | % distribution | % distribution | |||||||
| Households WTD burden | 0 = moderate low | 38.2 | 78.5 | ||||||
| 1 = high | 61.8 | 21.5 | |||||||
| Tashkent Province (Olmalik; Kibray n = 407) | ||||
|---|---|---|---|---|
| Predictor | Estimate | Standard Error | p-Value | Exp(B) |
| Intercept | 0.971 | 0.3105 | 0.042 | 1.344 (0.783–2.308) |
| Gender of household head (0 = female, 1 = male) | 0.375 | 0.1324 | 0.043 * | 1.401 (1.082–1.815) |
| Have child in the family less than 10 years old (0 = No,1 = Yes) | 0.337 | 0.1188 | 0.005 ** | 1.447 (1.145–1.829) |
| Ethnicity (0 = Uzbek, 1 = Other) | 0.059 | 0.1275 | 0.643 | 1.046 (0.815–1.343) |
| Housing status (0 = old; 1 = new) | −1.043 | 0.1847 | 0.000 ** | 0.338 (0.235–0.487) |
| Death in the family past 6 months (0 = no 1 = yes) | −0.026 | 0.1511 | 0.862 | 0.998 (0.744–1.339) |
| Water source piped into dwelling (0 = no, 1 = yes) | −0.623 | 0.1848 | 0.001 ** | 0.599 (0.456–0.786) |
| Boiling water safe to drink (0 = no; 1 = yes) | −0.034 | 0.1072 | 0.749 | 0.956 (0.776–1.176) |
| Household size | 0.137 | 0.0297 | 0.000 ** | 1.233 (1.104–1.376) |
| Sum of Amenities | −0.125 | 0.0470 | 0.008 ** | 0.966 (0.891–1.047) |
| Number of people using toilet | −0.066 | 0.0548 | 0.228 | 0.934 (0.834–1.042) |
| Sewage connection (no = 0; yes = 1) | −0.359 | 0.1816 | 0.048 * | 0.698 (0.489–0.997) |
| Frequency of eating out (0 = never) | ||||
| 1 = occasionally | 0.488 | 0.1430 | 0.001 ** | 1.595 (1.270–2.002) |
| 2 = frequently) | 0.467 | 0.1161 | 0.000 ** | 1.630 (1.231–2.157) |
| Olmalik (n = 207) | Kibray (n = 200) | |||||||
|---|---|---|---|---|---|---|---|---|
| Predictor | Estimate | Standard Error | p-Value | Exp(B) | Estimate | Standard Error | p-Value | Exp(B) |
| Intercept | 0.062 | 0.3972 | 0.877 | 1.132 (0.562–2.280) | −4.327 | 0.8598 | 0.000 | 0.005 (0.001–0.029) |
| Gender of household head (0 = female, 1 = male) | 0.249 | 0.1583 | 0.115 | 1.329 (0.655–0.154) | 0.288 | 0.2711 | 0.287 | 1.859 (1.117–3.095) |
| Have child in the family less than 10 years old (0 = No,1 = Yes) | 0.553 | 0.1334 | 0.000 ** | 1.801 (1.398–2.320) | 0.091 | 0.2836 | 0.749 | 1.166 (0.680–1.998) |
| Ethnicity (0 = Uzbek, 1 = Other) | −0.185 | 0.1442 | 0.201 | 0.869 (0.655–1.154) | 0.900 | 0.4010 | 0.025 * | 1.849 (0.836–4.085) |
| Housing status (0 = old; 1 = new) | −0.044 | 0.2722 | 0.872 | 0.617 (0.401–0.950) | −0.369 | 0.2665 | 0.000 ** | 0.446 (0.015–0.902) |
| Death in the family past 6 months (0 = no 1 = yes) | −0.188 | 0.1769 | 0.287 | 0.806 (0.570–1.140) | 1.010 | 0.3471 | 0.004 ** | 2.486 (1.265–4.885) |
| Water source piped into dwelling (0 = no, 1 = yes) | −0.133 | 0.1821 | 0.466 | 0.817 (0.971–1.138) | −0.811 | 0.2751 | 0.003 ** | 0.444 (0.259–0.762) |
| Boiling water safe to drink (0 = no; 1 = yes) | −0.065 | 0.1296 | 0.617 | 0.714 (0.459–1.12) | 0.237 | 0.2462 | 0.336 | 1.267 (0.782–2.053) |
| Household size | 0.237 | 0.0393 | 0.000 ** | 1.230 (1.074–1.408) | 0.013 | 0.0523 | 0.798 | 1.054 (0.876–1.268) |
| Sum of Amenities | −0.115 | 0.0488 | 0.019 * | 0.851 (0.771–0.938) | −0.379 | 0.1260 | 0.011 * | 0.460 (0.095–0.946) |
| Number of people using toilet | 0.020 | 0.797 | 0.862 | 1.230 (0.899–1.185) | 0.053 | 0.0912 | 0.560 | 1.063 (0.887–1.273) |
| Sewage connection (no = 0; yes = 1) | −0.154 | 0.3085 | 0.617 | 0.873 (0.617–1.236) | 0.318 | 0.3178 | 0.318 | 1.686 (1.016–2.796) |
| Frequency of eating out (0 = never) | ||||||||
| 1 = occasionally | 0.370 | 0.1608 | 0.021 * | 1.281 (0.976–1.680) | 0.670 | 0.3680 | 0.069 | 3.030 (1.748–5.253) |
| 2 = frequently | 0.233 | 0.1395 | 0.095 | 1.466 (1.071–2.006) | 1.057 | 0.2857 | 0.000 * | 2.443 (1.215–4.912) |
© 2018 by the authors. Licensee MDPI, Basel, Switzerland. This article is an open access article distributed under the terms and conditions of the Creative Commons Attribution (CC BY) license (http://creativecommons.org/licenses/by/4.0/).
Share and Cite
Veluswami Subramanian, S.; Cho, M.J.; Mukhitdinova, F. Health Risk in Urbanizing Regions: Examining the Nexus of Infrastructure, Hygiene and Health in Tashkent Province, Uzbekistan. Int. J. Environ. Res. Public Health 2018, 15, 2578. https://doi.org/10.3390/ijerph15112578
Veluswami Subramanian S, Cho MJ, Mukhitdinova F. Health Risk in Urbanizing Regions: Examining the Nexus of Infrastructure, Hygiene and Health in Tashkent Province, Uzbekistan. International Journal of Environmental Research and Public Health. 2018; 15(11):2578. https://doi.org/10.3390/ijerph15112578
Chicago/Turabian StyleVeluswami Subramanian, Saravanan, Min Jung Cho, and Fotima Mukhitdinova. 2018. "Health Risk in Urbanizing Regions: Examining the Nexus of Infrastructure, Hygiene and Health in Tashkent Province, Uzbekistan" International Journal of Environmental Research and Public Health 15, no. 11: 2578. https://doi.org/10.3390/ijerph15112578
APA StyleVeluswami Subramanian, S., Cho, M. J., & Mukhitdinova, F. (2018). Health Risk in Urbanizing Regions: Examining the Nexus of Infrastructure, Hygiene and Health in Tashkent Province, Uzbekistan. International Journal of Environmental Research and Public Health, 15(11), 2578. https://doi.org/10.3390/ijerph15112578