A Raster-Based Subdividing Indicator to Map Urban Heat Vulnerability: A Case Study in Sydney, Australia


Abstract
1. Introduction
2. Materials and Methods
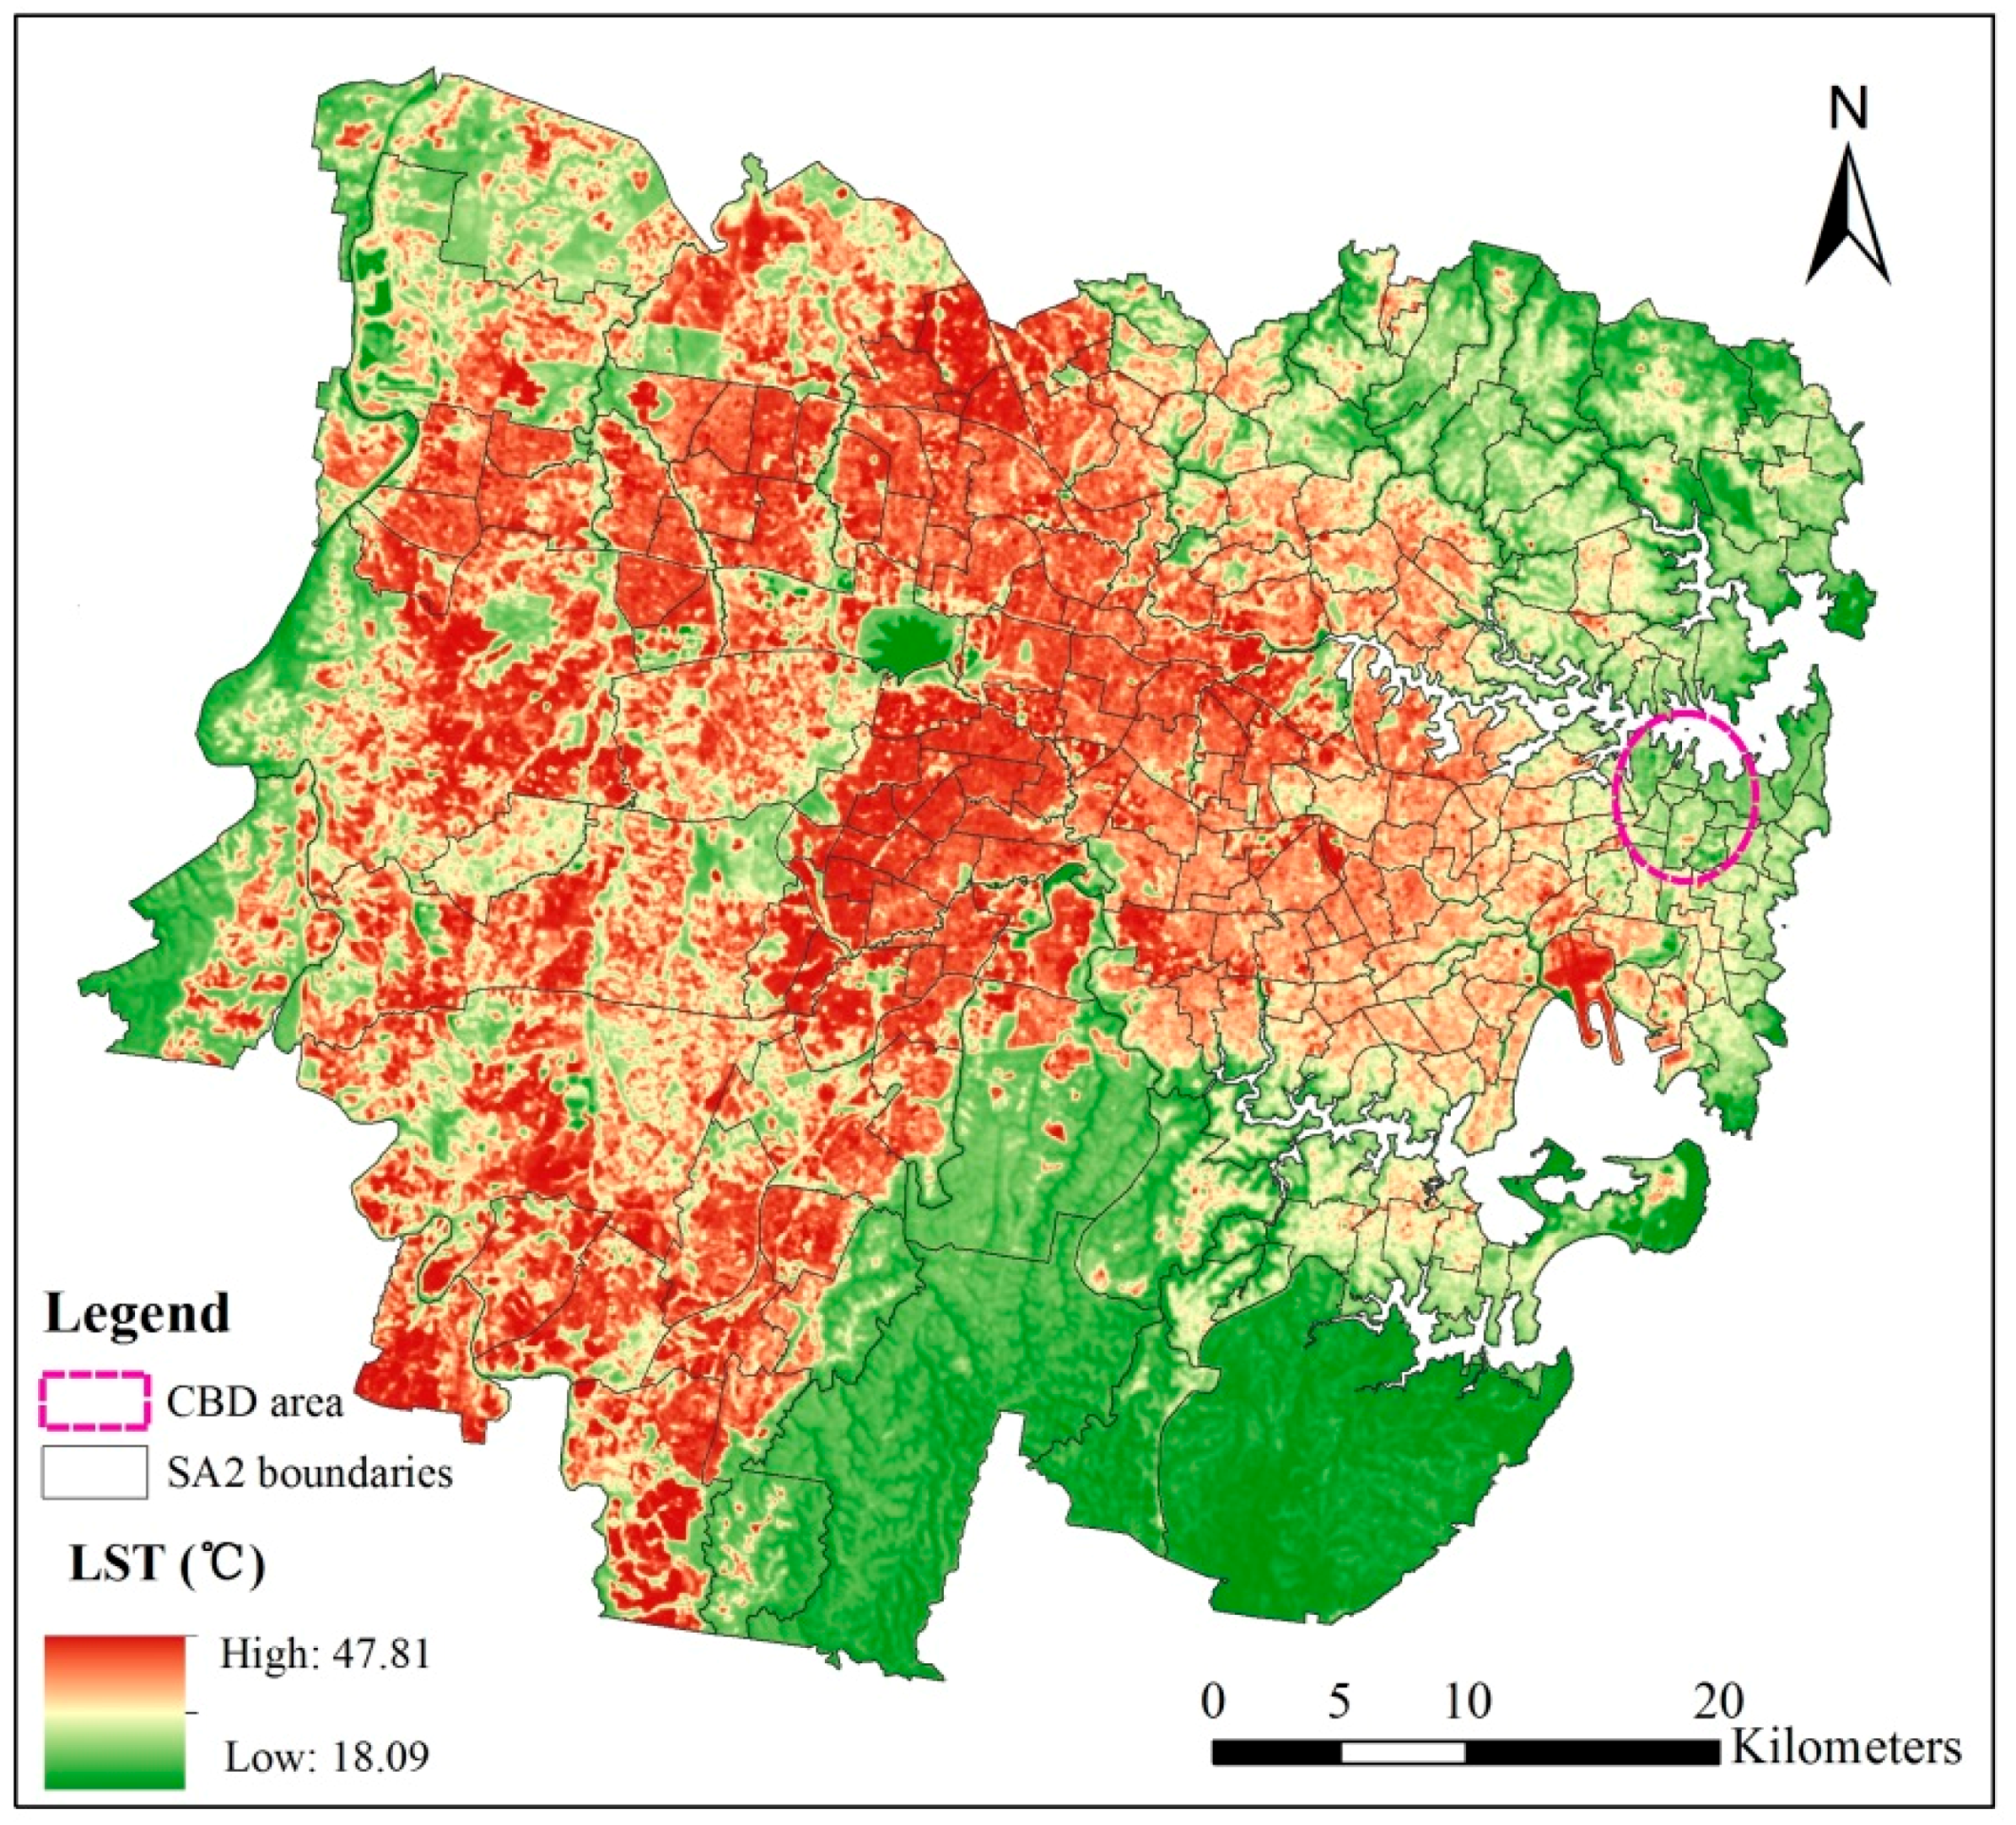
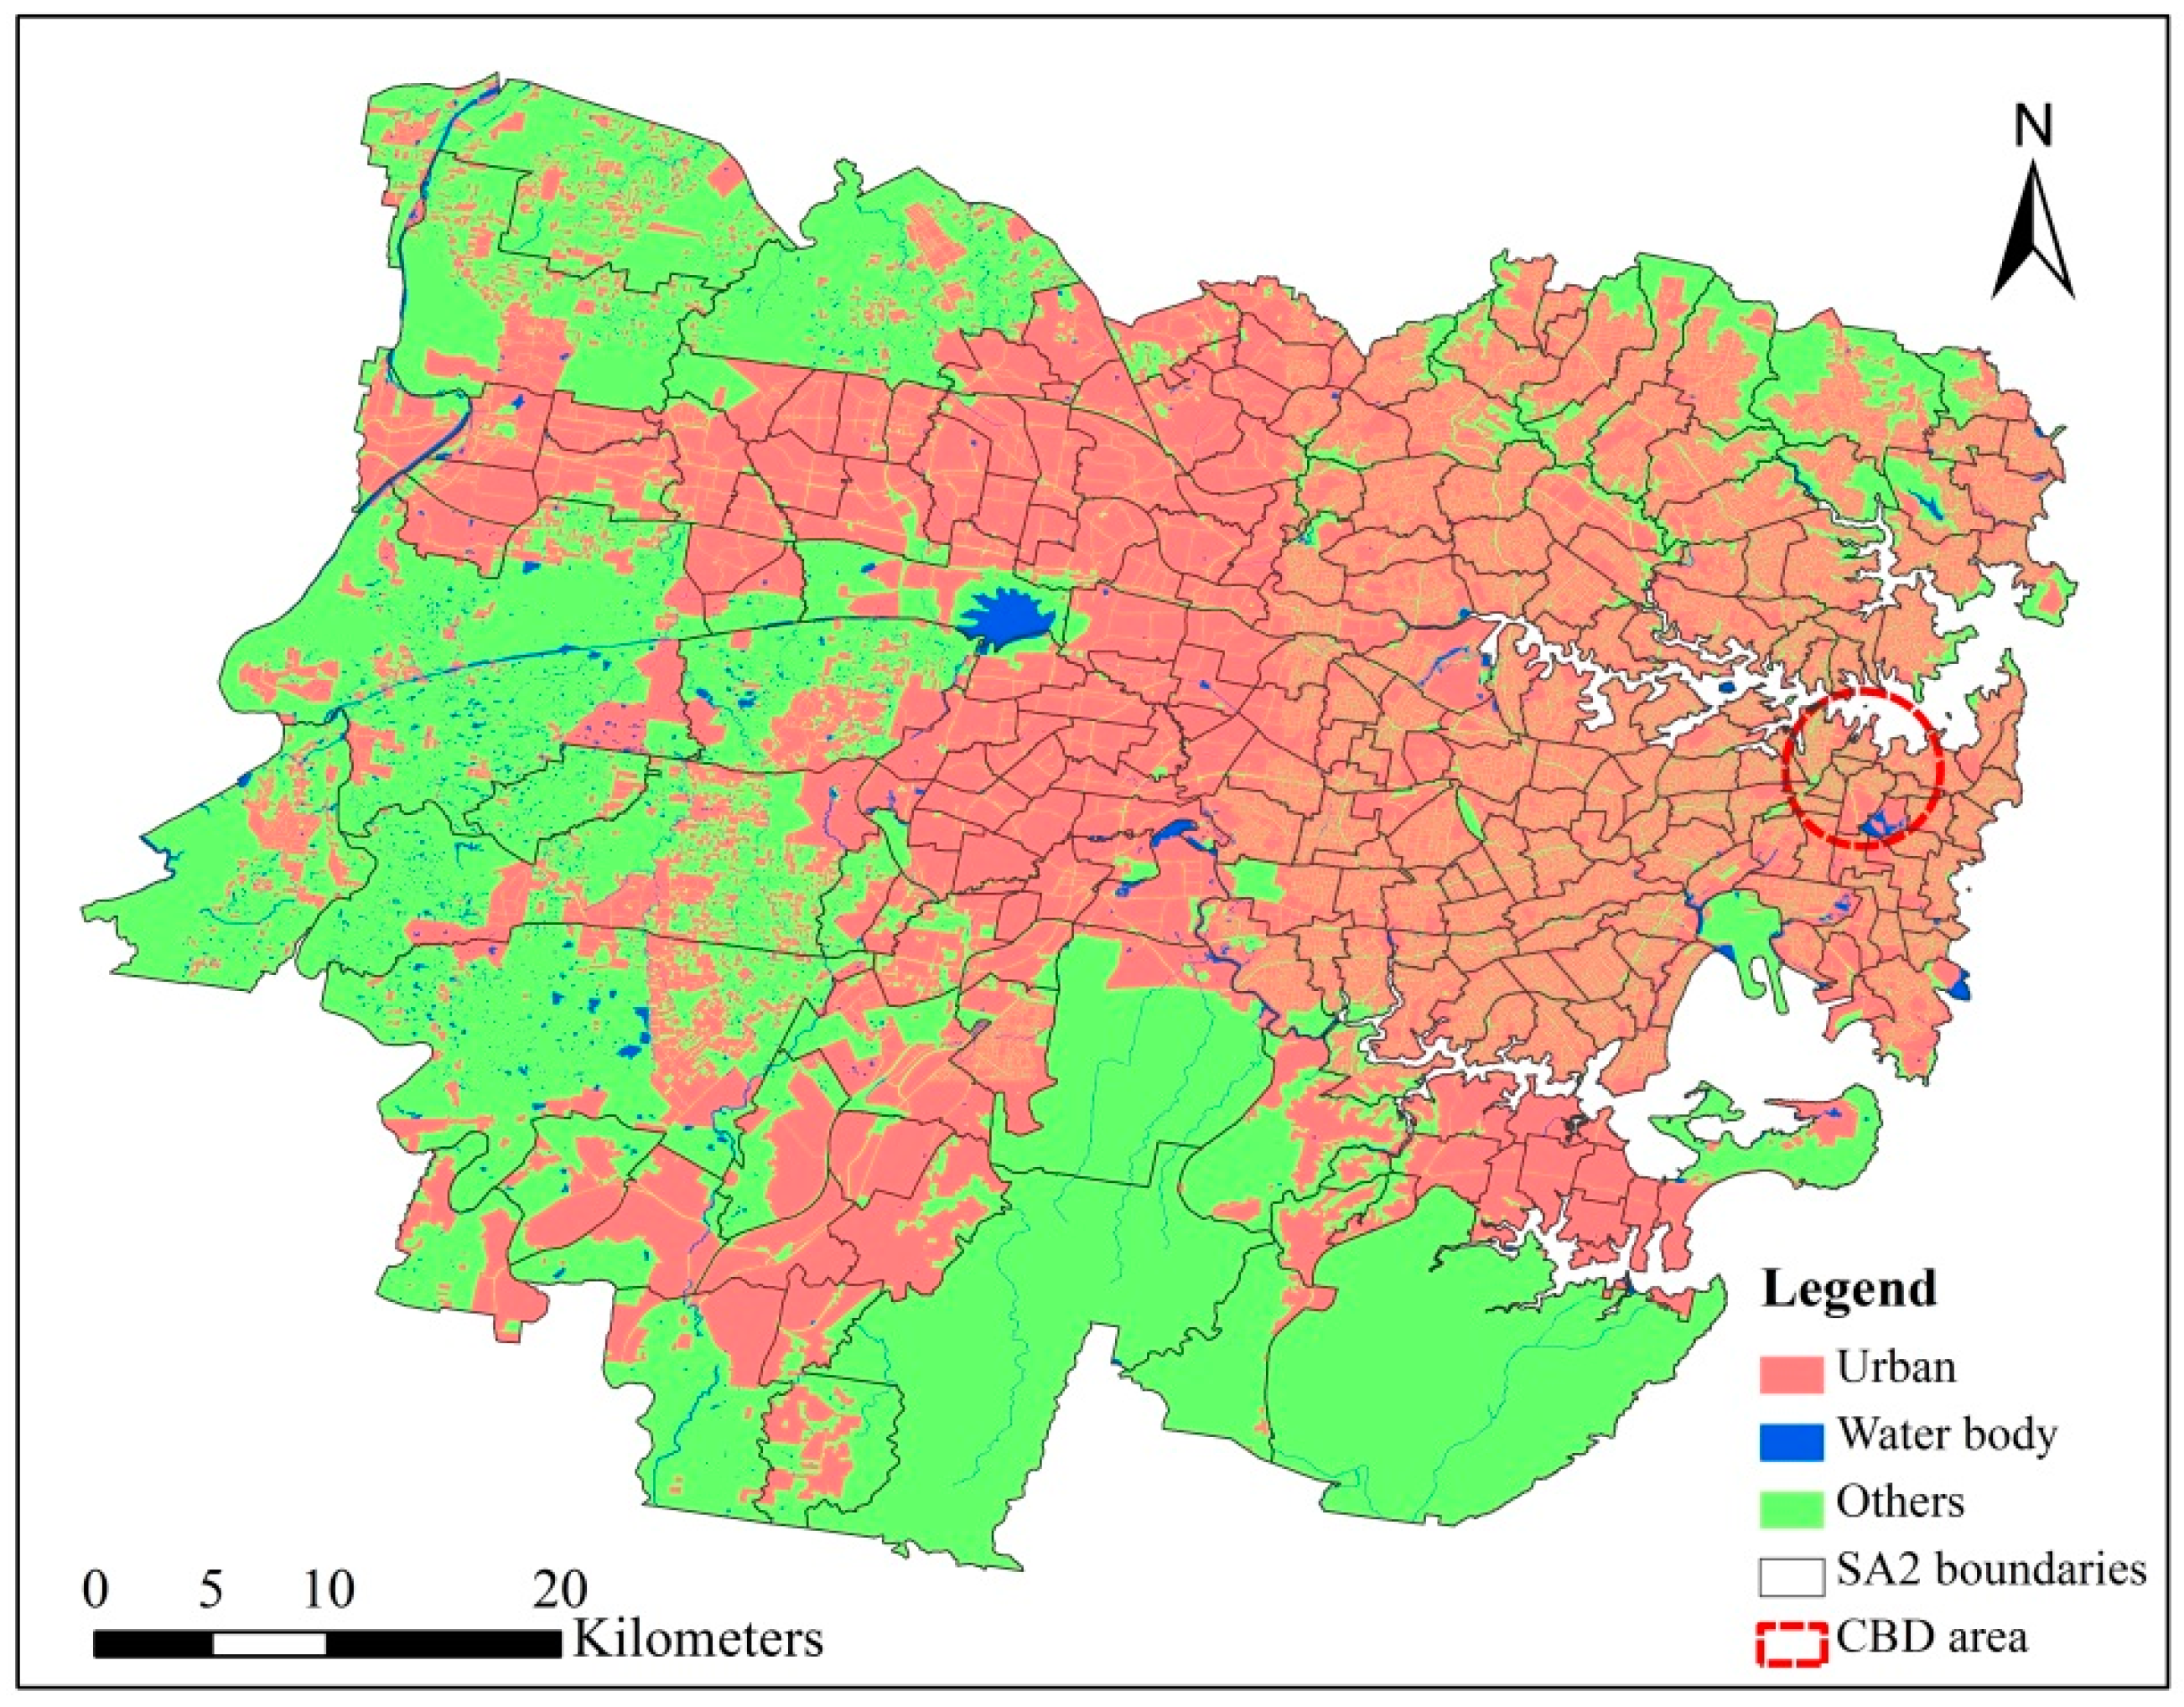
2.1. Study Area
2.2. Study Design
2.3. Indicators for Heat Vulnerability
2.3.1. Exposure
2.3.2. Sensitivity
2.3.3. Adaptive Capacity
3. Calculations
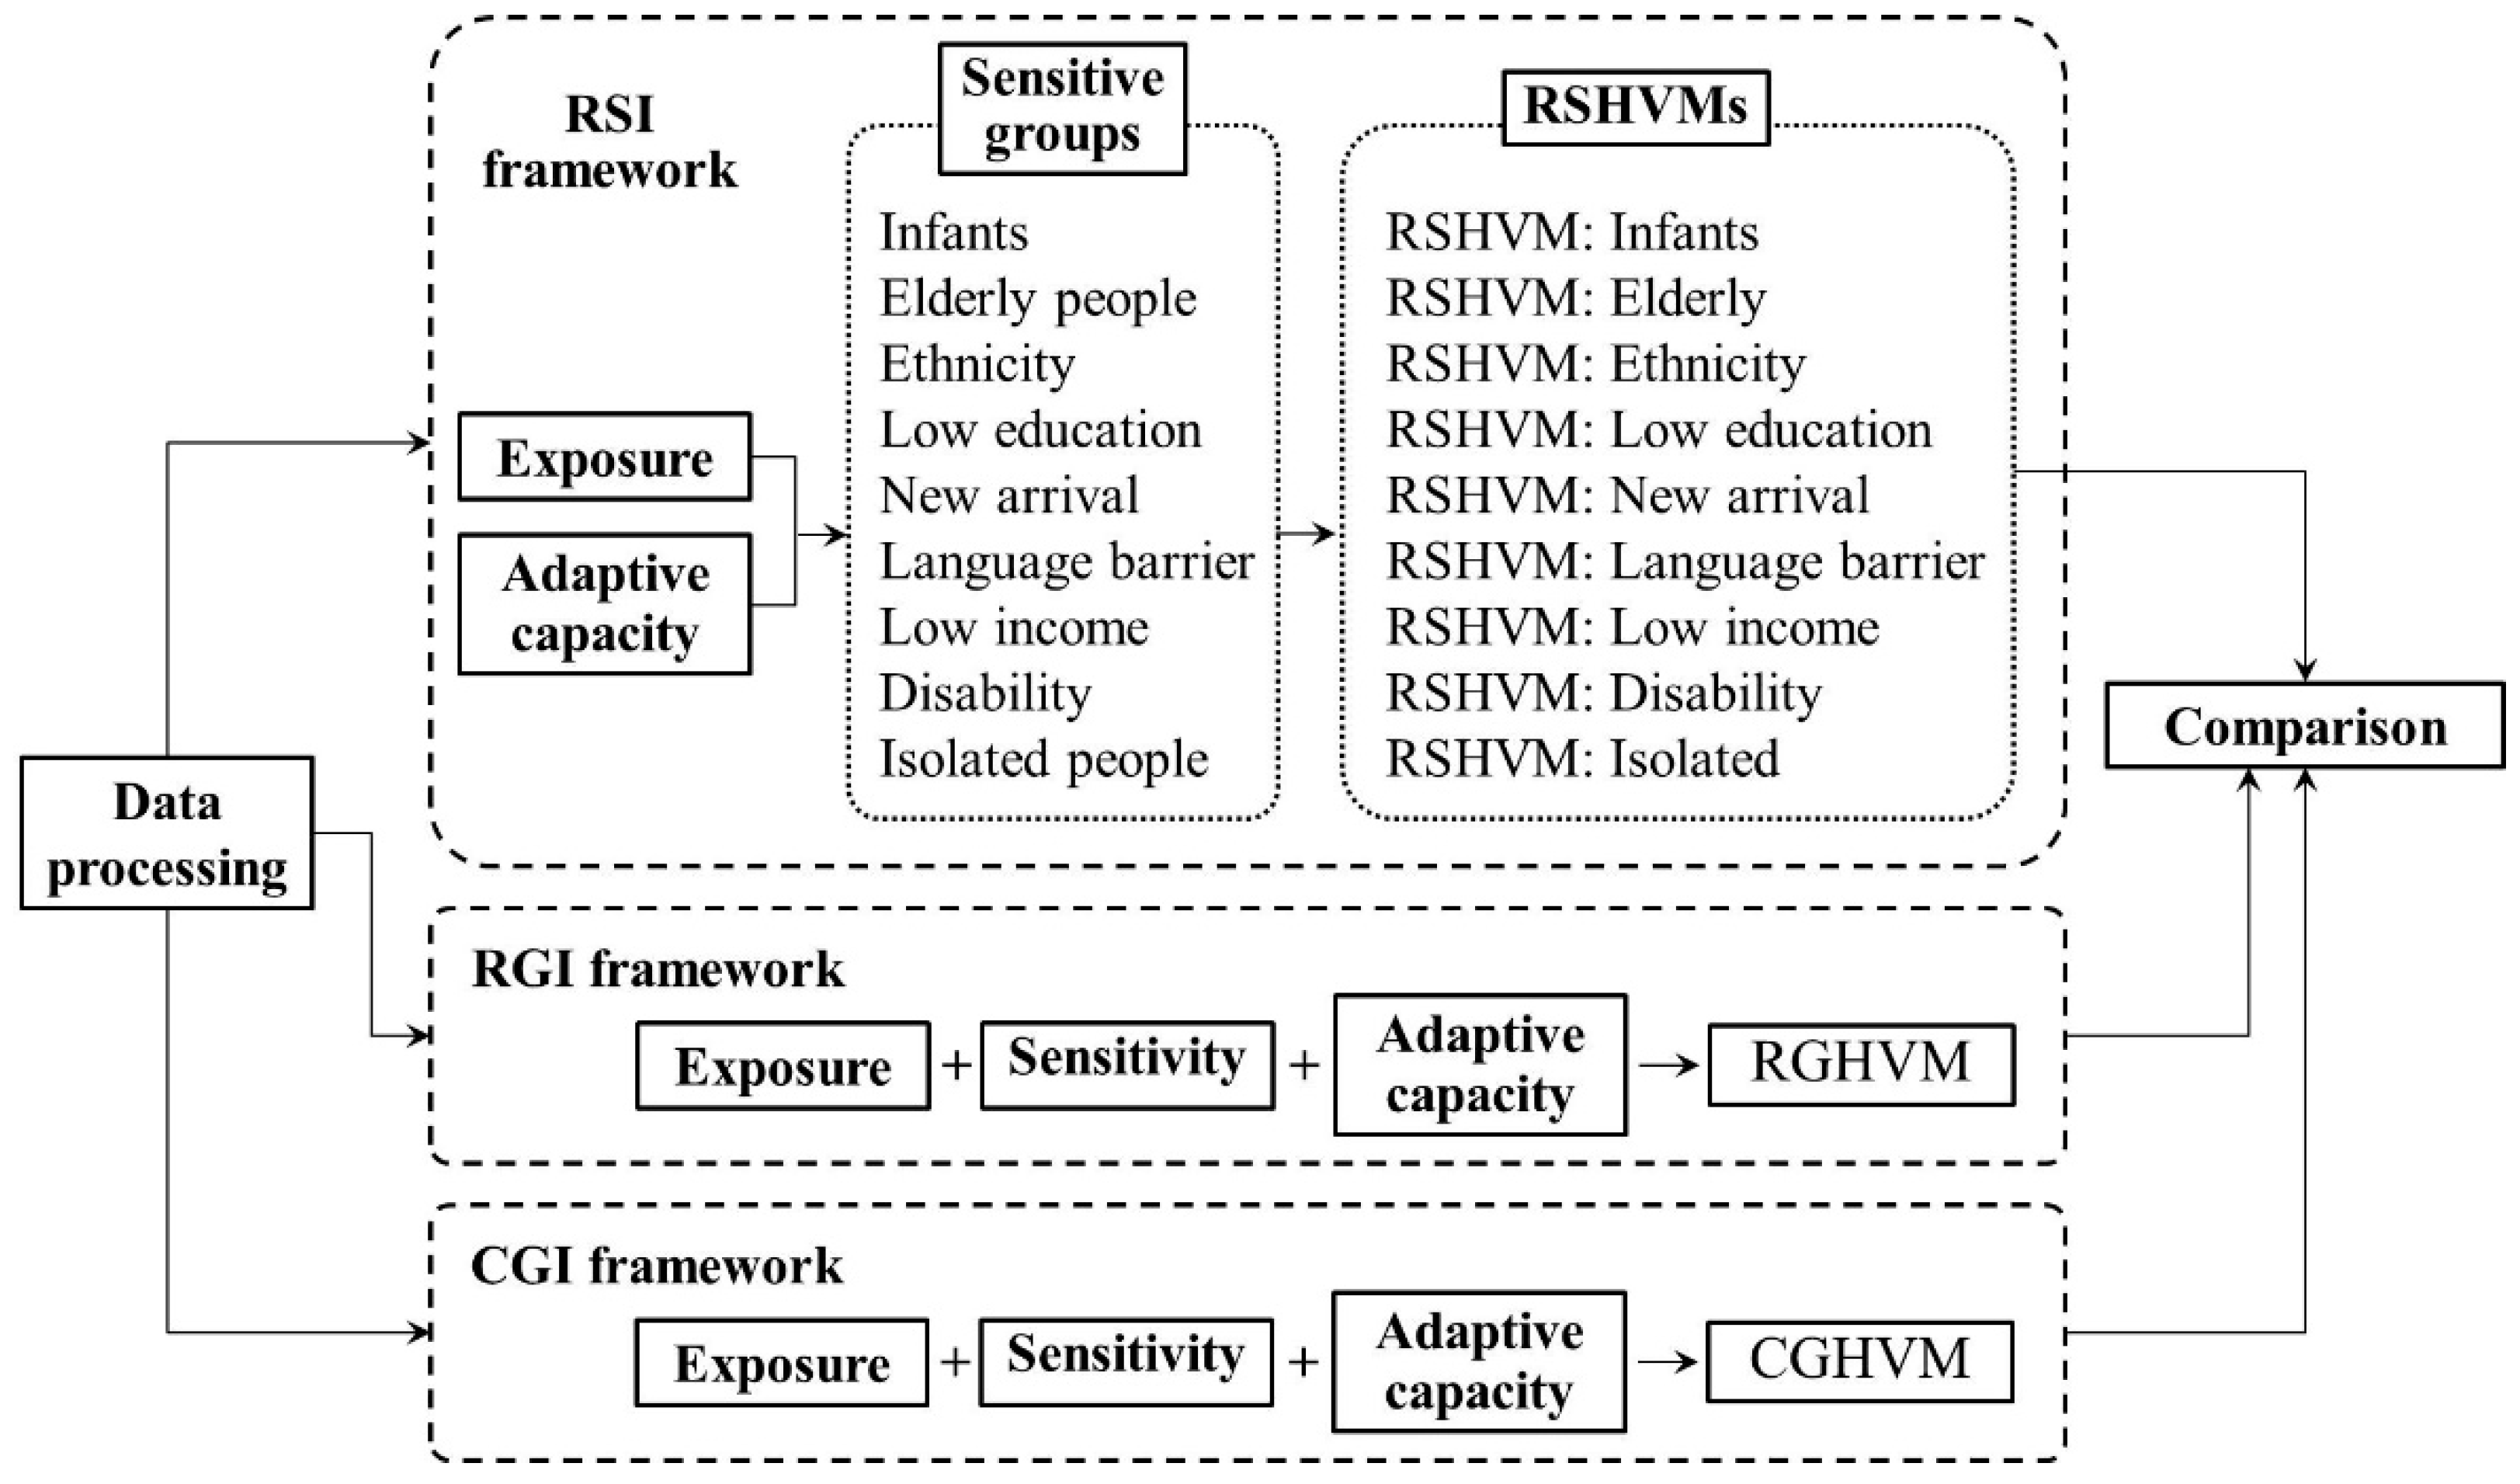
3.1. Raster-Based Subdividing Indicator (RSI)
3.2. Raster-Based General Indicator (RGI)
3.3. Census Unit-Based General Indicator (CGI)
4. Results
4.1. Raster-Based Subdividing Heat Vulnerability Map (RSHVM)
4.2. Raster-Based General Heat Vulnerability Map (RGHVM)
4.3. Census Unit-Based General Heat Vulnerability Map (CGHVM)
4.4. Comparison of RGHVM and RSHVM
4.5. Comparison of RSHVM and CGHVM
5. Discussion
5.1. The Merits of RSI Frameworkthe Results of RSI Framework Are More Accurate than Traditional CGI Framework. The Reasons Are as Follows
- (1)
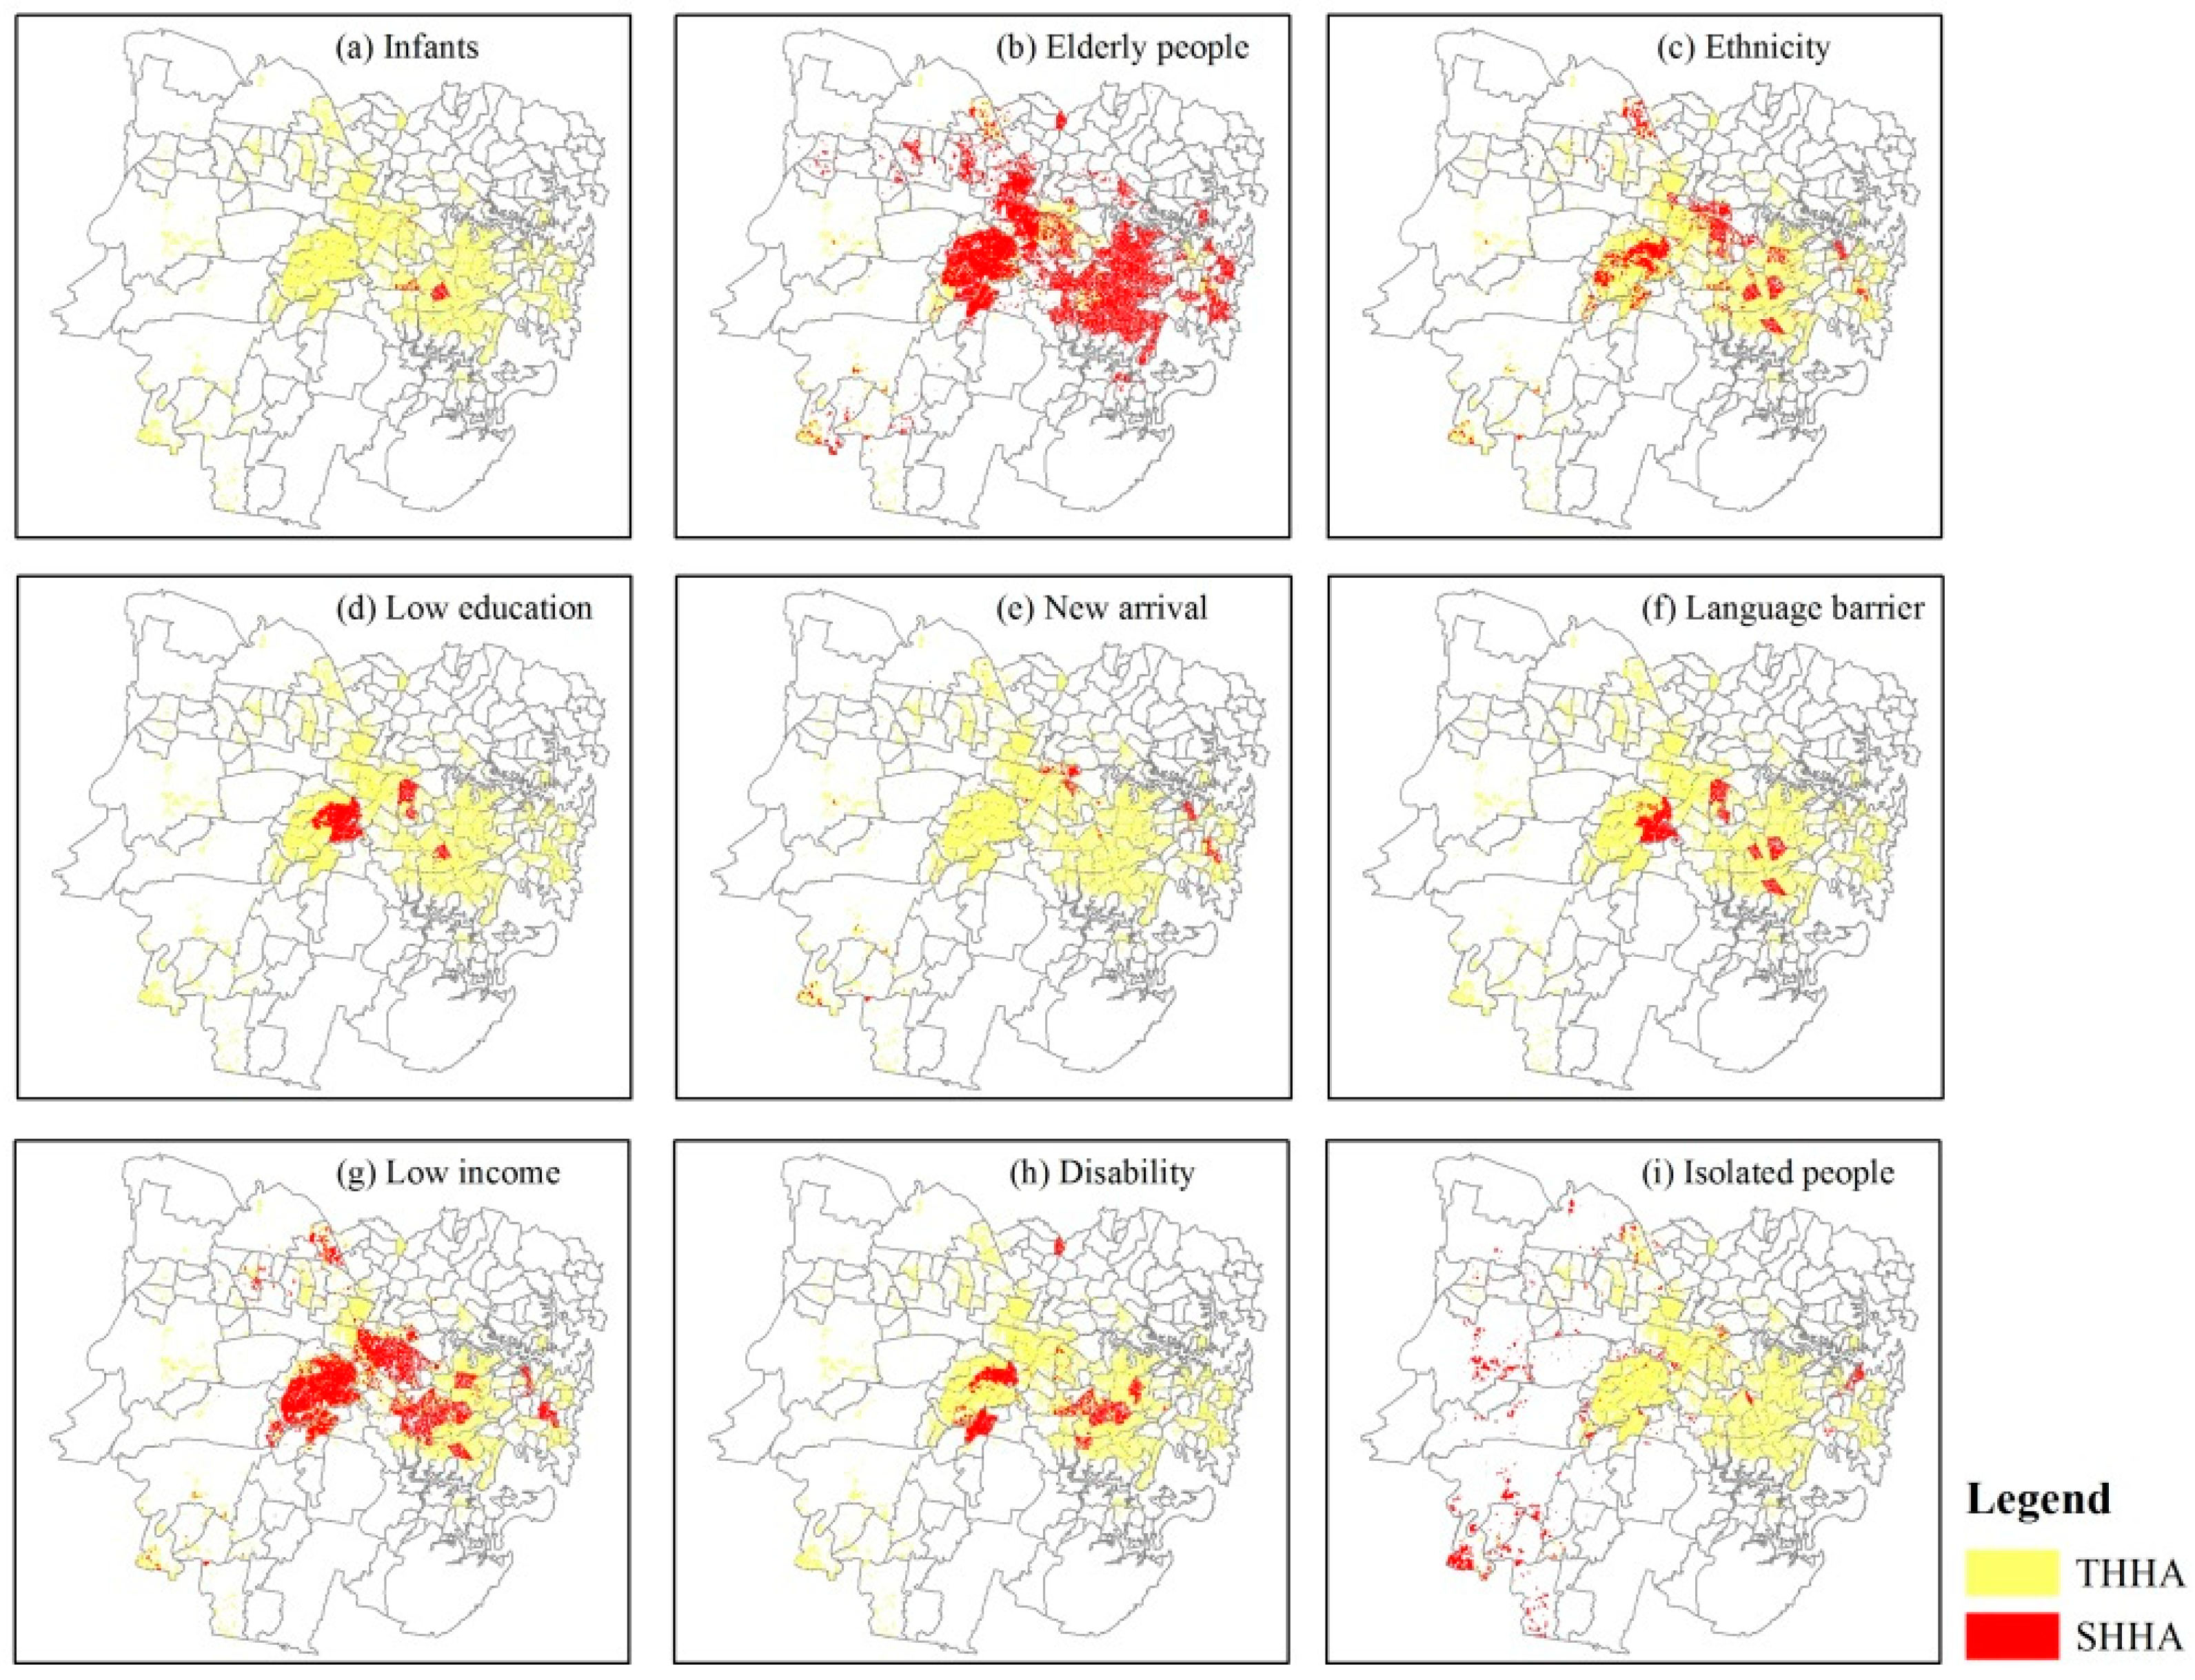
- The spatial variation information of each fragile group was provided in the RSI framework. In fact, different fragile groups usually need different resources and assistance during heat waves [60]. For example, it’s suitable to provide additional emergency ambulance facilities and health care workers for infants and elderly people who have poor physical resistance to heat; while initially multi-language heat information and guidelines are more useful to overcome language barriers. As for low income people, perhaps the most effective way to aid adaption to heat waves is through ease of access to public ‘cool spots’ like well shaded parks, water bodies and libraries, although research by Sampson et al. [61] explains the various socio-technical complexities to such an approach. However, the CGI framework cannot provide that information.
- (2)
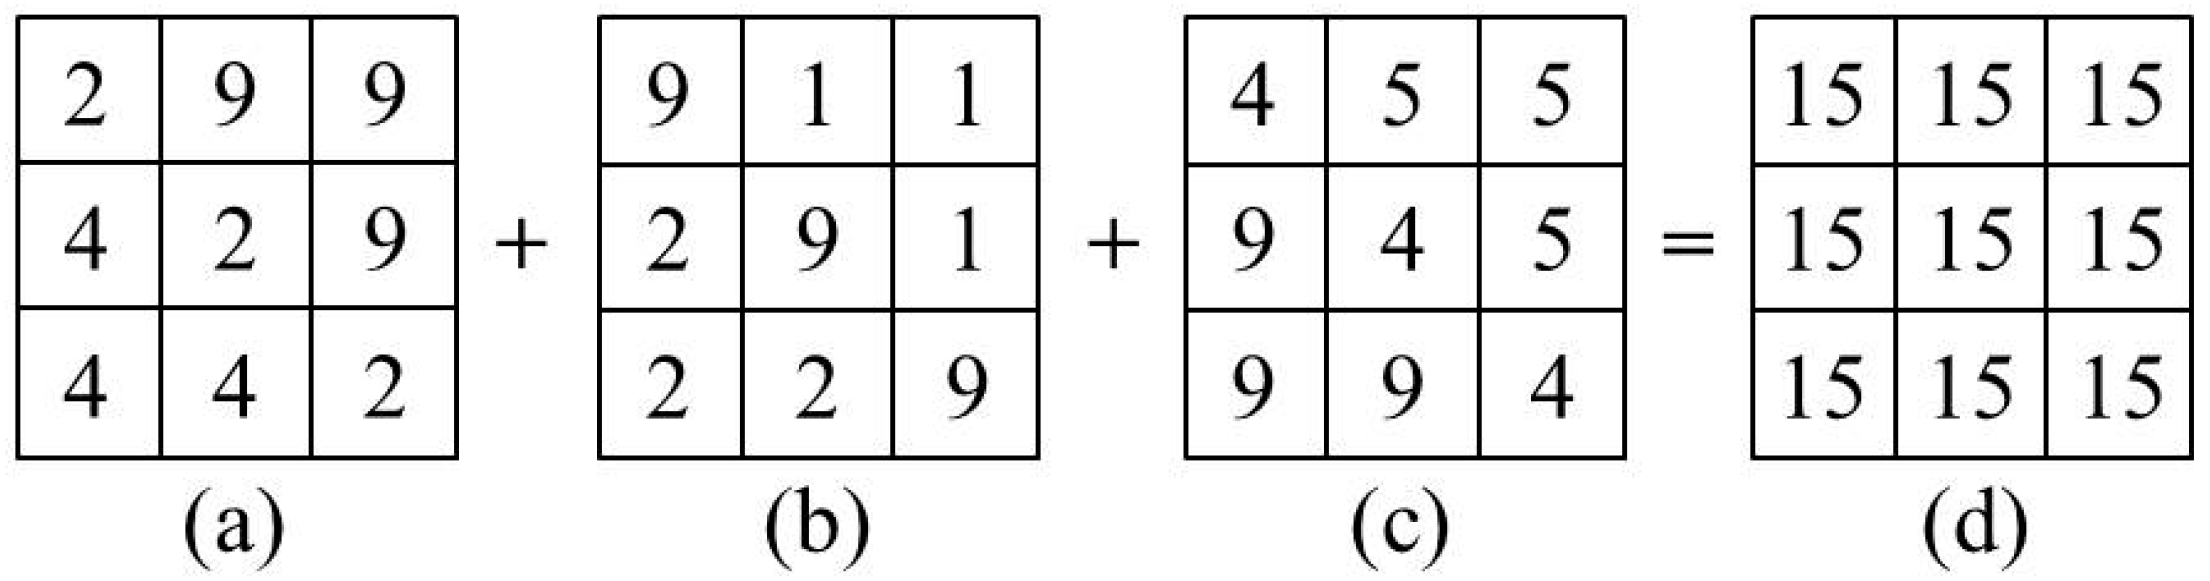
- Aggregate error will be avoided in the RSI framework. A sensitivity indicator is usually aggregated by many factors (such as infants, the elderly, and people of low income) under the CGI framework [31]. However, this aggregation not only leads to the inaccuracy of useful spatial information, but also may mislead decision makers (Figure 1). As is shown in Table 5, it is possible that some census units with high vulnerability groups will be ignored by decision makers under the CGI framework. However, because there is no need to aggregate the multiple sensitivity factors into a combined indicator under the RSI framework, the aggregate error will be avoided.
- (3)
- Weighting problems will be avoided in the RSI framework. Many scholars admitted that they use equal weights or principal component analysis (PCA) to combine multiple sensitivity factors, because no information exists from which a more appropriate weighting can be derived [27,31,57]. This is a possible source of indicator inaccuracy [59]. However, there is no need to calculate a combined sensitivity indicator under the RSI framework, so the weighting problems will be avoided.
- (4)
- Modifiable areal unit problem (MAUP) problem and statistical bias will be avoided in the RSI framework. Census information is an important data source for mapping urban heat vulnerability, and it is usually counted with some specific spatial unit like postal code and census tract. In order to match spatial units employed by the census, most heat vulnerability studies use a spatial statistic method such as zoning or scaling to process the base data. This data processing procedure not only leads to coarse spatial resolution of heat vulnerability assessment results, but also causes the modifiable areal unit problem (MAUP) and statistical bias (Table 3). However, those problems will be avoided under the RSI framework.
5.2. Limitations of This Study
6. Conclusions
Author Contributions
Funding
Acknowledgments
Conflicts of Interest
Abbreviations
| ABS | Australian Bureau of Statistics |
| CGI | census unit-based general indicator |
| GHVI | general heat vulnerability indicator |
| HVM | heat vulnerability map |
| RGHVM | raster-based general heat vulnerability map |
| RSHVM | raster-based subdividing heat vulnerability map |
| SA2 | statistical areas level 2 |
| THHA | total very high HVI area |
| CGHVM | census unit-based general heat vulnerability map |
| GHHA | general very high HVI area |
| HVI | heat vulnerability indicator |
| MAUP | modifiable areal unit problem |
| RGI | raster-based general indicator |
| RSI | raster-based subdividing indicator |
| SHHA | subdividing very high HVI area |
References
- Reid, C.E.; O’Neill, M.S.; Gronlund, C.J.; Brines, S.J.; Brown, D.G.; Diez-Roux, A.V.; Schwartz, J. Mapping community determinants of heat vulnerability. Environ. Health Perspect. 2009, 117, 1730. [Google Scholar] [CrossRef] [PubMed]
- Aminipouri, M.; Knudby, A.; Ho, H.C. Using multiple disparate data sources to map heat vulnerability: Vancouver case study. Can. Geogr. 2016, 60, 356–368. [Google Scholar] [CrossRef]
- Mortensen, J.W.; Heaton, M.J.; Wilhelmi, O.V. Urban heat risk mapping using multiple point patterns in Houston, Texas. J. R. Stat. Soc. 2018, 67, 83–102. [Google Scholar] [CrossRef]
- Pincetl, S.; Chester, M.; Eisenman, D. Urban heat stress vulnerability in the U.S. Southwest: The role of sociotechnical systems. Sustainability 2016, 8, 842. [Google Scholar] [CrossRef]
- Keller, R.C. Place matters: Mortality, space, and urban form in the 2003 Paris heat wave disaster. Fr. Hist. Stud. 2013, 36, 299–330. [Google Scholar] [CrossRef]
- Loughnan, M.; Tapper, N.; Phan, T.; Lynch, K.; Mcinnes, J. A Spatial Vulnerability Analysis of Urban Populations during Extreme Heat Events in Australian Capital Cities Final Report. Available online: https://www.nccarf.edu.au/publications/spatial-vulnerability-urban-extreme-heat-events (accessed on 7 November 2018).
- Loughnan, M.E.; Tapper, N.J.; Phan, T.; Mcinnes, J.A. Can a spatial index of heat-related vulnerability predict emergency service demand in Australian capital cities? Int. J. Emerg. Serv. 2014, 3, 6–33. [Google Scholar] [CrossRef]
- Wolf, T.; McGregor, G. The development of a heat wave vulnerability index for London, United Kingdom. Weather Clim. Extremes 2013, 1, 59–68. [Google Scholar] [CrossRef]
- Macnee, R.G.D.; Tokai, A. Heat wave vulnerability and exposure mapping for Osaka City, Japan. Environ. Syst. Decis. 2016, 36, 1–9. [Google Scholar] [CrossRef]
- Thom, J.K.; Coutts, A.M.; Broadbent, A.M.; Tapper, N.J. The influence of increasing tree cover on mean radiant temperature across a mixed development suburb in Adelaide, Australia. Urban For. Urban Green. 2016, 20, 233–242. [Google Scholar] [CrossRef]
- Mushore, T.D.; Mutanga, O.; Odindi, J.; Dube, T. Determining extreme heat vulnerability of Harare Metropolitan City using multispectral remote sensing and socio-economic data. J. Spat. Inf. Sci. 2018, 63, 173–191. [Google Scholar] [CrossRef]
- Team, C.W.; Pachauri, R.K.; Meyer, L.A. Climate Change 2014: Synthesis Report. Contribution of Working Groups I, II and III to the Fifth Assessment Report of the Intergovernmental Panel on Climate Change. Available online: http://epic.awi.de/37530/ (accessed on 8 November 2018).
- Morabito, M.; Crisci, A.; Gioli, B.; Gualtieri, G.; Toscano, P.; Stefano, V.D.; Orlandini, S.; Gensini, G.F. Urban-hazard risk analysis: Mapping of heat-related risks in the elderly in major Italian cities. PLoS ONE 2015, 10, e127277. [Google Scholar] [CrossRef] [PubMed]
- Vescovi, L.; Rebetez, M.; Rong, F. Assessing public health risk due to extremely high temperature events: Climate and social parameters. Clim. Res. 2005, 30, 71–78. [Google Scholar] [CrossRef]
- Rinner, C.; Patychuk, D.; Bassil, K.; Nasr, S.; Gower, S.; Campbell, M. The role of maps in neighborhood-level heat vulnerability assessment for the city of Toronto. Cartogr. Geogr. Inf. Sci. 2010, 37, 31–44. [Google Scholar] [CrossRef]
- Tomlinson, C.J.; Chapman, L.; Thornes, J.E.; Baker, C.J. Including the urban heat island in spatial heat health risk assessment strategies: A case study for Birmingham, UK. Int. J. Health Geogr. 2011, 10, 42. [Google Scholar] [CrossRef] [PubMed]
- Hondula, D.M.; Davis, R.E.; Leisten, M.J.; Saha, M.V.; Veazey, L.M.; Wegner, C.R. Fine-scale spatial variability of heat-related mortality in Philadelphia County, USA, from 1983–2008: A case-series analysis. Environ. Health 2012, 11, 16. [Google Scholar] [CrossRef] [PubMed]
- Chuang, W.C. Vulnerability to extreme heat in metropolitan phoenix: Spatial, temporal, and demographic dimensions. Prof. Geogr. 2012, 64, 286–302. [Google Scholar] [CrossRef]
- Loughnan, M.; Nicholls, N.; Tapper, N.J. Mapping heat health risks in urban areas. Int. J. Popul. Res. 2012, 1–12. [Google Scholar] [CrossRef]
- Johnson, D.P.; Stanforth, A.; Lulla, V.; Luber, G. Developing an applied extreme heat vulnerability index utilizing socioeconomic and environmental data. Appl. Geogr. 2012, 35, 23–31. [Google Scholar] [CrossRef]
- Aubrecht, C.; Ãzceylan, D. Identification of heat risk patterns in the U.S. National Capital Region by integrating heat stress and related vulnerability. Environ. Int. 2013, 56, 65–77. [Google Scholar] [CrossRef] [PubMed]
- Harlan, S.L.; Declet-Barreto, J.H.; Stefanov, W.L.; Petitti, D.B. Neighborhood effects on heat deaths: Social and environmental predictors of vulnerability in Maricopa county, Arizona. Environ. Health Perspect. 2013, 121, 197–204. [Google Scholar] [CrossRef] [PubMed]
- Depietri, Y.; Welle, T.; Renaud, F.G. Social vulnerability assessment of the Cologne urban area (Germany) to heat waves: Links to ecosystem services. Int. J. Disaster Risk Reduct. 2013, 6, 98–117. [Google Scholar] [CrossRef]
- Maier, G.; Grundstein, A.; Jang, W.; Li, C.; Naeher, L.P.; Shepherd, M. Assessing the performance of a vulnerability index during oppressive heat across Georgia, United States. Weather Clim. Soc. 2014, 6, 253–263. [Google Scholar] [CrossRef]
- Dong, W.; Liu, Z.; Zhang, L.; Tang, Q.; Liao, H.; Li, X. Assessing heat health risk for sustainability in Beijing’s urban heat island. Sustainability 2014, 6, 7334–7357. [Google Scholar] [CrossRef]
- Zhu, Q.; Liu, T.; Lin, H.; Xiao, J.; Luo, Y.; Zeng, W.; Zeng, S.; Wei, Y.; Chu, C.; Baum, S.; et al. The spatial distribution of health vulnerability to heat waves in Guangdong Province, China. Glob. Health Action 2014, 7, 25051. [Google Scholar] [CrossRef] [PubMed]
- Chak, H.H.; Anders, K.; Wei, H. A spatial framework to map heat health risks at multiple scales. Int. J. Environ. Res. Public Health 2015, 12, 16110–16123. [Google Scholar] [CrossRef]
- El-Zein, A.; Tonmoy, F.N. Assessment of vulnerability to climate change using a multi-criteria outranking approach with application to heat stress in Sydney. Ecol. Indic. 2015, 48, 207–217. [Google Scholar] [CrossRef]
- Weber, S.; Sadoff, N.; Zell, E.; Sherbinin, A.D. Policy-relevant indicators for mapping the vulnerability of urban populations to extreme heat events: A case study of Philadelphia. Appl. Geogr. 2015, 63, 231–243. [Google Scholar] [CrossRef]
- Li, B.; Woodward, A.; Liu, Q. County-level heat vulnerability of urban and rural residents in Tibet, China. Environ. Health 2016, 15, 1–10. [Google Scholar] [CrossRef]
- Luis, I.; Massimo, P.; Francisco, D.L.B. A heat vulnerability index: Spatial patterns of exposure, sensitivity and adaptive capacity for Santiago de Chile. PLoS ONE 2016, 11, e162464. [Google Scholar] [CrossRef]
- Christenson, M.; Geiger, S.D.; Phillips, J.; Anderson, B.; Losurdo, G.; Anderson, H.A. Heat vulnerability index mapping for Milwaukee and Wisconsin. J. Public Health Manag. Pract. 2017, 23, 1. [Google Scholar] [CrossRef] [PubMed]
- Azhar, G.; Saha, S.; Ganguly, P.; Mavalankar, D.; Madrigano, J. Heat wave vulnerability mapping for India. Int. J. Environ. Res. Public Health 2017, 14, 357. [Google Scholar] [CrossRef] [PubMed]
- Kim, D.W.; Deo, R.C.; Lee, J.S.; Yeom, J.M. Mapping heatwave vulnerability in Korea. Nat. Hazards 2017, 89, 1–21. [Google Scholar] [CrossRef]
- Méndezlázaro, P.; Mullerkarger, F.E.; Otis, D.; Mccarthy, M.J.; Rodríguez, E. A heat vulnerability index to improve urban public health management in San Juan, Puerto Rico. Int. J. Biometeorol. 2018, 62, 709–722. [Google Scholar] [CrossRef] [PubMed]
- Voelkel, J.; Hellman, D.; Sakuma, R.; Shandas, V. Assessing vulnerability to urban heat: A study of disproportionate heat exposure and access to refuge by socio-demographic status in Portland, Oregon. Int. J. Environ. Res. Public Health 2018, 15, 640. [Google Scholar] [CrossRef] [PubMed]
- Nayak, S.G.; Shrestha, S.; Kinney, P.L.; Ross, Z.; Sheridan, S.C.; Pantea, C.I.; Hsu, W.H.; Muscatiello, N.; Hwang, S.A. Development of a heat vulnerability index for New York State. Public Health 2018, 161, 127–137. [Google Scholar] [CrossRef] [PubMed]
- Ho, H.C.; Knudby, A.; Chi, G.; Aminipouri, M.; Lai, Y.F. Spatiotemporal analysis of regional socio-economic vulnerability change associated with heat risks in Canada. Appl. Geogr. 2018, 95, 61–70. [Google Scholar] [CrossRef]
- Romero-Lankao, P.; Qin, H.; Dickinson, K. Urban vulnerability to temperature-related hazards: A meta-analysis and meta-knowledge approach. Global Environ. Chang. 2012, 22, 670–683. [Google Scholar] [CrossRef]
- Schuurman, N.; Bell, N.; Dunn, J.R.; Oliver, L. Deprivation indices, population health and ceography: An evaluation of the spatial effectiveness of indices at multiple scales. J. Urban Health 2007, 84, 591–603. [Google Scholar] [CrossRef] [PubMed]
- Australian Bureau of Statistics. Ten Years of Growth: Australia’s Population Hot Spots. Available online: http://www.abs.gov.au/ausstats/abs%40.nsf/mediareleasesbyCatalogue/28F51C010D29BFC9CA2575A0002126CC?OpenDocument (accessed on 28 July 2017).
- Sharifi, E.; Lehmann, S. Correlation analysis of surface temperature of rooftops, streetscapes and urban heat island effect: Case study of central Sydney. J. Urban Environ. Eng. 2015, 9, 3–11. [Google Scholar] [CrossRef]
- Turner, B.L.; Matson, P.A.; Mccarthy, J.J.; Corell, R.W.; Christensen, L.; Eckley, N.; Hovelsrud-Broda, G.K.; Kasperson, J.X.; Kasperson, R.E.; Luers, A.; et al. Illustrating the coupled human-environment system for vulnerability analysis: Three case studies. Proc. Natl. Acad. Sci. USA 2003, 100, 8080–8085. [Google Scholar] [CrossRef] [PubMed]
- Wilhelmi, O.V.; Hayden, M.H. Connecting people and place: A new framework for reducing urban vulnerability to extreme heat. Environ. Res. Lett. 2010, 5, 014021. [Google Scholar] [CrossRef]
- Uejio, C.K.; Wilhelmi, O.V.; Golden, J.S.; Mills, D.M.; Gulino, S.P.; Samenow, J.P. Intra-urban societal vulnerability to extreme heat: The role of heat exposure and the built environment, socioeconomics, and neighborhood stability. Health Place 2011, 17, 498–507. [Google Scholar] [CrossRef] [PubMed]
- Lee, M.; Shi, L.; Zanobetti, A.; Schwartz, J.D. Study on the association between ambient temperature and mortality using spatially resolved exposure data. Environ. Res. 2016, 151, 610–617. [Google Scholar] [CrossRef] [PubMed]
- Sohrabinia, M.; Zawar-Reza, P.; Rack, W. Spatio-temporal analysis of the relationship between LST from MODIS and air temperature in New Zealand. Theor. Appl. Climatol. 2015, 119, 567–583. [Google Scholar] [CrossRef]
- Vancutsem, C.; Ceccato, P.; Dinku, T.; Connor, S.J. Evaluation of MODIS land surface temperature data to estimate air temperature in different ecosystems over Africa. Remote Sens. Environ. 2010, 114, 449–465. [Google Scholar] [CrossRef]
- Jiménez-Muñoz, J.C.; Sobrino, J.A.; Skoković, D.; Mattar, C.; Cristóbal, J. Land surface temperature retrieval methods from landsat-8 thermal infrared sensor data. IEEE Geosci. Remote Sens. Lett. 2014, 11, 1840–1843. [Google Scholar] [CrossRef]
- Kosatsky, T.; Henderson, S.B.; Pollock, S.L. Shifts in mortality during a hot weather event in Vancouver, British Columbia: Rapid assessment with case-only analysis. Am. J. Public Health 2012, 102, 2367–2371. [Google Scholar] [CrossRef] [PubMed]
- Curriero, F.C.; Heiner, K.S.; Samet, J.M.; Zeger, S.L.; Strug, L.; Patz, J.A. Temperature and mortality in 11 cities of the Eastern United States. Am. J. Epidemiol. 2002, 155, 80–87. [Google Scholar] [CrossRef] [PubMed]
- Harlan, S.L.; Brazel, A.J.; Prashad, L.; Stefanov, W.L.; Larsen, L. Neighborhood microclimates and vulnerability to heat stress. Soc. Sci. Med. 2006, 63, 2847. [Google Scholar] [CrossRef] [PubMed]
- NSW Landuse 2013 Data Set. Available online: https://datasets.seed.nsw.gov.au/dataset/nsw-landuse-2013 (accessed on 7 September 2018).
- NSW Woody Vegetation Extent 2011 Data Set. Available online: http://data.environment.nsw.gov.au/dataset/c0569d56-5236-45e3-8958-ca29e5970093 (accessed on 6 July 2017).
- Zhang, W.; Zhu, Y.; Jiang, J. Effect of the urbanization of wetlands on microclimate: A case study of Xixi Wetland, Hangzhou, China. Sustainability 2016, 8, 885. [Google Scholar] [CrossRef]
- Xu, H. Modification of normalised difference water index (NDWI) to enhance open water features in remotely sensed imagery. Int. J. Remote Sens. 2006, 27, 3025–3033. [Google Scholar] [CrossRef]
- Chen, Q.; Ding, M.; Yang, X.; Hu, K.; Qi, J. Spatially explicit assessment of heat health risk by using multi-sensor remote sensing images and socioeconomic data in Yangtze River Delta, China. Int. J. Health Geogr. 2018, 17, 15. [Google Scholar] [CrossRef] [PubMed]
- Bao, J.; Li, X.; Yu, C. The Construction and Validation of the Heat Vulnerability Index, a Review. Int. J. Environ. Res. Public Health 2015, 12, 7220–7234. [Google Scholar] [CrossRef] [PubMed]
- Wolf, T.; Chuang, W.C.; McGregor, G. On the science-policy bridge: Do spatial heat vulnerability assessment studies influence policy? Int. J. Environ. Res. Public Health 2015, 12, 13321–13349. [Google Scholar] [CrossRef] [PubMed]
- Mees, H.L.P.; Driessen, P.P.J.; Runhaar, H.A.C. “Cool” governance of a “hot” climate issue: Public and private responsibilities for the protection of vulnerable citizens against extreme heat. Reg. Environ. Chang. 2015, 6, 1–15. [Google Scholar] [CrossRef]
- Sampson, N.R.; Gronlund, C.J.; Buxton, M.A.; Catalano, L.; White-Newsome, J.L.; Conlon, K.C.; O’Neill, M.S.; McCormick, S.; Parker, E.A. Staying cool in a changing climate: Reaching vulnerable populations during heat events. Global Environ. Chang. 2013, 2, 475–484. [Google Scholar] [CrossRef] [PubMed]
- Lissner, T.K.; Holsten, A.; Walther, C.; Kropp, J.P. Towards sectoral and standardised vulnerability assessments: The example of heatwave impacts on human health. Clim. Chang. 2012, 112, 687–708. [Google Scholar] [CrossRef]
- Reid, C.E.; Mann, J.K.; Alfasso, R.; English, P.B.; King, G.C.; Lincoln, R.A.; Margolis, H.G.; Dan, J.R.; Sabato, J.E.; West, N.L. Evaluation of a heat vulnerability index on abnormally hot days: An environmental public health tracking study. Environ. Health Perspect. 2012, 120, 715–720. [Google Scholar] [CrossRef] [PubMed]
- Wolf, T.; McGregor, G.; Analitis, A. Performance assessment of a heat wave vulnerability index for greater London, United Kingdom. Weather. Clim. Soc. 2014, 6, 32–46. [Google Scholar] [CrossRef]


| Author and Year | Study Area | Spatial Unit | Number of Fragile Groups | Approach |
|---|---|---|---|---|
| Vescovi et al., 2005 [14] | Quebec, Canada | census subdivision | 4 | Overlay/EW |
| Reid et al., 2009 [1] | USA | census tract | 7 | Overlay/PCA |
| Rinner et al., 2010 [15] | Toronto, Canada | census tract | 12 | Overlay/MCA |
| Tomlinson et al., 2011 [16] | Birmingham, UK | 641 census areas | 2 | Overlay/EW |
| Hondula et al., 2012 [17] | Philadelphia, USA | zip code area | 8 | Overlay/PCA |
| Chuang, 2012 [18] | Phoenix, USA | census tract | 4 | Overlay/EW |
| Loughnan et al., 2012 [19] | Melbourne, Australia | postal area | 3 | Overlay/RA |
| Johnson et al., 2012 [20] | Chicago, USA | census block group | 14 | Overlay/PCA |
| Wolf et al., 2013 [8] | London, UK | 4765 census districts | 5 | Overlay/PCA |
| Aubrecht et al., 2013 [21] | National Capital Region, USA | 92,000 census blocks | 5 | Overlay/EW |
| Harlan et al., 2013 [22] | Maricopa, USA | census block group | 7 | Overlay/PCA |
| Depietri et al., 2013 [23] | Cologne area, Germany | 85 districts | 3 | Overlay/EW |
| Maier et al., 2014 [24] | Georgia, USA | county | 7 | Overlay/PCA |
| Dong et al., 2014 [25] | Beijing, China | 319 sub-districts | 2 | Overlay/EW |
| Zhu et al., 2014 [26] | Guangdong, China | 124 counties | 6 | Overlay/ES |
| Loughnan et al., 2014 [7] | Australian capital cities | SA, LGA | 4 | Overlay/RA |
| Chak et al., 2015 [27] | Vancouver, Canada | 60 m pixel | 8 | Overlay/EW |
| El-Zein et al., 2015 [28] | Sydney, Australia | 15 LGA | 6 | Overlay/MCA |
| Weber et al., 2015 [29] | Philadelphia, USA | census block | 4 | Overlay/EW |
| Aminipouri et al., 2016 [2] | Vancouver, Canada | 105 census areas | 8 | Overlay/RA |
| Macnee et al., 2016 [9] | Osaka, Japan | 1904 census districts | 6 | Overlay/PCA |
| Li et al., 2016 [30] | Tibet, China | 73 counties | 5 | Overlay/PCA |
| Luis et al., 2016 [31] | Santiago de, Chile | 277 census tracts | 6 | Overlay/PCA |
| Christenson et al., 2017 [32] | Milwaukee and Wisconsin, USA | census block groups | 7 | Overlay/EW |
| Azhar et al., 2017 [33] | India | 640 districts | 7 | Overlay/PCA |
| Kim et al., 2017 [34] | Korea | 232 counties | 5 | Overlay/RA |
| Méndez-Lázaro et al., 2018 [35] | San Juan, Puerto Rico | 227 census tracts | 8 | Overlay/EW |
| Voelkel et al., 2018 [36] | Portland, USA | census block group | 6 | Overlay/CA |
| Mushore et al., 2018 [11] | Harare, Zimbabwe | 30 m pixel | 4 | Overlay/EW |
| Nayak et al., 2018 [37] | New York State, USA | 2751 census tracts | 9 | Overlay/PCA |
| Ho et al., 2018 [38] | Canada | census district | 8 | Overlay/MCA |
| Item | Indicators | Detail | References Used Similar Indicator |
|---|---|---|---|
| Exposure | Land surface temperature (LST) | a 3-day average LST map of Sydney | [15,16,27] |
| Sensitivity | Infants | Density of infants (0–4) | [7,31] |
| Elderly people | Density of elderly people (>65) | [3,30] | |
| Ethnicity | Density of people not born in Australian | [2,22] | |
| Low education people | Density of people with low levels of education | [9,15] | |
| New arrival | Density of people who arrived in Australian after 2014 | [18,22] | |
| Language barrier | Density of people with dysfluent English | [7,28] | |
| Low income people | Density of people with low income | [11,27] | |
| Persons with disability | Density of people that core activity need for assistance | [31,45] | |
| Isolated people | Density of people usually living alone | [1,9] | |
| Adaptive capacity | Traffic convenience | Density of dwelling have more than one motor vehicles | [7,31] |
| Internet access | Density of dwelling have internet access from dwelling | [28,31] | |
| Proximity to woody vegetation | Number of woody pixels around each pixel | [2,9] | |
| Proximity to water bodies | Number of water body pixels around each pixel | [7,9] |
| SA2 | Pixel Counts | Basic Statistics of Pixels’ GHVI Scores in Each SA2 | |||||
|---|---|---|---|---|---|---|---|
| Minimum | Maximum | Mean | Standard Deviation | CV | Range | ||
| Manly-Fairlight | 7328 | 6.97 | 52.17 | 35.87 | 10.29 | 28.70 | 45.20 |
| Cronulla-Kurnell-Bundeena | 27,584 | 4.79 | 56.38 | 36.60 | 9.35 | 25.54 | 51.60 |
| Peakhurst-Lugarno | 8208 | 11.71 | 72.96 | 58.78 | 9.26 | 15.75 | 61.25 |
| Chipping Norton-Moorebank | 16,000 | 37.08 | 81.05 | 63.47 | 10.19 | 16.05 | 43.96 |
| Rosemeadow-Glen Alpine | 53,440 | 13.31 | 81.23 | 63.88 | 8.25 | 12.92 | 67.92 |
| Cabramatta-Lansvale | 8512 | 37.69 | 92.18 | 78.06 | 12.43 | 15.93 | 54.50 |
| Canley Vale-Canley Heights | 6016 | 58.09 | 89.68 | 83.03 | 6.52 | 7.85 | 31.59 |
| Auburn-South | 2688 | 54.43 | 90.71 | 79.15 | 6.38 | 8.07 | 36.28 |
| Lidcombe | 7120 | 53.49 | 90.11 | 75.43 | 5.04 | 6.68 | 36.63 |
| Liverpool | 7040 | 54.26 | 90.57 | 82.12 | 5.84 | 7.11 | 36.31 |
| Item | Minimum | Maximum | Mean |D| | Standard Deviation |
|---|---|---|---|---|
| GHVI-HVI (Infants) | −13.78 | 25.70 | 10.04 | 3.67 |
| GHVI-HVI (Elderly) | −36.26 | 14.89 | 4.08 | 4.31 |
| GHVI-HVI (Ethnicity) | −17.89 | 9.71 | 1.97 | 2.13 |
| GHVI-HVI (Low education) | −4.27 | 34.23 | 13.31 | 3.72 |
| GHVI-HVI (New arrival) | −17.89 | 29.80 | 3.56 | 4.81 |
| GHVI-HVI (Language barrier) | −12.88 | 31.60 | 12.24 | 4.02 |
| GHVI-HVI (Low income) | −20.56 | 14.21 | 1.82 | 1.38 |
| GHVI-HVI (Disability) | −17.73 | 30.15 | 10.74 | 4.27 |
| GHVI-HVI (Isolated) | −39.35 | 26.25 | 4.29 | 4.38 |
| SA2 | Average HVI Score of Each SA2 | General HVI | ||||||||
|---|---|---|---|---|---|---|---|---|---|---|
| Infants | Elderly | Ethnicity | Low Education | New Arrival | Language Barrier | Low Income | Disability | Isolated | ||
| Potts Point-Woolloomooloo | 33.79 | 77.70 | 52.19 | 28.97 | 42.49 | 27.81 | 43.07 | 57.10 | 82.01 | 52.50 |
| Castle Hill-East | 48.70 | 87.68 | 63.38 | 46.23 | 58.16 | 46.91 | 64.61 | 78.59 | 65.17 | 67.44 |
| Woollahra | 49.78 | 83.32 | 51.76 | 34.15 | 45.18 | 33.76 | 51.03 | 46.44 | 56.29 | 53.84 |
| Ashfield | 61.46 | 85.64 | 76.24 | 60.76 | 67.55 | 63.32 | 76.11 | 74.97 | 70.63 | 77.05 |
| Kensington (NSW) | 54.36 | 74.65 | 73.07 | 46.29 | 74.41 | 49.00 | 85.11 | 54.69 | 64.41 | 68.55 |
| Croydon Park-Enfield | 60.29 | 85.02 | 71.71 | 61.89 | 64.03 | 58.63 | 74.83 | 67.96 | 70.92 | 74.34 |
| Belmore-Belfield | 62.48 | 83.99 | 74.15 | 67.33 | 66.61 | 63.96 | 77.59 | 72.75 | 72.61 | 50.88 |
| Concord-Mortlake-Cabarita | 57.06 | 83.27 | 65.76 | 54.46 | 58.93 | 51.25 | 68.59 | 61.05 | 65.30 | 68.16 |
| Pyrmont-Ultimo | 55.04 | 67.58 | 82.87 | 42.54 | 82.87 | 63.75 | 82.42 | 45.49 | 63.69 | 69.65 |
| Bondi Junction-Waverly | 55.85 | 82.33 | 59.95 | 39.20 | 52.20 | 39.40 | 57.11 | 61.59 | 60.02 | 60.97 |
| Item | Pixel Counts | Percent |
|---|---|---|
| SHHA: Infants | 4544 | 1.30% |
| SHHA: Elderly | 276,192 | 79.28% |
| SHHA: Ethnicity | 70,768 | 20.31% |
| SHHA: Low education | 30,512 | 8.76% |
| SHHA: New arrival | 12,080 | 3.47% |
| SHHA: Language barrier | 31,088 | 8.92% |
| SHHA: Low income | 144,848 | 41.58% |
| SHHA: Disability | 44,896 | 12.89% |
| SHHA: Isolated | 46,768 | 13.42% |
| GHHA | 113,088 | 32.46% |
| THHA | 348,384 | 100.00% |
© 2018 by the authors. Licensee MDPI, Basel, Switzerland. This article is an open access article distributed under the terms and conditions of the Creative Commons Attribution (CC BY) license (http://creativecommons.org/licenses/by/4.0/).
Share and Cite
Zhang, W.; McManus, P.; Duncan, E. A Raster-Based Subdividing Indicator to Map Urban Heat Vulnerability: A Case Study in Sydney, Australia. Int. J. Environ. Res. Public Health 2018, 15, 2516. https://doi.org/10.3390/ijerph15112516
Zhang W, McManus P, Duncan E. A Raster-Based Subdividing Indicator to Map Urban Heat Vulnerability: A Case Study in Sydney, Australia. International Journal of Environmental Research and Public Health. 2018; 15(11):2516. https://doi.org/10.3390/ijerph15112516
Chicago/Turabian StyleZhang, Wei, Phil McManus, and Elizabeth Duncan. 2018. "A Raster-Based Subdividing Indicator to Map Urban Heat Vulnerability: A Case Study in Sydney, Australia" International Journal of Environmental Research and Public Health 15, no. 11: 2516. https://doi.org/10.3390/ijerph15112516
APA StyleZhang, W., McManus, P., & Duncan, E. (2018). A Raster-Based Subdividing Indicator to Map Urban Heat Vulnerability: A Case Study in Sydney, Australia. International Journal of Environmental Research and Public Health, 15(11), 2516. https://doi.org/10.3390/ijerph15112516