Abstract
The magnitude of excess mortality risk due to exposures to heavy air pollution during the red alert periods in Beijing remains unknown. A health impact assessment tool combined with the PM2.5-mortality relationship was applied to estimate the number of excess deaths due to high air pollution exposure during two red alert periods in Beijing, China in December 2015. Daily PM2.5 concentration increased from 80.2 µg/m3 to 159.8 µg/m3 during the first red alert period and from 61.9 µg/m3 to 226 µg/m3 during the second period in 2015 when compared to daily PM2.5 concentrations during the same calendar date of 2013 and 2014. It was estimated that 26 to 42 excessive deaths (including 14 to 34 cardiovascular deaths, and four to 16 respiratory deaths) occurred during the first period, and 40 to 65 excessive deaths (22 to 53 cardiovascular deaths, and six to 13 respiratory deaths) occurred during the second period. The results show that heavy smog may have substantially increased the mortality risk in Beijing, suggesting more stringent air pollution controlling measures should be implemented to protect the public health.
1. Introduction
Air pollution is an important public health issue in China. It has been estimated that air pollution has resulted in more than 1.6 million deaths in China each year (4400 each day), accounting for 17% of the nation’s annual deaths [1]. This places air pollution as the third leading cause of death only after cancer and heart disease [1].
Air pollution in Beijing has gained much attention in recent years due to increased energy consumption, emissions, construction activities and urbanization [2]. Blue sky has been seldomly seen in this city [3]. Episodes of intense atmospheric haze have been frequently reported in recent years [3,4]. High levels of air pollution, especially fine particles <2.5 μm in diameter (PM2.5), have been responsible for the decreasing air quality and visibility [5,6], and have been associated with solar ultraviolet radiation reaching the earth’s surface [7,8], the nutrient balance and acidity of the soil [9,10] and global climate change [11].
According to the technical regulation on ambient air quality index (AQI), the AQI level is based on six atmospheric pollutants, including sulfur dioxide, nitrogen dioxide, carbon monoxide, ozone, PM10 and PM2.5. The AQI is divided into six levels, namely, 0–50, 51–100, 101–150, 151–200, 201–300, and greater than 300. When the AQI value is less than 100, the air is deemed to have no effect on daily life, but when the AQI is larger than 200 (equivalent to a PM2.5 concentration of larger than 150 μg/m3), it can result in heavy adverse health effects. In 2013, the environmental authorities in Beijing instituted a four-tier warning system to reduce emissions during episodes of intense smog [12]. When the air quality index is expected to be ≥200 for at least 72 h, a red alert, the highest pollution level, will be issued [12]. At this highest warning level, road traffic is restricted with alternate-day driving laws (based on license plate), factory work is reduced or halted, and schools are closed. On 7 December 2015, the Beijing government issued the first red alert for a five-day period during 8–12 December [13]. A second red alert warning was issued only one week later, 19–22 December 2015, due to excessive levels of smog [14].
Although the association between PM2.5 and mortality has been demonstrated in a great number of studies [15,16], the extent of the acute adverse health effects of air pollution during these intense smog periods remained largely unknown. As such, we applied a health impact assessment based on the PM2.5-mortality relationship to estimate the excess deaths associated with the heavy smog episodes in Beijing [17,18].
2. Materials and Methods
2.1. Study Setting and Air Pollution Data
Beijing is the capital of China with a population of 21.7 million in 2015 [19]. It has a temperate climate with four distinct seasons. The summer is hot and humid, and the winter is cold and dry. The city is divided into 16 districts, which comprise rural, suburban, and urban locales. Six urban districts (Dongcheng, Xicheng, Haidian, Chaoyang, Fengtai and Shijingshan) were selected for this study, as they had higher air pollution levels than other districts and were more directly related to these two red alert episodes [14]. For example, during the first red alert period, the PM2.5 concentration was 111.31 μg/m3 in the six urban districts and 85.57 μg/m3 in the other districts of Beijing; and during the second period, the PM2.5 concentration was 120.81 μg/m3 in the six urban districts and 83.07 μg/m3 in the other districts of Beijing. According to the Beijing statistical yearbook data, the six urban districts of Beijing covered 59.1% population of the whole of Beijing City [19].
Two red alert episodes were observed in this city on 8–12 December 2015 and 19–22 December 2015. We obtained the daily concentrations of ambient PM2.5 during the red alert periods and two different reference periods. The first reference (I) was the same calendar dates of 2013 and 2014. The second reference (II) was the maximum daily PM2.5 concentration of 75 μg/m3 regulated by the Chinese Ambient Air quality Standard [20].
2.2. Estimating Mortality Effects
A health impact assessment was conducted to estimate the excess mortality during the two periods using the method proposed by the World Health Organization (WHO) [21]. Specifically, we used population of the six urban districts of Beijing city, baseline mortality, PM2.5 concentration during the red alert periods and during the reference periods in the six urban districts, and an exposure-response function. The WHO has reported that the PM2.5-mortality relationship is approximately linear [22], our analysis was thus based on the linear relationship between PM2.5 and mortality, which was retrieved from the existing short-term PM2.5-mortality association studies among the population of Beijing, China [23,24]. For example, in one study, each 10 μg/m3 increase in daily PM2.5 concentration in Beijing was associated with a 0.28% increase in all-cause mortality, a 0.32% increase in cardiovascular mortality, and a 0.31% increase in respiratory mortality [25]. In another study, Guo et al. [26] found that the relative risk for each 94 μg/m3 PM2.5 concentration increase was 2.5% (95% CI: 0.6–4.5%) in Beijing. Hence, we calculated a number of estimates of the death counts based on the PM2.5-mortality associations obtained from previous studies, which have been employed in one recent study [27].
2.3. Differences in PM2.5 Concentrations
The differences in the PM2.5 concentrations during the red alert periods and two different reference periods were compared. PM2.5 concentrations levels were collected from the air monitoring stations in Beijing (their locations were shown in Figure 1). The air monitoring data from nine fixed air monitoring stations in the six urban districts were used in this study. These stations were believed to be representative of the air pollution situation in the urban areas of Beijing, and have been used in one previous study [27]. These daily air pollution data were publicly accessible (http://www.cnemc.cn/). Besides PM2.5, other air pollutants, such as sulphur dioxide (SO2) and nitrogen dioxide (NO2) and weather factors were also closely related to mortality in previous studies [23,28]. To clarify the effects of ambient PM2.5, we also collected the data of these variables and examined whether there were any differences between the red alert episodes and reference periods.
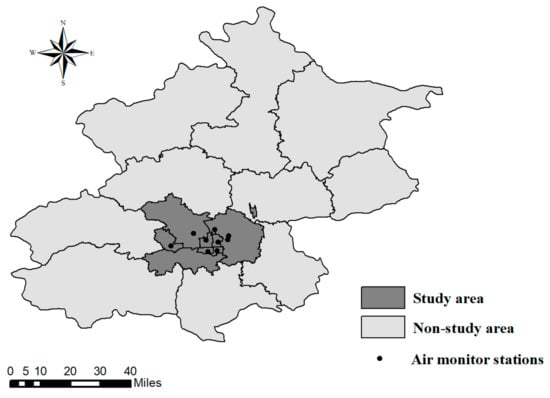
Figure 1.
The location of air monitoring stations in the six urban districts of Beijing.
2.4. Baseline Number of Mortality
Based on a population of 12.82 million residents [19] and an overall annual mortality of seven per 1000 in the six urban districts of Beijing in 2015, there was a daily average of 246 overall mortalities. About 43.74% and 12.32% of the overall mortalities were cardiovascular and respiratory diseases in Beijing [29], thus, there were 108 cardiovascular and 30 respiratory deaths each day in the six urban districts of Beijing city. This study was approved by the Institutional Review Board of the Guangdong Provincial Center for Disease Control and Prevention. Informed consent was not required because we did not use any original health information for this analysis.
2.5. Statistical Analysis
The relative risk and excessive risk of the associations were firstly transformed into the corresponding regression coefficient (β) for each one μg/m3 increase in PM2.5 using the following Equation (1):
β = ln(RR)/unit = ln(1 + ER)/unit;
Then the 95% CI for β (βlower and βupper) were calculated using Equations (2) and (3):
βlower = ln(RRlower)/unit = ln(1 + ERlower)/unit,
βupper = ln(RRupper)/unit = ln(1 + ERupper)/unit.
We then estimated the excess deaths due to the high PM2.5 concentrations during the red alert periods using the following Equation (4) [30]:
where Δmortality refers to the estimated excessive deaths, and ΔPC is the differences in ambient PM2.5 concentrations.
Δmortality = baseline mortality * [exp(β * ΔPC) − 1]
3. Results
A comparison of PM2.5 concentration during the red alert and two different reference periods in Beijing is summarized in Table 1. During the two red alert periods, Beijing experienced some of the worst air quality on record. The mean PM2.5 concentration during the first red alert period was 159.75 μg/m3, while the second red alert period had a mean PM2.5 concentration of 226.04 μg/m3. These PM2.5 concentration levels were six and eight times greater, respectively, than the WHO guideline of 25 μg/m3 for safe 24-h PM2.5 concentration level. During the first red alert period, PM2.5 concentration levels were 1.99 times greater (159.75 vs. 99.10 μg/m3) compared to the Reference I, and 2.13 times greater (159.75 vs. 75.00 μg/m3) when compared to the national PM2.5 concentration standard (Reference II). During the second red alert period, PM2.5 concentrations were 3.65 times greater (226.04 vs. 61.92 μg/m3) compared with Reference I, and 3.01 times greater (226.04 vs. 75.00 μg/m3) when compared with Reference II. There was not a significant increase in the concentrations of SO2 during the two red alert periods; however, NO2 concentrations increased significantly.

Table 1.
Comparison of the mean PM2.5 concentrations between the red alert and reference periods in the six urban districts of Beijing, China.
Table 2 illustrates the excess mortality as a result of exposure to the high PM2.5 concentration during the two smog episodes in Beijing. We found that, during the first red alert period (8–12 December 2015), the excessive all-cause mortality ranged from 26 to 42 deaths using the same date of prior two years as the reference period (Reference I), and 25 to 39 deaths according to Reference II. The estimated number of excess cardiovascular deaths ranged from 14 to 34 using Reference I and from 13 to 32 using Reference II. The estimated excessive respiratory mortality ranged from 4 to 16 using Reference I, and from 4 to 15 using Reference II.
Table 2.
Estimated excess mortality due to the severe smog events declared as the red-alert periods (8–12 and 19–22 December 2015) in Beijing.
Excess deaths were also estimated during the second red alert period (19–22 December 2015) in Beijing. We found that, during the 4-day heavy pollution period, the increase in all-cause mortality ranged from 40 to 65 deaths based on Reference I, and 35 to 55 deaths based on Reference II. The increase in cardiovascular deaths was estimated to range from 22 to 53 (Reference I), and from 19 to 45 (Reference II); the estimated increase in respiratory deaths ranged from 6 to 13 (Reference I), and from 5 to 11 (Reference II).
For the sensitivity analysis (Table S1), all analyses were repeated using the data of the whole city instead of the six urban districts of Beijing. The results were similar. During the first red alert period, the excessive all-cause mortality ranged from 45 to 71 deaths using Reference I, and 42 to 67 deaths according to Reference II. The estimated number of excess cardiovascular deaths ranged from 24 to 58 using Reference I and from 22 to 54 using Reference II. The estimated excessive respiratory mortality ranged from 6 to 27 using Reference I, and from 6 to 26 using Reference II. During the the second red alert period, the increase in all-cause mortality ranged from 68 to 109 deaths based on Reference I, and 59 to 94 deaths based on Reference II. The increase in cardiovascular deaths was estimated to range from 36 to 89 (Reference I), and from 31 to 76 (Reference II); the estimated increase in respiratory deaths ranged from 10 to 42 (Reference I), and from 8 to 36 (Reference II).
4. Discussion
The analyses presented here indicated the magnitude of the mortality effects linked with Beijing’s lethal smog in December 2015, which resulted in the first two occasions of the red alert warning system that was instituted in 2013. This suggests that substantial excess mortality risk was associated with the high levels of particulate matter pollution during the red alert periods in Beijing. Our analyses estimated that about 26–42 and 40–65 excessive mortalities could be attributable to the high PM2.5 exposures during the two smog episodes, corresponding to about 2.1–3.4% and 4.1–6.6% of the daily mortalities in the study area.
China’s rapid economic expansion over the last 30 years has been accompanied by increasing air pollution concerns and adverse health effects, which has been a focus of international attention in recent years [33,34,35]. Accumulating evidence has been available on the effects of particulate matter pollution on mortality in the past years [36,37]. Our study estimated the number of deaths associated with the extreme levels of particulate air pollution during the heavy smog episodes in December 2015. The findings are consistent with previous studies that estimated mortality risk during periods of excessive air pollution. For example, it was estimated that about 12,000 excess deaths occurred in London, England between December 1952 and February 1953 due to the acute and prolonged effects of elevated smog levels [38]. Similarly, heavy smog in northern China during January 2013 also resulted in excessive mortality and morbidity [4]. Several mechanisms have been proposed to explain the acute mortality effects of ambient PM2.5 exposure. PM2.5 have large surface areas and can carry lots of toxic stuffs, entering the respiratory tract with airflow, accumulating there by diffusion, damaging other parts of the body through air exchange in the lungs [39]. This was illustrated by a study which examined the air quality improvement measures during the Beijing Olympics. Rich et al. reported that the improved air quality was responsible for the significant changes in the biomarkers related to the systemic inflammation [40]. Some of the fine particles even had the potential to cross the epithelium and enter the systemic circulation, inducing inflammation at both epithelial and interstitial sites, as well as reach other target sites [41,42]. Individuals with existing cardiovascular and respiratory conditions may be more vulnerable to these effects [43,44].
There were several limitations of this study. First, we estimated only short-term mortality effects due to exposure to high levels of ambient PM2.5 during the red alert periods. Long-term mortality effects of PM2.5, however could not be estimated due to a lack of the necessary data. Thus, the reported results might have resulted in under-estimation of the mortality effects of the PM2.5. Secondly, we used mortality as the health outcome for this analysis, which might have underestimated the health impacts of high PM2.5 concentrations during the heavy smog episodes in Beijing, because the health effects of air pollution exposure were related to several medical conditions that were not evaluated in our analysis, such as hospital admissions, emergency department visits, and symptom aggravation, among others [38]. Third, we obtained the estimated effect magnitudes from multiple studies. There studies employed different modelling methods to examine the association between PM2.5 and mortality [2,25,26,31,32], making it difficult to compare between studies [45]. It should be noted that we obtained mortality risk estimates for PM2.5 from multiple studies conducted in Beijing to account for the variability in estimates. These effect estimates were based on daily routine activity patterns of Beijing residents; however, the residents were advised to avoid normal outdoor activities during the red alert periods; so the actual exposure level of the population might be lower than the outdoor monitoring concentrations, it was thus possible that our analysis had over-estimated the adverse health effects.
5. Conclusions
In summary, the results from this study suggests that substantial mortality risk is associated with excessive PM2.5 concentration levels during the red alert episodes in Beijing. These findings support that policies and strategies should be adopted to reduce air pollution in Beijing to prevent mortality and morbidity.
Supplementary Materials
The following are available online at www.mdpi.com/1660-4601/15/1/50/s1, Table S1: Sensitivity analysis on excess mortality due to the severe smog events declared as the red-alert periods (8–12 and 19–22 December 2015) in the whole Beijing city.
Acknowledgments
This work was supported by the Medical Science and Technology Research Foundation of Guangdong Province (No. A2016250, 2016A020223008 and No. A2015184), National Natural Science Foundation of China (No. 81202176) and Key Special Project of National Key Research and Development Plan Program (2016YFC0207000).
Author Contributions
Weilin Zeng, Yue Li, Hualiang Lin conceived and designed the study; Weilin Zeng, Lingling Lang, Yue Li, Hualiang Lin, Yonghui Zhang, Tao Liu, Jianpeng Xiao, Xing Li, Lingchuan Guo, Yanjun Xu, Xiaojun Xu, Lauren Arnold, Erik J. Nelson contributed to acquisition of data, or analysis and interpretation of data; Weilin Zeng, Zhengmin Qian and Wenjun Ma were involved in drafting the manuscript.
Conflicts of Interest
The authors declare no conflict of interests.
References
- Rohde, R.A.; Muller, R.A. Air pollution in China: Mapping of concentrations and sources. PLoS ONE 2015, 10, e0135749. [Google Scholar] [CrossRef] [PubMed]
- Li, P.; Xin, J.; Wang, Y.; Li, G.; Pan, X.; Wang, S.; Cheng, M.; Wen, T.; Wang, G.; Liu, Z. Association between particulate matter and its chemical constituents of urban air pollution and daily mortality or morbidity in Beijing City. Environ. Sci. Pollut. Res. 2014, 22, 358–368. [Google Scholar] [CrossRef] [PubMed]
- Han, B.; Zhang, R.; Yang, W.; Bai, Z.; Ma, Z.; Zhang, W. Heavy haze episodes in Beijing during January 2013: Inorganic ion chemistry and source analysis using highly time-resolved measurements from an urban site. Sci. Total Environ. 2016, 544, 319–329. [Google Scholar] [CrossRef] [PubMed]
- Zhou, M.; He, G.; Fan, M.; Wang, Z.; Liu, Y.; Ma, J.; Ma, Z.; Liu, J.; Liu, Y.; Wang, L. Smog episodes, fine particulate pollution and mortality in China. Environ. Res. 2015, 136, 396–404. [Google Scholar] [CrossRef] [PubMed]
- Zhang, Y.; Shao, M.; Cheng, C. Quantitative relationship between visibility and mass concentration of PM2.5 in Beijing. J. Environ. Sci. 2006, 18, 475–481. [Google Scholar]
- Tao, J.; Gao, J.; Zhang, L.; Wang, H.; Qiu, X.; Zhang, Z.; Wu, Y.; Chai, F.; Wang, S. Chemical and optical characteristics of atmospheric aerosols in Beijing during the Asia-Pacific Economic Cooperation China 2014. Atmos. Environ. 2016, 144, 8–16. [Google Scholar] [CrossRef]
- Tzanis, C.; Tsivola, E.; Efstathiou, M.; Varotsos, C. Forest fires pollution impact on the solar UV irradiance at the ground. Fresenius Environ. Bull. 2009, 18, 2151–2158. [Google Scholar]
- Varotsos, C.; Efstathiou, M.; Tzanis, C.; Deligiorgi, D. On the limits of the air pollution predictability: The case of the surface ozone at Athens, Greece. Environ. Sci. Pollut. Res. Int. 2012, 19, 295–300. [Google Scholar] [CrossRef] [PubMed]
- Yun, H.; Yi, S.; Kim, Y. Dry deposition fluxes of ambient particulate heavy metals in a small city, Korea. Atmos. Environ. 2002, 36, 5449–5458. [Google Scholar] [CrossRef]
- Amanollahi, J.; Tzanis, C.; Abdullah, A.M.; Ramli, M.F.; Pirasteh, S. Development of the models to estimate particulate matter from thermal infrared band of Landsat Enhanced Thematic Mapper. Int. J. Environ. Sci. Technol. 2013, 10, 1245–1254. [Google Scholar] [CrossRef]
- Haywood, J.; Boucher, O. Estimates of the direct and indirect radiative forcing due to tropospheric aerosols: A review. Rev. Geophys. 2000, 38, 513–543. [Google Scholar] [CrossRef]
- Xia, B.; Qian, X.; Wang, Y.; Gao, H.; Yin, H.; Zhang, R.; Zhou, M. Multisensor Early Warning System Applied to Environmental Management. Environ. Eng. Sci. 2015, 32, 263–272. [Google Scholar] [CrossRef]
- Wong, E. Beijing issues red alert over air pollution for the first time. New York Times, 8 December 2015. [Google Scholar]
- Cheng, N.; Zhang, D.; Tian, C.; Shi, A.; Feng, S.; Liu, B.; Ben-Dong, Z.; Qin, W.; Qian, L.; Wang, X. Concentration Characteristics of PM2.5 in Beijing during Two Red Alert Periods. Environ. Sci. 2016. (In Chinese) [Google Scholar] [CrossRef]
- Sun, S.; Cao, P.; Chan, K.-P.; Tsang, H.; Wong, C.-M.; Thach, T.-Q. Temperature as a modifier of the effects of fine particulate matter on acute mortality in Hong Kong. Environ. Pollut. 2015, 205, 357–364. [Google Scholar] [CrossRef] [PubMed]
- Broome, R.A.; Cope, M.E.; Goldsworthy, B.; Goldsworthy, L.; Emmerson, K.; Jegasothy, E.; Morgan, G.G. The mortality effect of ship-related fine particulate matter in the Sydney greater metropolitan region of NSW, Australia. Environ. Int. 2016, 87, 85–93. [Google Scholar] [CrossRef] [PubMed]
- Tao, J.; Zhang, L.; Zhang, Z.; Huang, R.; Wu, Y.; Zhang, R.; Cao, J.; Zhang, Y. Control of PM2.5 in Guangzhou during the 16th Asian Games period: Implication for hazy weather prevention. Sci. Total Environ. 2015, 508, 57–66. [Google Scholar] [PubMed]
- Lin, H.; Zhang, Y.; Liu, T.; Xiao, J.; Xu, Y.; Xu, X.; Qian, Z.; Tong, S.; Luo, Y.; Zeng, W.; et al. Mortality reduction following the air pollution control measures during the 2010 Asian Games. Atmos. Environ. 2014, 91, 24–31. [Google Scholar] [CrossRef]
- Beijing Statistical Yearbook 2016; China Statistical Pub. House: Beijing, China, 2016. (In Chinese)
- Ministry of Environmental Protection of China. Ambient Air Quality Standards (GB 3095-2012); Ministry of Environmental Protection of China: Beijing, China, 2012. (In Chinese)
- World Health Organization. Quantification of Health Effects of Exposure to Air Pollution: Report on a WHO Working Group; World Health Organization: Bilthoven, The Netherlands, 2001. [Google Scholar]
- World Health Organization. Health Aspects of Air Pollution with Particulate Matter, Ozone and Nitrogen Dioxide: Report on a WHO Working Group; World Health Organization: Bonn, Germany, 2003. [Google Scholar]
- Chen, R.; Kan, H.; Chen, B.; Huang, W.; Bai, Z.; Song, G.; Pan, G. Association of Particulate Air Pollution with Daily Mortality the China Air Pollution and Health Effects Study. Am. J. Epidemiol. 2012, 175, 1173–1181. [Google Scholar] [CrossRef] [PubMed]
- Lin, H.; Tao, J.; Du, Y.; Liu, T.; Qian, Z.; Tian, L.; Di, Q.; Rutherford, S.; Guo, L.; Zeng, W.; et al. Particle size and chemical constituents of ambient particulate pollution associated with cardiovascular mortality in Guangzhou, China. Environ. Pollut. 2016, 208, 758–766. [Google Scholar] [CrossRef] [PubMed]
- Li, T.; Cui, L.; Chen, C.; Sun, Q.; Liu, Y.; Wang, Q.; Du, Y.; Du, Z.; Xu, D. Air pollutant PM2.5 related excess mortality risk assessment in Beijing, January 2013. Dis. Surveill. 2015, 30, 668–671. (In Chinese) [Google Scholar]
- Guo, Y.; Li, S.; Tian, Z.; Pan, X.; Zhang, J.; Williams, G. The burden of air pollution on years of life lost in Beijing, China, 2004–2008: Retrospective regression analysis of daily deaths. BMJ 2013, 347. [Google Scholar] [CrossRef] [PubMed]
- Lin, H.; Liu, T.; Fang, F.; Xiao, J.; Zeng, W.; Li, X.; Guo, L.; Tian, L.; Schootman, M.; Stamatakis, K.A.; et al. Mortality benefits of vigorous air quality improvement interventions during the periods of APEC Blue and Parade Blue in Beijing, China. Environ. Pollut. 2017, 220, 222–227. [Google Scholar] [CrossRef] [PubMed]
- Kan, H.; London, S.J.; Chen, G.; Zhang, Y.; Song, G.; Zhao, N.; Jiang, L.; Chen, B. Season, sex, age, and education as modifiers of the effects of outdoor air pollution on daily mortality in Shanghai, China: The Public Health and Air Pollution in Asia (PAPA) Study. Environ. Health Perspect. 2008, 116, 1183–1188. [Google Scholar] [CrossRef] [PubMed]
- Ma, W.; Zeng, W.; Zhou, M.; Wang, L.; Rutherford, S.; Lin, H.; Liu, T.; Zhang, Y.; Xiao, J.; Zhang, Y. The short-term effect of heat waves on mortality and its modifiers in China: An analysis from 66 communities. Environ. Int. 2015, 75, 103–109. [Google Scholar] [CrossRef] [PubMed]
- Lin, H.; Liu, T.; Xiao, J.; Zeng, W.; Li, X.; Guo, L.; Xu, Y.; Zhang, Y.; Vaughn, M.G.; Nelson, E.J.; et al. Quantifying short-term and long-term health benefits of attaining ambient fine particulate pollution standards in Guangzhou, China. Atmos. Environ. 2016, 137, 38–44. [Google Scholar] [CrossRef]
- Dong, F.; Mo, Y.; Li, G.; Xu, M.; Pan, X. Association between ambient PM10/PM2.5 levels and population mortality of circulatory diseases: A case-crossover study in Beijing. J. Peking Univ. 2013, 45, 398–404. [Google Scholar]
- Li, P.; Xin, J.; Wang, Y.; Wang, S.; Li, G.; Pan, X.; Liu, Z.; Wang, L. The acute effects of fine particles on respiratory mortality and morbidity in Beijing, 2004–2009. Environ. Sci. Pollut. Res. 2013, 20, 6433–6444. [Google Scholar] [CrossRef] [PubMed]
- Kan, H. Globalisation and environmental health in China. Lancet 2014, 384, 721–723. [Google Scholar] [CrossRef]
- Liu, M.; Huang, Y.; Ma, Z.; Jin, Z.; Liu, X.; Wang, H.; Liu, Y.; Wang, J.; Jantunen, M.; Bi, J. Spatial and temporal trends in the mortality burden of air pollution in China: 2004–2012. Environ. Int. 2017, 98, 75–81. [Google Scholar] [CrossRef] [PubMed]
- Hu, J.; Ying, Q.; Wang, Y.; Zhang, H. Characterizing multi-pollutant air pollution in China: Comparison of three air quality indices. Environ. Int. 2015, 84, 17–25. [Google Scholar] [CrossRef] [PubMed]
- Xie, R.; Sabel, C.E.; Lu, X.; Zhu, W.; Kan, H.; Nielsen, C.P.; Wang, H. Long-term trend and spatial pattern of PM2.5 induced premature mortality in China. Environ. Int. 2016, 97, 180–186. [Google Scholar] [PubMed]
- Zhang, C.; Ding, R.; Xiao, C.; Xu, Y.; Cheng, H.; Zhu, F.; Lei, R.; Di, D.; Zhao, Q.; Cao, J. Association between air pollution and cardiovascular mortality in Hefei, China: A time-series analysis. Environ. Pollut. 2017, 229, 790–797. [Google Scholar] [CrossRef] [PubMed]
- Bell, M.L.; Davis, D.L. Reassessment of the lethal London fog of 1952: Novel indicators of acute and chronic consequences of acute exposure to air pollution. Environ. Health Perspect. 2001, 109 (Suppl. S3), 389–394. [Google Scholar] [CrossRef] [PubMed]
- Xing, Y.F.; Xu, Y.H.; Shi, M.H.; Lian, Y.X. The impact of PM2.5 on the human respiratory system. J. Thorac. Dis. 2016, 8, E69–E74. [Google Scholar] [PubMed]
- Rich, D.Q.; Kipen, H.M.; Huang, W.; Wang, G.; Wang, Y.; Zhu, P.; Ohman Strickland, P.; Hu, M.; Philipp, C.; Diehl, S.R. Association between changes in air pollution levels during the Beijing Olympics and biomarkers of inflammation and thrombosis in healthy young adults. JAMA 2012, 307, 2068–2078. [Google Scholar] [CrossRef] [PubMed]
- Zhao, Y.; Wang, S.; Lang, L.; Huang, C.; Ma, W.; Lin, H. Ambient fine and coarse particulate matter pollution and respiratory morbidity in Dongguan, China. Environ. Pollut. 2017, 222, 126–131. [Google Scholar] [CrossRef] [PubMed]
- Lee, H.; Honda, Y.; Hashizume, M.; Guo, Y.L.; Wu, C.-F.; Kan, H.; Jung, K.; Lim, Y.-H.; Yi, S.; Kim, H. Short-term exposure to fine and coarse particles and mortality: A multicity time-series study in East Asia. Environ. Pollut. 2015, 207, 43–51. [Google Scholar] [CrossRef] [PubMed]
- Achilleos, S.; Kioumourtzoglou, M.-A.; Wu, C.-D.; Schwartz, J.D.; Koutrakis, P.; Papatheodorou, S.I. Acute effects of fine particulate matter constituents on mortality: A systematic review and meta-regression analysis. Environ. Int. 2017, 109, 89–100. [Google Scholar] [CrossRef] [PubMed]
- Lin, H.; Liu, T.; Xiao, J.; Zeng, W.; Li, X.; Guo, L.; Zhang, Y.; Xu, Y.; Tao, J.; Xian, H.; et al. Mortality burden of ambient fine particulate air pollution in six Chinese cities: Results from the Pearl River Delta study. Environ. Int. 2016, 96, 91–97. [Google Scholar] [CrossRef] [PubMed]
- Peng, R.D.; Dominici, F.; Louis, T.A. Model choice in time series studies of air pollution and mortality. J. Toxicol. Environ. Health A 2006, 169, 311–315. [Google Scholar] [CrossRef]
© 2017 by the authors. Licensee MDPI, Basel, Switzerland. This article is an open access article distributed under the terms and conditions of the Creative Commons Attribution (CC BY) license (http://creativecommons.org/licenses/by/4.0/).