
Environmental Drivers and Predicted Risk of Bacillary Dysentery in Southwest China


Abstract
1. Introduction
2. Materials and Methods
2.1. Data Collection and Management
2.2. Ethical Statement
2.3. Statistical Analysis
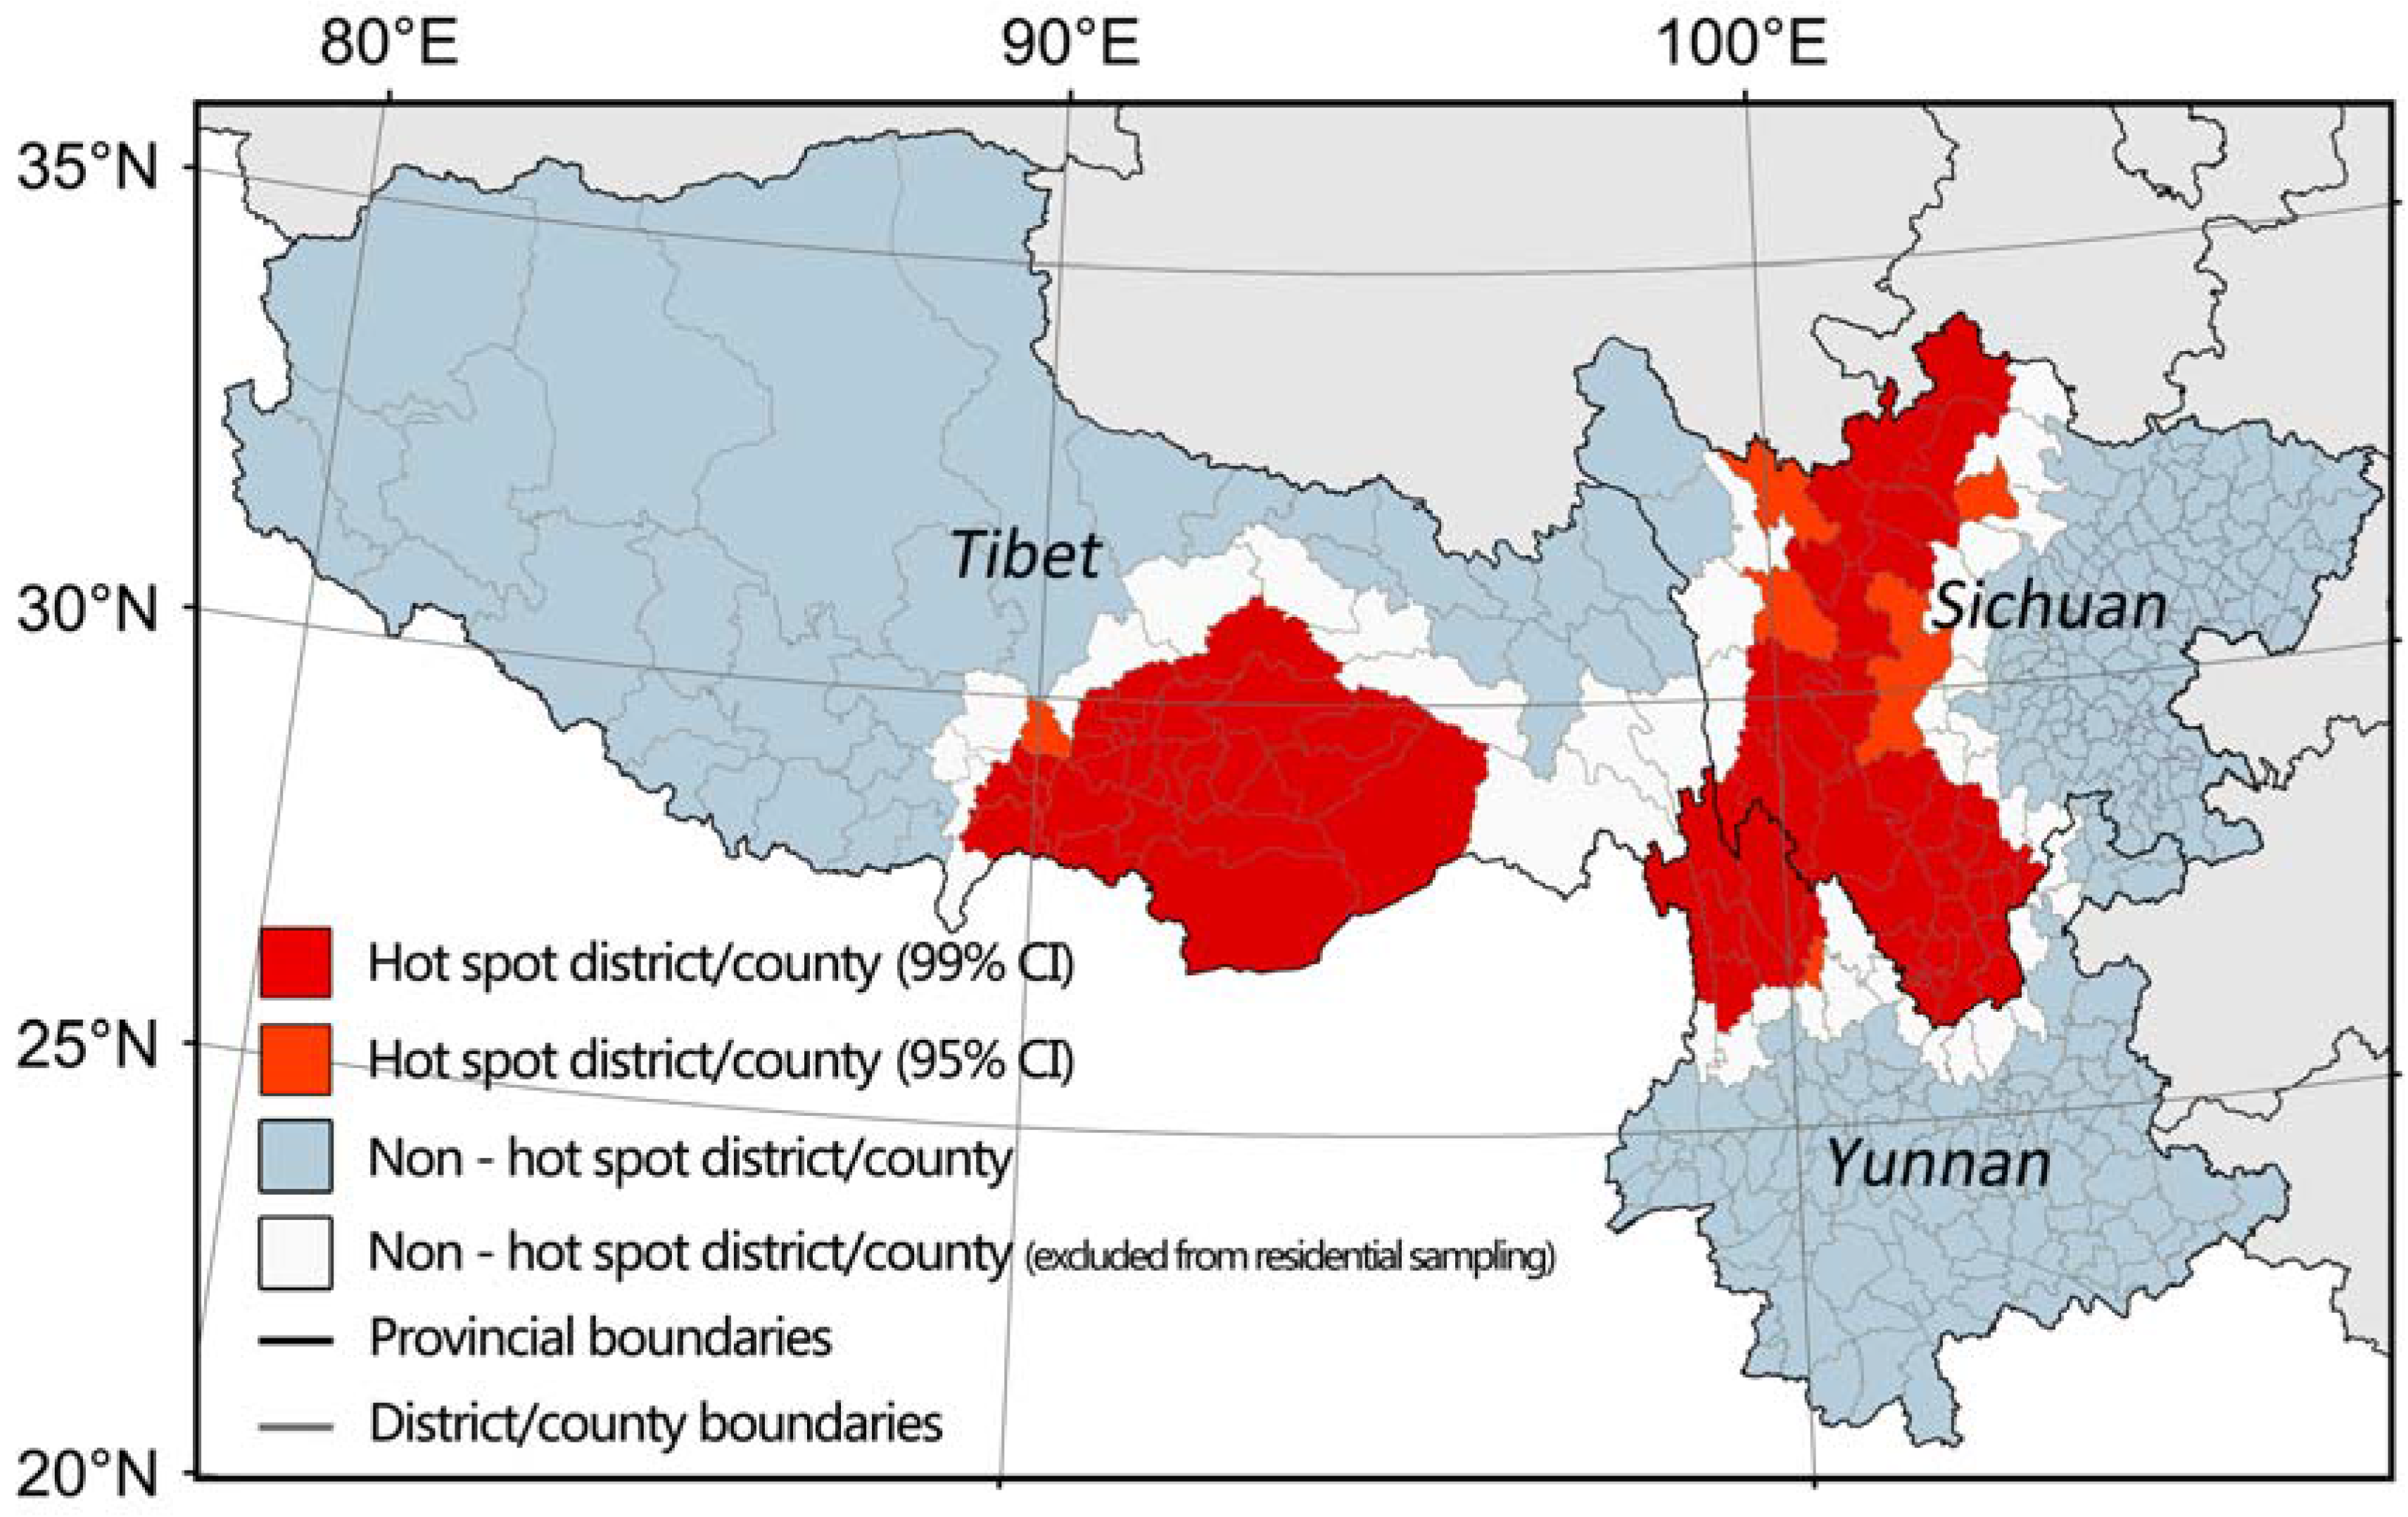
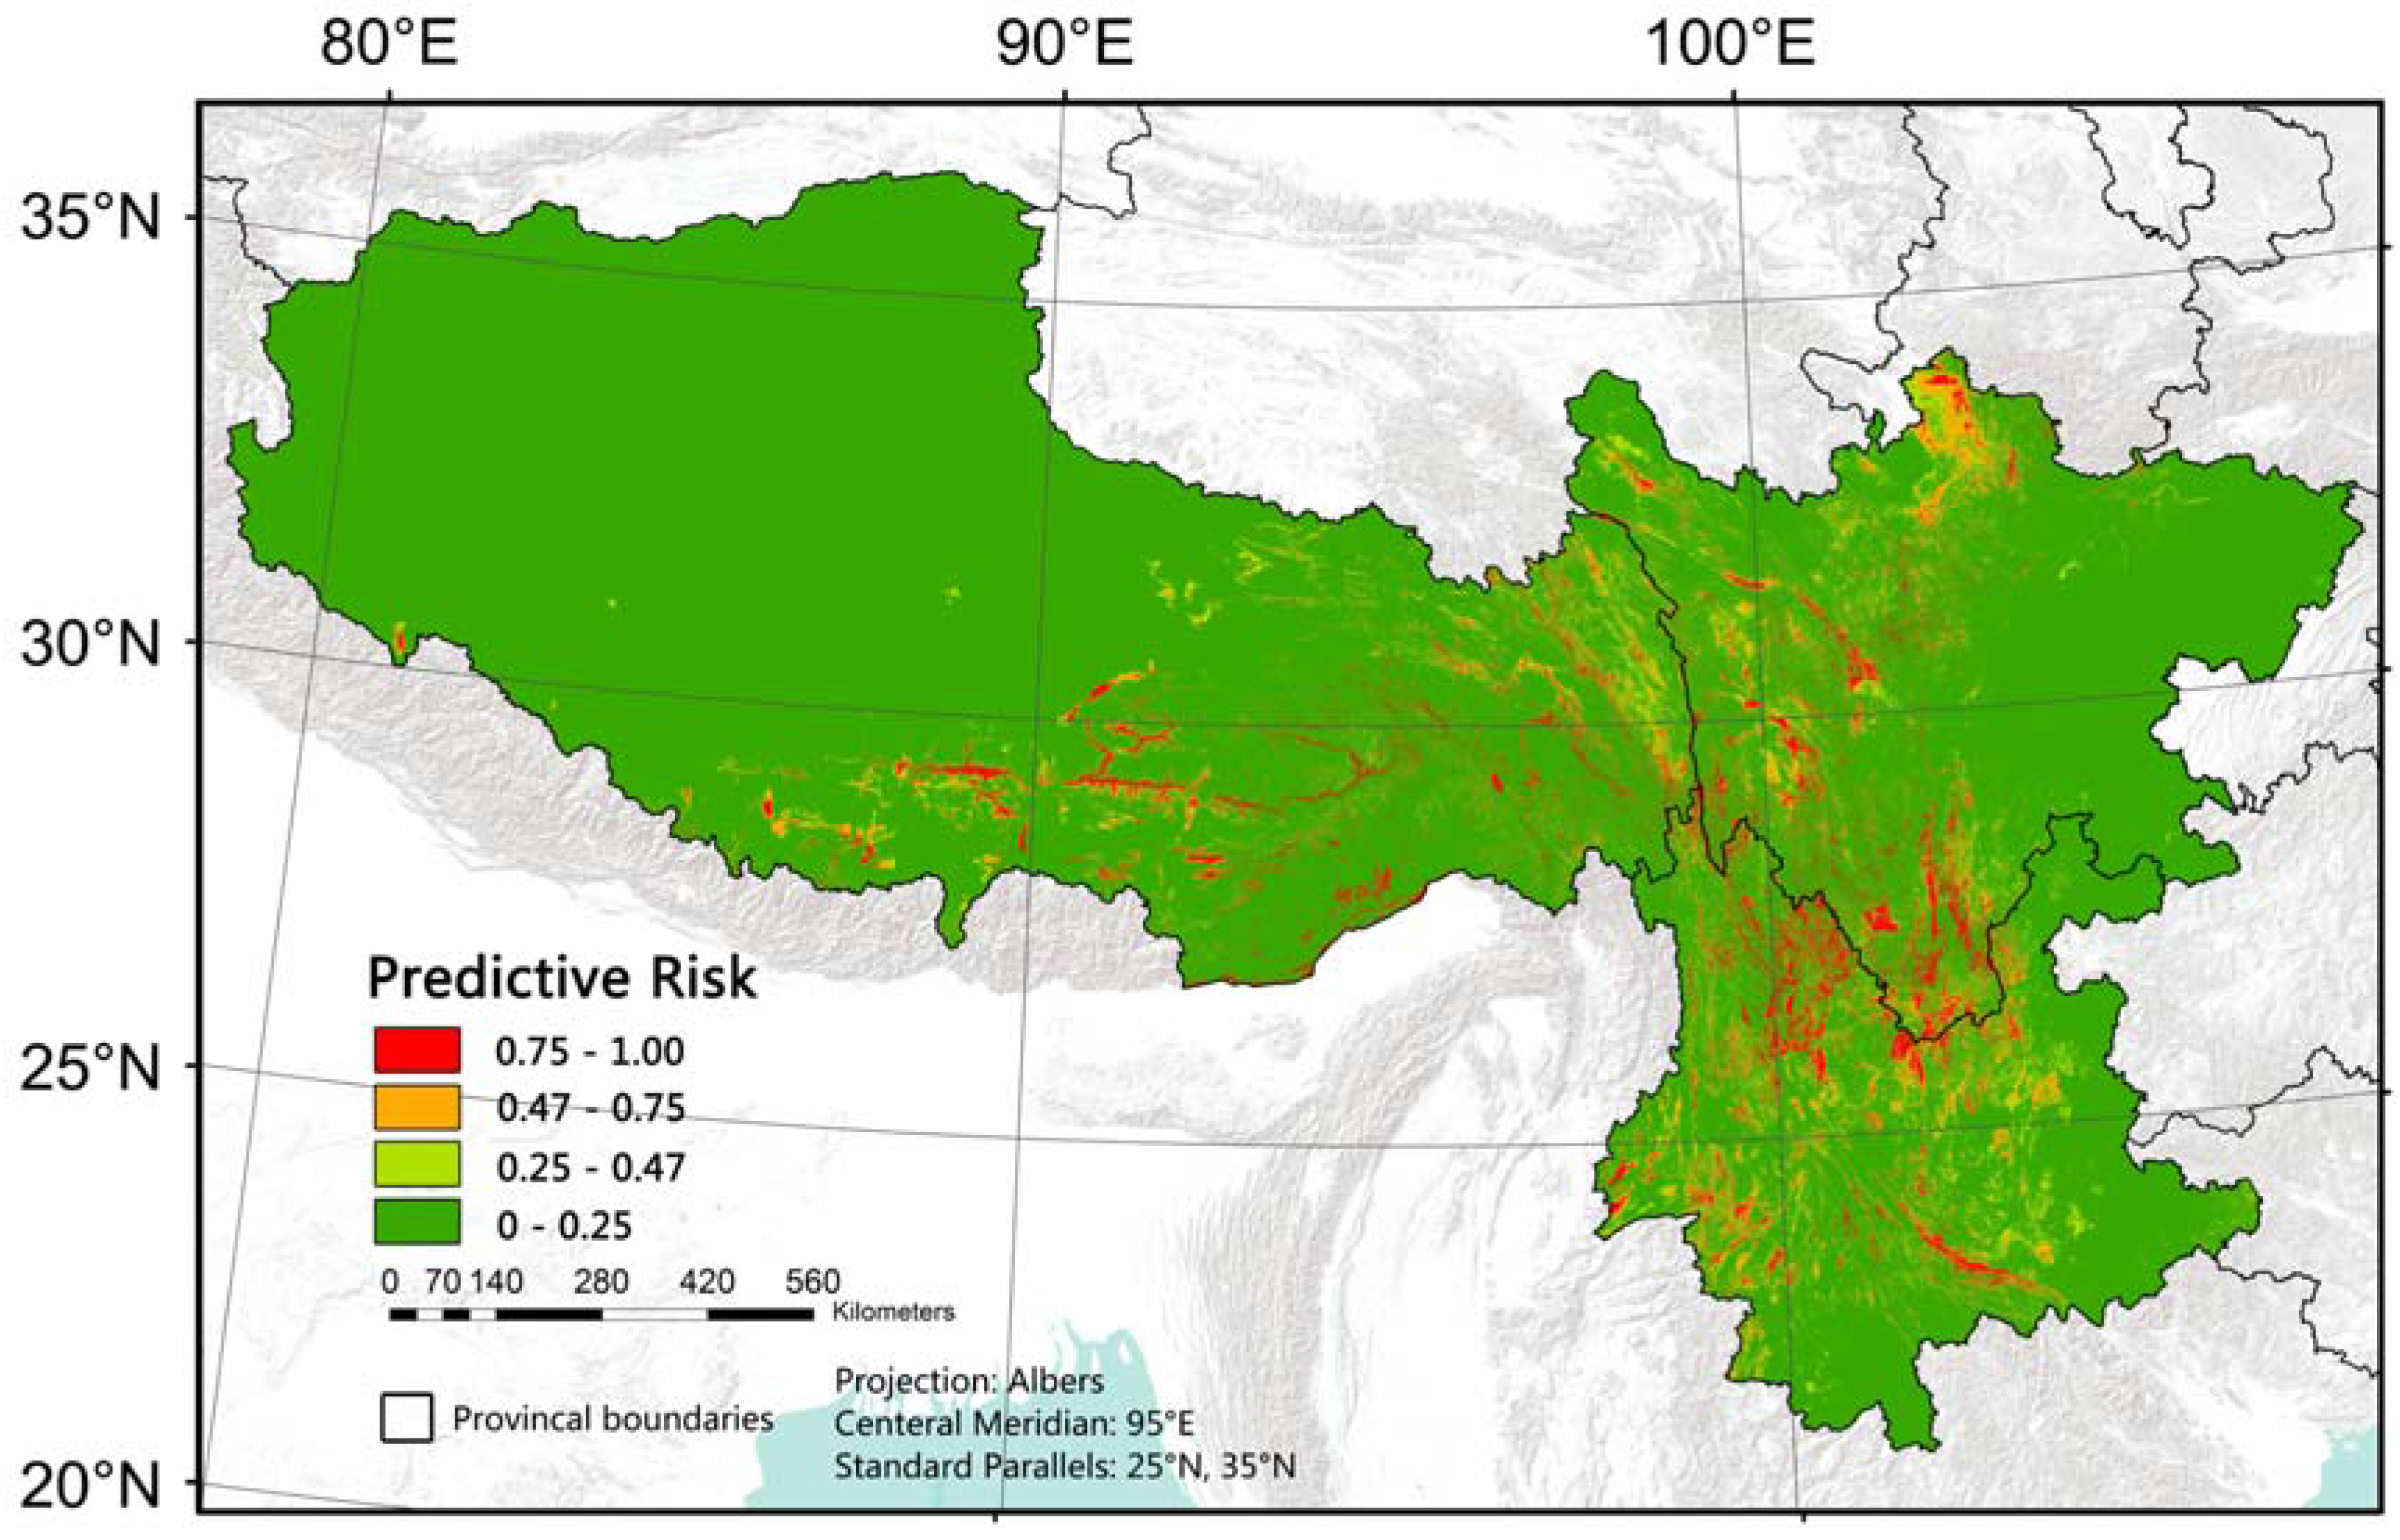
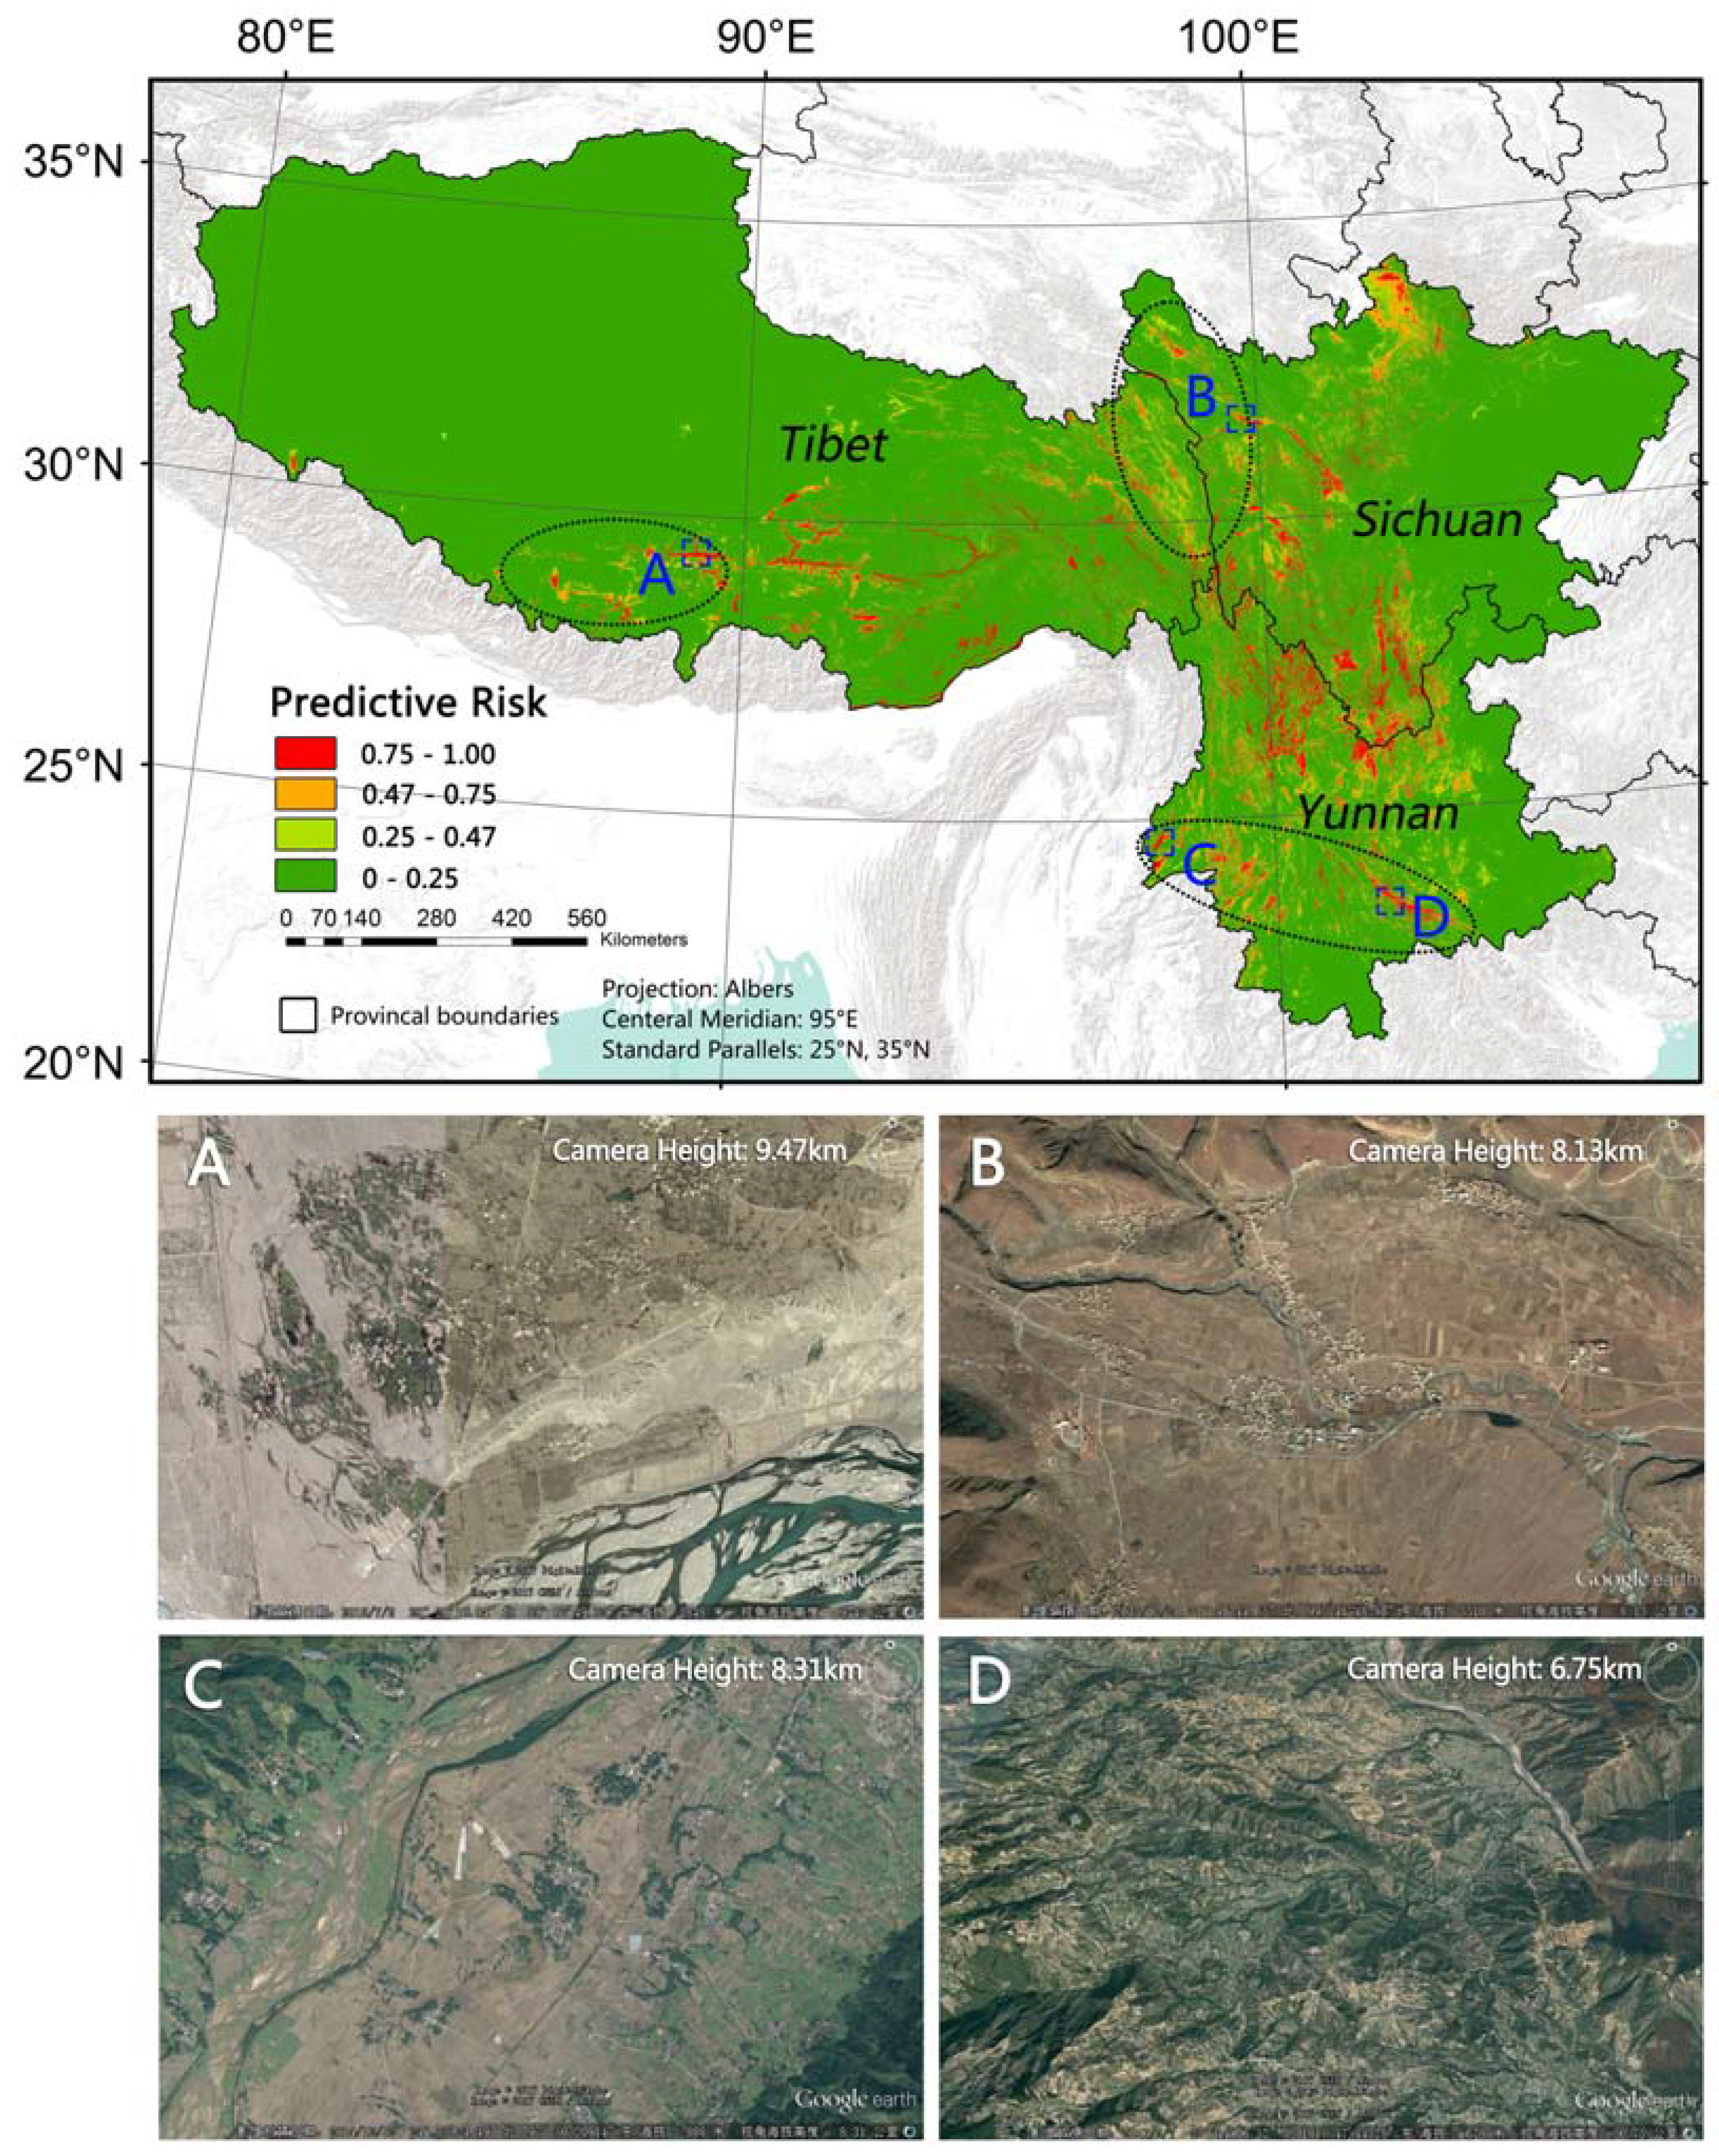
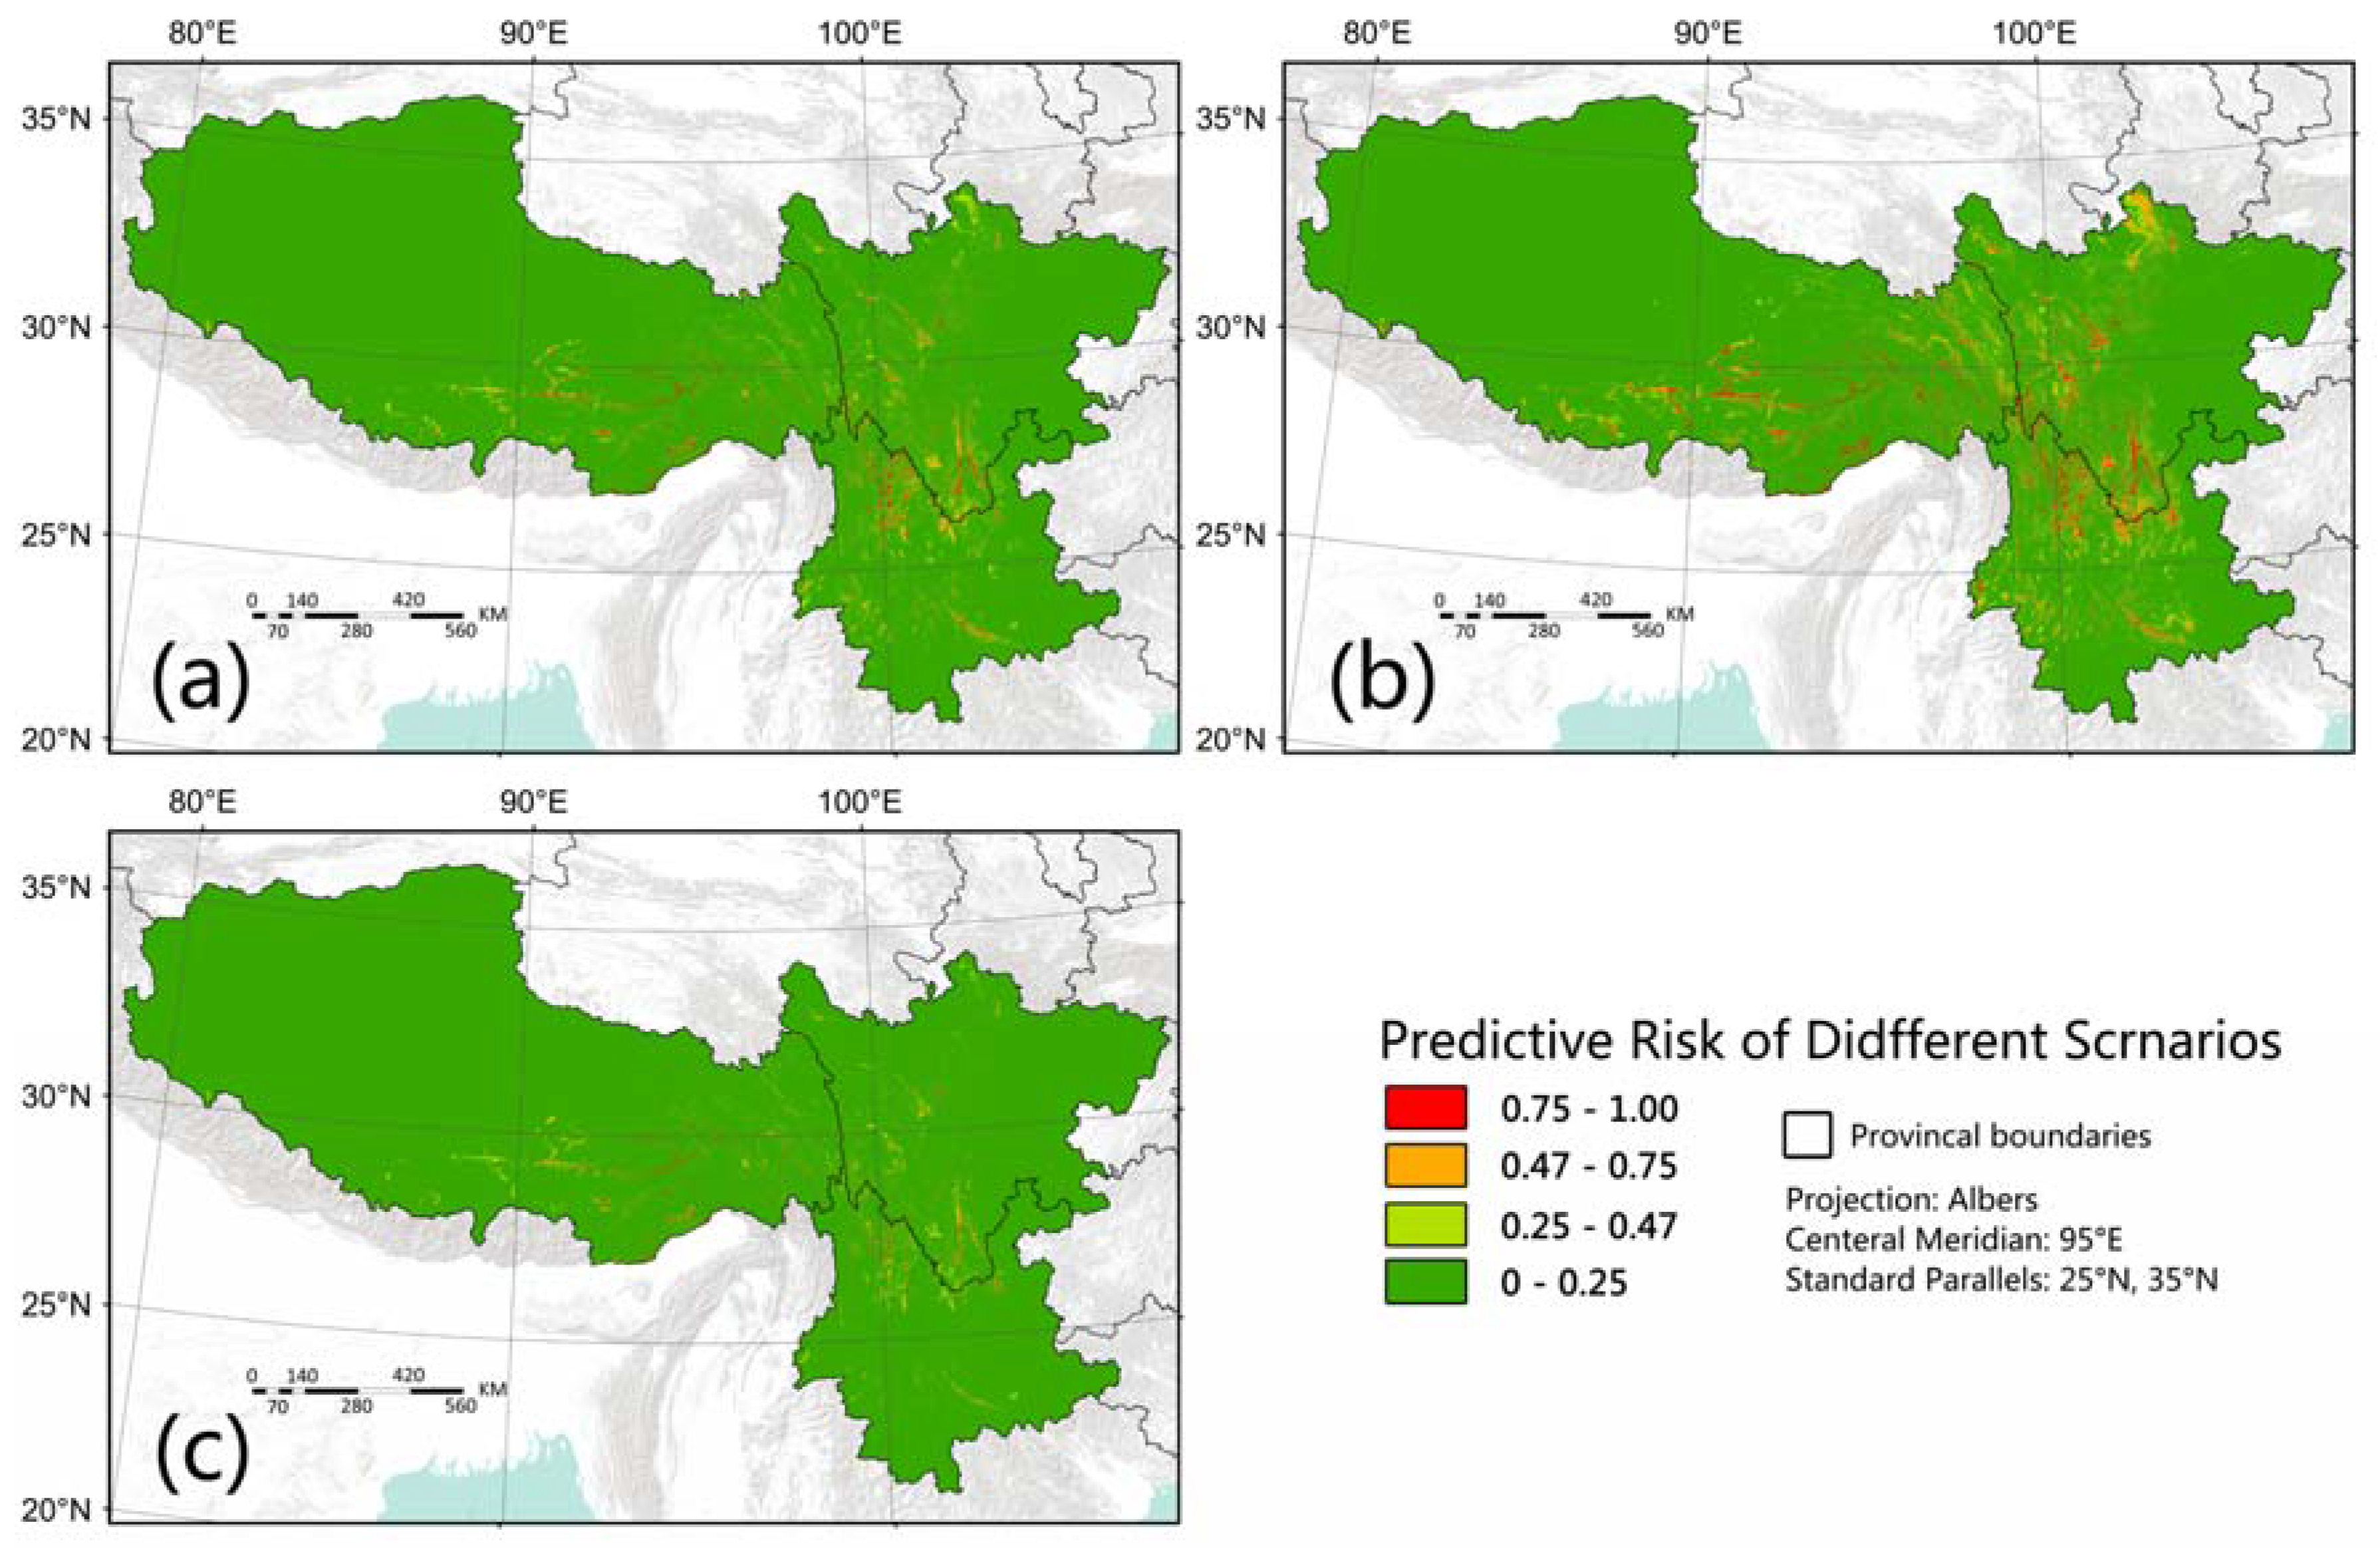
3. Results
4. Discussion
5. Conclusions
Supplementary Materials
Acknowledgments
Author Contributions
Conflicts of Interest
References
- Kotloff, K.L.; Winickoff, J.P.; Ivanoff, B.; Clemens, J.D.; Swerdlow, D.L.; Sansonetti, P.J.; Adak, G.K.; Levine, M.M. Global burden of Shigella infections: Implications for vaccine development and implementation of control strategies. Bull. World Health Organ. 1999, 77, 651–666. [Google Scholar] [PubMed]
- Von Seidlein, L.; Kim, D.R.; Ali, M.; Lee, H.; Wang, X.; Thiem, V.D.; Canh, D.G.; Chaicumpa, W.; Agtini, M.D.; Hossain, A.; et al. A multicentre study of Shigella diarrhoea in six Asian countries: Disease burden, clinical manifestations, and microbiology. PLoS Med. 2006, 3, e353. [Google Scholar] [CrossRef] [PubMed]
- Nie, C.; Li, H.; Yang, L.; Zhong, G.; Zhang, L. Socio-economic factors of bacillary dysentery based on spatial correlation analysis in Guangxi Province, China. PLoS ONE 2014, 9, e102020. [Google Scholar] [CrossRef] [PubMed]
- Ma, Y.; Zhang, T.; Liu, L.; Lv, Q.; Yin, F. Spatio-Temporal pattern and socio-economic factors of bacillary dysentery at county level in Sichuan province, China. Sci. Rep. 2015, 5, 15264. [Google Scholar] [CrossRef] [PubMed]
- Zhang, H.; Si, Y.; Wang, X.; Gong, P. Patterns of Bacillary Dysentery in China, 2005–2010. Int. J. Environ. Res. Public Health 2016, 13, 164. [Google Scholar] [CrossRef] [PubMed]
- DuPont, H.L.; Levine, M.M.; Hornick, R.B.; Formal, S.B. Inoculum size in shigellosis and implications for expected mode of transmission. J. Infect. Dis. 1989, 159, 1126–1128. [Google Scholar] [CrossRef] [PubMed]
- Emch, M.; Ali, M.; Yunus, M. Risk areas and neighborhood-level risk factors for Shigella dysenteriae 1 and Shigella flexneri. Health Place 2008, 14, 96–105. [Google Scholar] [CrossRef] [PubMed]
- Deng, Y.Q. Epidemic features of bacillary dysentery in Liangshan Yi autonomous prefecture during 2004–2010. Occup. Health 2011, 27, 2528–2530. [Google Scholar]
- Xiao, G.; Xu, C.; Wang, J.; Yang, D.; Wang, L. Spatial-temporal pattern and risk factor analysis of bacillary dysentery in the Beijing-Tianjin-Tangshan urban region of China. BMC Public Health 2014, 14, 998. [Google Scholar] [CrossRef] [PubMed]
- Kelly-Hope, L.A.; Alonso, W.J.; Thiem, V.D.; Anh, D.D.; Canh, D.G.; Lee, H.; Smith, D.L.; Miller, M.A. Geographical distribution and risk factors associated with enteric diseases in Vietnam. Am. J. Trop. Med. Hyg. 2007, 76, 706–712. [Google Scholar] [PubMed]
- Carlton, E.J.; Liang, S.; McDowell, J.Z.; Li, H.; Luo, W.; Remais, J.V. Regional disparities in the burden of disease attributable to unsafe water and poor sanitation in China. Bull. World Health Organ. 2012, 90, 578–587. [Google Scholar] [CrossRef] [PubMed]
- Patrick, M.E.; Christiansen, L.E.; Wainø, M.; Ethelberg, S.; Madsen, H.; Wegener, H.C. Effects of climate on incidence of Campylobacter spp. in humans and prevalence in broiler flocks in Denmark. Appl. Environ. Microbiol. 2004, 70, 7474–7480. [Google Scholar] [CrossRef] [PubMed]
- Huang, D.; Guan, P.; Guo, J.; Wang, P.; Zhou, B. Investigating the effects of climate variations on bacillary dysentery incidence in northeast China using ridge regression and hierarchical cluster analysis. BMC Infect. Dis. 2008, 25, 130. [Google Scholar] [CrossRef] [PubMed]
- Li, Z.; Wang, L.; Sun, W.; Hou, X.; Yang, H.; Sun, L.; Xu, S.; Sun, Q.; Zhang, J.; Song, H.; et al. Identifying high-risk areas of bacillary dysentery and associated meteorological factors in Wuhan, China. Sci. Rep. 2013, 3, 3239. [Google Scholar] [CrossRef] [PubMed]
- Kovats, R.S.; Edwards, S.J.; Hajat, S.; Armstrong, B.G.; Ebi, K.L.; Menne, B. The effects of temperature on food poisoning: A time-series analysis of salmonellosis in ten European countries. Epidemiol. Infect. 2004, 132, 443–453. [Google Scholar] [CrossRef] [PubMed]
- D’Souza, R.M.; Becker, N.G.; Hall, G.; Moodie, K.B. Does ambient temperature affect foodborne disease? Epidemiology 2004, 15, 86–92. [Google Scholar] [CrossRef] [PubMed]
- Zhou, X.D.; Zhou, Y.B.; Chen, R.J.; Ma, W.J.; Deng, H.J.; Kan, H.D. High temperature as a risk factor for infectious diarrhea in Shanghai, China. J. Epidemiol. 2013, 23, 418. [Google Scholar] [CrossRef] [PubMed]
- Zhang, H.; Zou, C.; Shao, F.; Li, G.Z. Effects of climate factors on bacillary dysentery epidemic in Harbin City, China. In Proceedings of the IEEE International Conference on Bioinformatics and Biomedicine, Belfast, UK, 2–5 November 2014. [Google Scholar]
- Singh, R.B.; Hales, S.; Wet, N.; Raj, R.; Hearnden, M.; Weinstein, P. The influence of climate variation and change on diarrheal disease in the Pacific Islands. Environ. Health Perspect. 2001, 109, 155–159. [Google Scholar] [CrossRef] [PubMed]
- Chompook, P. Bacillary dysentery. In Encyclopedia of Environmental Health; Nriagu, J.O., Ed.; Elsevier: Burlington, WA, USA, 2011; pp. 26–32. ISBN 9780444522726. [Google Scholar]
- Wang, X.; Tao, F.; Xiao, D.; Lee, H.; Deen, J.; Gong, J.; Zhao, Y.; Zhou, W.; Li, W.; Shen, B.; et al. Trend and disease burden of bacillary dysentery in China (1991–2000). Bull. World Health Organ. 2006, 84, 561–568. [Google Scholar] [CrossRef] [PubMed]
- Xu, Z.; Hu, W.; Zhang, Y.; Wang, X.; Tong, S.; Zhou, M. Spatiotemporal pattern of bacillary dysentery in China from 1990 to 2009: What is the driver behind? PLoS ONE 2014, 5, e0104329. [Google Scholar] [CrossRef] [PubMed]
- Global Change Research Data Publishing & Repository. Available online: http://www.geodoi.ac.cn (accessed on 5 June 2016).
- China Meteorological Administration. China Meteorological Data Sharing Service System. Available online: http://data.cma.cn (accessed on 5 June 2016).
- U.S. Central Intelligence Agency. Communist China Map Folio: Ethnolinguistic Groups. Available online: http://www.lib.utexas.edu/maps/china.html (accessed on 16 September 2016).
- Consultative Group for International Agricultural Research Consortium for Spatial Information. CGIAR-CSI SRTM 90m DEM Digital Elevation Database. Available online: http://srtm.csi.cgiar.org/ (accessed on 5 June 2016).
- National Geomatics Center of China. Available online: http://ngcc.sbsm.gov.cn/ (accessed on 5 June 2016).
- Wang, A.; Zuo, W. Geographic Atlas of China, 1st ed.; Sinomap Press: Beijing, China, 2010; p. 16. [Google Scholar]
- Gong, P.; Wang, J.; Yu, L.; Zhao, Y.; Zhao, Y.; Liang, L.; Niu, Z.G.; Huang, X.M.; Fu, H.H.; Liu, S.; et al. Finer resolution observation and monitoring of global land cover: First mapping results with Landsat TM and ETM+ data. Int. J. Remote Sens. 2013, 34, 2607–2654. [Google Scholar] [CrossRef]
- Yu, L.; Wang, J.; Gong, P. Improving 30 m global land-cover map from-glc with time series modis and auxiliary data sets: A segmentation-based approach. Int. J. Remote Sens. 2013, 34, 5851–5867. [Google Scholar] [CrossRef]
- Yu, L.; Wang, J.; Clinton, N.; Xin, Q.; Zhong, L.; Chen, Y.; Gong, P. From-gc: 30 m global cropland extent derived through multisource data integration. Int. J. Digit. Earth 2013, 6, 521–533. [Google Scholar] [CrossRef]
- Li, C.; Wang, J.; Hu, L.; Yu, L.; Clinton, N.; Huang, H.; Yang, J.; Gong, P. A Circa 2010 Thirty Meter Resolution Forest Map for China. Remote Sens. 2014, 6, 5325–5343. [Google Scholar] [CrossRef]
- Yu, L.; Wang, J.; Li, X.C.; Li, C.C.; Zhao, Y.Y.; Gong, P. A multi-resolution global land cover dataset through multisource data aggregation. Sci. China Earth Sci. 2014, 57, 2317–2329. [Google Scholar] [CrossRef]
- Yu, L.; Li, X.C.; Li, C.C.; Zhao, Y.Y.; Niu, Z.G.; Huang, H.B.; Wang, J.; Cheng, Y.Q.; Lu, H.; Si, Y.L.; et al. Using a global reference sample set and a cropland map for area estimation in China. Sci. China Earth Sci. 2017, 60, 1–9. [Google Scholar] [CrossRef]
- Department of Earth System Science, Tsinghua University. Finer Resolution Observation and Monitoring—Global Land Cover. Available online: http://data.ess.tsinghua.edu.cn/ (accessed on 14 April 2017).
- National Bureau of Statistics of China. China County Statistical Yearbook; China Statistics Press: Beijing, China, 2011; pp. 276–358. ISBN 9787503764196.
- Liu, J.W.; Zhang, X.X.; Wang, J.; Du, X.H.; Zeng, J.; Xu, J.K. Contrast analysis on infectious diseases in Tibet and backland. Acta Acad. Med. Mil. Tert. 2005, 27, 2303–2304. [Google Scholar] [CrossRef]
- Li, K.Q. Analysis on 1954 Bacillary Dysentery Cases Reported in Ningnan County from 1997 to 2006. J. Prev. Med. Inf. 2007, 23, 579–581. [Google Scholar] [CrossRef]
- Wang, Y.H.; Wang, X.L.; Zhao, W.J.; Zhang, J.C. Accurate Identification and Evaluation of Multidimensional Poverty Based on GIS, 1st ed.; Science Press: Beijing, China, 2015; pp. 204–206. [Google Scholar]
- Nicolas, X.; Granier, H.; Le, G.P. Shigellosis or Bacillary Dysentery. Presse Méd. 2007, 36, 1606–1618. [Google Scholar] [CrossRef] [PubMed]
- Tobler, W.R. A Computer Movie Simulating Urban Growth in the Detroit Region. Econ. Geogr. 1970, 46, 234–240. [Google Scholar] [CrossRef]
- Nakarin, C.; Nitin, K.T.; Marc, S. Exploring spatial patterns and hotspots of diarrhea in Chiang Mai, Thailand. Int. J. Health Geogr. 2009, 8, 1–10. [Google Scholar]
- Clayton, D.; Kaldor, J. Empirical Bayes estimates of age-standardized relative risks for use in disease mapping. Biometrics 1987, 43, 671–681. [Google Scholar] [CrossRef] [PubMed]
- Mitchell, A. The ESRI Guide to GIS Analysis, 2nd ed.; ESRI Press: Redlands, CA, USA, 2005; pp. 178–180. [Google Scholar]
- Mcpherson, J.M.; Jetz, W.; Rogers, D.J. The effects of species’ range sizes on the accuracy of distribution models: Ecological phenomenon or statistical artefact? J. Appl. Ecol. 2004, 41, 811–823. [Google Scholar] [CrossRef]
- Si, Y.L.; Wang, T.J.; Skidmore, A.K.; Boer, W.F.D.; Lin, L.; Prins, H.H.T. Environmental factors influencing the spread of the highly pathogenic avian influenza h5n1 virus in wild birds in Europe. Ecol. Soc. 2010, 15, 299–305. [Google Scholar] [CrossRef]
- Si, Y.L.; Boer, W.F.D.; Gong, P. Different environmental drivers of highly pathogenic avian influenza h5n1 outbreaks in poultry and wild birds. PLoS ONE 2013, 8, e53362. [Google Scholar] [CrossRef] [PubMed]
- Moran, P.A.P. Notes on continuous stochastic phenomena. Biometrika 1950, 37, 17. [Google Scholar] [CrossRef] [PubMed]
- Stine, R.A. Graphical interpretation of variance inflation factors. Am. Stat. 1995, 49, 53–56. [Google Scholar] [CrossRef]
- Kutner, M.H.; Nachtsheim, C.J.; Neter, J.; Li, W. Applied Linear Statistical Models, 5th ed.; McGraw-Hill/Irwin: Chicago, IL, USA, 2004; ISBN 9780072386882. [Google Scholar]
- Viswanathan, V.K. Shigella takes the temperature. Gut Microbes 2012, 4, 267–268. [Google Scholar] [CrossRef] [PubMed][Green Version]
- R Core Team. The R Project for Statistical Computing. Available online: http://www.r-project.org (accessed on 18 August 2015).
- National Bureau of Statistics of China. Poverty Monitoring Report of Rural China; China Statistics Press: Beijing, China, 2016; pp. 151–169. ISBN 978750375265414.
- Kim, D.R.; Ali, M.; Thiem, V.D.; Park, J.K.; Von Seidlein, L.; Clemens, J. Geographic analysis of shigellosis in Vietnam. Health Place 2008, 14, 755–767. [Google Scholar] [CrossRef] [PubMed]
- Feng, Z.M.; Tang, Y.; Yang, Y.Z.; Zhang, D. The relief degree of land surface in China and its correlation with population distribution. Acta Geogr. Sin. 2007, 62, 1073–1082. [Google Scholar]
- Li, Z.J.; Zhang, X.J.; Hou, X.X.; Xu, S.; Zhang, J.S.; Song, H.B.; Lin, H.L. Nonlinear and threshold of the association between meteorological factors and bacillary dysentery in Beijing, China. Epidemiol. Infect. 2015, 143, 3510–3519. [Google Scholar] [CrossRef] [PubMed]
- Bandyopadhyay, S.; Kanji, S.; Wang, L. The impact of rainfall and temperature variation on diarrheal prevalence in Sub-Saharan Africa. Appl. Geogr. 2012, 33, 63–72. [Google Scholar] [CrossRef]
- Zhang, Y.; Bi, P.; Hiller, J.E.; Sun, Y.; Ryan, P. Climate variations and bacillary dysentery in northern and southern cities of China. J. Infect. 2007, 55, 194–200. [Google Scholar] [CrossRef] [PubMed]
- Guo, Q.; Zhang, C.Y.; Ji, Y.B.; Wang, L.P. Investigation of infectious disease direct reporting network management in Chinese medical institutions. Dis. Surveill. 2010, 25, 410–413. [Google Scholar]


| Category | Description of Datasets | Format | Resolution |
|---|---|---|---|
| Anthropogenic environmental data | GRP (gross regional product) | Raster | 1 km |
| Ethnic group | Polygon | ||
| Number of hospital beds | Polygon | ||
| Physical environmental data | DEM (digital elevation model) | Raster | 90 m |
| Temperature | Raster | 1 km | |
| Precipitation | Point | ||
| Relative humidity | Point | ||
| Rivers | Polyline | ||
| Lakes | Polygon | ||
| Forest | Raster | 30 m | |
| Farmland | Raster | 30 m | |
| Terrain type | Polygon |
| Category | Description of Variables | Type | Abbreviation | Unit |
|---|---|---|---|---|
| Anthropogenic environmental variables | GRP per 1 km2 | Continuous | GRP | 10 million yuan/km2 |
| Ethnic group (2: Tibeto-Burman; 1: Others) | Categorical | Ethnic | No unit | |
| Number of beds in hospitals (4: fewer than 204 beds; 3: 204–668 beds; 2: 669–1678 beds; 1: more than 1679 beds) | Categorical | BedNum | No unit | |
| Physical environmental variables | Elevation | Continuous | Elevation | 100 m |
| Elevation variation | Continuous | ElevationSD | 100 m | |
| Slope | Continuous | Slope | ° | |
| Temperature (Annual/Summer/Winter) | Continuous | T Ann/Sum/Win | °C | |
| Precipitation (Annual/Summer/Winter) | Continuous | PR Ann/Sum/Win | mm | |
| Relative humidity (Annual/Summer/Winter) | Continuous | RH Ann/Sum/Win | % | |
| Distance to water bodies | Continuous | DisWater | km | |
| Distance to farmlands | Continuous | DisFarm | km | |
| Forest coverage (2: Forest; 1: Non-forest) | Categorical | Forest | No unit | |
| Terrain type (2: Mountain land; 1: Others) | Categorical | Terrain | No unit | |
| Interaction variable | Ethnic * Terrain 1 (2: Tibeto-Burman in Mountain land; 1: Others) | Categorical | EthnicTerrain | No unit |
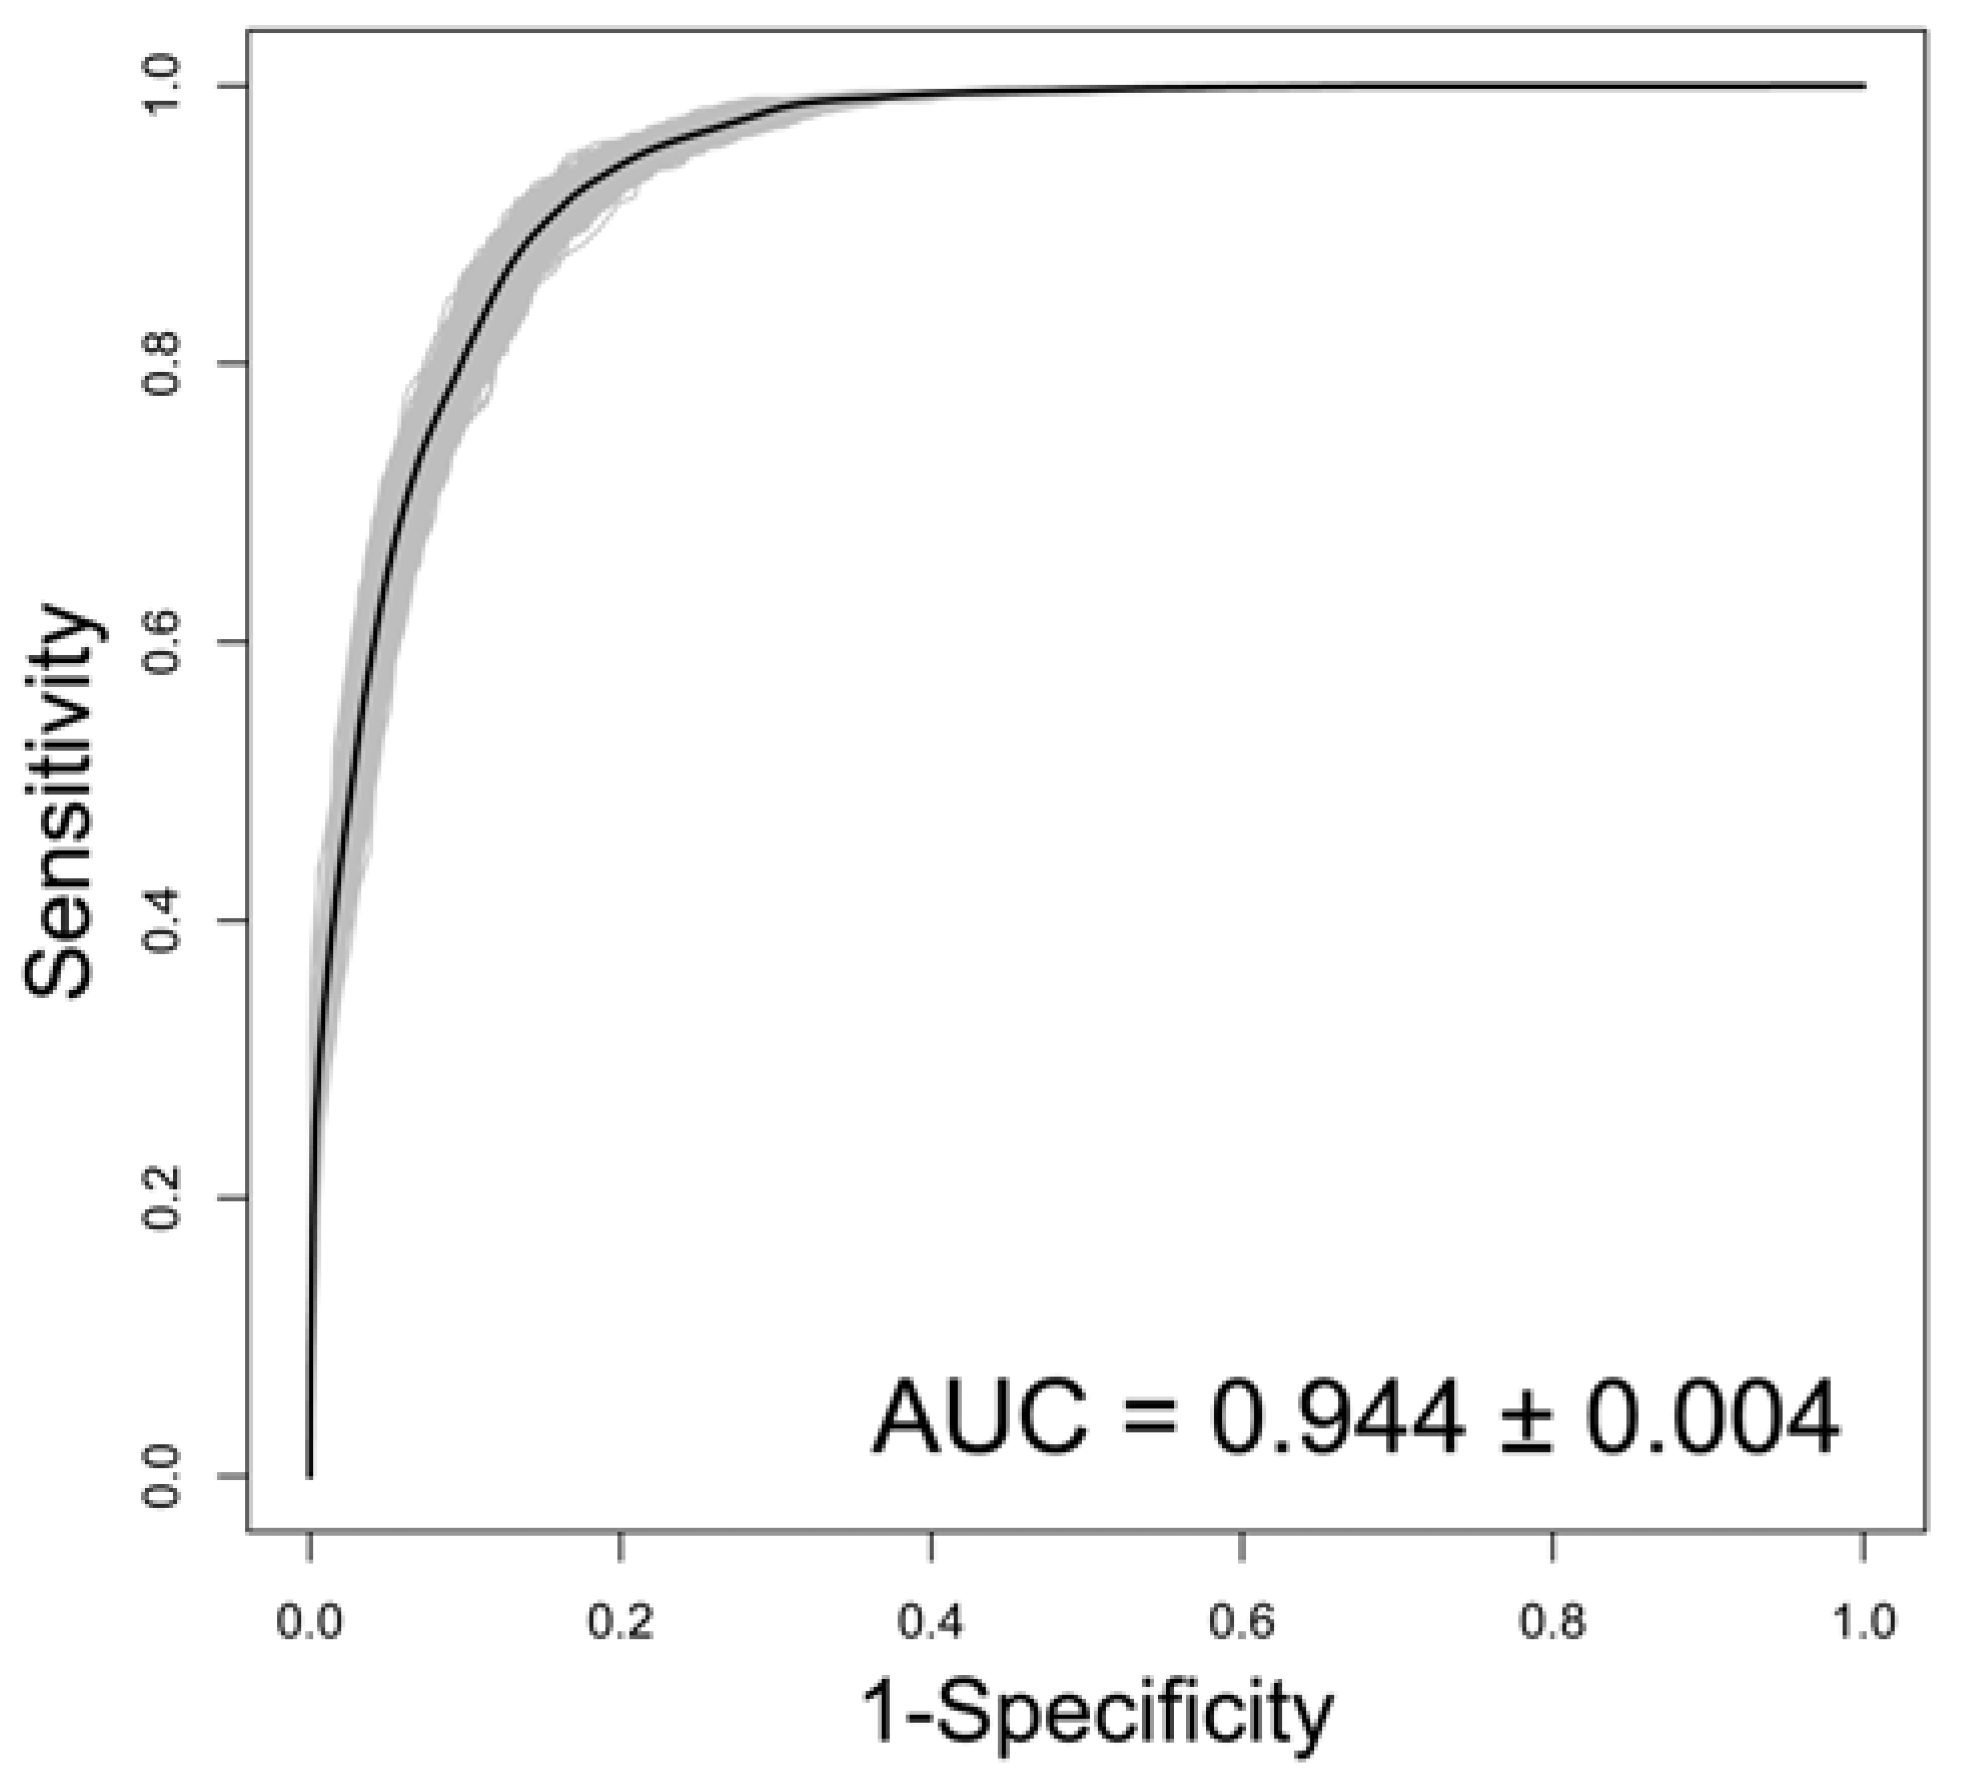
| Variable | Coefficient | OR | OR (95% CI) | p-Value | AUC ± SD | Kappa ± SD | |
|---|---|---|---|---|---|---|---|
| Intercept | −24.557 | <0.001 | |||||
| DisFarm | −0.087 | 0.916 | 0.880 | 0.954 | <0.001 | ||
| DisWater | −0.062 | 0.940 | 0.914 | 0.967 | 0.001 | ||
| GRP | −0.296 | 0.744 | 0.664 | 0.834 | <0.001 | ||
| EthnicTerrain-2 | 1.112 | 3.059 1 | 2.242 | 4.175 | <0.001 | ||
| Forest-2 | 3.474 | 32.875 2 | 13.154 | 82.188 | <0.001 | ||
| Slope | −0.131 | 0.877 | 0.863 | 0.891 | <0.001 | ||
| ElevationSD | 0.542 | 1.721 | 1.535 | 1.931 | <0.001 | ||
| RH_Ann | 0.706 | 2.029 | 1.758 | 2.341 | <0.001 | ||
| (RH_Ann) 2 | −0.007 | 0.993 | 0.992 | 0.994 | <0.001 | ||
| AT_Ann | 0.169 | 1.184 | 1.135 | 1.236 | <0.001 | ||
| BedNum-2 | 0.877 | 2.441 3 | 1.178 | 5.062 | <0.001 | ||
| BedNum-3 | 2.346 | 10.710 | 5.155 | 22.260 | <0.001 | ||
| BedNum-4 | 2.981 | 20.234 | 9.187 | 44.586 | <0.001 | ||
| Model | 0.944 ± 0.004 | 0.75 ± 0.01 | |||||
| Predicted | Actual | |
|---|---|---|
| P 1 | A 2 | |
| P | 113 | 16 |
| A | 14 | 111 |
| Overall accuracy: 88.19% | ||
© 2017 by the authors. Licensee MDPI, Basel, Switzerland. This article is an open access article distributed under the terms and conditions of the Creative Commons Attribution (CC BY) license (http://creativecommons.org/licenses/by/4.0/).
Share and Cite
Zhang, H.; Si, Y.; Wang, X.; Gong, P. Environmental Drivers and Predicted Risk of Bacillary Dysentery in Southwest China. Int. J. Environ. Res. Public Health 2017, 14, 782. https://doi.org/10.3390/ijerph14070782
Zhang H, Si Y, Wang X, Gong P. Environmental Drivers and Predicted Risk of Bacillary Dysentery in Southwest China. International Journal of Environmental Research and Public Health. 2017; 14(7):782. https://doi.org/10.3390/ijerph14070782
Chicago/Turabian StyleZhang, Han, Yali Si, Xiaofeng Wang, and Peng Gong. 2017. "Environmental Drivers and Predicted Risk of Bacillary Dysentery in Southwest China" International Journal of Environmental Research and Public Health 14, no. 7: 782. https://doi.org/10.3390/ijerph14070782
APA StyleZhang, H., Si, Y., Wang, X., & Gong, P. (2017). Environmental Drivers and Predicted Risk of Bacillary Dysentery in Southwest China. International Journal of Environmental Research and Public Health, 14(7), 782. https://doi.org/10.3390/ijerph14070782