
Socioeconomic Disparity in Later-Year Group Trajectories of Depressive Symptoms: Role of Health and Social Engagement Change

Abstract
:1. Introduction
2. Materials and Methods
2.1. Data and Sample
2.2. Measures
2.3. Analysis
3. Results
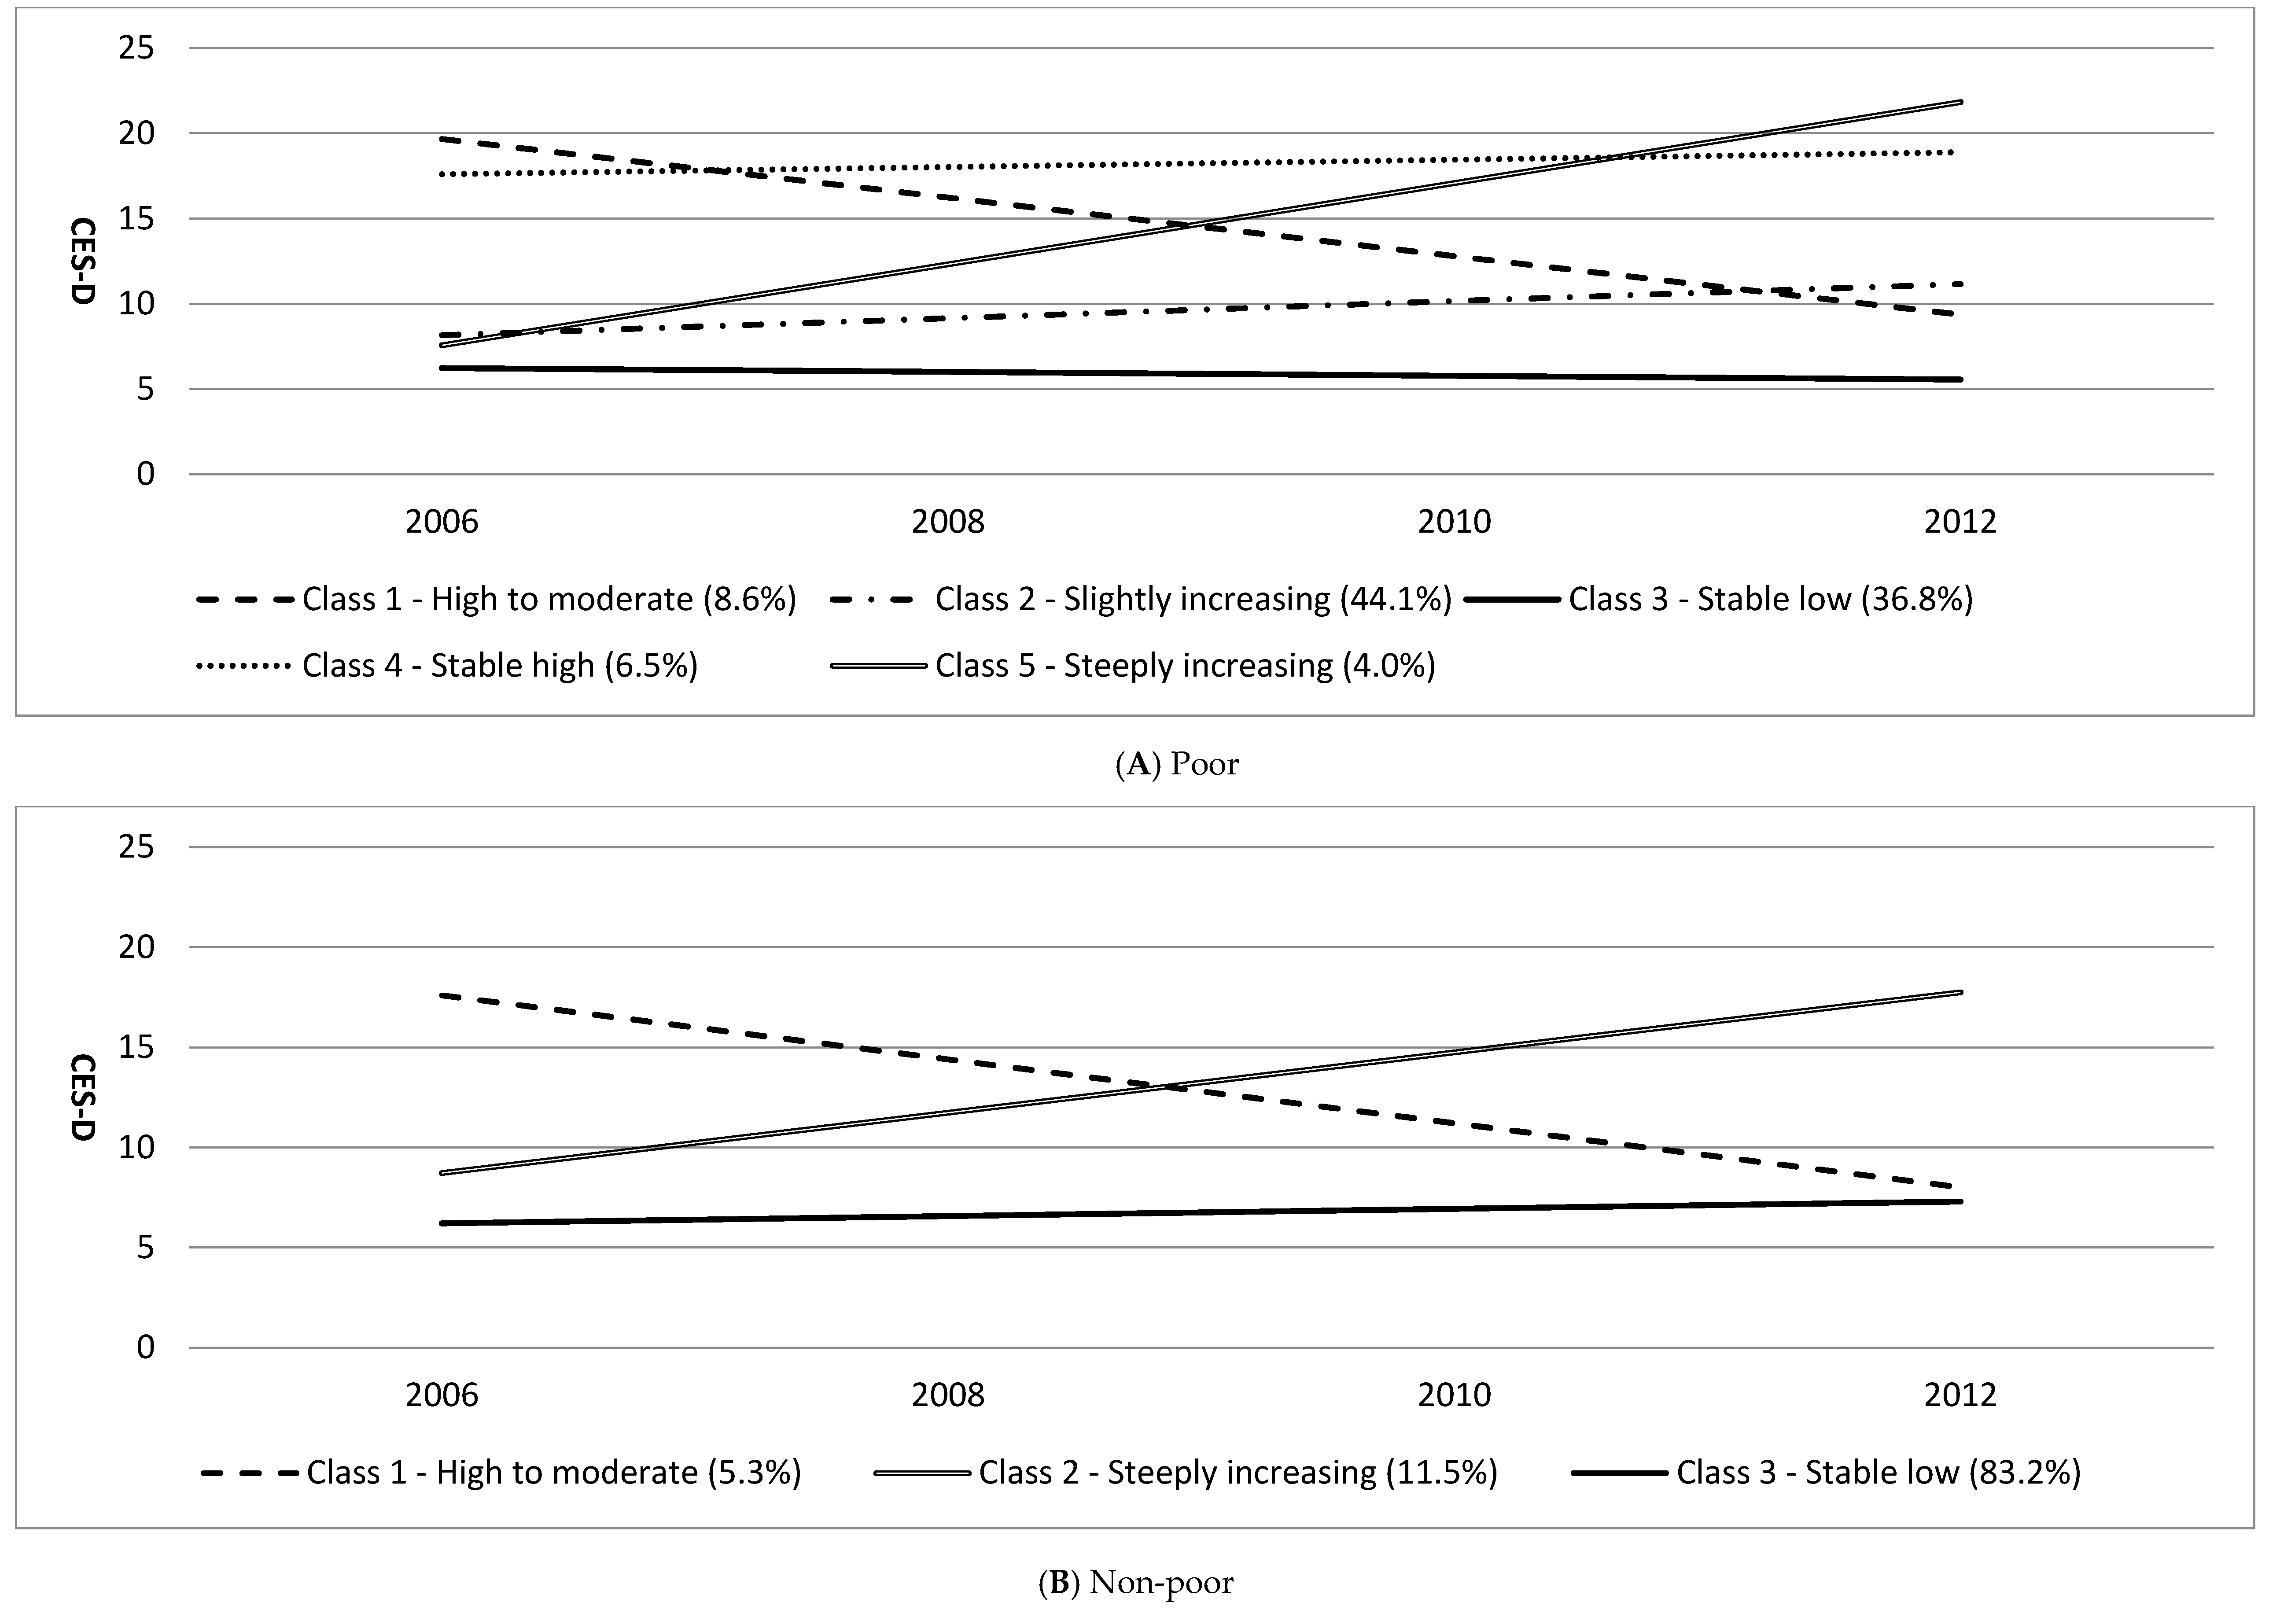
3.1. Group Trajectories of Depressive Symptoms by Poverty Status
3.2. Characteristics of Group Trajectories
3.3. Health and Social Factors of Trajectory Group Membership
4. Discussion
4.1. Group Trajectories of Depressive Symptoms by Poverty Status
4.2. Health, Social Engagement, and Symptom Trajectories: Poor vs. Non-Poor
5. Conclusions
Acknowledgments
Author Contributions
Conflicts of Interest
References
- Tampubolon, G.; Hanandita, W. Poverty and mental health in Indonesia. Soc. Sci. Med. 2014, 106, 20–27. [Google Scholar] [CrossRef] [PubMed]
- Dupre, M.E. Educational differences in age-related patterns of disease: Reconsidering the cumulative disadvantage and age-as-leveler hypotheses. J. Health Soc. Behav. 2007, 48, 1–15. [Google Scholar] [CrossRef] [PubMed]
- Ferraro, K.F.; Kelley-Moore, J.A. Cumulative Disadvantage and Health: Long-Term Consequences of Obesity? Am. Sociol. Rev. 2003, 68, 707–729. [Google Scholar] [CrossRef] [PubMed]
- Musliner, K.L.; Munk-Olsen, T.; Eaton, W.W.; Zandi, P.P. Heterogeneity in long-term trajectories of depressive symptoms: Patterns, predictors and outcomes. J. Affect. Disord. 2016, 192, 199–211. [Google Scholar] [CrossRef] [PubMed]
- Byers, A.L.; Vittinghoff, E.; Lui, L.; Hoang, T.; Blazer, D.G.; Covinsky, K.E.; Ensrud, K.E.; Cauley, J.A.; Hillier, T.A.; Fredman, L. Twenty-year depressive trajectories among older women. Arch. Gen. Psychiatry 2012, 69, 1073–1079. [Google Scholar] [CrossRef] [PubMed]
- Hsu, H.C. Group-based trajectories of depressive symptoms and the predictors in the older population. Int. J. Geriatr. Psychiatry 2012, 27, 854–862. [Google Scholar] [CrossRef] [PubMed]
- Kuchibhatla, M.N.; Fillenbaum, G.G.; Hybels, C.F.; Blazer, D.G. Trajectory classes of depressive symptoms in a community sample of older adults. Acta Psychiatr. Scand. 2012, 125, 492–501. [Google Scholar] [CrossRef] [PubMed]
- Liang, J.; Xu, X.; Quiñones, A.R.; Bennett, J.M.; Ye, W. Multiple trajectories of depressive symptoms in middle and late life: Racial/ethnic variations. Psychol. Aging 2011, 26, 761–777. [Google Scholar] [CrossRef] [PubMed]
- Ministry of Health and Welfare. Needs Assessments and Support Services for Older People 2011; Ministry of Health and Welfare: Seoul, Korea, 2012.
- Organisation for Economic Co-Operation and Development (OECD). Old-age income poverty. In Pensions at a Glance 2015: OECD and G20 indicators; OECD Publishing: Paris, France, 2015; pp. 170–171. [Google Scholar]
- Park, J.H.; Lee, J.J.; Lee, S.B.; Huh, Y.S.; Choi, E.A.; Youn, J.C.; Jhoo, J.H.; Kim, J.S.; Woo, J.I.; Kim, K.W. Prevalence of major depressive disorder and minor depressive disorder in an elderly Korean population: Results from the Korean Longitudinal Study on Health and Aging (KLoSHA). J. Affect. Disord. 2010, 125, 234–240. [Google Scholar] [CrossRef] [PubMed]
- Back, J.H.; Lee, Y. Gender differences in the association between socioeconomic status (SES) and depressive symptoms in older adults. Arch. Gerontol. Geriatr. 2011, 52, e140–e144. [Google Scholar] [CrossRef] [PubMed]
- Jeon, H.S.; Kahng, S.K. Predictors of depression trajectory among the elderly using the Korean welfare panel data. J. Korean Geriatr. Soc. 2009, 29, 1611–1628. [Google Scholar]
- Lee, H.J. Longitudinal changes in depression in older adults: Differences across age groups and risk factors. J. Welfare Aged Inst. 2013, 61, 291–318. [Google Scholar]
- Kuo, S.Y.; Lin, K.M.; Chen, C.Y.; Chuang, Y.L.; Chen, W.J. Depression trajectories and obesity among the elderly in Taiwan. Psychol. Med. 2011, 41, 1665–1676. [Google Scholar] [CrossRef] [PubMed]
- Andreescu, C.; Chang, C.C.H.; Mulsant, B.H.; Ganguli, M. Twelve-year depressive symptom trajectories and their predictors in a community sample of older adults. Int. Psychogeriatr. 2008, 20, 221–236. [Google Scholar] [CrossRef] [PubMed]
- Montagnier, D.; Dartigues, J.F.; Rouillon, F.; Pérès, K.; Falissard, B.; Onen, F. Ageing and trajectories of depressive symptoms in community-dwelling men and women. Int. J. Geriatr. Psychiatry 2014, 29, 720–729. [Google Scholar] [CrossRef] [PubMed]
- Karlamangla, A.; Zhou, K.; Reuben, D.; Greendale, G.; Moore, A. Longitudinal trajectories of heavy drinking in adults in the United States of America. Addiction 2006, 101, 91–99. [Google Scholar] [CrossRef] [PubMed]
- Bassuk, S.S.; Glass, T.A.; Berkman, L.F. Social disengagement and incident cognitive decline in community-dwelling elderly persons. Ann. Intern. Med. 1999, 131, 165–173. [Google Scholar] [CrossRef] [PubMed]
- Cacioppo, J.T.; Hawkley, L.C.; Thisted, R.A. Perceived social isolation makes me sad: 5-year cross-lagged analyses of loneliness and depressive symptomatology in the Chicago Health, Aging, and Social Relations Study. Psychol. Aging 2010, 25, 453–463. [Google Scholar] [CrossRef] [PubMed]
- Chiao, C.; Weng, L.; Botticello, A.L. Social participation reduces depressive symptoms among older adults: An 18-year longitudinal analysis in Taiwan. BMC Public Health 2011, 11, 292. [Google Scholar] [CrossRef] [PubMed]
- Glass, T.A.; De Leon, C.F.; Bassuk, S.S.; Berkman, L.F. Social engagement and depressive symptoms in late life: Longitudinal findings. J. Aging Health 2006, 18, 604–628. [Google Scholar] [CrossRef] [PubMed]
- Lou, V.W.; Chi, I.; Kwan, C.W.; Leung, A.Y. Trajectories of social engagement and depressive symptoms among long-term care facility residents in Hong Kong. Age Ageing 2013, 42, 215–222. [Google Scholar] [CrossRef] [PubMed]
- Antonucci, T.C.; Birditt, K.S.; Ajrouch, K.J. Convoys of social relations: Past, present and future. In Handbook of Life-Span Development, 1st ed.; Fingerman, K.L., Berg, C.A., Smith, J., Antonucci, T.C., Eds.; Springer: New York, NY, USA, 2011; pp. 161–182. [Google Scholar]
- Charles, S.T.; Carstensen, L.L. Social and emotional aging. Annu. Rev. Psychol. 2010, 61, 383–409. [Google Scholar] [CrossRef] [PubMed]
- Morrow-Howell, N.; Hong, S.I.; McCrary, S.; Blinne, W. Changes in activity among older volunteers. Res. Aging 2012, 34, 174–196. [Google Scholar] [CrossRef]
- Feinstein, J.S. The relationship between socioeconomic status and health: A review of the literature. Milbank Q. 1993, 71, 279–322. [Google Scholar] [CrossRef] [PubMed]
- House, J.S.; Lepkowski, J.M.; Kinney, A.M.; Mero, R.P.; Kessler, R.C.; Herzog, A.R. The social stratification of aging and health. J. Health Soc. Behav. 1994, 35, 213–234. [Google Scholar] [CrossRef] [PubMed]
- Kohout, F.J.; Berkman, L.F.; Evans, D.A.; Cornoni-Huntley, J. Two shorter forms of the CES-D (Center for Epidemiological Studies Depression) depression symptoms index. J. Aging Health 1993, 5, 179–193. [Google Scholar] [CrossRef] [PubMed]
- Kang, Y.; Na, D.L.; Hahn, S. A validity study on the Korean Mini-Mental State Examination (K-MMSE) in dementia patients. J. Korean Neurol. Assoc. 1997, 15, 300–308. [Google Scholar]
- Lee, H.J.; Kahng, S.K. The reciprocal relationship between cognitive functioning and depressive symptom: Group comparison by gender. Korean J. Soc. Welfare Stud. 2011, 42, 179–203. [Google Scholar]
- Jung, T.; Wickrama, K.A.S. An introduction to latent class growth analysis and growth mixture modeling. Soc. Personal. Psychol. Compass. 2008, 2, 302–317. [Google Scholar] [CrossRef]
- Muthén, B. Latent variable analysis. In The Sage Handbook of Quantitative Methodology for the Social Sciences, 1st ed.; Kaplan, D., Ed.; Sage Publications: Thousand Oaks, CA, USA, 2004; pp. 345–368. [Google Scholar]
- Arbuckle, J.L. Full information estimation in the presence of incomplete data. In Advanced Structural Equation Modeling: Issues and Techniques, 1st ed.; Marcoulides, G.A., Schumacker, R.E., Eds.; Lawrence Erlbaum Associates: Mahwah, NJ, USA, 1996; pp. 243–277. [Google Scholar]
- Martinez, I.L.; Crooks, D.; Kim, K.S.; Tanner, E. Invisible civic engagement among older adults: Valuing the contributions of informal volunteering. J. Cross Cult. Gerontol. 2011, 26, 23–37. [Google Scholar] [CrossRef] [PubMed]
- Van der Meer, M. The sociospatial diversity in the leisure activities of older people in The Netherlands. J. Aging Stud. 2008, 22, 1–12. [Google Scholar] [CrossRef] [PubMed]
- Tang, F.; Morrow-Howell, N.; Hong, S. Inclusion of diverse older populations in volunteering: The importance of institutional facilitation. Nonprofit Volunt. Sect. Q. 2009, 38, 810–827. [Google Scholar] [CrossRef]
- Messias, D.K.; De Jong, M.K.; McLoughlin, K. Being involved and making a difference: Empowerment and well-being among women living in poverty. J. Holist. Nurs. 2005, 23, 70–88. [Google Scholar] [CrossRef] [PubMed]
- Croezen, S.; Avendano, M.; Burdorf, A.; van Lenthe, F.J. Social participation and depression in old age: A fixed-effects analysis in 10 European countries. Am. J. Epidemiol. 2015, 182, 168–176. [Google Scholar] [CrossRef] [PubMed]
- Wu, Z.; Schimmele, C.M.; Chappell, N.L. Aging and late-life depression. J. Aging Health 2012, 24, 3–28. [Google Scholar] [CrossRef] [PubMed]


| Entire | High-to Moderate 8.61% (n = 212) | Slightly Increasing 44.13% (n = 1086) | Stable Low 36.77% (n = 905) | Stable High 6.50% (n = 160) | Steeply Increasing 3.98% (n = 98) | Statistics | |
|---|---|---|---|---|---|---|---|
| Demographics | |||||||
| Age | 73.18 | 75.0 (7.1) | 73.4 (6.3) | 72.1 (5.9) | 74.7 (6.0) | 74.3(5.8) | F(4,2456) = 14.408 *** |
| Education (≤six years) | 76.8% | 81.1% | 83.7% | 64.4% | 93.8% | 76.5% | (4) = 134.742 *** |
| Income status ($, log mean value) | 4.0 (2.3) | 4.0 (2.2) | 4.0 (2.2) | 4.1 (2.3) | 4.1 (2.2) | 3.3 (2.5) | F(4,2456) = 2.545 * |
| Constantly poor | 62.0% | 73.3% | 61.3% | 57.4% | 75.8% | 67.3% | (4) = 28.481 *** |
| Marital status (ref. constantly married) | 57.5% | 49.5% | 49.4% | 74.5% | 30.6% | 51.0% | (8) = 202.759 *** |
| Constantly unmarried | 35.3% | 45.3% | 42.5% | 19.7% | 60.0% | 36.7% | |
| Status changed | 7.3% | 5.2% | 8.1% | 5.9% | 9% | 12.2% | |
| Health factors | |||||||
| Chronic diseases (ref. constantly no diseases) | 18.1% | 10.8% | 15.7% | 26.1% | 5.0% | 8.2% | (8) = 107.160 *** |
| Constantly having diseases | 70.0% | 80.7% | 72.9% | 60.0% | 90.6% | 72.4% | |
| Increased | 11.9% | 8.5% | 11.4% | 13.8% | 4.4% | 19.4% | |
| Functional limitation (ref. constantly no disability) | 61.8% | 47.2% | 62.9% | 72.3% | 40.2% | 21.4% | (12) = 218.328 *** |
| Constantly having disability | 5.9% | 9.7% | 6.0% | 3.7% | 13.6% | 7.1% | |
| Increase | 20.4% | 24.4% | 19.6% | 13.3% | 31.1% | 65.3% | |
| Decrease | 11.8% | 18.8% | 11.6% | 10.7% | 15.2% | 6.1% | |
| Cognition (ref. constantly normal) | 26.3% | 11.4% | 18.8% | 44.4% | 6.1% | 6.1% | (12) = 332.610 *** |
| Constantly low and dementia risk | 42.5% | 60.2% | 47.0% | 24.9% | 79.5% | 61.2% | |
| Improved | 10.8% | 13.1% | 10.8% | 12.8% | 3.0% | 2.0% | |
| Declined | 20.3% | 15.3% | 23.4% | 17.9% | 11.4% | 30.6% | |
| Social Engagement | |||||||
| Social participation (ref. constantly participated) | 38.9% | 18.8% | 38.0% | 49.6% | 26.5% | 14.3% | (12) = 151.651 *** |
| Constantly non-participated | 25.3% | 40.3% | 25.5% | 18.6% | 38.6% | 32.7% | |
| Increased | 17.1% | 23.3% | 18.4% | 15.8% | 12.9% | 9.2% | |
| Decreased | 18.7% | 17.6% | 18.1% | 16.0% | 22.0% | 43.9% | |
| Contact frequency with close social network (ref. no change) | 62.1% | 55.1% | 64.2% | 63.3% | 59.8% | 48.0% | (8) = 47.502 *** |
| Increased | 17.7% | 21.6% | 16.2% | 20.1% | 15.2% | 9.2% | |
| Decreased | 20.2% | 23.3% | 19.7% | 16.7% | 25.0% | 42.9% |
| Entire | High to Moderate 5.3% (n = 88) | Steeply Increasing 11.5% (n = 192) | Stable Low 83.2% (n = 1388) | Statistics | |
|---|---|---|---|---|---|
| Demographics | |||||
| Age | 72.7 (6.3) | 75.1 (7.3) | 74.7 (6.7) | 72.2 (6.1) | F(2,1665) = 20.247 *** |
| Education (≤six years) | 66.7% | 87.5% | 79.7% | 63.5% | (2) = 37.924 *** |
| Income status ($, log mean value) | 7.2 (0.5) | 7.1 (0.5) | 7.2 (0.6) | 7.2 (0.5) | F(2,1665) = 2.279 |
| Constantly non-poor | 73.2% | 60.3% | 71.9% | 74.1% | (2) = 5.513 |
| Marital status (ref. constantly married) | 54.9% | 29.5% | 39.1% | 58.6% | (4) = 54.530 *** |
| Constantly unmarried | 40.0% | 67.0% | 53.6% | 36.4% | |
| Status changed | 5.2% | 3.4% | 7.3% | 5.0% | |
| Health factors | |||||
| Chronic diseases (ref. constantly no diseases) | 19.5% | 13.6% | 6.3% | 21.7% | (4) = 35.964 *** |
| Constantly having diseases | 67.1% | 81.8% | 78.6% | 64.6% | |
| Status changed | 13.4% | 4.5% | 15.1% | 13.7% | |
| Functional limitations (ref. constantly no disability) | 64.5% | 46.6% | 37.0% | 69.9% | (6) = 125.181 *** |
| Constantly having disability | 5.8% | 17.2% | 8.3% | 4.8% | |
| Increased | 18.5% | 13.8% | 42.7% | 14.8% | |
| Decreased | 11.1% | 22.4% | 12.0% | 10.4% | |
| Cognition (ref. constantly normal) | 36.3% | 10.3% | 11.5% | 41.6% | (6) = 121.166 *** |
| Constantly low and dementia risk | 33.1% | 58.6% | 57.3% | 28.0% | |
| Improved | 10.1% | 17.2% | 4.7% | 10.7% | |
| Declined | 20.4% | 13.8% | 26.6% | 19.7% | |
| Social factors | |||||
| Social participation (ref. constantly participated) | 49.9% | 44.8% | 33.9% | 52.7% | (6) = 55.933 *** |
| Constantly non-participated | 18.5% | 31.0% | 31.8% | 15.8% | |
| Increased | 13.6% | 8.6% | 7.8% | 14.7% | |
| Decreased | 18.0% | 15.5% | 26.6% | 16.8% | |
| Contact frequency with close social network (ref. no change) | 60.1% | 58.6% | 50.5% | 61.8% | (4) = 26.013 *** |
| Increased | 19.6% | 19.0% | 15.6% | 20.3% | |
| Decreased | 20.3% | 22.4% | 33.9% | 18.0% |
| High to Moderate | Slightly Increasing | Stable High | Steeply Increasing | |||||
|---|---|---|---|---|---|---|---|---|
| Coefficient | Relative Risk Ratio | Coefficient | Relative Risk Ratio | Coefficient | Relative Risk Ratio | Coefficient | Relative Risk Ratio | |
| Demographics | ||||||||
| Age | −0.031 | 0.969 | −0.015 | 0.985 | −0.062 * | 0.940 | −0.060 ** | 0.942 |
| Education (≥7 years) | −0.051 | 0.951 | −0.524 *** | 0.592 | −0.727 | 0.483 | −0.064 | 0.938 |
| Income status (Wave 1) | −0.006 | 0.994 | −0.020 | 0.980 | −0.008 | 0.992 | −0.173 ** | 0.841 |
| Exit from poverty | 0.071 | 1.073 | −0.057 | 0.945 | −0.432 | 0.649 | −0.379 | 0.684 |
| Marital status (ref. constantly married) | ||||||||
| Constantly unmarried | 0.270 | 1.310 | 0.685 *** | 1.983 | 1.134 ** | 3.108 | 0.791 ** | 2.205 |
| Status changed | 0.768 | 2.154 | 0.634** | 1.885 | 1.968 ** | 7.155 | 1.040 * | 2.831 |
| Health factors | ||||||||
| Chronic diseases (ref. constantly no diseases) | ||||||||
| Constantly having diseases | 0.887 | 2.428 | 0.599 *** | 1.821 | 2.052 ** | 7.787 | 0.952 * | 2.591 |
| Status changed | −0.269 | 0.765 | 0.334 | 1.397 | 0.511 | 1.666 | 1.160 * | 3.189 |
| Functional disability (ref. constantly no disability) | ||||||||
| Constantly having disability | −0.046 | 0.955 | 0.163 | 1.177 | 0.602 | 1.825 | 1.465 ** | 4.328 |
| Increase | 0.468 | 1.596 | 0.153 | 1.166 | 0.863 * | 2.371 | 2.241 *** | 9.404 |
| Decrease | −0.253 | 0.776 | −0.111 | 0.895 | −0.392 | 0.676 | 0.390 | 1.476 |
| Cognition (ref. constantly normal) | ||||||||
| Constantly low and dementia risk | 1.409 * | 4.093 | −0.958 *** | 2.606 | 1.964 ** | 7.129 | 1.831 *** | 6.242 |
| Improved | 1.361 * | 3.900 | 0.313 | 1.367 | 0.164 | 1.179 | −0.362 | 0.696 |
| Declined | 0.937 | 2.551 | 0.921 *** | 2.511 | 0.915 | 2.498 | 1.615 ** | 5.027 |
| Social factors | ||||||||
| Social participation (ref. constantly participated) | ||||||||
| Constantly non-participated | −0.084 | 0.919 | 0.135 | 1.145 | −0.322 | 0.724 | 0.992 ** | 2.696 |
| Increased | −0.035 | 0.965 | 0.311 | 1.365 | −0.771 | 0.462 | 0.771 | 2.161 |
| Decreased | −0.214 | 0.807 | 0.009 | 1.009 | −0.405 | 0.667 | 1.389 *** | 4.011 |
| Contact frequency with close social network (ref. no change) | ||||||||
| Increased | −0.323 | 0.724 | −0.253 | 0.777 | −0.564 | 0.569 | −0.264 | 0.768 |
| Decreased | −0.158 | 0.854 | 0.163 | 1.177 | −0.119 | 0.888 | 0.565 * | 1.759 |
| W1 depression | 1.014 *** | 2.757 | 0.127 *** | 1.135 | 0.891 *** | 2.438 | 0.034 | 1.034 |
| High-to-Moderate | Steeply Increasing | |||
|---|---|---|---|---|
| Coefficient | Odd Ratio | Coefficient | Odd Ratio | |
| Demographics | ||||
| Age | 0.003 | 1.003 | −0.005 | 0.995 |
| Education (≥7 years) | −1.574 | 0.207 | −0.179 | 0.836 |
| Income status (W1) | −1.166 * | 0.312 | 0.121 | 1.129 |
| Exit from the poverty | −0.663 | 0.515 | 0.147 | 1.159 |
| Marital status (ref. constantly married) | ||||
| Constantly unmarried | −0.040 | 0.961 | 0.356 | 1.428 |
| Status changed | 0.851 | 2.343 | 0.303 | 1.354 |
| Health factors | ||||
| Chronic diseases (ref. constantly no diseases) | ||||
| Constantly having diseases | −1.045 | 0.352 | 0.886 ** | 2.425 |
| Status changed | −0.566 | 0.568 | 0.647 | 1.910 |
| Functional disability (ref. constantly no disability) | ||||
| Constantly having disability | 0.130 | 1.139 | 0.447 | 1.563 |
| Increase | −1.038 | 0.354 | 1.125 *** | 3.080 |
| Decrease | 0.452 | 1.571 | 0.417 | 1.517 |
| Cognition (ref. constantly normal) | ||||
| Constantly low and dementia risk | 1.090 | 2.974 | 1.191 *** | 3.289 |
| Improved | 0.383 | 1.467 | 0.230 | 1.259 |
| Declined | 0.748 | 2.113 | 1.308 *** | 3.697 |
| Social factors | ||||
| Social participation (ref. constantly participated) | ||||
| Constantly non-participated | −0.796 | 0.451 | 0.260 | 1.297 |
| Increased | −0.492 | 0.611 | −0.457 | 0.633 |
| Decreased | 0.057 | 1.059 | 0.186 | 1.204 |
| Contact frequency with close social network (ref. no change) | ||||
| Increased | −0.474 | 0.623 | −0.079 | 0.924 |
| Decreased | −0.625 | 0.535 | 0.441 * | 1.555 |
| W1 depression | 1.007 *** | 2.736 | 0.116 *** | 1.123 |
© 2017 by the authors. Licensee MDPI, Basel, Switzerland. This article is an open access article distributed under the terms and conditions of the Creative Commons Attribution (CC BY) license (http://creativecommons.org/licenses/by/4.0/).
Share and Cite
Lee, H.; Park, S.; Kwon, E.; Cho, J. Socioeconomic Disparity in Later-Year Group Trajectories of Depressive Symptoms: Role of Health and Social Engagement Change. Int. J. Environ. Res. Public Health 2017, 14, 588. https://doi.org/10.3390/ijerph14060588
Lee H, Park S, Kwon E, Cho J. Socioeconomic Disparity in Later-Year Group Trajectories of Depressive Symptoms: Role of Health and Social Engagement Change. International Journal of Environmental Research and Public Health. 2017; 14(6):588. https://doi.org/10.3390/ijerph14060588
Chicago/Turabian StyleLee, Hyunjoo, Sojung Park, Eunsun Kwon, and Joonyoung Cho. 2017. "Socioeconomic Disparity in Later-Year Group Trajectories of Depressive Symptoms: Role of Health and Social Engagement Change" International Journal of Environmental Research and Public Health 14, no. 6: 588. https://doi.org/10.3390/ijerph14060588
APA StyleLee, H., Park, S., Kwon, E., & Cho, J. (2017). Socioeconomic Disparity in Later-Year Group Trajectories of Depressive Symptoms: Role of Health and Social Engagement Change. International Journal of Environmental Research and Public Health, 14(6), 588. https://doi.org/10.3390/ijerph14060588