
Can Urbanization, Social and Spatial Disparities Help to Understand the Rise of Cardiometabolic Risk Factors in Bobo-Dioulasso? A Study in a Secondary City of Burkina Faso, West Africa

Abstract
:1. Introduction
2. Methods
2.1. Study Site
2.2. Spatial and Population Sampling
2.3. Study Variables
2.3.1. Anthropometric Data
2.3.2. Blood Pressure
2.3.3. Glycemia Testing
2.3.4. Cardiometabolic Risk Markers
2.3.5. Statistical Analyses
2.3.6. Ethical Considerations
3. Results
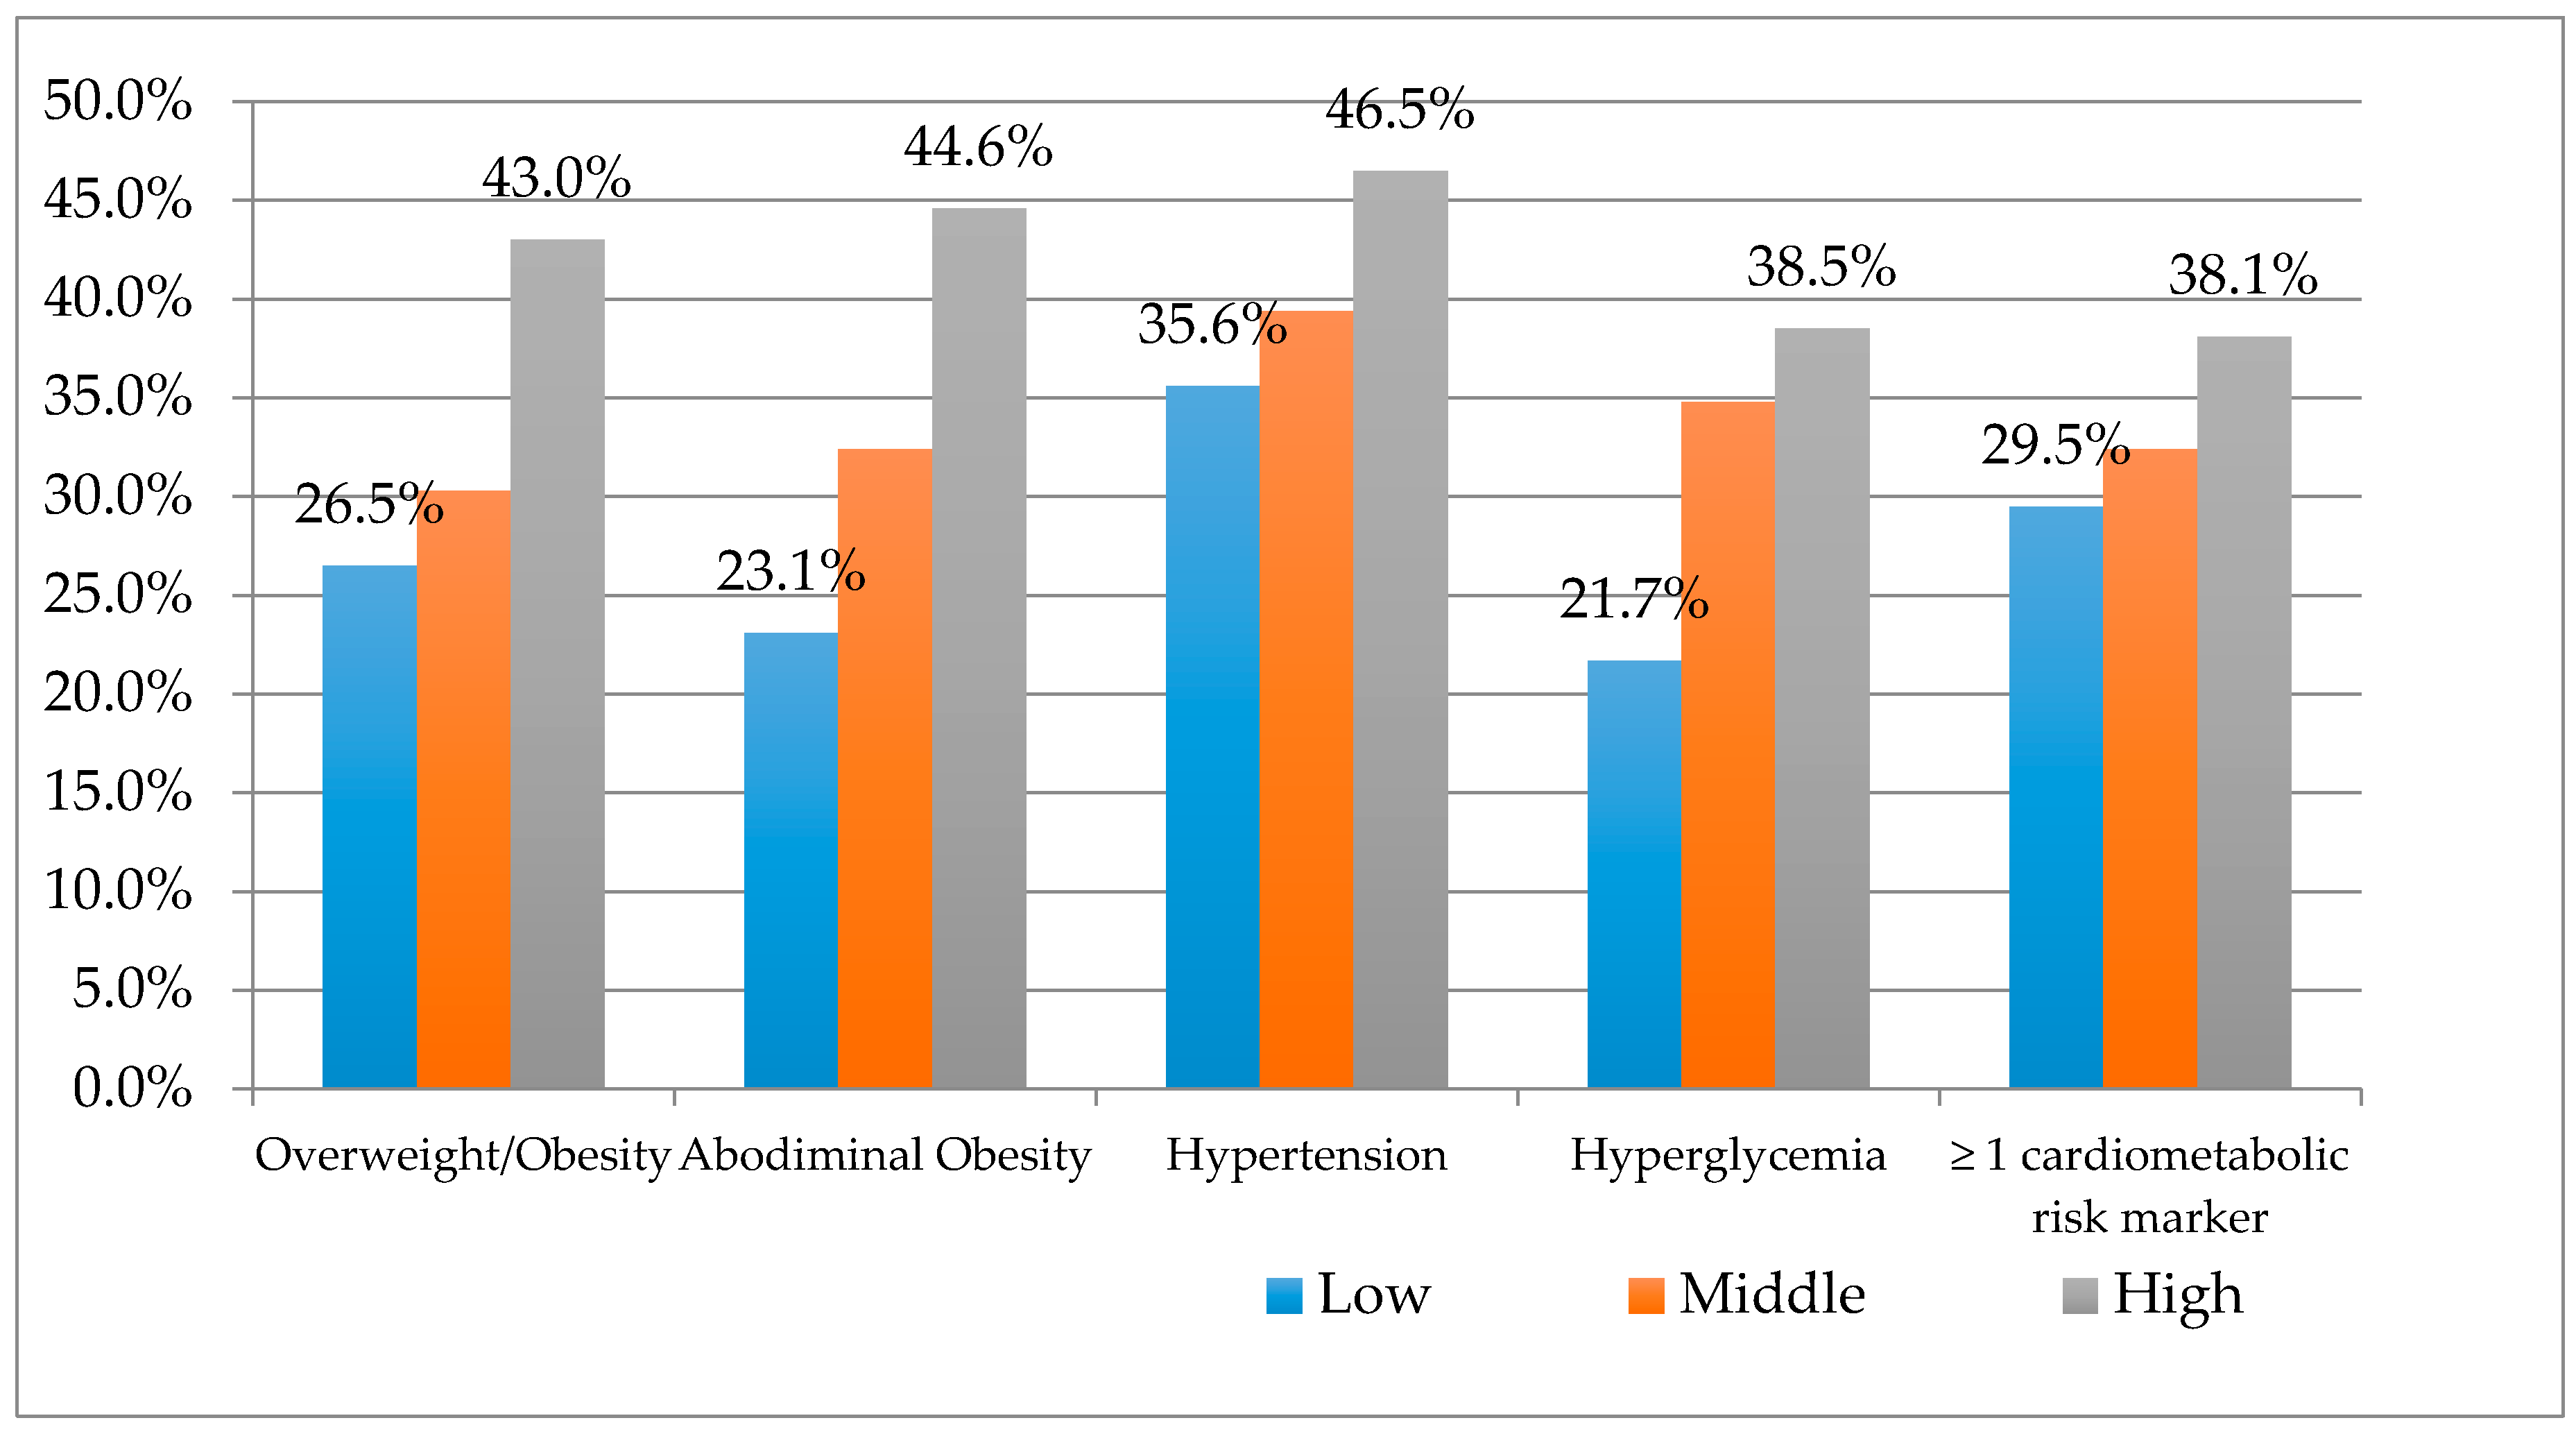
Cardiometabolic Risk Factors
4. Discussion
5. Conclusions
Acknowledgments
Author Contributions
Conflicts of Interest
References
- World Health Organization. Global Status Report on Noncommunicables Diseases; World Health Organization: Geneva, Swidzerland, 2014. [Google Scholar]
- Bernabe-Ortiz, A.; Carrillo-Larco, R.M.; Gilman, R.H.; Miele, C.H.; Checkley, W.; Wells, J.C.; Smeeth, L.; Miranda, J.J. Geographical variation in the progression of type 2 diabetes in Peru: The CRONICAS Cohort Study. Diabetes Res. Clin. Pract. 2016, 121, 135–145. [Google Scholar] [CrossRef] [PubMed]
- Abegunde, D.O.; Mathers, C.D.; Adam, T.; Ortegon, M.; Strong, K. The burden and costs of chronic diseases in low-income and middle-income countries. Lancet 2007, 370, 1929–1938. [Google Scholar] [CrossRef]
- Drewnowski, A. Concept of a nutritious food: Toward a nutrient density score. Am. J. Clin. Nutr. 2005, 82, 721–732. [Google Scholar] [PubMed]
- Drewnowski, A.; Specter, S.E. Poverty and obesity: The role of energy density and energy costs. Am. J. Clin. Nutr. 2004, 79, 6–16. [Google Scholar] [PubMed]
- Popkin, B.M. Global nutrition dynamics: The world is shifting rapidly toward a diet linked with noncommunicable diseases. Am. J. Clin. Nutr. 2006, 84, 289–298. [Google Scholar] [PubMed]
- World Health Organization. Diet, Nutrition and the Prevention of Chronic Diseases; World Health Organization: Geneva, Swidzerland, 2003. [Google Scholar]
- Despres, J.P.; Cartier, A.; Cote, M.; Arsenault, B.J. The concept of cardiometabolic risk: Bridging the fields of diabetology and cardiology. Ann. Med. 2008, 40, 514–523. [Google Scholar] [CrossRef] [PubMed]
- Drewnowski, A.; Popkin, B.M. The nutrition transition: New trends in the global diet. Nutr. Rev. 1997, 55, 31–43. [Google Scholar] [CrossRef] [PubMed]
- Misra, A.; Khurana, L. Obesity and the metabolic syndrome in developing countries. J. Clin. Endocrinol. Metab. 2008, 93, S9–S30. [Google Scholar] [CrossRef] [PubMed]
- Abubakari, A.R.; Lauder, W.; Agyemang, C.; Jones, M.; Kirk, A.; Bhopal, R.S. Prevalence and time trends in obesity among adult West African populations: A meta-analysis. Obes. Rev. 2008, 9, 297–311. [Google Scholar] [CrossRef] [PubMed]
- Institut National de la Statistique et de la Démographie. Recueil des Concepts, Définitions, Indicateurs et Méthodologies Utilisés Dans le Système Statistique National; Institut National de la Statistique et de la Démographie: Ouagadougou, Burkina Faso, 2008. [Google Scholar]
- Zabsonre, P.; Sedogo, B.; Lankoande, D.; Dyemkouma, F.; Bertrand, E. Obésité et maladies chroniques en Afrique sub-Saharienne. Med. D’afrique Noire 2000, 47, 1–5. (In French) [Google Scholar]
- Meunier-Nikiema, A.; Karama, F.; Kassie, D.; Fournet, F. Ville et Dynamique de L’offre de Soins: Bobo-Dioulasso (Burkina Faso). Available online: https://f.hypotheses.org/wp-content/blogs.dir/1946/files/2015/12/Meunier-Nikiema_Karama_Kassie_Fournet_rfst_2015.pdf (accessed on 5 September 2016). (In French).
- Borderon, M.; Oliveau, S.; Machault, V.; Vignolles, C.; Lacaux, J.-P.; N’donky, A. Qualifier les espaces urbains à Dakar, Sénégal: Résultats préliminaires de l’approche croisée entre télédétection et données censitaires spatialisées. Cybergeo Eur. J. Geogr. 2014. [Google Scholar] [CrossRef]
- Kassie, D. Segmentations Urbaines et Disparités de Santé Dans une Ville Moyenne Africaine: Du Paludisme Aux Etats Nutritionnels à Bobo-Dioulasso (Burkina Faso); University of Nanterre: Nanterre, France, 2015. (In French) [Google Scholar]
- Lohman, T.; Roche, A.; Martorell, R. Anthropometric Standardization Reference Manual; Human Kinetics Books: Champaign, IL, USA, 1988. [Google Scholar]
- World Health Organization. Obesity: Preventing and Managing the Global Epidemic; World Health Organization: Geneva, Swidzerland, 2000. [Google Scholar]
- World Health Organization. The Metabolic Syndrome. Definition, Diagnosis and Classification of Diabetes Mellitus and Its Complications; World Health Organization: Geneva, Swidzerland, 1999. [Google Scholar]
- Chalmers, J.; MacMahon, S.; Mancia, G.; Whitworth, J.; Beilin, L.; Hansson, L.; Neal, B.; Rodgers, A.; Ni Mhurchu, C.; Clark, T. 1999 World Health Organization-International Society of hypertension guidelines for the management of hypertension. Guidelines sub-committee of the World Health Organization. Clin. Exp. Hypertens. 1999, 21, 1009–1060. [Google Scholar] [PubMed]
- Alberti, K.G.; Eckel, R.H.; Grundy, S.M.; Zimmet, P.Z.; Cleeman, J.I.; Donato, K.A.; Fruchart, J.C.; Philip, W.; James, T.; Loria, C.M.; et al. Harmonizing the metabolic syndrome: A joint interim statement of the international diabetes federation task force on epidemiology and prevention; national heart, lung, and blood institute; American Heart Association; World Heart Federation; International Atherosclerosis Society; and International Association for the study of obesity. Circulation 2009, 120, 1640–1645. [Google Scholar] [PubMed]
- Niakara, A.; Fournet, F.; Gary, J.; Harang, M.; Nebie, L.V.; Salem, G. Hypertension, urbanization, social and spatial disparities: A cross-sectional population-based survey in a West African urban environment (Ouagadougou, Burkina Faso). Trans. R. Soc. Trop. Med. Hyg. 2007, 101, 1136–1142. [Google Scholar] [CrossRef] [PubMed]
- Ouedraogo, H.Z.; Fournet, F.; Martin-Prevel, Y.; Gary, J.; Henry, M.C.; Salem, G. Socio-spatial disparities of obesity among adults in the urban setting of Ouagadougou, Burkina Faso. Public Health Nutr. 2008, 11, 1280–1287. [Google Scholar] [CrossRef] [PubMed]
- Ofori-Asenso, R.; Agyeman, A.A.; Laar, A.; Boateng, D. Overweight and obesity epidemic in Ghana—A systematic review and meta-analysis. BMC Public Health 2016, 16. [Google Scholar] [CrossRef] [PubMed]
- Bosu, W.K. An overview of the nutrition transition in West Africa: Implications for non-communicable diseases. Proc. Nutr. Soc. 2015, 74, 466–477. [Google Scholar] [CrossRef] [PubMed]
- Zeba, A.N.; Delisle, H.F.; Renier, G.; Savadogo, B.; Baya, B. The double burden of malnutrition and cardiometabolic risk widens the gender and socio-economic health gap: A study among adults in Burkina Faso (West Africa). Public Health Nutr. 2012, 15, 2210–2219. [Google Scholar] [CrossRef] [PubMed]
- Allender, S.; Foster, C.; Hutchinson, L.; Arambepola, C. Quantification of urbanization in relation to chronic diseases in developing countries: A systematic review. J. Urban Health Bull. N. Y. Acad. Med. 2008, 85, 938–951. [Google Scholar] [CrossRef] [PubMed]
- Popkin, B.M. The nutrition transition and its health implications in lower-income countries. Public Health Nutr. 1998, 1, 5–21. [Google Scholar] [CrossRef] [PubMed]
- Ezzati, M.; Vander Hoorn, S.; Lawes, C.M.; Leach, R.; James, W.P.; Lopez, A.D.; Rodgers, A.; Murray, C.J. Rethinking the “diseases of affluence” paradigm: Global patterns of nutritional risks in relation to economic development. PLoS Med. 2005, 2, e133. [Google Scholar] [CrossRef] [PubMed]
- Monteiro, C.A.; Moura, E.C.; Conde, W.L.; Popkin, B.M. Socioeconomic status and obesity in adult populations of developing countries: A review. Bull. World Health Organ. 2004, 82, 940–946. [Google Scholar] [PubMed]
- Miao, J.; Wu, X. Urbanization, socioeconomic status and health disparity in China. Health Place 2016, 42, 87–95. [Google Scholar] [CrossRef] [PubMed]
- Fang, H.; Rizzo, J.A. Does inequality in China affect health differently in high-versus low-income households? Appl. Econ. 2012, 44, 1081–1090. [Google Scholar] [CrossRef]
- Maruapula, S.D.; Jackson, J.C.; Holsten, J.; Shaibu, S.; Malete, L.; Wrotniak, B.; Ratcliffe, S.J.; Mokone, G.G.; Stettler, N.; Compher, C. Socio-economic status and urbanization are linked to snacks and obesity in adolescents in Botswana. Public Health Nutr. 2011, 14, 2260–2267. [Google Scholar] [CrossRef] [PubMed]
- Zhu, Y.G.; Ioannidis, J.P.; Li, H.; Jones, K.C.; Martin, F.L. Understanding and harnessing the health effects of rapid urbanization in China. Environ. Sci. Technol. 2011, 45, 5099–5104. [Google Scholar] [CrossRef] [PubMed]
- Delisle, H.; Ntandou-Bouzitou, G.; Agueh, V.; Sodjinou, R.; Fayomi, B. Urbanisation, nutrition transition and cardiometabolic risk: The Benin study. Br. J. Nutr. 2012, 107, 1534–1544. [Google Scholar] [CrossRef] [PubMed]
- Sodjinou, R.; Agueh, V.; Fayomi, B.; Delisle, H. Obesity and cardio-metabolic risk factors in urban adults of Benin: Relationship with socio-economic status, urbanisation, and lifestyle patterns. BMC Public Health 2008, 8. [Google Scholar] [CrossRef] [PubMed]
- Ntandou, G.; Delisle, H.; Agueh, V.; Fayomi, B. Abdominal obesity explains the positive rural-urban gradient in the prevalence of the metabolic syndrome in Benin, West Africa. Nutr. Res. 2009, 29, 180–189. [Google Scholar] [CrossRef] [PubMed]

| Proximity to the Center | Period of Urbanization | Presence of Infrastructures | Surveyed Adults | |||
|---|---|---|---|---|---|---|
| Men | Women | Total | ||||
| Tounouma | +++ | Old | ++ | 111 | 142 | 253 |
| Dogona | ++ | Old | +++ | 84 | 109 | 193 |
| Secteur 25 | − | Recent | + | 79 | 136 | 215 |
| Yéguéré | + | Recent | − | 104 | 95 | 199 |
| Total | 378 | 482 | 860 | |||
| All (n = 816) | Tounouma (n = 253) | Dogona (n = 193) | Secteur 25 (n = 215) | Yéguéré (n = 199) | p | ||||||
|---|---|---|---|---|---|---|---|---|---|---|---|
| Mean or % | SD or 95% CI | Mean or % | SD or 95% CI | Mean or % | SD or 95% CI | Mean or % | SD or 95% CI | Mean or % | SD or 95% CI | ||
| Age (years) | 43.2 | 6.9 | 44.2 | 7.3 | 43.5 | 6.9 | 42.1 | 6.6 | 43.0 | 6.0 | 0.02 |
| Sex | |||||||||||
| Women | 56.0 | (52.7; 59.3) | 56.1 | (50.0; 62.2) | 56.5 | (49.5; 63.5) | 63.3 | (56.9; 69.7) | 47.7 | (40.8; 54.6) | 0.076 |
| Men | 44.0 | (40.7; 47.3) | 43.9 | (37.8; 50.0) | 43.5 | 36.5; 50.5) | 36.7 | (30.3; 43.1) | 52.3 | (45.4; 59.2) | 0.076 |
| Formal education | |||||||||||
| None | 44.8 | (39.9; 49.7) | 35.6 | (29.7; 41.5) | 43.5 | (36.5; 50.5) | 49.8 | (43.1; 56.5) | 52.3 | (45.4; 59.2) | 0.001 |
| Men | 24.3 | (20.0; 28.6) | 18.0 | (10.0; 26.0) | 18.3 | (9.9; 26.7) | 22.6 | (14.6; 30.6) | 36.2 | (27.1; 45.3) | 0.426 |
| Women | 75.7 | (71.4; 80.0) | 82.0 | (74.0; 90.0) | 81.7 | (73.3; 90.3) | 77.4 | (69.4; 85.4) | 63.8 | (54.7; 72.9) | 0.426 |
| Primary school | 38.5 | (33.3; 43.7) | 37.9 | (32.0; 43.8) | 44.0 | (37.0; 51.0) | 32.1 | (25.9; 38.3) | 40.7 | (33.9; 47.5) | 0.001 |
| Men | 58.8 | (53.5; 64.1) | 56.3 | (46.4; 66.2) | 60.0 | (49.6; 70.4) | 46.4 | (34.6; 58.2) | 71.3 | (61.4; 81.2) | 0.1 |
| Women | 41.2 | (35.9; 46.5) | 43.7 | 33.8; 53.6) | 40.0 | (29.6; 50.4) | 53.6 | (41.8; 55.4) | 28.7 | (18.8; 38.6) | 0.1 |
| Secondary school & above | 16.7 | (4.6; 22.8) | 26.5 | (21.1; 31.9) | 12.4 | (7.8; 17.0) | 18.1 | (13.0; 23.1) | 7.0 | (3.5; 10.5) | 0.001 |
| Men | 61.1 | (53.2; 69.0) | 59.7 | (48.0; 71.4) | 66.7 | (47.9; 85.5) | 59.0 | (43.6; 74.4) | 64.3 | (39.3; 92.3) | 0.918 |
| Women | 38.9 | (31.4; 46.8) | 40.3 | (28.6; 52.0) | 33.3 | (14.5; 52.6) | 41.0 | (25.6; 56.4) | 35.7 | (10.7; 60.7) | 0.918 |
| Income level | |||||||||||
| Low | 33.2 | (27.8; 38.6) | 29.2 | (23.6; 34.8) | 38.0 | (31.1; 44.9) | 5.6 | (2.5; 8.7) | 63.3 | (56.6; 70.0) | 0.001 |
| Men | 46.1 | (40.3; 51.9) | 42.5 | (31.2; 53.8) | 43.8 | (32.4; 55.2) | 25.0 | (0.5; 49.5) | 51.6 | (42.9; 60.3) | 0.239 |
| Women | 53.9 | (48.1; 59.7) | 57.5 | (46.2; 68.8) | 56.2 | (44.8; 67.6) | 75.0 | (50.5; 99.5) | 48.4 | (39.7; 57.1) | 0.239 |
| Middle | 33.6 | (28.2; 39.0) | 36.0 | (30.1; 41.9) | 43.2 | (36.2; 50.2) | 33.3 | (27.0; 39.9) | 21.1 | (15.4; 26.8) | 0.001 |
| Men | 42.2 | (36.5; 47.9) | 45.6 | (35.3; 55.9) | 42.2 | (31.6; 52.8) | 31.9 | (21.2; 42.6) | 52.4 | (37.4; 67.4) | 0.151 |
| Women | 57.8 | (52.1; 63.5) | 54.4 | (44.1; 64.7) | 57.8 | (47.2; 68.4) | 68.1 | (57.4; 78.8) | (47.6 | (32.6; 47.6) | 0.151 |
| High | 33.2 | (27.8; 38.6) | 34.8 | (28.9; 40.7) | 18.8 | (13.3; 24.3) | 60.7 | (54.2; 67.2) | 15.6 | (10.6; 20.6) | 0.001 |
| Men | 44.0 | (38.3; 49.7) | 43.7 | (33.3; 54.0) | 47.2 | (30.9; 63.5) | 40.8 | (32.4; 49.2) | 54.8 | (37.8; 72.3) | 0.535 |
| Women | 56 | (50.3; 61.7) | 56.3 | (45.9; 66.7) | 52.8 | (36.5; 69.1) | 59.2 | (50.8; 67.6) | 45.2 | (27.7; 62.7) | 0.535 |
| Height (cm) | 167.5 | 8.9 | 167.5 | 9.1 | 166.9 | 9.6 | 166.9 | 8.2 | 168.4 | 8.5 | 0.284 |
| Men | 173.5 | 8.2 | 174.0 | 8.1 | 172.1 | 11.1 | 174.3 | 6.3 | 173.5 | 6.9 | 0.0001 |
| Women | 162.7 | 6.1 | 162.4 | 6.3 | 163.1 | 5.9 | 162.7 | 5.9 | 162.8 | 6.3 | 0.0001 |
| Weight (kg) | 68.9 | 14.2 | 72.0 | 16.7 | 67.8 | 12.3 | 69.6 | 13.6 | 65.3 | 11.9 | 0.001 |
| Men | 69.7 | 12.8 | 72.1 | 15.4 | 68.4 | 12.4 | 71.0 | 11.5 | 67.3 | 10.7 | 0.173 |
| Women | 68.3 | 15.1 | 72.0 | 17.7 | 67.3 | 12.4 | 68.8 | 14.7 | 63.2 | 12.9 | 0.173 |
| BMI kg/m2 | 24.6 | 5.1 | 25.7 | 5.9 | 24.5 | 5.1 | 25.0 | 4.8 | 23.0 | 3.9 | 0.001 |
| Men | 23.2 | 4.3 | 23.8 | 4.8 | 23.4 | 5.3 | 23.4 | 3.7 | 22.3 | 3.2 | 0.0001 |
| Women | 25.8 | 5.4 | 27.2 | 6.2 | 25.3 | 4.7 | 26.0 | 5.2 | 23.8 | 4.5 | 0.0001 |
| WC (cm) | 83.9 | 11.8 | 86.1 | 13.2 | 82.8 | 11.9 | 84.7 | 11.3 | 81.5 | 9.6 | 0.001 |
| Men | 82.7 | 10.8 | 84.1 | 12.1 | 80.9 | 10.9 | 84.1 | 10.9 | 81.5 | 8.9 | 0.004 |
| Women | 85.0 | 12.4 | 87.7 | 13.7 | 84.2 | 12.5 | 85.2 | 11.6 | 81.4 | 10.5 | 0.004 |
| DBP | 83.7 | 13.7 | 85.3 | 14.6 | 83.7 | 13.3 | 83.3 | 13.6 | 82.2 | 12.7 | 0.095 |
| Men | 83.0 | 13.7 | 86.0 | 16.0 | 81.7 | 12.8 | 81.3 | 11.8 | 82.2 | 12.7 | 0.181 |
| Women | 84.3 | 13.6 | 84.7 | 13.7 | 85.3 | 13.5 | 84.4 | 14.4 | 82.2 | 12.7 | 0.181 |
| SBP | 126.2 | 19.7 | 129.2 | 23.7 | 124.6 | 17.7 | 124.3 | 21.6 | 135.8 | 19.7 | 0.083 |
| Men | 128.1 | 20.0 | 132.5 | 24.2 | 125.1 | 16.3 | 123.7 | 17.8 | 129.0 | 18.1 | 0.021 |
| Women | 124.7 | 22.0 | 126.6 | 23.2 | 124.3 | 18.7 | 124.7 | 23.6 | 122.3 | 20.8 | 0.021 |
| Blood sugar (mg/dL) | 83.4 | 27.5 | 87.9 | 33.2 | 88.9 | 22.3 | 83.4 | 27.0 | 72.3 | 20.7 | 0.0001 |
| Men | 84.0 | 23.6 | 86.2 | 17.3 | 92.7 | 16.7 | 89.1 | 35.3 | 70.9 | 17.1 | 0.682 |
| Women | 83.0 | 30.3 | 89.2 | 41.6 | 86.1 | 25.5 | 80.0 | 20.2 | 73.9 | 24.1 | 0.682 |
| Hypertension | 40.5 | (37.2; 43.7) | 48.2 | (42.0; 54.3) | 39.9 | (32.9; 46.8) | 34.9 | (28.4; 41.3) | 37.2 | (30.5; 43.9) | 0.003 |
| Men | 42.2 | (37.0; 47.4) | 46.7 | (37.9; 55.5) | 37.7 | (27.0; 48.4) | 32.0 | (21.5; 42.5) | 50.0 | (38.6; 61.4) | 0.223 |
| Women | 57.8 | (52.6; 63.0) | 53.3 | (44.5; 62.1) | 62.3 | (51.9; 73.0) | 68.0 | (57.5; 78.5) | 50.0 | (38.6; 61.4) | 0.223 |
| Overweight/Obesity | 43.2 | (39.9; 46.5) | 50.6 | (44.4; 56.7) | 42.9 | (35.9; 49.8) | 47.9 | (41.1; 54.6) | 29.1 | (22.7; 35.4) | 0.001 |
| Men | 32.2 | (27.5; 36.9) | 30.5 | (22.6; 38.4) | 34.6 | (24.3; 44.9) | 28.2 | (19.5; 36.9) | 39.7 | (27.2; 52.2) | <0.001 |
| Women | 67.8 | (63.1; 72.5) | 69.5 | (61.6; 77.4) | 65.4 | (55.1; 75.7) | 71.8 | (63.1; 80.5) | 60.3 | (47.8; 72.8) | <0.001 |
| Abdominal obesity | 34.6 | (31.4; 37.8) | 40.3 | (34.3; 46.3) | 30.9 | (24.3; 37.5) | 38.6 | (32.1;45.1) | 26.6 | (20.5; 32.7) | 0.008 |
| Men | 37.5 | (32.0; 43.0) | 34.3 | (25.1; 43.5) | 43.5 | (22.3; 46.7) | 33.7 | (23.5; 43.9) | 52.8 | (39.4; 66.2) | 0.004 |
| Women | 62.5 | (57.0; 68.0) | 65.7 | (56.5; 74.9) | 65.5 | (53.3; 77.7) | 66.3 | (56.1; 76.5) | 47.2 | (33.8; 60.6) | 0.004 |
| Hyperglycemia | 5.3 | (3.8; 6.7) | 6.7 | (3.6; 9.7) | 6.7 | (3.1; 10.2) | 6.0 | (2.8; 9.2) | 1.5 | (0.2; 3.2) | 0.007 |
| Men | 50.0 | (35.6; 64.4) | 52.9 | (29.2; 76.6) | 53.8 | (26.7; 80.9) | 46.2 | (19.1; 73.3) | 33.3 | (10.0; 56.6) | 0.242 |
| Women | 50.0 | (35.6; 64.4) | 47.1 | (23.4; 70.8) | 46.2 | (19.1; 73.3) | 53.8 | (26.7; 80.9) | 66.7 | (43.4; 90.0) | 0.242 |
| ≥1 cardiometabolic risk marker | 62.7 | (59.5; 65.9) | 69.2 | (63.5; 74.8) | 60.6 | (53.7; 67.4) | 60.5 | (53.9; 67.1) | 51.3 | (44.3; 58.2) | 0.269 |
| Men | 39.7 | (35.6; 43.8) | 39.2 | (32.0; 46.4) | 39.2 | (30.5; 47.9) | 34.1 | (26.1; 42.1) | 48.1 | (38.7; 57.5) | 0.001 |
| Women | 60.3 | (56.2; 64.4) | 60.8 | (53.6; 68.0) | 60.8 | (52.1; 69.5) | 65.9 | (57.9; 73.9) | 51.9 | (42.5; 61.3) | 0.001 |
| Cardiometabolic Risk Factors | ||||||||||
|---|---|---|---|---|---|---|---|---|---|---|
| BMI | p Value | WC | p Value | Hyperglycemia | p Value | SBP | p Value | DBP | p Value | |
| Adjusted R2 | 0.115 | <0.0001 | 0.64 | <0.0001 | 0.059 | <0.0001 | 0.146 | <0.0001 | 0.063 | <0.0001 |
| Sex (♀ = 0; ♂ = 1) | −0.249 | <0.0001 | −0.089 | 0.014 | 0.016 | 0.318 | 0.159 | 0.001 | −0.001 | 0.985 |
| Age | 0.125 | <0.0001 | 0.134 | <0.0001 | 0.111 | 0.001 | 0.352 | <0.0001 | 0.241 | <0.0001 |
| Sub-space | ||||||||||
| Dogona | −0.015 | 0.332 | −0.87 | 0.028 | 0.104 | 0.001 | −0.075 | 0.053 | −0.036 | 0.415 |
| Secteur 25 | 0.042 | 0.112 | −0.075 | 0.07 | 0.003 | 0.468 | −0.081 | 0.048 | −0.012 | 0.363 |
| Tounouma | 0.136 | <0.0001 | 0.096 | 0.028 | 0.108 | 0.001 | 0.017 | 0.007 | 0.076 | 0.025 |
| Yéguéré | −0.174 | <0.0001 | −0.106 | 0.011 | −0.221 | <0.0001 | −0.016 | 0.005 | −0.061 | 0.038 |
| Income group | ||||||||||
| Low | −0.138 | <0.0001 | −0.168 | <0.0001 | −0.037 | 0.140 | −0.061 | 0.039 | −0.077 | 0.012 |
| Middle | −0.029 | 0.199 | −0.127 | 0.001 | 0.006 | 0.428 | 0.038 | 0.345 | 0.001 | 0.485 |
| High | 0.167 | <0.0001 | 0.169 | <0.0001 | 0.031 | 0.185 | 0.057 | 0.186 | 0.076 | 0.014 |
| Education level | ||||||||||
| No formal education | 0.012 | 0.358 | −0.024 | 0.538 | −0.023 | 0.255 | −0.021 | 0.268 | −0.009 | 0.397 |
| Primary school | −0.061 | 0.038 | 0.023 | 0.538 | −0.024 | 0.240 | −0.028 | 0.459 | −0.027 | 0.213 |
| Secondary school & above | 0.063 | 0.034 | 0.030 | 0.423 | 0.062 | 0.036 | 0.014 | 0.721 | 0.048 | 0.083 |
© 2017 by the authors. Licensee MDPI, Basel, Switzerland. This article is an open access article distributed under the terms and conditions of the Creative Commons Attribution (CC BY) license (http://creativecommons.org/licenses/by/4.0/).
Share and Cite
Zeba, A.N.; Yaméogo, M.T.; Tougouma, S.J.-B.; Kassié, D.; Fournet, F. Can Urbanization, Social and Spatial Disparities Help to Understand the Rise of Cardiometabolic Risk Factors in Bobo-Dioulasso? A Study in a Secondary City of Burkina Faso, West Africa. Int. J. Environ. Res. Public Health 2017, 14, 378. https://doi.org/10.3390/ijerph14040378
Zeba AN, Yaméogo MT, Tougouma SJ-B, Kassié D, Fournet F. Can Urbanization, Social and Spatial Disparities Help to Understand the Rise of Cardiometabolic Risk Factors in Bobo-Dioulasso? A Study in a Secondary City of Burkina Faso, West Africa. International Journal of Environmental Research and Public Health. 2017; 14(4):378. https://doi.org/10.3390/ijerph14040378
Chicago/Turabian StyleZeba, Augustin Nawidimbasba, Marceline Téné Yaméogo, Somnoma Jean-Baptiste Tougouma, Daouda Kassié, and Florence Fournet. 2017. "Can Urbanization, Social and Spatial Disparities Help to Understand the Rise of Cardiometabolic Risk Factors in Bobo-Dioulasso? A Study in a Secondary City of Burkina Faso, West Africa" International Journal of Environmental Research and Public Health 14, no. 4: 378. https://doi.org/10.3390/ijerph14040378
APA StyleZeba, A. N., Yaméogo, M. T., Tougouma, S. J.-B., Kassié, D., & Fournet, F. (2017). Can Urbanization, Social and Spatial Disparities Help to Understand the Rise of Cardiometabolic Risk Factors in Bobo-Dioulasso? A Study in a Secondary City of Burkina Faso, West Africa. International Journal of Environmental Research and Public Health, 14(4), 378. https://doi.org/10.3390/ijerph14040378