
Sitting Time, Physical Activity and Sleep by Work Type and Pattern—The Australian Longitudinal Study on Women’s Health


Abstract
:1. Introduction
2. Methods
2.1. Participants
2.2. Measures
2.2.1. Outcome Measures
2.2.2. Predictors
2.2.3. Covariates
2.3. Statistical Analysis
3. Results
3.1. Work Hours
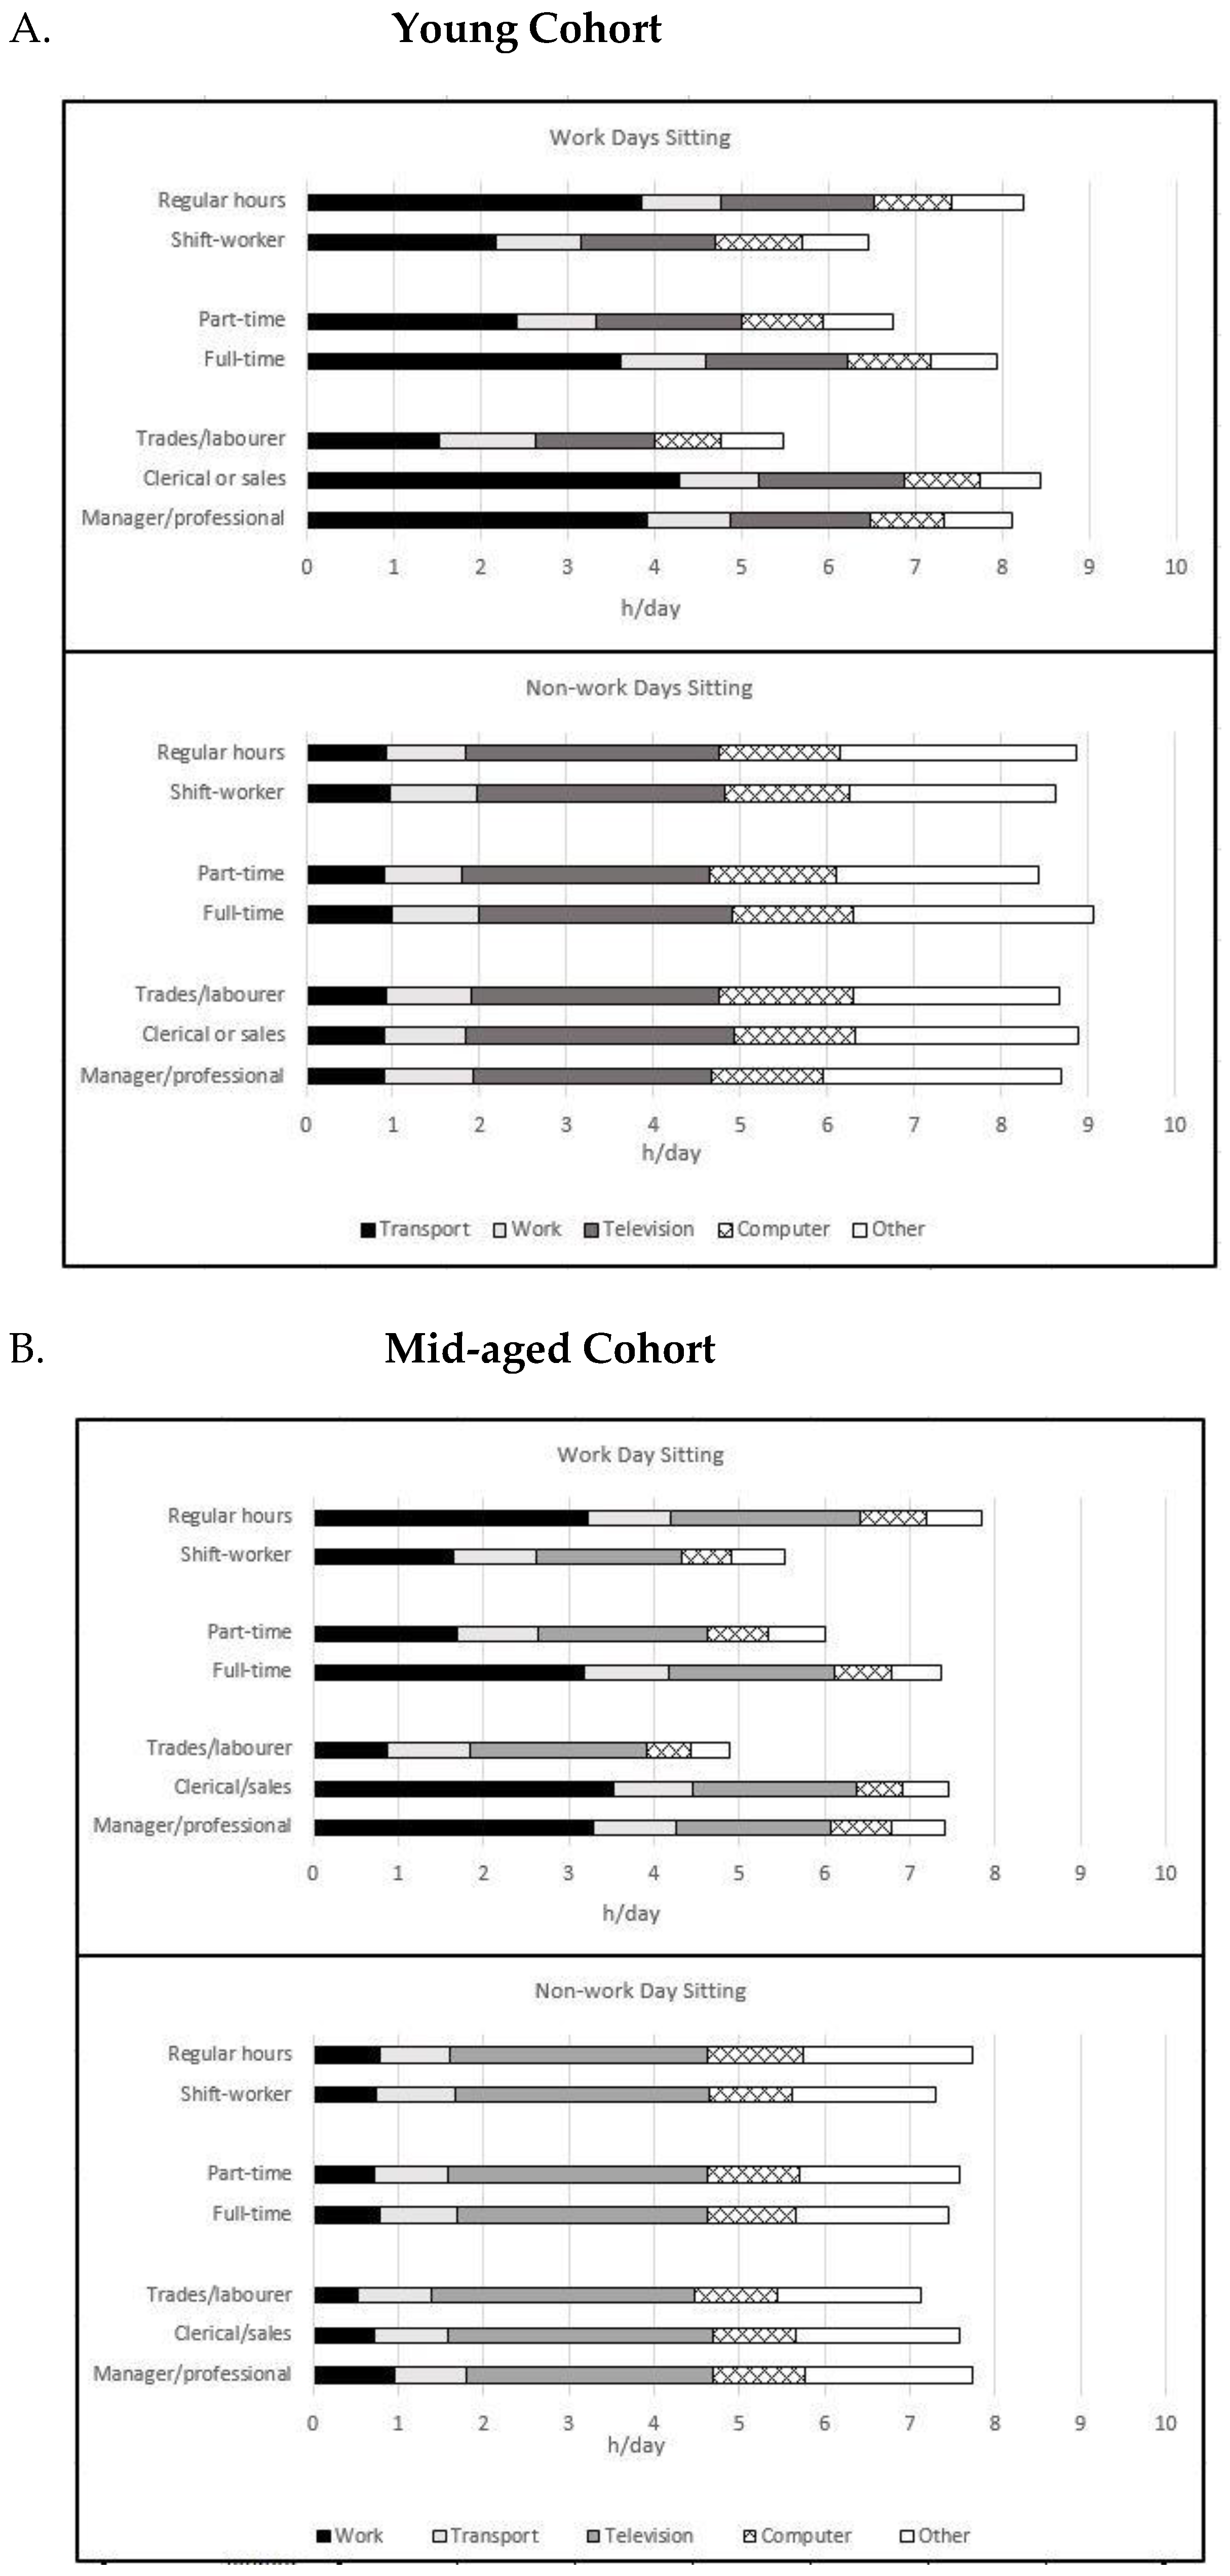
3.2. Sitting Time
3.3. Sleep
3.4. Physical Activity
4. Discussion
4.1. Sitting Time
4.2. Sleep
4.3. Physical Activity
4.4. Similarities and Differences between Cohorts
5. Conclusions
Supplementary Materials
Acknowledgments
Author Contributions
Conflicts of Interest
References
- Bansil, P.; Kuklina, E.V.; Merritt, R.K.; Yoon, P.W. Associations between sleep disorders, sleep duration, quality of sleep, and hypertension: Results from the National Health and Nutrition Examination Survey, 2005 to 2008. J. Clin. Hypertens. (Greenwich) 2011, 13, 739–743. [Google Scholar] [CrossRef] [PubMed]
- Cappuccio, F.P.; D’Elia, L.; Strazzullo, P.; Miller, M.A. Quantity and quality of sleep and incidence of type 2 diabetes: A systematic review and meta-analysis. Diabetes Care 2010, 33, 414–420. [Google Scholar] [CrossRef] [PubMed]
- Wilmot, E.G.; Edwardson, C.L.; Achana, F.A.; Davies, M.J.; Gorely, T.; Gray, L.J.; Khunti, K.; Yates, T.; Biddle, S.J. Sedentary time in adults and the association with diabetes, cardiovascular disease and death: systematic review and meta-analysis. Diabetologia 2012, 55, 2895–2905. [Google Scholar] [CrossRef] [PubMed]
- Moore, S.C.; Patel, A.V.; Matthews, C.E.; Berrington de Gonzalez, A.; Park, Y.; Katki, H.A.; Linet, M.S.; Weiderpass, E.; Visvanathan, K.; Helzlsouer, K.J.; et al. Leisure time physical activity of moderate to vigorous intensity and mortality: A large pooled cohort analysis. PLoS Med. 2012, 9, e1001335. [Google Scholar] [CrossRef] [PubMed]
- Jeon, C.Y.; Lokken, R.P.; Hu, F.B.; van Dam, R.M. Physical Activity of Moderate Intensity and Risk of Type 2 Diabetes: A systematic review. Diabetes Care 2007, 30, 744–752. [Google Scholar] [CrossRef] [PubMed]
- Thorp, A.A.; Healy, G.N.; Winkler, E.; Clark, B.K.; Gardiner, P.A.; Owen, N.; Dunstan, D.W. Prolonged sedentary time and physical activity in workplace and non-work contexts: A cross-sectional study of office, customer service and call centre employees. Int. J. Behav. Nutr. Phys. Act. 2012, 9, 128. [Google Scholar] [CrossRef] [PubMed]
- Chau, J.Y.; van der Ploeg, H.P.; Merom, D.; Chey, T.; Bauman, A.E. Cross-sectional associations between occupational and leisure-time sitting, physical activity and obesity in working adults. Prev. Med. 2012, 54, 195–200. [Google Scholar] [CrossRef] [PubMed]
- Jans, M.P.; Proper, K.I.; Hildebrandt, V.H. Sedentary behavior in Dutch workers: Differences between occupations and business sectors. Am. J. Prev. Med. 2007, 33, 450–454. [Google Scholar] [CrossRef] [PubMed]
- Brown, W.; Miller, Y.; Miller, R. Sitting time and work patterns as indicators of overweight and obesity in Australian adults. Int. J. Obes. Relat. Metab. Disord. 2003, 27, 1340–1346. [Google Scholar] [CrossRef] [PubMed]
- Walsh, S.M.; Umstattd Meyer, M.R.; Stamatis, A.; Morgan, G.B. Why Women Sit: Determinants of Leisure Sitting Time for Working Women. Womens Health Issues 2015, 25, 673–679. [Google Scholar] [CrossRef] [PubMed]
- Kirk, M.A.; Rhodes, R.E. Occupation correlates of adults’ participation in leisure-time physical activity: A systematic review. Am. J. Prev. Med. 2011, 40, 476–485. [Google Scholar] [CrossRef] [PubMed]
- Brown, H.E.; Ryde, G.C.; Gilson, N.D.; Burton, N.W.; Brown, W.J. Objectively Measured Sedentary Behavior and Physical Activity in Office Employees: Relationships with Presenteeism. J. Occup. Environ. Med. 2013, 55, 945–953. [Google Scholar] [CrossRef] [PubMed]
- Tigbe, W.W.; Lean, M.E.; Granat, M.H. A physically active occupation does not result in compensatory inactivity during out-of-work hours. Prev. Med. 2011, 53, 48–52. [Google Scholar] [CrossRef] [PubMed]
- Centre for Disease Control and Prevention (CDC). Short sleep duration among workers—United States, 2010. MMWR Morb. Mortal. Wkly. Rep. 2012, 61, 281–285. [Google Scholar]
- Australian Bureau of Statistics. Trends in Household Work. In Statistics ABo; Australian Bureau of Statistics: Canberra, Australia, 2009. [Google Scholar]
- Dunstan, D.; Salmon, J.; Owen, N.; Armstrong, T.; Zimmet, P.; Welborn, T.; Cameron, A.; Dwyer, T.; Jolley, D.; Shaw, J. Associations of TV viewing and physical activity with the metabolic syndrome in Australian adults. Diabetologia 2005, 48, 2254–2261. [Google Scholar] [CrossRef] [PubMed]
- Wijndaele, K.; Brage, S.; Besson, H.; Khaw, K.; Sharp, S.; Luben, R.; Wareham, N.; Ekelund, U. Television viewing time independently predicts all-cause and cardiovascular mortality: The EPIC Norfolk study. Int. J. Epidemiol. 2011, 40, 150–159. [Google Scholar] [CrossRef] [PubMed]
- Mallampalli, M.P.; Carter, C.L. Exploring Sex and Gender Differences in Sleep Health: A Society for Women’s Health Research Report. J. Womens Health 2014, 23, 553–562. [Google Scholar] [CrossRef] [PubMed]
- Krishnan, V.; Collop, N.A. Gender differences in sleep disorders. Curr. Opin. Pulm. Med. 2006, 12, 383–389. [Google Scholar] [CrossRef] [PubMed]
- Troiano, R.P.; Berrigan, D.; Dodd, K.W.; Masse, L.C.; Tilert, T.; McDowell, M. Physical activity in the United States measured by accelerometer. Med. Sci. Sports Exerc. 2008, 40, 181–188. [Google Scholar] [CrossRef] [PubMed]
- Australian Bureau of Statistics. Trends in Hours Worked. 2010 (Cited 2016). Available online: http://www.abs.gov.au/ausstats/abs@.nsf/featurearticlesbytitle/67AB5016DD143FA6CA2578680014A9D9?OpenDocument (accessed on 15 February 2016).
- Women’s Health Australia. Australian Longitudinal Study on Women’s Health. Available online: http://www.alswh.org.au/ (accessed on 15 February 2016).
- Brown, W.J.; Bryson, L.; Byles, J.E.; Dobson, A.J.; Lee, C.; Mishra, G.; Schofield, M. Women’s Health Australia: recruitment for a national longitudinal cohort study. Women Health 1998, 28, 23–40. [Google Scholar] [CrossRef] [PubMed]
- Marshall, A.L.; Miller, Y.D.; Burton, N.W.; Brown, W.J. Measuring total and domain-specific sitting: A study of reliability and validity. Med. Sci. Sports Exerc. 2010, 42, 1094–1102. [Google Scholar] [CrossRef] [PubMed]
- Cappuccio, F.P.; D’Elia, L.; Strazzullo, P.; Miller, M.A. Sleep duration and all-cause mortality: A systematic review and meta-analysis of prospective studies. Sleep 2010, 33, 585–592. [Google Scholar] [PubMed]
- Brown, W.J.; Bauman, A.E. Comparison of estimates of population levels of physical activity using two measures. Aust. N. Z. J. Public Health 2000, 24, 520–525. [Google Scholar] [CrossRef] [PubMed]
- World Health Organisation. Obesity: Preventing and Managing the Global Epidemic; World Health Organisation: Geneva, Switzerland, 2000. [Google Scholar]
- Soler, R.E.; Leeks, K.D.; Razi, S.; Hopkins, D.P.; Griffith, M.; Aten, A.; Chattopadhyay, S.K.; Smith, S.C.; Habarta, N.; Goetzel, R.Z.; et al. A systematic review of selected interventions for worksite health promotion. The assessment of health risks with feedback. Am. J. Prev. Med. 2010, 38, S237–S262. [Google Scholar] [CrossRef] [PubMed]
- Wilkins, R. The Household, Income and Labour Dynamics in Australia Survey: Selected Findings from Waves 1 to 12; Melbourne Institute of Applied Economic and Social Research: Melbourne, Australia, 2015. [Google Scholar]
- Ryan, C.G.; Grant, P.M.; Dall, P.M.; Granat, M.H. Sitting patterns at work: Objective measurement of adherence to current recommendations. Ergonomics 2011, 54, 531–538. [Google Scholar] [CrossRef]
- Vandelanotte, C.; Duncan, M.J.; Short, C.; Rockloff, M.; Ronan, K.; Happell, B.; di Milia, L. Associations between occupational indicators and total, work-based and leisure-time sitting: A cross-sectional study. BMC Public Health 2013, 13, 1110. [Google Scholar] [CrossRef] [PubMed]
- Bauman, A.; Ainsworth, B.E.; Sallis, J.F.; Hagstromer, M.; Craig, C.L.; Bull, F.C.; Pratt, M.; Venugopal, K.; Chau, J.; Sjostrom, M. The descriptive epidemiology of sitting. A 20-country comparison using the International Physical Activity Questionnaire (IPAQ). Am. J. Prev. Med. 2011, 41, 228–235. [Google Scholar] [CrossRef] [PubMed]
- Clemes, S.A.; David, B.M.; Zhao, Y.; Han, X.; Brown, W.J. Validity of two self-report measures of sitting time. J. Phys. Act. Health 2012, 9, 533–539. [Google Scholar] [CrossRef] [PubMed]
- Bennie, J.A.; Pedisic, Z.; Timperio, A.; Crawford, D.; Dunstan, D.; Bauman, A.; van Uffelen, J.; Salmon, J. Total and domain-specific sitting time among employees in desk-based work settings in Australia. Aust. N. Z. J. Public Health 2015, 39, 237–242. [Google Scholar] [CrossRef] [PubMed]
- Duncan, M.J.; Badland, H.; Mummery, K. Physical activity levels by occupational category in non-metropolitan Australian adults. J. Phys. Act. Health 2010, 7, 718–723. [Google Scholar] [CrossRef] [PubMed]
- Church, T.; Thomas, D.; Tudor-Locke, C.; Katzmarzyk, P.; Earnest, C.; Rodarte, R.; Martin, C.; Blair, S.; Bouchard, C. Trends over 5 Decades in, U.S. Occupation-Related Physical Activity and Their Associations with Obesity. PLoS ONE 2011, 6, e19657. [Google Scholar] [CrossRef] [PubMed]
- Guertler, D.; Vandelanotte, C.; Short, C.; Alley, S.; Schoeppe, S.; Duncan, M.J. The association between physical activity, sitting time, sleep duration, and sleep quality as correlates of presenteeism. J. Occup. Environ. Med. 2015, 57, 321–328. [Google Scholar] [CrossRef] [PubMed]
- Scott, D.; Paterson, J.L.; Happell, B. Poor Sleep Quality in Australian Adults With Comorbid Psychological Distress and Physical Illness. Behav. Sleep Med. 2014, 12, 331–341. [Google Scholar] [CrossRef] [PubMed]
- Harrington, J.M. Health effects of shift work and extended hours of work. Occup. Environ. Med. 2001, 58, 68–72. [Google Scholar] [CrossRef]
- Smith, L.; McCourt, O.; Sawyer, A.; Ucci, M.; Marmot, A.; Wardle, J.; Fisher, A. A review of occupational physical activity and sedentary behaviour correlates. Occup. Med. 2016, 66, 185–192. [Google Scholar] [CrossRef] [PubMed]
- Uijtdewilligen, L.; Peeters, G.M.; van Uffelen, J.G.; Twisk, J.W.; Singh, A.S.; Brown, W.J. Determinants of physical activity in a cohort of young adult women. Who is at risk of inactive behaviour? J. Sci. Med. Sport 2015, 18, 49–55. [Google Scholar] [CrossRef] [PubMed]
- Brown, W.J.; Heesch, K.C.; Miller, Y.D. Life events and changing physical activity patterns in women at different life stages. Ann. Behav. Med. 2009, 37, 294–305. [Google Scholar] [CrossRef] [PubMed]
- Allender, S.; Hutchinson, L.; Foster, C. Life-change events and participation in physical activity: A systematic review. Health Promot. Int. 2008, 23, 160–172. [Google Scholar] [CrossRef] [PubMed]
- Brown, W.J.; Trost, S.G. Life transitions and changing physical activity patterns in young women. Am. J. Prev. Med. 2003, 25, 140–143. [Google Scholar] [CrossRef]
- Ekelund, U.; Steene-Johannessen, J.; Brown, W.J.; Fagerland, M.W.; Owen, N.; Powell, K.E.; Bauman, A.; Lee, I.M. Does physical activity attenuate, or even eliminate, the detrimental association of sitting time with mortality? A harmonised meta-analysis of data from more than 1 million men and women. Lancet 2016, 338, 1302–1310. [Google Scholar] [CrossRef]
- Taylor, A.; Wright, H.R.; Lack, L.C. Sleeping-in on the weekend delays circadian phase and increases sleepiness the following week. Sleep Biol. Rhythm. 2008, 6, 172–179. [Google Scholar] [CrossRef]
- Dobson, A.J.; Hockey, R.; Brown, W.J.; Byles, J.E.; Loxton, D.J.; McLaughlin, D.P.; Tooth, L.R.; Mishra, G.D. Cohort Profile Update: Australian Longitudinal Study on Women’s Health. Int. J. Epidemiol. 2015, 44, 1547. [Google Scholar] [CrossRef] [PubMed]
- Neuhaus, M.; Eakin, E.G.; Straker, L.; Owen, N.; Dunstan, D.W.; Reid, N.; Healy, G.N. Reducing occupational sedentary time: A systematic review and meta-analysis of evidence on activity-permissive workstations. Obes. Rev. 2014, 15, 822–838. [Google Scholar] [CrossRef] [PubMed]
- Cunnington, D.; Junge, M.F.; Fernando, A.T. Insomnia: Prevalence, consequences and effective treatment. Med. J. Aust. 2013, 199, S36–S40. [Google Scholar] [CrossRef] [PubMed]
- Zachariae, R.; Lyby, M.S.; Ritterband, L.M.; O’Toole, M.S. Efficacy of internet-delivered cognitive-behavioral therapy for insomnia—A systematic review and meta-analysis of randomized controlled trials. Sleep Med. Rev. 2016, 30, 1–10. [Google Scholar] [CrossRef] [PubMed]
- Chastin, S.F.; Palarea-Albaladejo, J.; Dontje, M.L.; Skelton, D.A. Combined Effects of Time Spent in Physical Activity, Sedentary Behaviors and Sleep on Obesity and Cardio-Metabolic Health Markers: A Novel Compositional Data Analysis Approach. PLoS ONE 2015, 10, e0139984. [Google Scholar] [CrossRef] [PubMed]

| Occupational Category | Work Hours | Work Pattern | ||||||||
|---|---|---|---|---|---|---|---|---|---|---|
| Manager/Professional | Clerical/Sales | Trades/Production/Labourer | p | Full-Time | Part-Time | p | Regular Hours | Shift or Night Worker | p | |
| Young cohort | ||||||||||
| N | 2986 | 1370 | 294 | 2688 | 1962 | 3889 | 761 | |||
| Age in years, mean (SD) | 33.6 (1.5) | 33.8 (1.5) | 33.9 (1.5) | <0.001 | 33.6 (1.5) | 33.8 (1.4) | <0.001 | 33.7 (1.5) | 33.6 (1.5) | 0.51 |
| Area of residence urban (%) | 70 | 56 | 41 | <0.001 | 68 | 58 | <0.001 | 64 | 62 | 0.14 |
| Post High school qualification (%) | 95 | 64 | 57 | <0.001 | 86 | 79 | <0.001 | 83 | 83 | 0.99 |
| Married or in de-facto relationship (%) | 73 | 75 | 74 | 0.47 | 64 | 88 | <0.001 | 74 | 71 | 0.07 |
| One or more children under 16 years in house (%) | 47 | 62 | 67 | <0.001 | 30 | 85 | <0.001 | 53 | 53 | 0.67 |
| Current smoker (%) | 12 | 16 | 26 | <0.001 | 16 | 11 | <0.001 | 13 | 15 | 0.17 |
| Risky drinker a (%) | 5 | 6 | 9 | <0.01 | 6 | 4 | <0.01 | 5 | 5 | 0.53 |
| Body Mass Index kg/m2 (mean, SD) | 25.2 (5.4) | 26.7 (6.4) | 26.6 (5.8) | <0.001 | 25.9 (6.0) | 25.5 (5.5) | <0.001 | 25.6 (5.8) | 26.7 (6.4) | <0.001 |
| Self-rated health good to excellent (%) | 93 | 90 | 87 | <0.001 | 92 | 92 | 0.63 | 92 | 91 | 0.31 |
| Work characteristics | ||||||||||
| Full-time workers (%) | 65 | 47 | 39 | <0.001 | 58 | 56 | 0.15 | |||
| Work shift of night (%) | 16 | 14 | 26 | <0.001 | 16 | 17 | 0.15 | |||
| Manager or professional (%) | 72 | 54 | <0.001 | 64 | 64 | <0.001 | ||||
| Clerical or sales (%) | 24 | 37 | 30 | 26 | ||||||
| Trade, production or labourer (%) | 4 | 9 | 6 | 10 | ||||||
| Mid-aged cohort | ||||||||||
| N | 1724 | 1121 | 340 | 1443 | 1742 | 2723 | 462 | |||
| Age in years, mean (SD) | 61.2 (1.4) | 61.2 (1.4) | 61.4 (1.4) | 0.04 | 61.1 (1.4) | 61.3 (1.4) | 0.24 | 61.2 (1.4) | 61.2 (1.3) | 0.03 |
| Area of residence urban (%) | 44 | 43 | 30 | <0.001 | 45 | 40 | <0.01 | 43 | 43 | 0.95 |
| Post High school qualification (%) | 77 | 33 | 25 | <0.001 | 59 | 54 | 0.02 | 55 | 63 | <0.01 |
| Married or in de-facto relationship (%) | 75 | 75 | 78 | 0.55 | 70 | 80 | <0.001 | 77 | 68 | <0.001 |
| One or more children under 16 years in house (%) | 1 | 3 | 2 | 0.01 | 2 | 2 | 0.82 | 2 | 3 | 0.12 |
| Current smoker (%) | 7 | 7 | 12 | 0.01 | 8 | 7 | 0.55 | 7 | 12 | <0.001 |
| Risky drinker a (%) | 7 | 6 | 8 | 0.62 | 8 | 6 | 0.11 | 7 | 5 | 0.19 |
| Body Mass Index kg/m2 (mean, SD) | 26.9 (5.4) | 27.1 (5.2) | 26.9 (5.4) | 0.61 | 27.2 (5.5) | 26.8 (5.1) | 0.03 | 26.8 (5.2) | 27.6 (5.5) | 0.15 |
| Self-rated health good to excellent (%) | 93 | 93 | 89 | 0.03 | 93 | 94 | 0.73 | 93 | 91 | 0.10 |
| Work characteristics | ||||||||||
| Full-time workers (%) | 54 | 36 | 32 | <0.001 | 45 | 46 | 0.71 | |||
| Work shift of night (%) | 16 | 12 | 17 | <0.01 | 15 | 14 | 0.72 | |||
| Manager or professional (%) | 45 | 65 | <0.001 | 53 | 58 | <0.01 | ||||
| Clerical or sales (%) | 41 | 28 | 36 | 30 | ||||||
| Trade, production or labourer (%) | 13 | 8 | 10 | 13 | ||||||
| Work Characteristic | Work Hours Per/Workday | Sleep | Sitting Time | Moderate to Vigorous Physical Activity (h/week) Median (25%, 75%) | ||||
|---|---|---|---|---|---|---|---|---|
| Work Day (h/day) | Non-Work Day (h/day) | p Work/Non-Workday | Work Day (h/day) | Non-Work Day (h/day) | p Work/Non-Workday | |||
| Young Cohort | ||||||||
| Total Sample | 8.25 (2.43) | 7.31 (1.14) | 8.04 (1.27) | <0.001 | 8.68 (4.18) | 8.18 (3.85) | <0.001 | 2.5 (1, 4.50) |
| Occupational category | ||||||||
| Manager/professional | 8.53 (2.25) | 7.32 (1.10) | 8.07 (1.22) | <0.001 | 8.99 (4.08) | 8.20 (3.82) | <0.001 | 2.67 (1, 5) |
| Clerical/sales | 7.75 (2.48) a | 7.34 (1.22) | 8.00 (1.33) | <0.001 | 8.76 (4.09) | 8.21 (3.89) | <0.001 | 2.00 (0.75, 4) a |
| Trades/production/labourer | 7.76 (3.41) | 7.16 (1.31) b | 7.87 a (1.44) | <0.001 | 5.06 (3.93) a,b | 7.93 (3.98) | <0.001 | 2.50 (0.5, 5) b |
| Work hours | ||||||||
| Part-time | 7.49 (3.08) | 7.35 (1.20) | 7.78 (1.25) | <0.001 | 7.28 (3.97) | 7.31 (3.59) | 0.47 | 2.00 (1, 4) |
| Full-time | 8.82 (1.59) a | 7.29 (1.11) | 8.22 (1.25) a | <0.001 | 9.69 (4.05) a | 8.82 (3.91) a | <0.001 | 2.75 (1, 5) a |
| Work pattern regularity | ||||||||
| Not shift or night worker | 8.17 (2.39) | 7.37 (1.11) | 8.05 (1.26) | <0.001 | 8.98 (4.06) | 8.20 (3.84) | <0.001 | 2.5 (1, 4.5) |
| Shift or night worker | 8.65 (2.60) a | 7.02 (1.30) a | 7.97 (1.32) | <0.001 | 7.11 (4.43) a | 8.12 (3.94) | <0.001 | 2.5 (1, 5) |
| Mid-aged Cohort (aged 59–64 years) | ||||||||
| Total Sample | 7.48 (2.55) | 7.06 (1.22) | 7.57 (1.29) | <0.001 | 7.59 (4.11) | 7.57 (3.74) | 0.20 | 3.50 (1.50, 7) |
| Occupational category | ||||||||
| Manager/professional | 7.87 (2.41) | 7.05 (1.23) | 7.61 (1.28) | <0.001 | 7.99 (4.05) | 7.74 (3.79) | 0.05 | 3.50 (1.50, 6.54) |
| Clerical/sales | 7.10 (2.45) a | 7.10 (1.17) | 7.54 (1.27) | <0.001 | 7.81 (4.06) | 7.50 (3.68) | 0.02 | 3.50 (1.17, 6.21) |
| Trades/production/labourer | 6.71 (3.18) a,b | 6.95 (1.36) | 7.48 (1.44) | <0.001 | 4.86 (3.53) a,b | 6.95 (3.64) a,b | <0.001 | 4.00 (1, 7) a,b |
| Work hours | ||||||||
| Part-time | 6.74 (2.84) | 7.11 (1.31) | 7.51 (1.34) | <0.001 | 6.80 (3.97) | 7.54 (3.72) | <0.001 | 4.00 (1.81, 7) |
| Full-time | 8.42 (1.73) a | 7.00 (1.11) a | 7.65 (1.20) a | <0.001 | 8.56 (4.06) a | 7.60 (3.76) | <0.001 | 3.00 (1, 6) a |
| Work pattern regularity | ||||||||
| Not shift or night worker | 7.37 (2.53) | 7.11 (1.19) | 7.57 (1.28) | <0.001 | 7.90 (4.06) | 7.60 (3.71) | <0.001 | 3.50 (1.50, 7) |
| Shift or night worker | 8.18 (2.55) a | 6.75 (1.37) a | 7.55 (1.33) | <0.001 | 5.78 (3.95) a | 7.43 (3.89) | <0.001 | 3.00 (1, 6.5) |
| Young Cohort | Mid-Aged Cohort | |||||||
|---|---|---|---|---|---|---|---|---|
| Work Day | Non-Work Day | Work Day | Non-Work Day | |||||
| Shorter Sleep | Longer Sleep | Shorter Sleep | Longer Sleep | Shorter Sleep | Longer Sleep | Shorter Sleep | Longer Sleep | |
| ≤6 h/Night (n = 289) | ≥8 h/Night (n = 578) | ≤6 h/Night (n = 128) | ≥8 h/Night (n = 1671) | ≤6h/Night (n = 322) | ≥8 h/Night (n = 297) | ≤6 h/Night (n = 184) | ≥8 h/Night (n = 715) | |
| Occupational category | ||||||||
| Manager/professional | Ref | Ref | Ref | Ref | Ref | Ref | Ref | Ref |
| Clerical/sales | 0.98 (0.71, 1.34) | 1.32 (1.06, 1.64) | 1.11 (0.71, 1.76) | 1.22 (1.04, 1.43) | 1.03 (0.77, 1.39) | 0.71 (0.52, 0.98) | 1.18 (0.81, 1.73) | 0.97 (0.79, 1.20) |
| Trades/production/labourer | 1.38 (0.86, 2.22) | 1.12 (0.75, 1.67) | 1.31 (0.63, 2.72) | 1.20 (0.90, 1.60) | 1.04 (0.68, 1.59) | 0.76 (0.48, 1.20) | 1.07 (0.62, 1.85) | 0.99(0.72, 1.36) |
| Work hours | ||||||||
| Part-time | Ref | Ref | Ref | Ref | Ref | Ref | Ref | Ref |
| Full-time | 1.01 (0.74, 1.38) | 0.76 (0.60, 0.95) | 1.21 (0.77, 1.89) | 1.21 (1.02, 1.43) | 1.10 (0.86, 1.41) | 0.63 (0.48, 0.82) | 0.81 (0.58, 1.12) | 1.21 (1.01, 1.44) |
| Work pattern regularity | ||||||||
| Regular hours | Ref | Ref | Ref | Ref | Ref | Ref | Ref | Ref |
| Shift or night worker | 1.94 (1.46, 2.58) ** | 0.77 (0.59, 1.01) | 1.01 (0.61, 1.68) | 0.88 (0.74, 1.05) | 2.03 (1.51, 2.71) * | 0.60 (0.39, 0.93) | 0.88 (0.55, 1.41) | 0.88 (0.68, 1.13) |
| Young | Mid-Aged | |||
|---|---|---|---|---|
| Unadjusted | Adjusted | Unadjusted | Adjusted | |
| Occupational category | ||||
| Manager/professional | Ref | Ref | Ref | Ref |
| Clerical/sales | 0.67 (0.60, 0.76) ** | 0.76 (0.66, 0.88) ** | 1.09 (0.95, 1.26) | 0.93 (0.78, 1.11) |
| Trades/production/labourer | 0.80 (0.64, 1.01) | 1.01 (0.77, 1.31) | 1.01 (0.81, 1.26) | 1.08 (0.83, 1.40) |
| Work hours | ||||
| Part-time | Ref | Ref | Ref | Ref |
| Full-time | 1.46 (1.31, 1.63) ** | 0.96 (0.83, 1.12) | 0.76 (0.67, 0.86) ** | 0.78 (0.67, 0.91) * |
| Work pattern regularity | ||||
| Regular hours | Ref | Ref | Ref | Ref |
| Shift or night worker | 0.94 (0.81, 1.09) | 0.92 (0.78, 1.09) | 0.89 (0.74, 1.07) | 0.93 (0.76, 1.15) |
© 2017 by the authors. Licensee MDPI, Basel, Switzerland. This article is an open access article distributed under the terms and conditions of the Creative Commons Attribution (CC BY) license ( http://creativecommons.org/licenses/by/4.0/).
Share and Cite
Clark, B.K.; Kolbe-Alexander, T.L.; Duncan, M.J.; Brown, W. Sitting Time, Physical Activity and Sleep by Work Type and Pattern—The Australian Longitudinal Study on Women’s Health. Int. J. Environ. Res. Public Health 2017, 14, 290. https://doi.org/10.3390/ijerph14030290
Clark BK, Kolbe-Alexander TL, Duncan MJ, Brown W. Sitting Time, Physical Activity and Sleep by Work Type and Pattern—The Australian Longitudinal Study on Women’s Health. International Journal of Environmental Research and Public Health. 2017; 14(3):290. https://doi.org/10.3390/ijerph14030290
Chicago/Turabian StyleClark, Bronwyn K., Tracy L. Kolbe-Alexander, Mitch J. Duncan, and Wendy Brown. 2017. "Sitting Time, Physical Activity and Sleep by Work Type and Pattern—The Australian Longitudinal Study on Women’s Health" International Journal of Environmental Research and Public Health 14, no. 3: 290. https://doi.org/10.3390/ijerph14030290
APA StyleClark, B. K., Kolbe-Alexander, T. L., Duncan, M. J., & Brown, W. (2017). Sitting Time, Physical Activity and Sleep by Work Type and Pattern—The Australian Longitudinal Study on Women’s Health. International Journal of Environmental Research and Public Health, 14(3), 290. https://doi.org/10.3390/ijerph14030290