Abstract
The prevention and control of dengue are great public health challenges for many countries, particularly since 2015, as other arboviruses have been observed to interact significantly with dengue virus. Different approaches and methodologies have been proposed and discussed by the research community. An important tool widely used is modeling and simulation, which help us to understand epidemic dynamics and create scenarios to support planning and decision making processes. With this aim, we proposed and developed DengueME, a collaborative open source platform to simulate dengue disease and its vector’s dynamics. It supports compartmental and individual-based models, implemented over a GIS database, that represent Aedes aegypti population dynamics, human demography, human mobility, urban landscape and dengue transmission mediated by human and mosquito encounters. A user-friendly graphical interface was developed to facilitate model configuration and data input, and a library of models was developed to support teaching-learning activities. DengueME was applied in study cases and evaluated by specialists. Other improvements will be made in future work, to enhance its extensibility and usability.
1. Introduction
Dengue incidence increased rapidly in the last two decades [1,2,3]. Some estimates suggest that almost 390 million new infections occur each year [3], and about half of the world’s population is at risk [2]. However, problems with under-reporting and case misclassification suggest that the full impact of the disease is unknown and that new approaches for surveillance are required [4]. More recently, the emergence of other arboviruses, such as chikungunya [5] and zika [6], particularly in South America, have posed new challenges for surveillance and control.
Dengue is a viral infection transmitted between humans and mosquitoes, with four serotypes that are rapidly spreading worldwide [4]. Until recently, its primary vector, the Aedes aegypti mosquito, which is well adapted to urban areas, was distributed mainly across tropical and subtropical regions [4,7]. However, now, it has spread to North America and Europe [8]. A secondary vector, Aedes albopictus, also expanded its geographic range in recent years [8,9]. The risk of dengue outbreaks and endemicity occurs mainly in tropical and subtropical regions [3]. However, the disease is spreading to North America and Europe [10,11,12], due to the presence of Aedes and the introduction of the virus.
Dengue transmission is a complex process that involves the interaction of multiple agents (humans, mosquitoes and virus) in a heterogeneous space. The space itself is complex enough to provide many challenges for dengue transmission studies. The current pandemic was favored by a combination of several factors [4]. These included the global movement of hosts and vectors (that speed up virus circulation [13,14,15]), urban crowding (which favored multiple transmissions by a single infectious mosquito) and loss of effect of previously efficient vector control strategies [16]. To map and describe global patterns of vulnerability to dengue transmission, some researchers have created risk maps and estimated the global distribution of dengue from notification and environmental data [3,17,18,19,20]. Although knowledge about the global situation of the disease is essential, it is also important to understand its dynamics at a local scale, where the encounters between vectors and hosts happen.
Microclimate conditions, such as temperature, rainfall and humidity, interfere with all vector development stages, from egg viability to adult longevity and dispersal, among other aspects of dengue transmission [21,22,23,24,25].
Sociodemographic and environmental factors that contribute to increased dengue incidence [26,27] include: unplanned urbanization, high human population density [26,28,29,30,31], as well as the precariousness of garbage collection and water supply services, which favor the proliferation of mosquito breeding sites [32,33]. Although Ae. aegypti generally flies short distances during its life [34,35], air and land transportation systems promote the spreading of viruses and vectors and allow fast displacement of infected people and vectors between different regions [29,36].
Despite efforts to develop a vaccine [37,38,39], as of mid-2016, there is only one licensed product (Dengvaxia®, CYD-TDV, Sanofi Pasteur, Lyon, France), which has shown only moderate levels of protection and is recommended only to individuals above nine years of age. Other candidates are in different stages of development and evaluation [40,41]. However, none of them can be an immediate global panacea [4]. Besides, a dengue vaccine does not prevent the spread of zika and chikungunya viruses. Therefore, improvements in treatment and innovative approaches to understand and prevent transmission should continue. Several other control strategies have been proposed, studied and tested. They include reducing the abundance of the vector [42], introducing genetically-modified mosquitoes [43], infecting vectors with other pathogens [44,45,46,47] and preventing mosquito-human contact [48]. An improved understanding of the current epidemiology of the disease and its potential for future spread can assist policy makers in allocating resources to face this global public health challenge [4].
Several dynamic models have been developed to describe dengue transmission dynamics in space and time [49,50,51,52] and the behavior of its primary vector, Ae. aegypti [8,53,54,55,56,57,58,59,60]. They are fundamental tools for comparing different control methods and can evaluate what-if scenarios, but creating computational models accounting for several populations (metapopulation models), heterogeneity (e.g., variations in susceptibility and in responses to infection) and spatial heterogeneity requires great expertise and advanced programming skills.
This work presents the design and current development stage of the Dengue Modeling Environment (DengueME) framework. DengueME is an open source tool that supports the development of spatiotemporal models for simulating dengue and its vector, integrated with a Geographic Information System (GIS). The software and its source code are available at the website <http://github.com/ufopleds/DengueME>, under a BSD 2-clause license. The pre-compiled software is available for Windows, and source code is available for users to compile in Linux and OS X.
DengueME was developed as a tool to assist the design of site-specific and vector population-specific control strategies for dengue. To reach this goal, DengueME provides: (i) a collection of built-in models that can be combined to represent various scenarios; (ii) a modeling language that accommodates both compartmental models and individual-based models; (iii) a user-friendly graphical interface for easy model selection and configuration; (iv) a flexible and extensible architecture to allow contribution from users; and (v) a standard format for data exchange to allow communication between DengueME models.
2. Related Work
Since the emergence of Ross–Macdonald’s quantitative theory for understanding and measuring mosquito-borne pathogen transmission and control [61], many mathematical models have been developed and applied to study the dynamics of mosquito-borne diseases, mainly malaria, dengue, West Nile virus and filariasis [62].
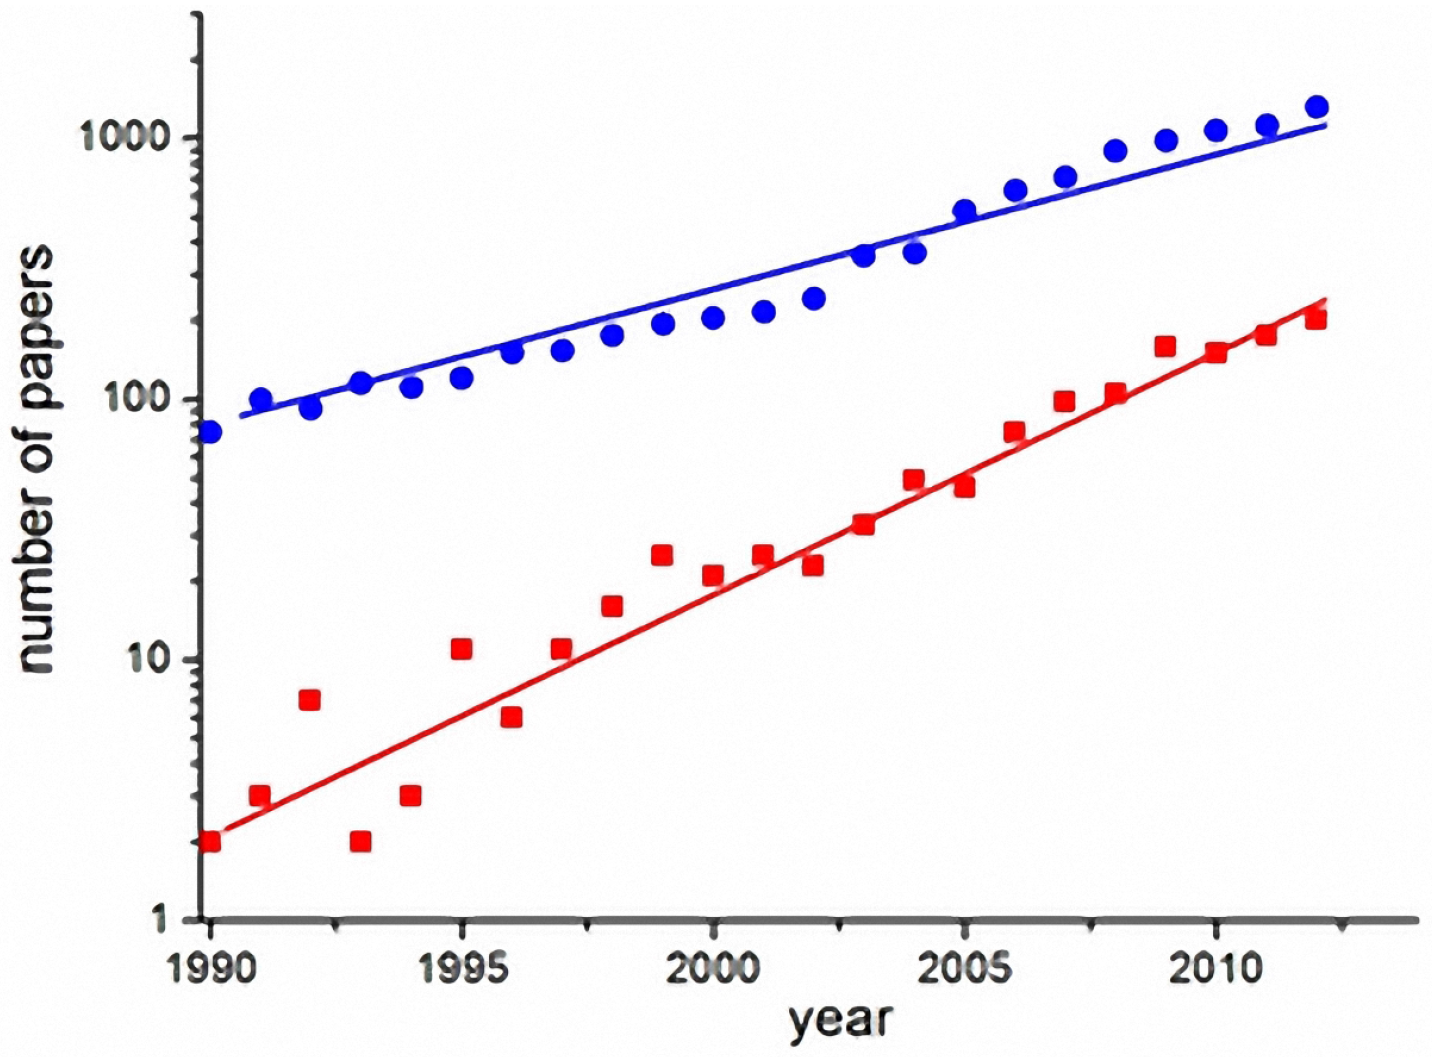
Computational models are useful for understanding the determinants of disease transmission processes and to analyze the impact of control strategies. Figure 1 shows the exponential growth of the number of scientific articles on dengue in general (blue circles) and articles on dengue models (red squares), in the last two decades (source: ISI-Web of Knowledge). The number of articles on dengue models has grown faster than the number of articles on dengue in general. The increased interest in modeling shows the potential demand for frameworks that feature fast implementation, selection and testing of alternative dengue models in a single environment.
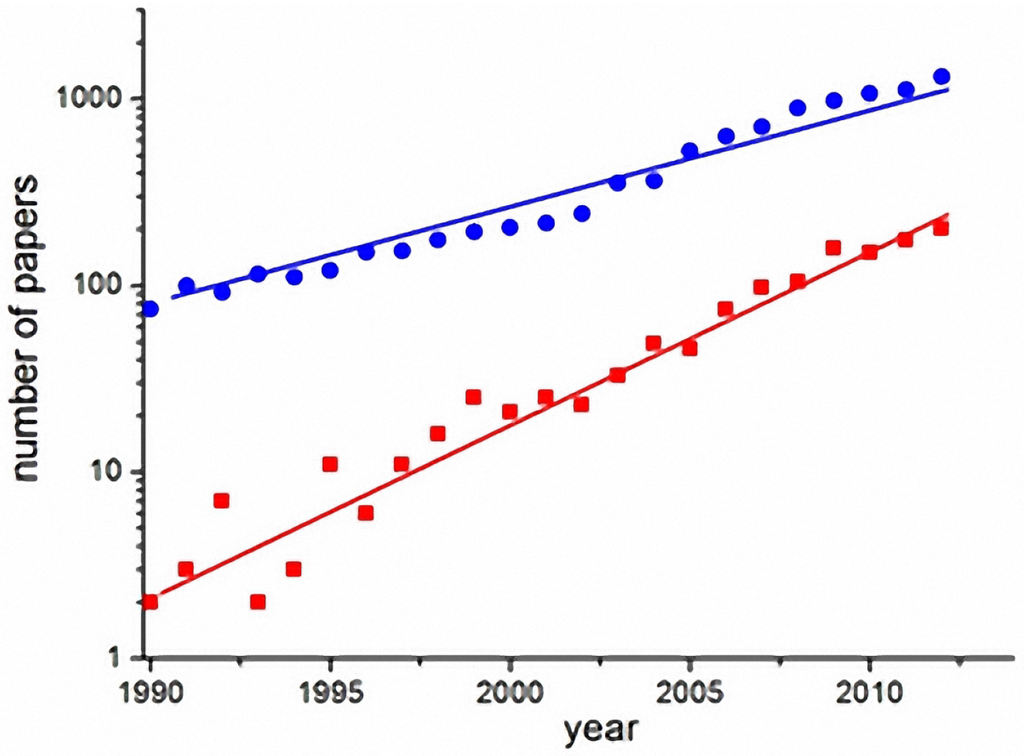
Figure 1.
Exponential growth of publications on dengue (blue circles) and specifically on dengue models (red squares) in the last two decades (search done in the ISI-Web of knowledge database) [63].
A systematic review of mathematical models of mosquito-borne pathogen transmission, conducted by Reiner et al. (2013) [62], shows an increasing recognition of geographic, ecological and epidemiological complexities in modeling transmission. Models increasingly include more aspects of the pathogen, vector, host populations and their encounters, as well as external drivers of transmission and control of the disease. Among the several external drivers that affect transmission, temperature is one of the most important. Although models have incorporated temperature dependence into specific components of the vector’s life cycle, the most common approach considers the emergence of adults from aquatic habitats as a parameter, with seasonal forcing, but ignoring the aquatic-phase dynamics. Researchers argue there is a need to develop better models of mosquito population dynamics, including the ecology in their aquatic habitats [62]. More recent work has begun to address these aspects [57,59,64].
Often, however, models lack a good description of variability within populations (host and vector), particularly their spatial and temporal heterogeneity [62]. These deficiencies arise in part from the difficulty in obtaining and producing adequate data to parameterize the models. Sometimes, the data are available on a different scale from that required for the study, and extrapolations could introduce errors and bias [27].
The theoretical framework developed for malaria by Ross and Macdonald [61] is evolving with the emergence of new approaches that incorporate heterogeneity, the ecological and social context in which mosquito blood feeding occurs, the mobility of hosts and mosquitoes and the use of proper scales to measure the transmission and to model the dynamics and control of diseases [65]. We argue for a tool that allows building pedagogical, theoretical and empirical models of dengue transmission and vector ecology, using different scales and different paradigms, with support for the use of real data, ranging from simple time series, such as daily temperatures, to more complex urban geographic data. As indicated by Messina et al. (2015) [27], there is a consensus about the influence of climate and environmental variations in the global distribution of dengue. Therefore, models should consider these aspects.
Models have other uses beyond prediction [66]. Modeling and simulation are used as a tool to support planning, decision making and intervention assessments in public health. Models based on system dynamics have been applied in public health since the 1970s, in areas such as disease epidemiology and healthcare capacity planning [67]. Agent-based modeling (ABM) allows describing structures and behaviors at smaller scales and observing the emergent dynamics at larger scales. ABM is also used to study transmissible and non-transmissible diseases [68]. Other methods such as network analysis are also applied [69,70,71,72]. Simulations allow a more extensive investigation of alternative scenarios of spatial spread and its relationship to multiple influencing factors. They can also explore the feasibility of control strategies and support the implementation and evaluation of alternative intervention and control methods. According to Knight et al. (2016) [73], results from models can be linked to public health policy in at least three ways: (i) “improve our understanding of infectious disease epidemic systems so that public health practitioners can better target key drivers of epidemic spread”; (ii) “evaluate and compare the potential epidemiological and economic impact of alternative public health interventions”; (iii) “reveal data gaps that, if filled, would enable public health officials to make more evidence-based decisions in the future”. Further discussions and applications can be found in [73,74,75,76,77].
Some initiatives support users on studying environmental phenomena through computer modeling and simulation. Examples include platforms that allow model building through interaction with graphical interfaces and the usage of visual metaphors (e.g., diagrams) [78,79,80,81]. There are generic frameworks for modeling globally the spread of diseases, such as Spatiotemporal Epidemiological Modeler (STEM) [82] and Global Epidemic and Mobility Model (GLEaM) [83], or using connected networks, such as EpiFire [84]. There is also a graphical interface software developed to support the use of an intervention model for Plasmodium falciparum malaria [85]. However, we did not find freely-available solutions dedicated to dengue modeling and targeting local dynamics at intra-urban scales.
3. DengueME Framework Overview
DengueME is a software framework for modeling and simulating the spatiotemporal dynamics of dengue and its vector. It provides services to support the development of integrated models and the evaluation of intervention scenarios. The following section presents DengueME’s requirements, design and current development status.
3.1. Framework Requirements and Design
As discussed earlier, a framework for dengue modeling should offer a basic library of epidemiological (disease transmission) and entomological (vector population dynamics) spatiotemporal models. Users must be able to configure and parameterize these models according to their needs, driven by the intended application (from pedagogical to real case studies). The current version of DengueME includes models developed by Medeiros et al. (2011) [51] and Lana et al. (2011 and 2014) [56,86], adapted to allow easy integration with a geographic database. In DengueME, models can be developed using multiple scales and modeling paradigms, including differential equations, agents, cellular automata and hybrids. Models are implemented using the high level programming language TerraML (Terra Modeling Language) from TerraME [87]. Currently, DengueME is an extension of TerraME, a platform for modeling and simulating environmental systems.
DengueME models can be directly parameterized and configured using the TerraML programming language. For users with little or no programming experience, DengueME provides a friendly Graphical User Interface (GUI) for customization of models and the design of scenarios. A Visual Development Environment (VDE) allows users to select and integrate sub-models (modules) from the framework’s library, parameterizing them using data from geographic databases or files containing time series and tabular data.
A dengue modeling framework should be continuously updated, in a collaborative development. DengueME accepts new models to its library as a module (or a black-box). Modules contain TerraML code that implements the model and an XML file that describes its parameters (e.g., type and format), inputs and outputs.
Model building is the act of simplifying reality by isolating elements and associations considered relevant to the problem at hand. Modeling is an iterative process involving a sequence of steps, divided into activities and performed with the help of specialized tools. Some general steps are necessary to make the models methodologically acceptable. These include defining their purpose and objectives, conceptual design, implementation and tests, sensitivity analysis, calibration, validation and scenario analysis. The DengueME framework helps users in some of these modeling activities. For instance, its graphical interface assists users in specifying models and analyzing scenarios, helping with activities such as model parameterization, execution and the presentation of simulation results. Some resources to support users through the GUI in other steps, like calibration and validation, are still under development. A detailed presentation on how to build a model is beyond the scope of this article, but additional information about this topic can be found in [88,89,90,91,92,93,94,95].
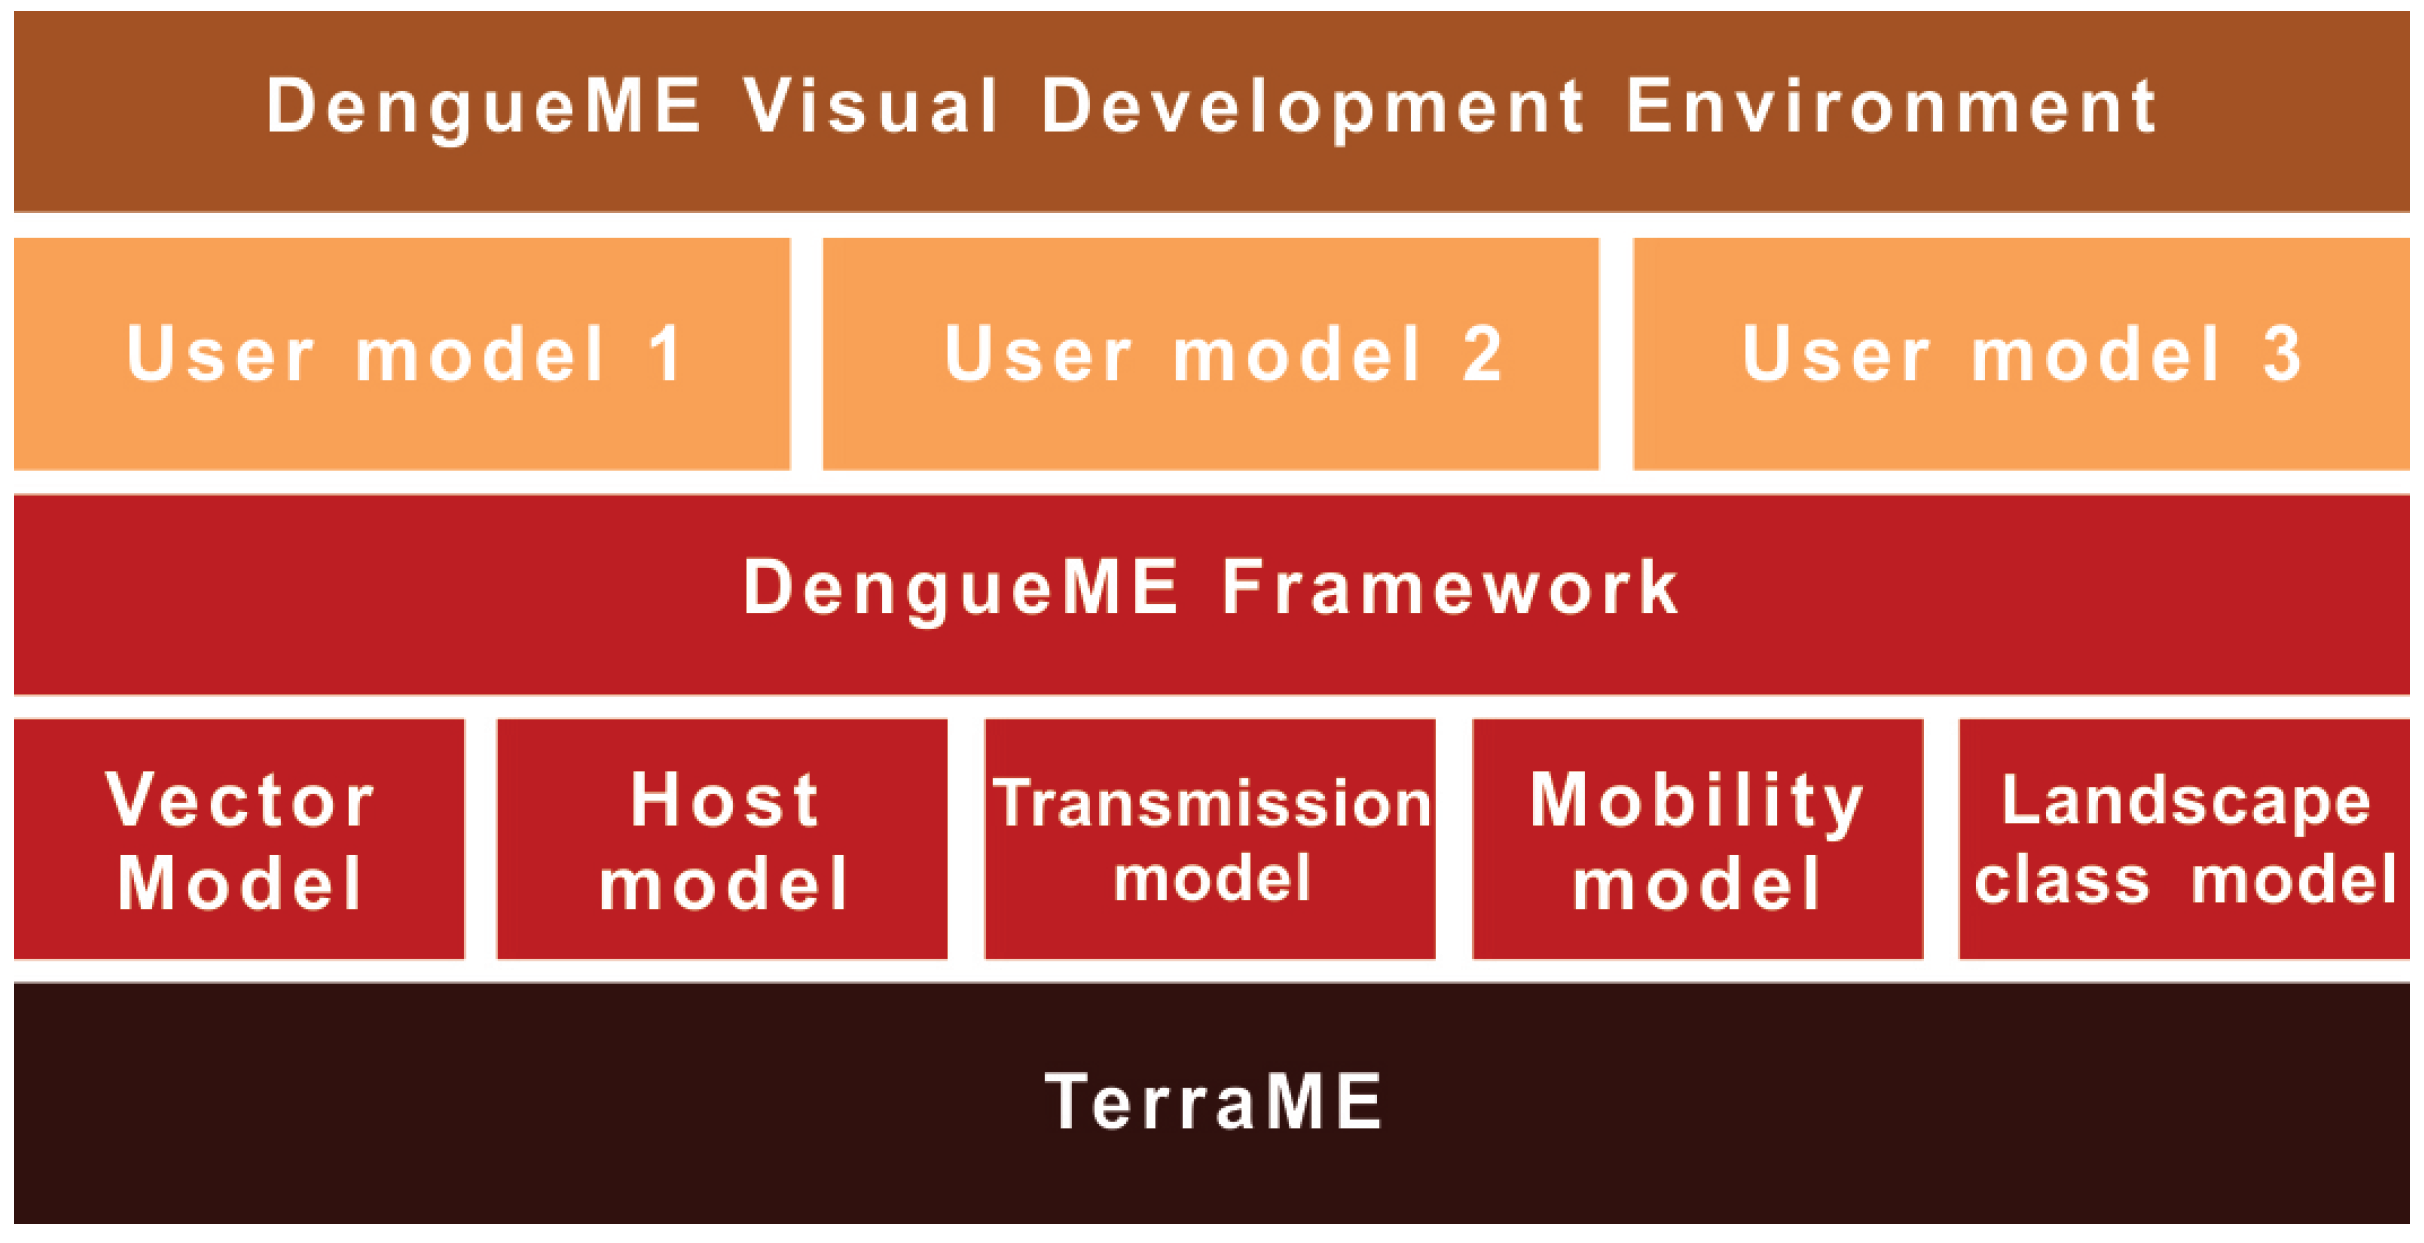
Figure 2 presents an overview of the DengueME framework architecture. In the lower layer is the TerraME platform for environmental modeling, used to build the models. The second layer is the DengueME framework, composed of a set of models and middleware to integrate them. Next, there is a layer formed by the models and scenarios customized by the user. They can be developed using the DengueME VDE, available at the top layer of the architecture.
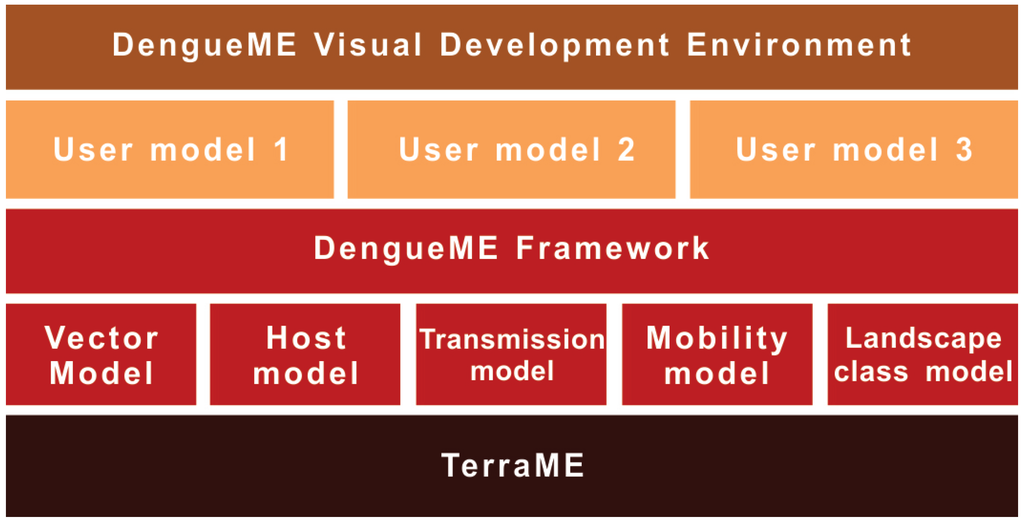
Figure 2.
DengueME architecture [63].
The models and framework layer are developed using TerraML, a modeling language provided by the TerraME platform. TerraML is a script language that extends the Lua programming language, offering an Application Programming Interface (API) designed to support the modeling and simulation of environmental phenomena. DengueME VDE was developed using C++, Qt (an open source user interface library) and XML. Modelers only have to know TerraML, currently the only modeling language supported by the framework, to create new models. The user interface of new models can be directly created using DengueME VDE, with no additional programming. Model users need to interact only with the graphical interface to parameterize models, create scenarios and execute simulations.
3.2. Models
The dynamics of dengue transmission is governed by a complex interaction between humans, mosquitoes and viruses, on a heterogeneous landscape. The modularization of this dynamics into independent components allows the user to work on different levels of detail and complexity, according to his or her goals. The following sections present the model components of DengueME (Figure 2).
3.2.1. Vector Models
The vector (entomological) model can be represented as a system of differential equations that describe Ae. aegypti population dynamics. The temporal variation of the stock of individuals in each life stage (eggs, larvae, pupae and adults) is modeled as a function of the environmental carrying capacity and the climate [56]. Adaptations and simplifications are possible, such as reducing the number of vector life stages, for example considering only aquatic and winged phases. The DengueME framework allows building metapopulation models from these basic components, with easy parameterization from a geographic database. The vector model can be used alone or integrated with other models. Section 4.2 describes an example of a vector ecology model. Using a different modeling approach, vectors can be modeled as agents (for instance, considering only female adults), with individual attributes and behaviors. This strategy is used in an example presented in Section 4.3.
3.2.2. Host Models
The host (human) model is another basic component that can be used by itself or as part of an integrated model of dengue. It describes the demographic dynamics of the human population in the study area. Census data can be used for the spatial allocation of individuals by age, sex or other attributes into a regular grid, defined by the user. This allocation is done by distributing the population per unit area (neighborhoods or census sectors). Using an explicit representation of space, host models can be implemented as differential equations describing the stock of individuals in each cell of the grid. An alternative is to create an individual-based model, in which each person is an agent with attributes (e.g., age, sex) and behaviors or rules (e.g., movement, susceptibility to infection). The latter method was used in the epidemic model presented in Section 4.3. Differential equations can be used to represent the human population even when an explicit representation of space is not possible (due to the lack of data) or desirable (due to the study’s goals). The transmission model presented in Section 4.1 uses this approach.
3.2.3. Transmission Models
The process of virus transmission between humans and mosquitoes depends on the local amount of susceptible people (or mosquitoes) and infected people (or mosquitoes). Immune people act as barriers to transmission, since they absorb some of the bites from infected mosquitoes, without subsequently spreading the virus. Dengue models describe this dynamic process by classifying the stock of people in four states: susceptible, exposed, infected and recovered. The mosquitoes (adult females) are classified into susceptible, exposed and infected (they do not recover). There are four distinct dengue virus serotypes. If multiple viral types are being modeled, these compartments are multiplied. Some transmission models considering only one serotype were developed and are available in the framework’s library (see examples in Section 4). However, the framework supports the development of models with multiple serotypes and aspects, such as cross-immunity and variable pathogenicity [96,97,98,99,100,101,102]. Future works will include implementing multiple serotype models from the literature.
3.2.4. Mobility Models
DengueME includes a mobility model, which describes the mobility and geographic commuting of humans and vectors. The spread of viruses and vectors is facilitated by the flow of individuals through air and land transportation. The human mobility component can be implemented as an unstructured model (no mobility or random mobility at a predefined intensity) or as a structured model, based on more complex structures, inspired by actual data [49]. Medeiros et al. (2011) [51] introduce distinct commuting of individuals between public and private areas for humans and smaller scale movements for mosquitoes. Mobility models for hosts and vectors, based on those described by Medeiros et al. (2011) [51], were used in the epidemic model presented in Section 4.3. Further discussions about the impact of human and vector mobility on dengue transmission can be found in [103,104].
3.2.5. Landscape Class Models
Urban landscape introduces heterogeneity in A. aegypti breeding sites, influencing the dynamics of dengue transmission. The landscape component provides a landscape classification model to describe the space and to obtain input parameters for the models. Landscape classification can be implemented in a sophisticated way, involving segmentation and classification of high-resolution satellite images and data mining. DengueME implements a landscape classification model suited to dengue, developed by Reis (2010) [105].
3.2.6. DengueME Visual Development Environment
DengueME was designed for users with no programming knowledge. The DengueME Visual Development Environment (VDE) helps users to perform the steps for developing models and defining scenarios. Its GUI provides wizards that guide users through the process, as shown in Figure 3. Users select a set of models and indicate the way they will be integrated. Then, they provide the parameters for each model and set options for output visualization and storage. User-defined settings and parameters (designed scenarios) can be stored for later use. After finishing all customization and parameterization, the TerraML source is automatically generated by the framework.
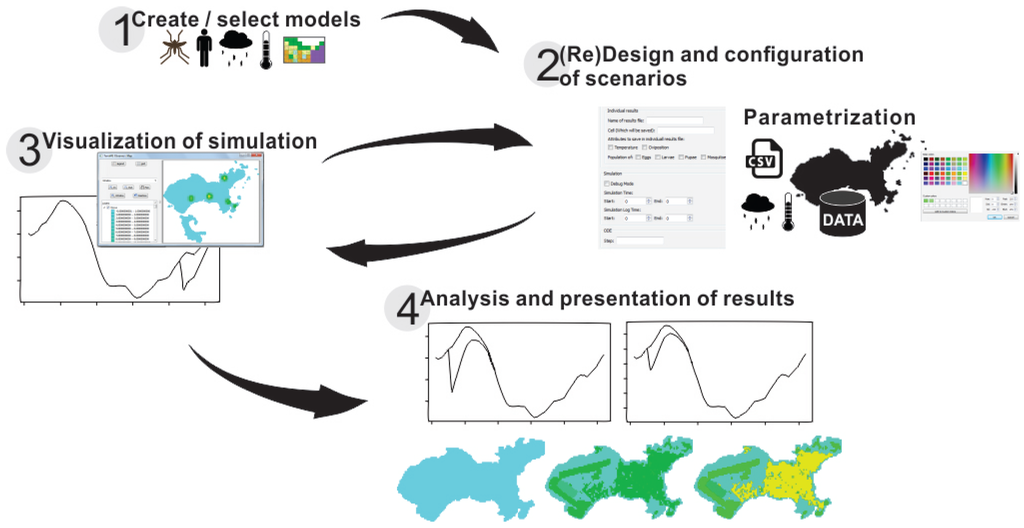
Figure 3.
Diagram showing the modeling process using the DengueME Visual Development Environment [63].
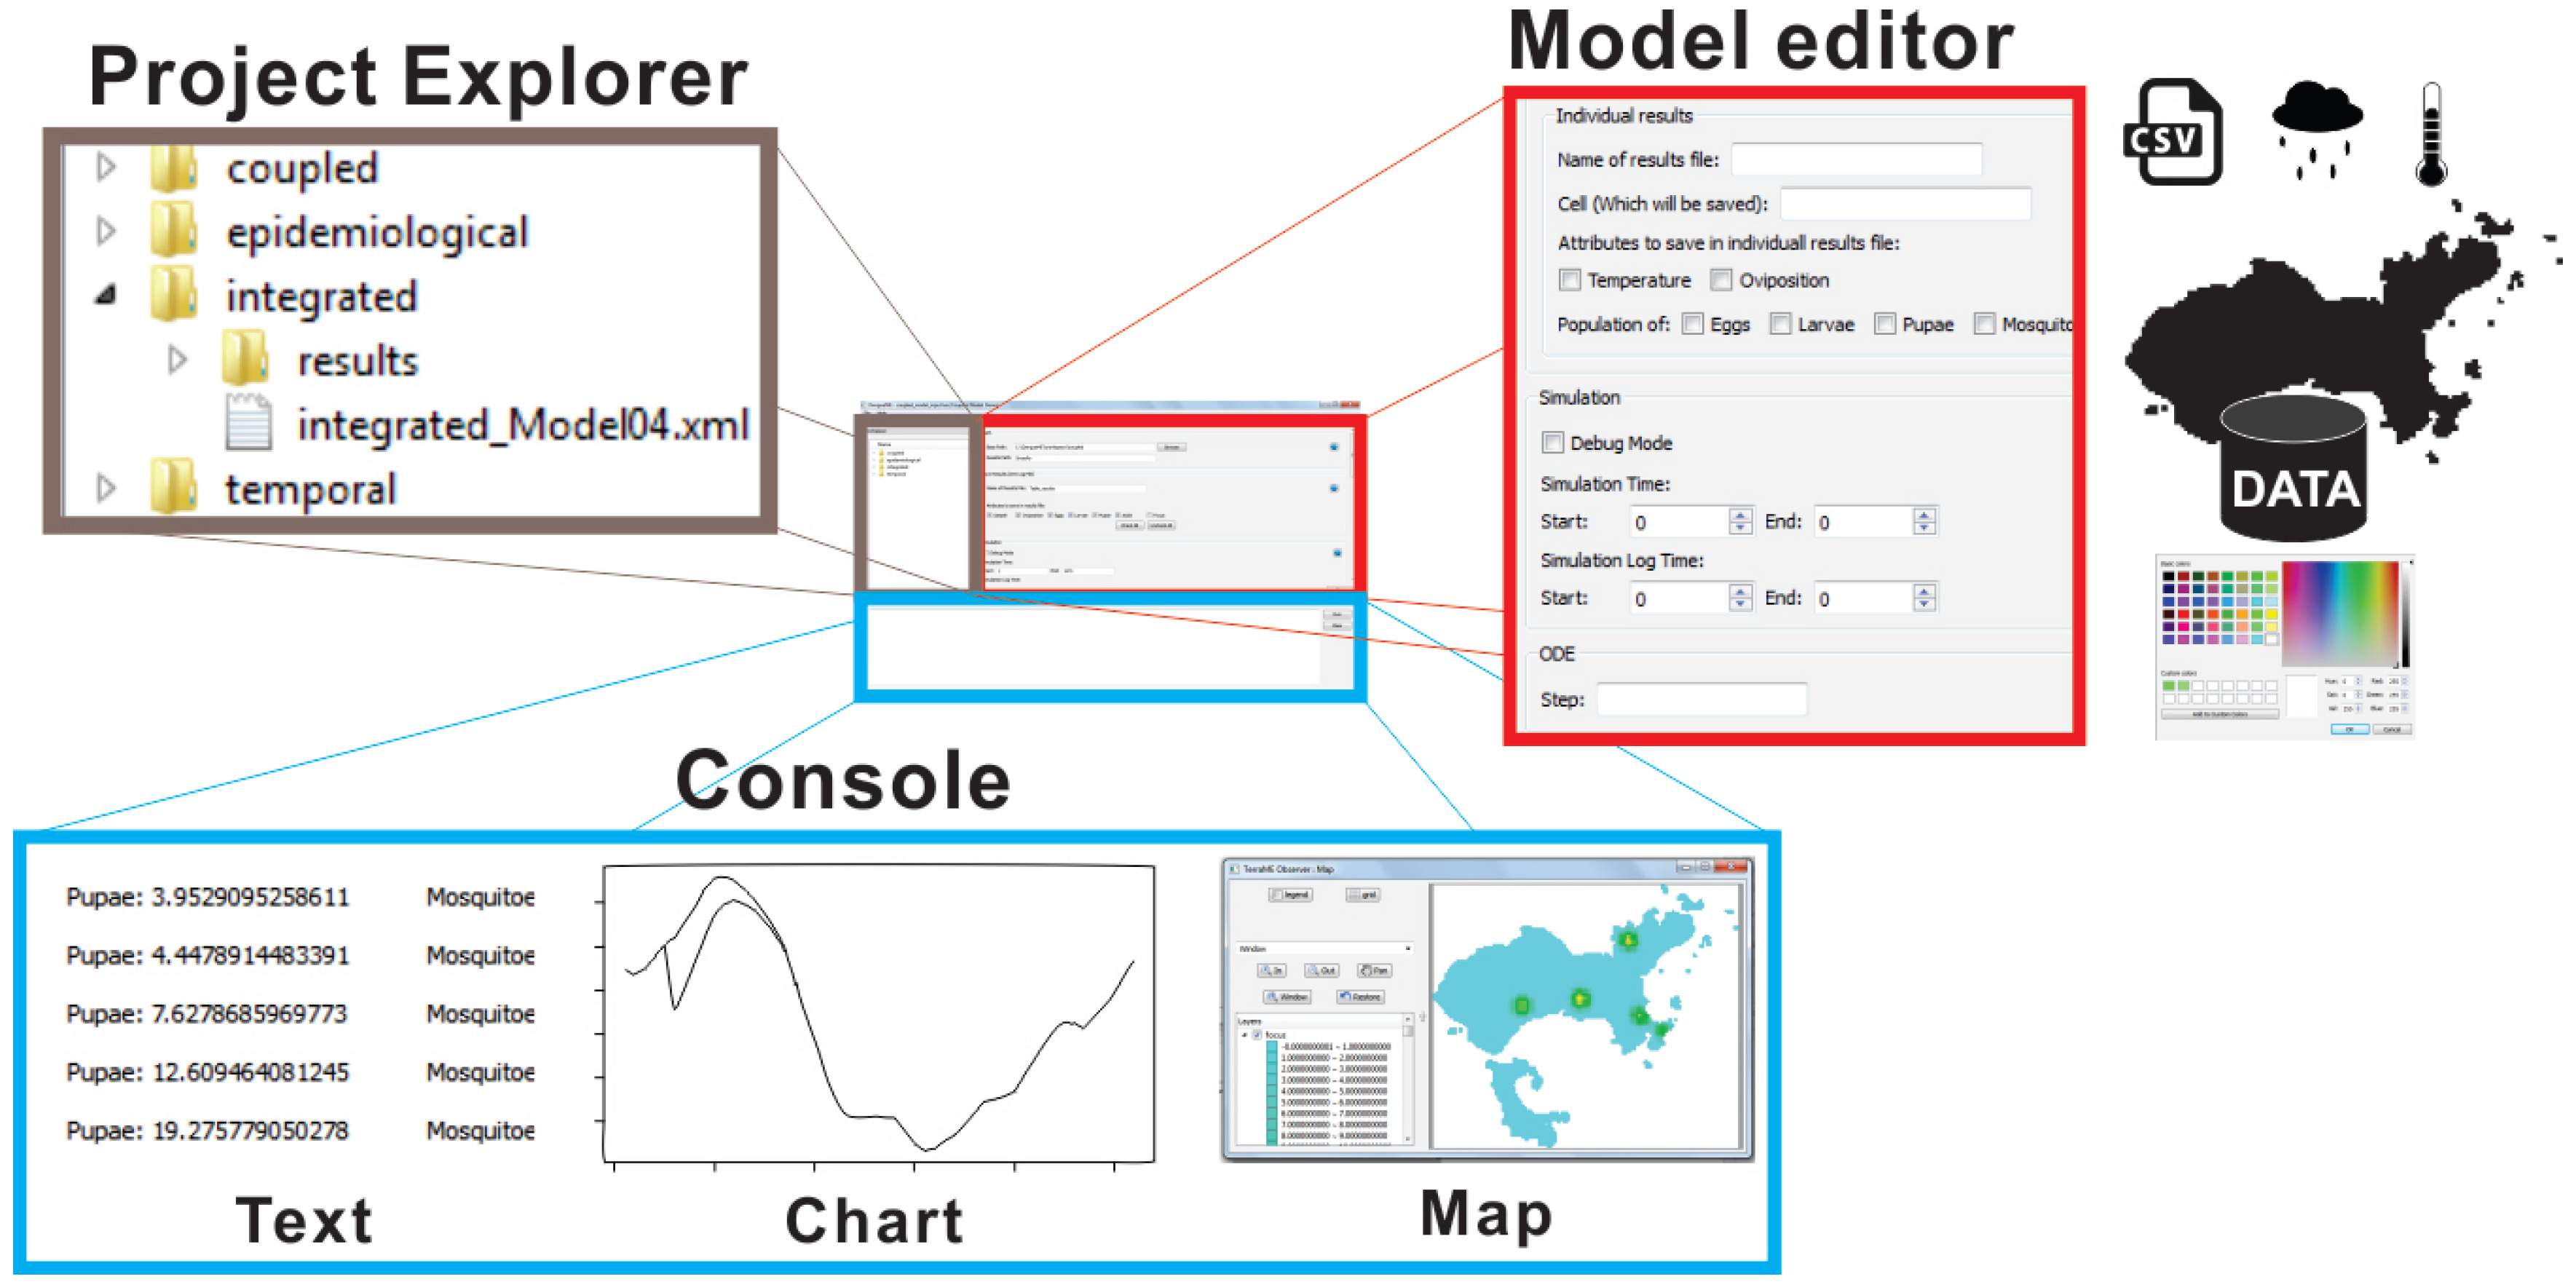
The GUI components of DengueME VDE are presented in Figure 4. The goal is to eliminate barriers related to using programming languages and to make it easier to use the framework. Its design works with the concepts of Workspace (working directory that contains the user’s projects), View (interface components for browsing and/or presenting information on projects and models), and Editor (interface components for editing models). Figure 4 illustrates some of these features: (a) the Project Explorer displays and allows navigation through projects and existing models within the workspace; (b) the Model Editor allows setting model parameters and scenarios (e.g., using the GUI to import meteorological and other data from text files or databases) and output options; (c) the Console view presents information and views derived from the simulations.

Figure 4.
Graphical interface of the DengueME Visual Development Environment (VDE) [63].
4. DengueME Application
The following sections describe the pedagogical application of DengueME in three case studies. The first case study describes a simple dengue transmission model based on ordinary differential equations, proposed by Nishiura (2006) [106]. The second is an Ae. aegypti population dynamics model, also based on ordinary differential equations, proposed by Lana et al. (2014) [56]. The second example includes simulating the application of insecticide in some areas of a real urban space (geographic database). The third is an agent-based transmission model based on Medeiros et al. (2011) [51] and simulated in the same real urban space.
4.1. A Basic SIR-SI Transmission Model
The model library of DengueME offers a set of models that can be used for pedagogical purposes, to study the spatiotemporal dynamics of dengue transmission and vector ecology. As an example, a SIR-SI (Susceptible-Infectious-Removed – Susceptible-Infectious) model based on the one proposed by Nishiura (2006) [106] was developed. The conceptual model is represented in Figure 5. Human and vector populations are described using a compartmental model, where each compartment represents the amount of population in a given state (susceptible, infectious and removed). One assumption is that once a vector is infected, it remains infectious until the end of the simulation. As a simplification, the populations of humans and mosquitoes were kept constant throughout the simulation, i.e., the population dynamics of humans and mosquitoes were disregarded. The transition between states is determined by the following rates and parameters: (i) probability of transmission (vector-to-human and human-to-vector); (ii) average number of bites per mosquito per day; (iii) human recovery rate (for details about values of the parameters and equations of human and vector populations, see Nishiura (2006) [106]).
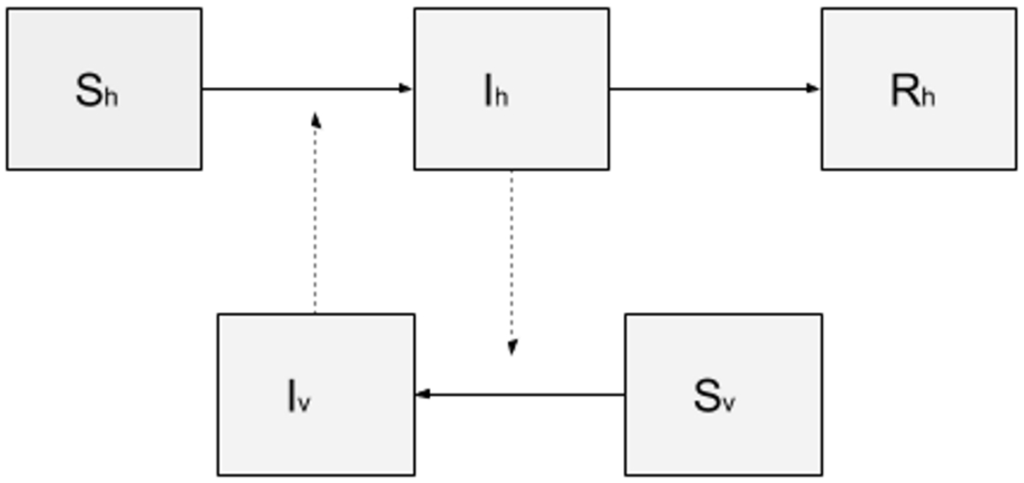
Figure 5.
Compartmental model SIR-SI, where the human population is represented by three compartments: susceptible (Sh), infectious (Ih) and removed (Rh); and the mosquito population by two compartments: susceptible (Sv) and infectious (Iv).
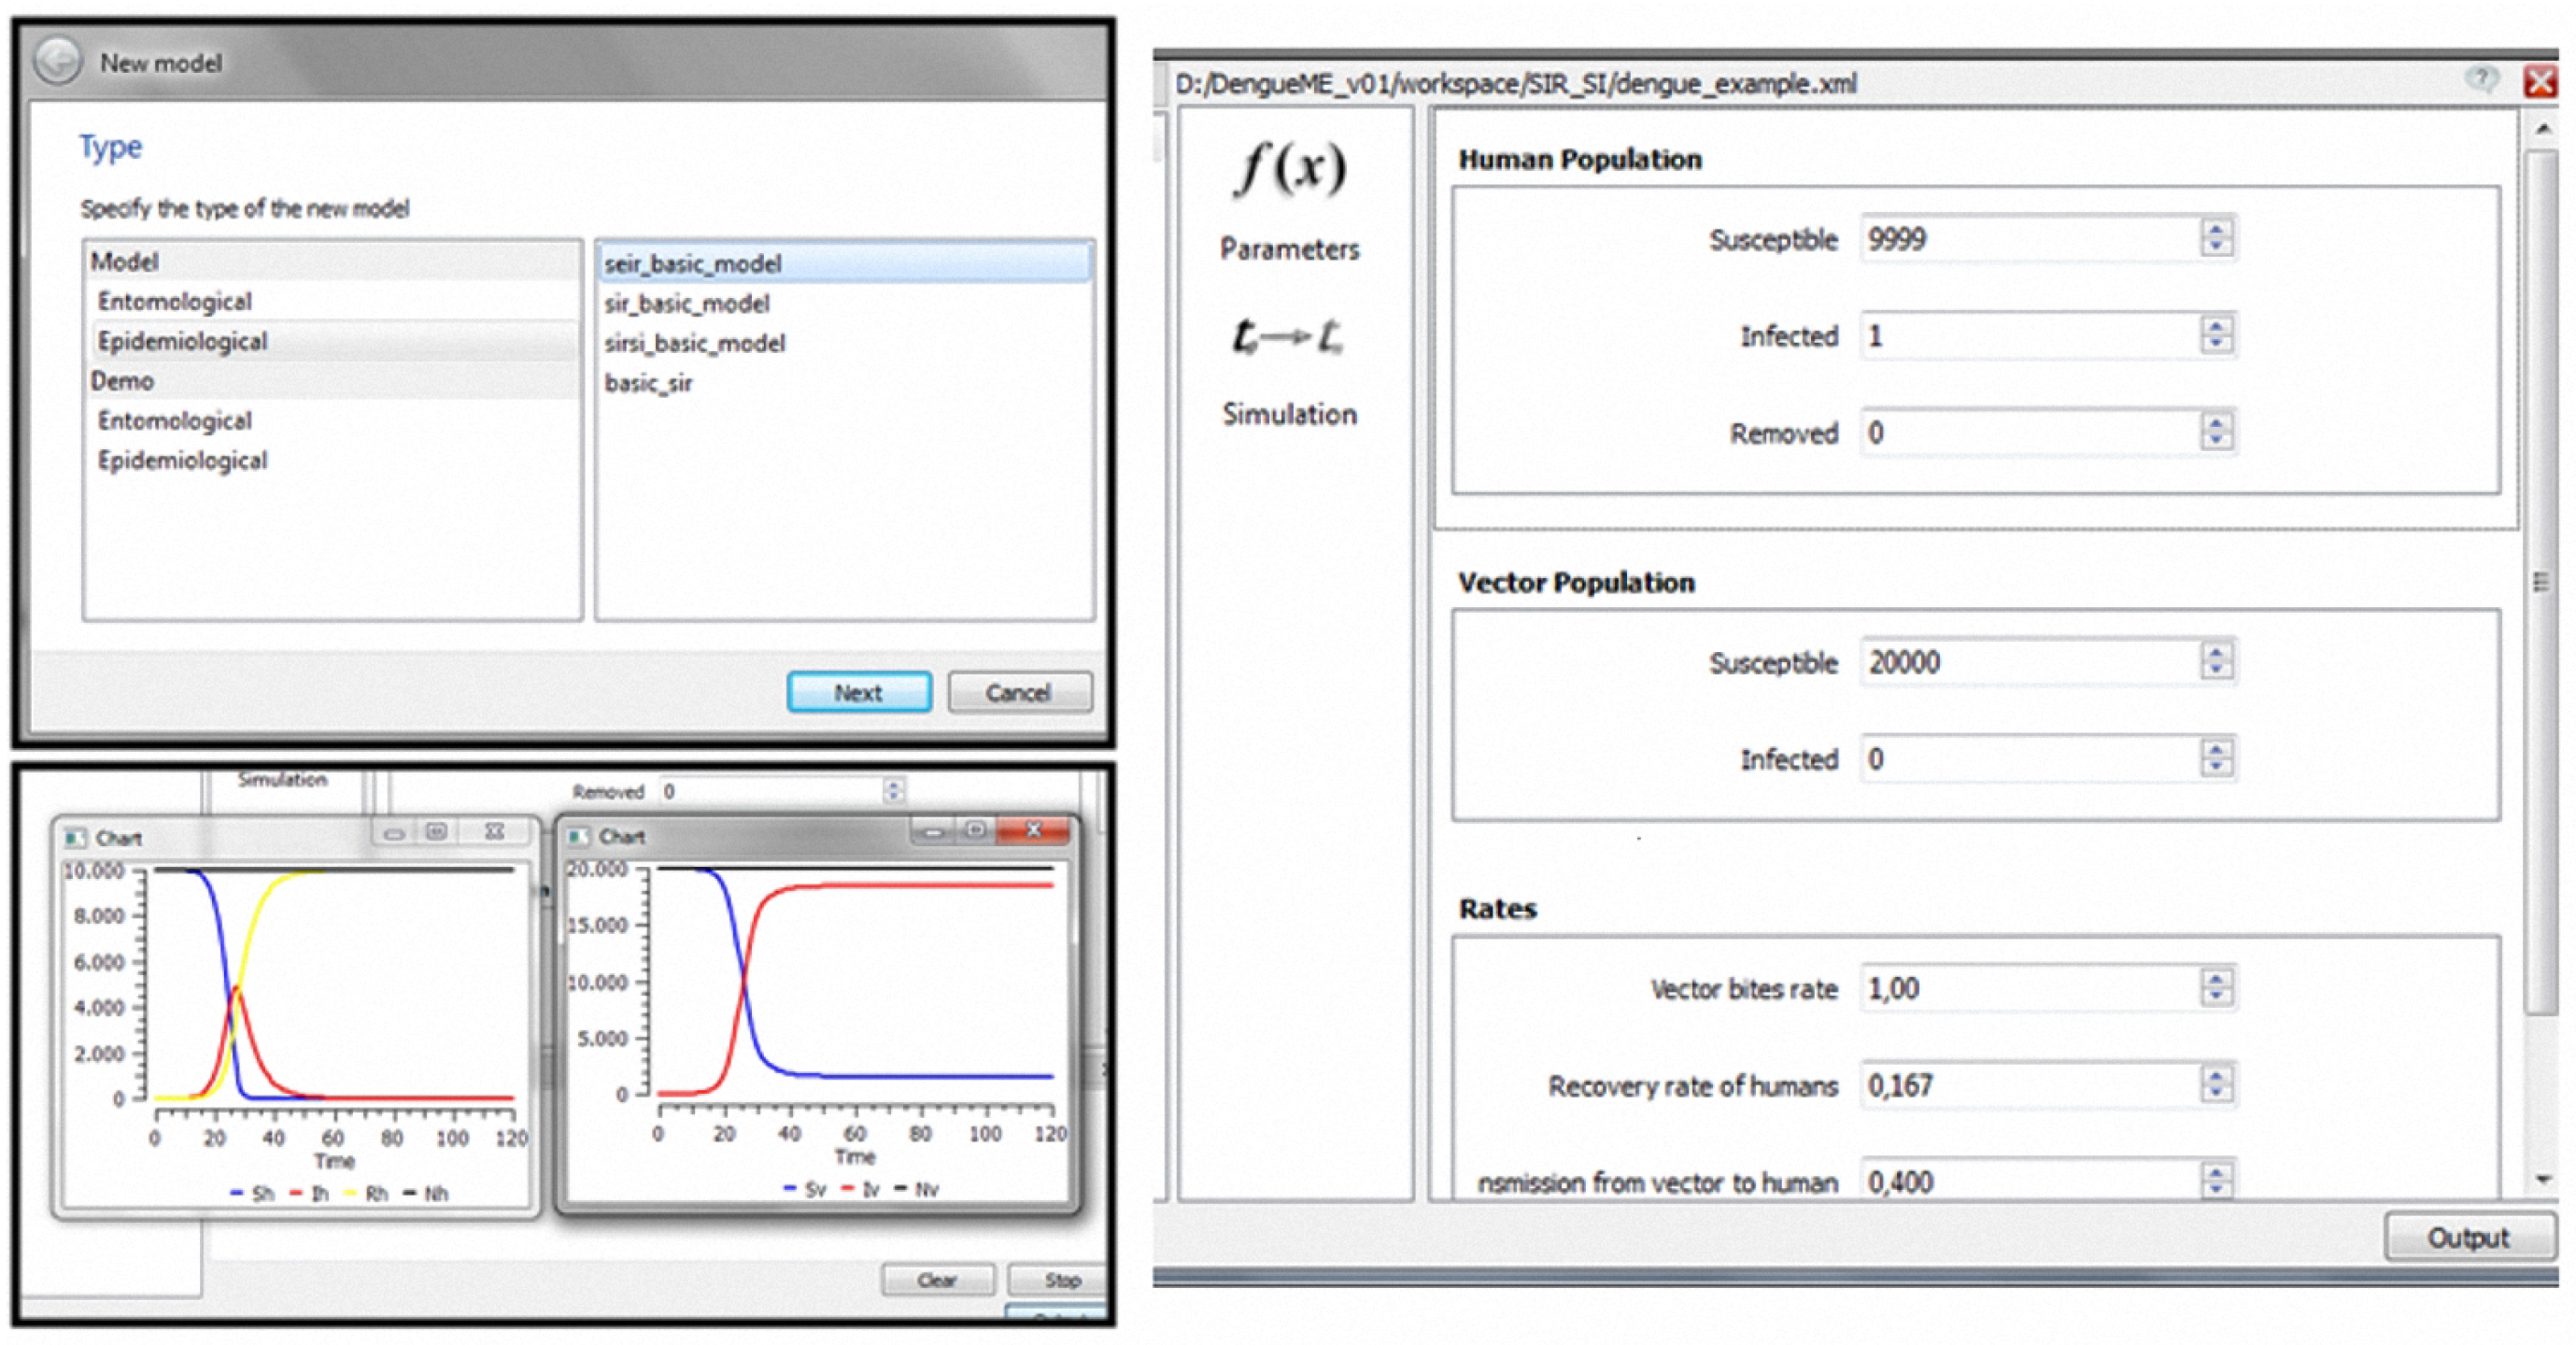
Starting with this model, implemented and accessible through the DengueME VDE, it is possible to create and analyze different scenarios. A possible scenario involves seeking to understand how the parameters affect transmission dynamics. As illustrated in Figure 3, the user can first create a project and use one of the models available in the library, by interacting with “wizards” (Figure 6, top left panel). After that, the second step (Figure 3, (re)design and configuration of scenarios) involves the parameterization of the model, using a user-friendly interface (Figure 6, right panel). Some default values are provided for the parameters. Thereafter, users can run the simulation, visualize results (Figure 6, bottom left panel) and save them for further analysis.
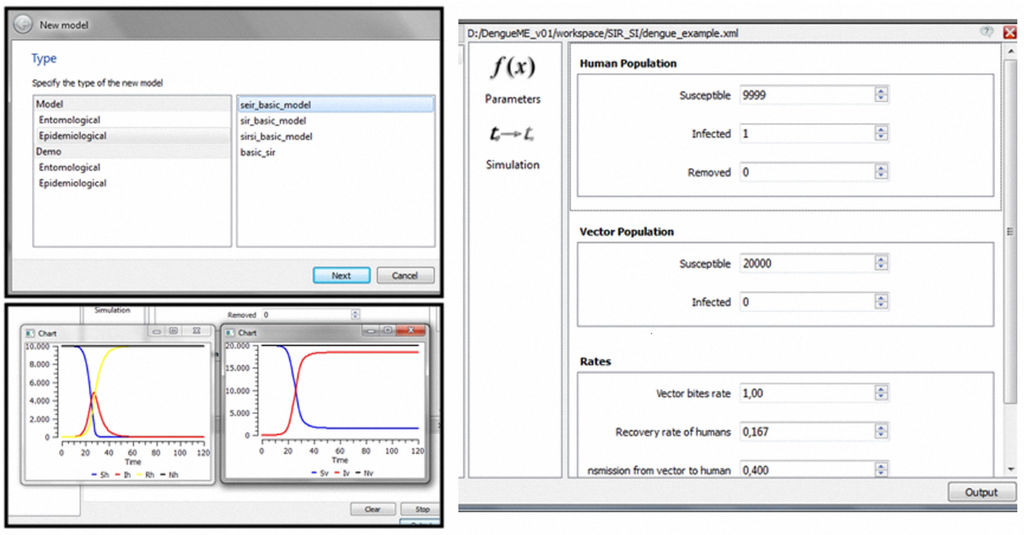
Figure 6.
Modeling and simulation using the DengueME VDE: (top left panel)—Wizard to support the creation/selection of models; (right panel)—Graphical interface for parameterization; (bottom left panel)— Execution of the model and visualization of the simulation results.
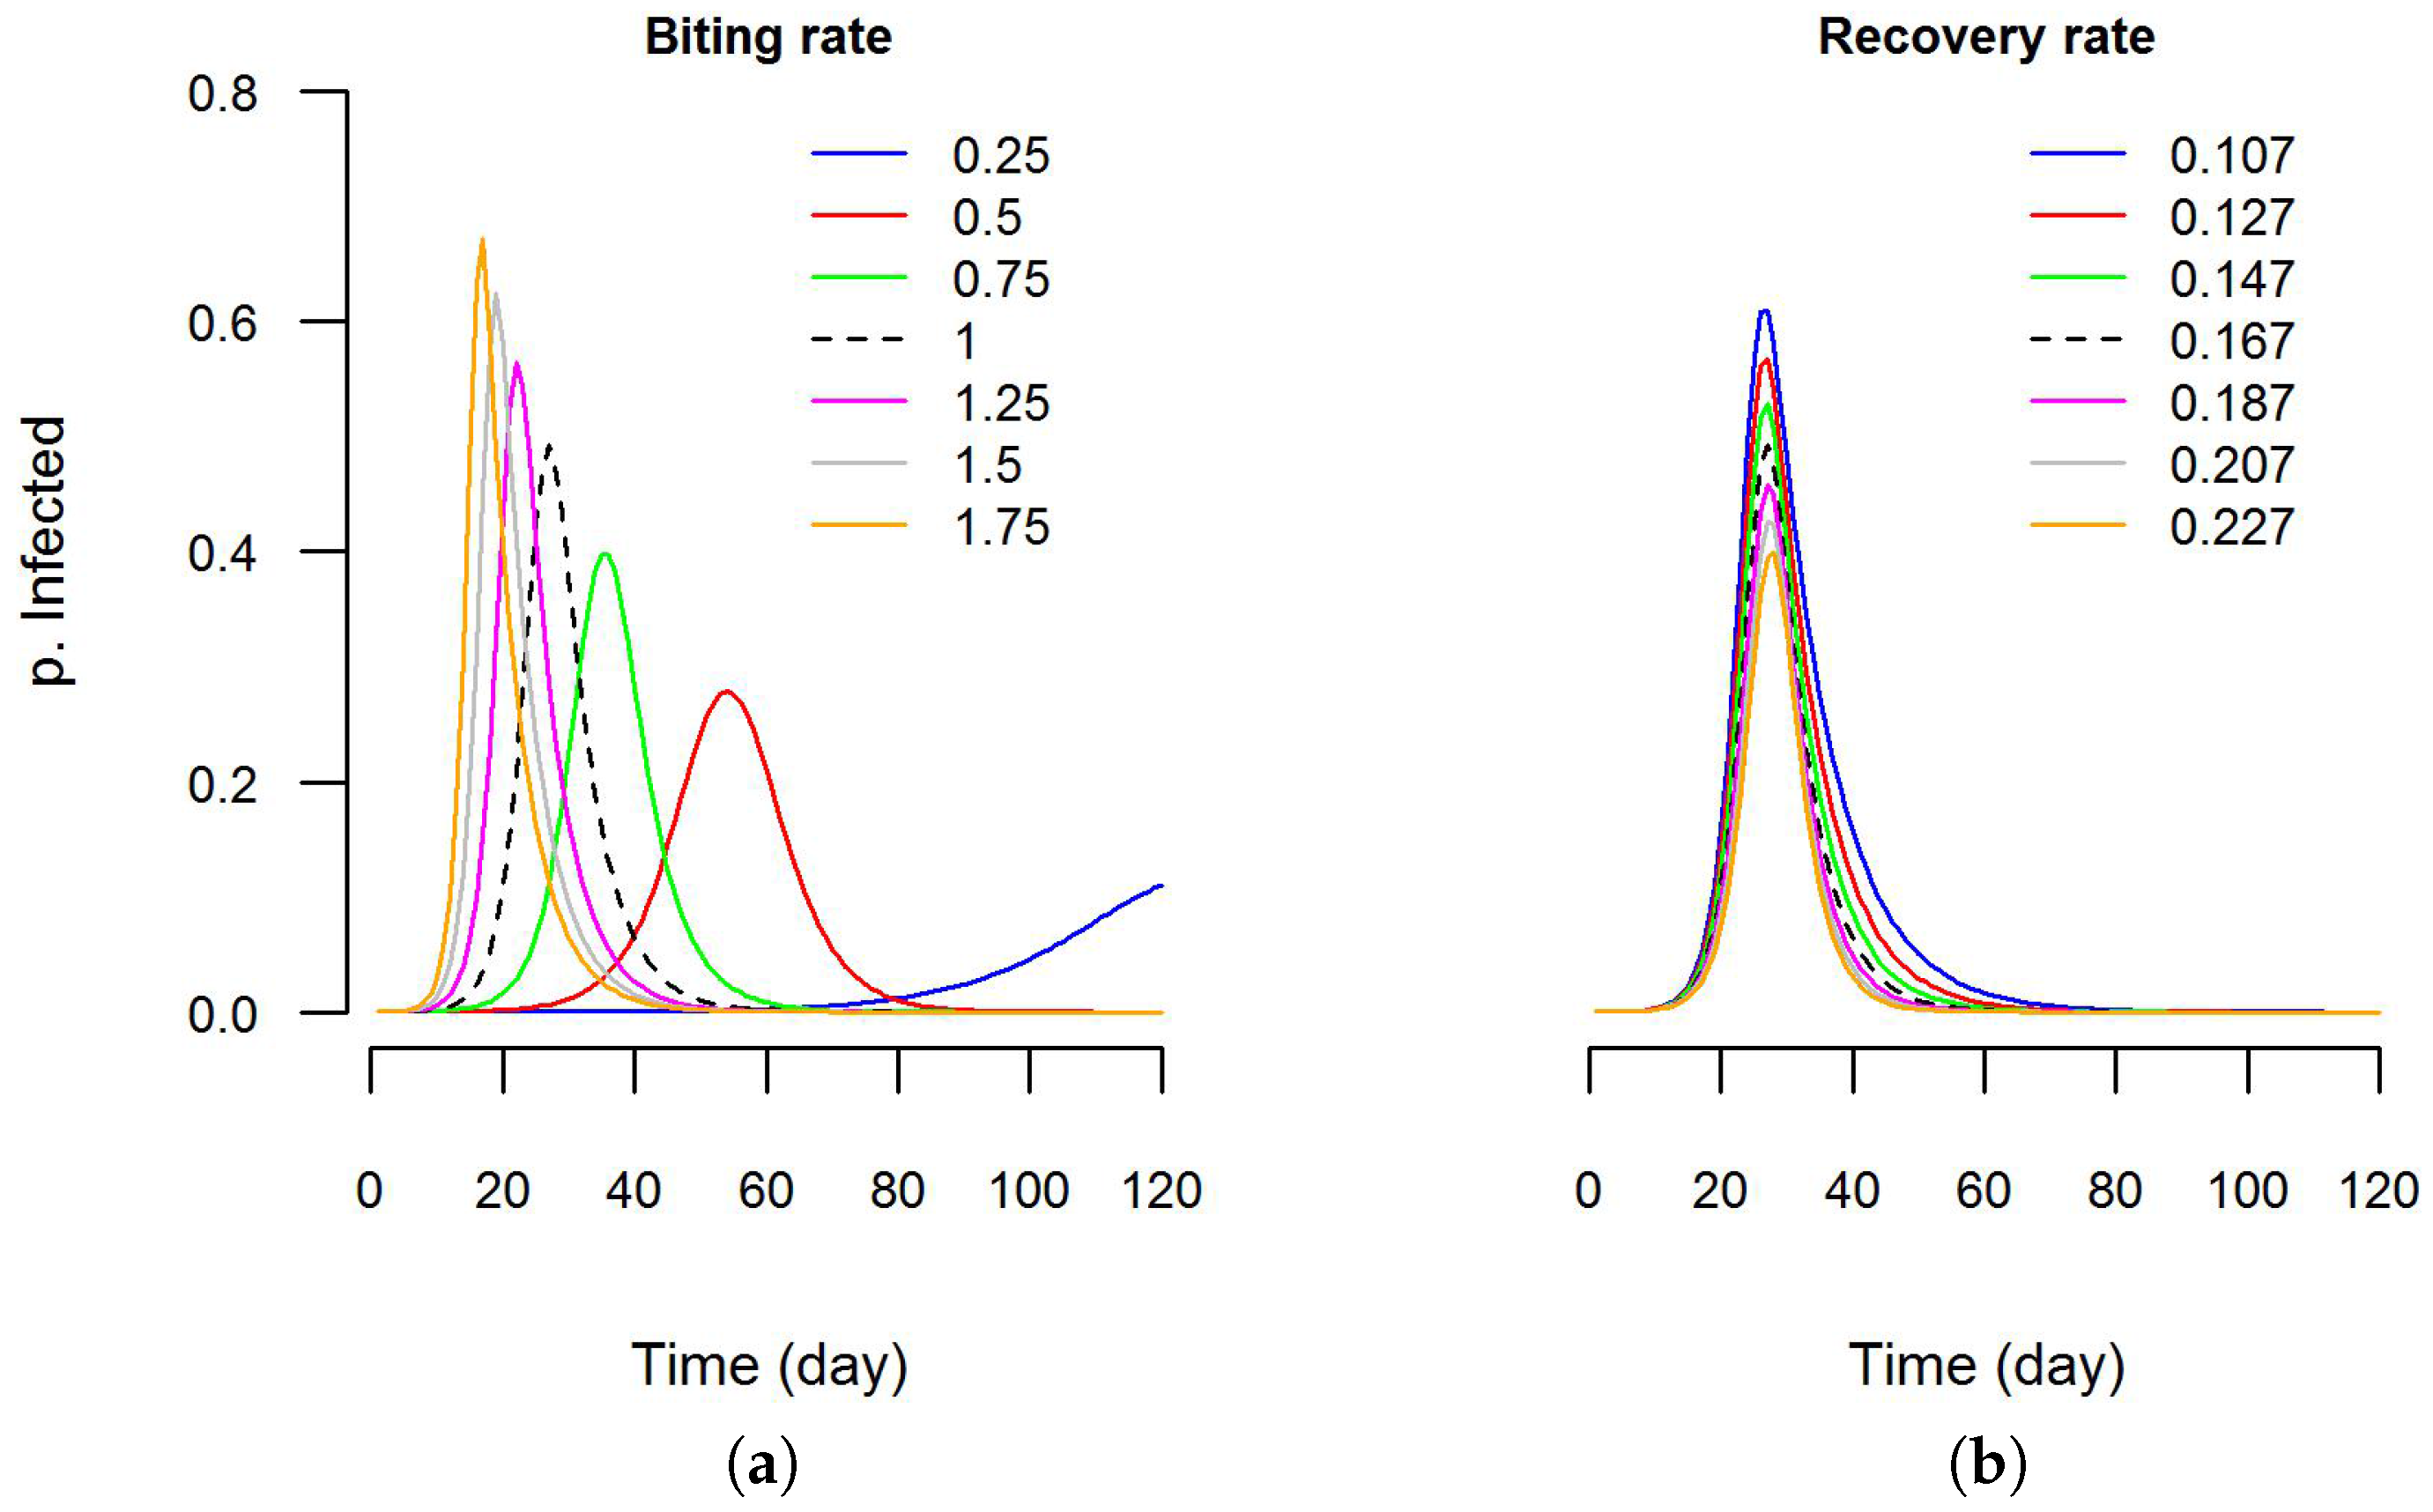
For instance, the model was executed several times changing (one at time) the parameters “biting rate” and “recovery rate”. One of the outputs generated by the model is a CSV
file containing the values of parameters for each simulation step. This was done using the interface of Dengue VDE. Then, using the software R (Version 3.3.0) [107], graphics were created to visualize the sensitivity of the epidemic curve to these parameters (Figure 7). It is clear that the epidemic curve is more sensitive to variations in biting rate than in recovery rate. In the future, additional features (e.g., automated execution of batch simulations using value ranges for the parameters) will be developed to help users with sensitivity analyses.

Figure 7.
Sensitivity analysis using DengueME: (a) sensitivity of the predicted epidemic curve to variations in the biting rate parameter and; (b) recovery rate parameter. The Y-axis is the proportion infected in the human population. The black dashed line is the model output with default values (as used by Nishiura (2006) [106]).
The model library and user-friendly interface of DengueME support teaching-learning activities based on the creation and analysis of what-if scenarios, such as: (i) whether vector population dynamics is influenced by seasonal factors (e.g., temperature) (what happens to the transmission dynamics of dengue if the vector population increases (or decreases)?); (ii) several factors (e.g., immunity, contacts) that affect virus transmission between vectors and humans are combined into a single parameter in the model (the transmission probability). What is the sensitivity of the expected dengue dynamics to values chosen for this parameter? The parameters can be tentatively changed, and the corresponding source code of the model is automatically generated and updated, so it can be executed directly from the graphic interface. Users who have programming skills can inspect the model’s source code and adapt it manually to their own needs.
Several adaptations can be done to extend this model. For instance, another compartment could be included to represent the population (of humans, vectors or both) that is exposed to the disease (e.g., see [108,109]). Other features, like extrinsic and intrinsic incubation periods, vector ecology and explicit representation of vector life cycle phases and multiple virus serotypes, can also be included. A review of structural approaches applied to epidemiological models for dengue transmission can be found in [110].
4.2. Simulating the Impact of Local Interventions on Vector Density
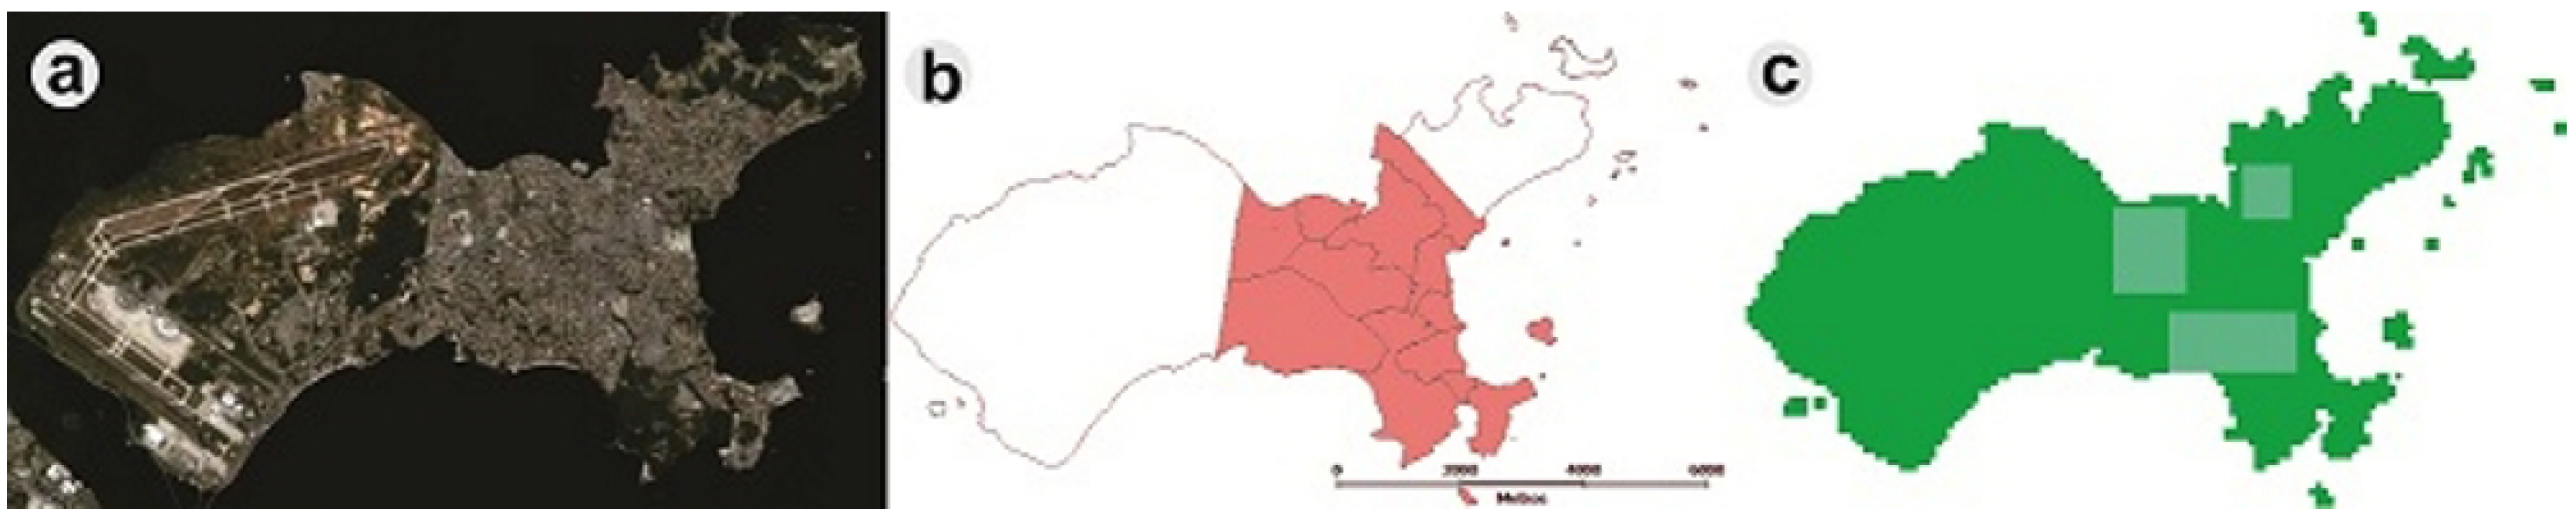
An important issue is the development of standardized metrics for monitoring and evaluating the performance of control programs [48]. Alternative strategies, such as spatially-localized chemical treatments to reduce mosquito density, could be better targeted, and the resource allocation could be optimized if computer-simulated scenarios were applied. Using DengueME, we created different intervention scenarios to explore the impact of locally-applied intervention strategies on the local and global density of Ae. aegypti. Ilha do Governador, an island in the city of Rio de Janeiro, Brazil, was used as the study area (Figure 8). All of the stages of the vector life cycle are explicitly represented through a compartmental model and using differential equations, and the transition rates between the stages are regulated by temperature. The model and its equations are described in detail by Lana et al. (2014) [56]. A map of census tracts, obtained from IBGE (Brazilian Institute of Geography and Statistics, 2010), was used to define the regions for adulticide application, based on Luz et al. (2009) [111]. The pink area in Figure 8b was chosen to simulate the intervention, due to its denser human population. Figure 8c shows the three quadrants where the ultra-low volume adulticide, with maximum efficacy of 0.9 and an average persistence of one day, was applied.
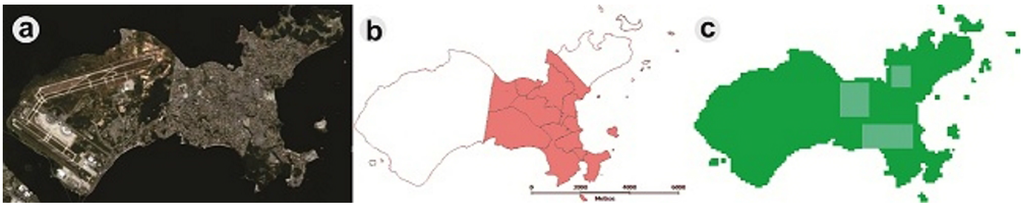
Figure 8.
Study area, Ilha do Governador. (a) Satellite image (Google Earth); (b) map of census tracts; (c) simulated map generated by DengueME. Highlighted blue areas are the sites of application of adulticide [63].
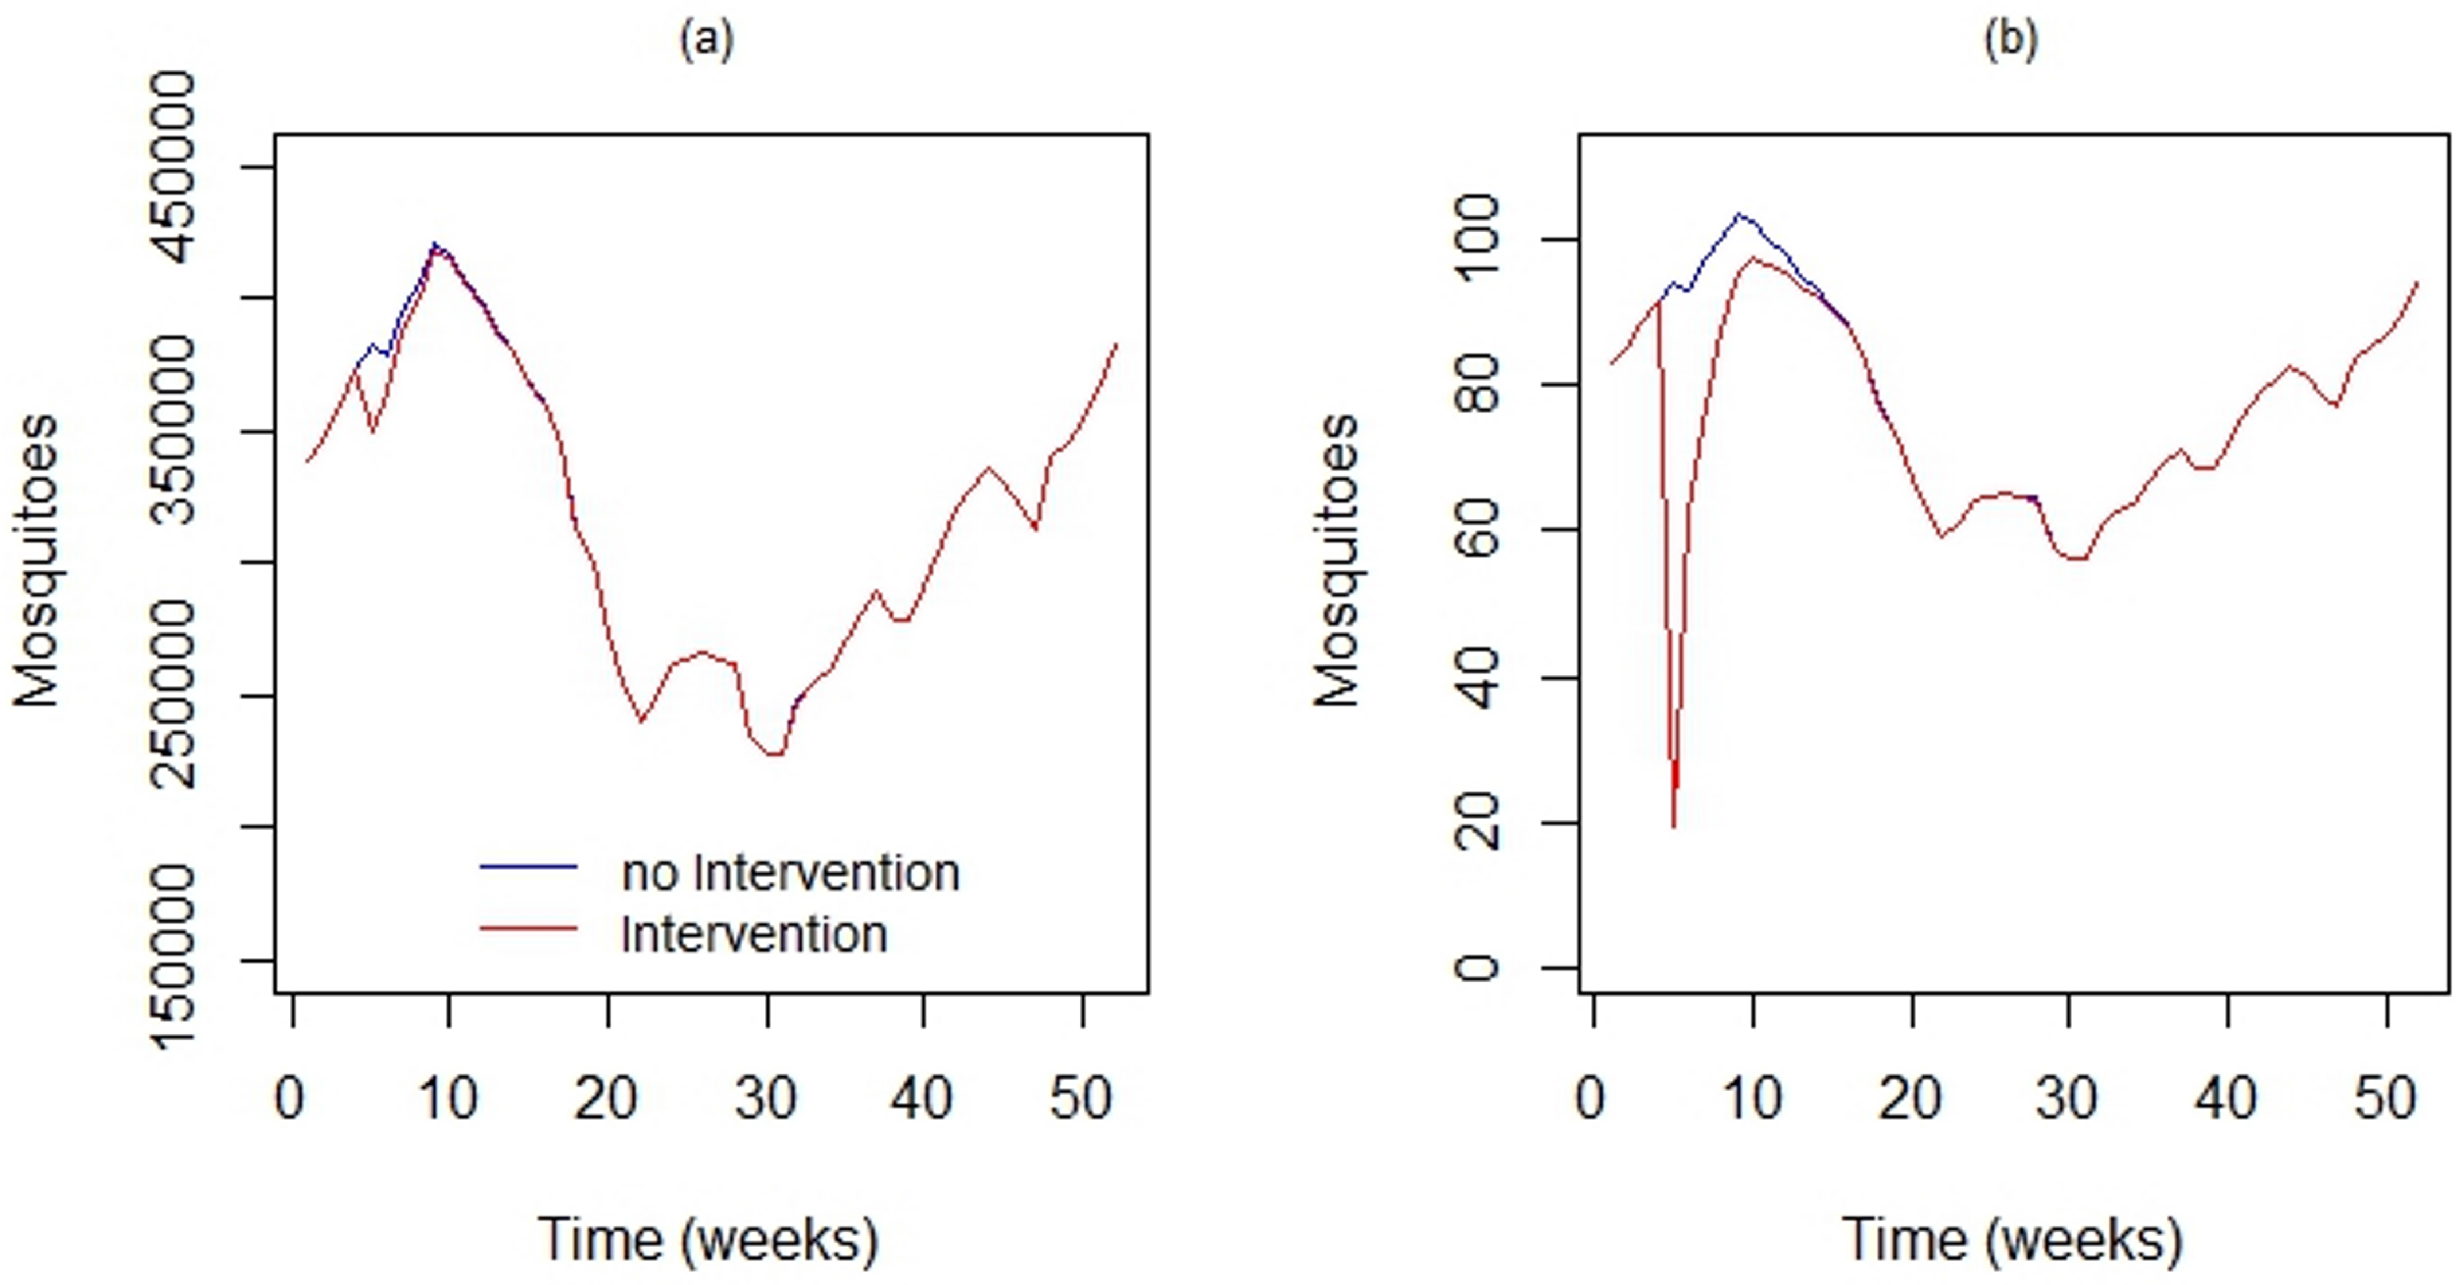
Figure 9a shows the output of DengueME, showing the impact of the intervention at the scale of the whole island. Figure 9b shows the impact of this application in the local population. At the global scale, the intervention did not present a significant impact. However, at the local scale, its impact was significant for a few days. After this period, the population recovered, due to the low persistence of the simulated insecticide and the short period of application. The continuation of this work includes applying this model in different regions, using actual data, to estimate sites that require more attention from municipal epidemiological surveillance.

Figure 9.
Using DengueME to simulate locally-applied chemical interventions. Comparison between the the vector population in the study area with and without the application of adulticide. (a) Global impact considering the entire study area; (b) local impact in a 100 × 100 m area [63].
4.3. Simulating an Epidemic Scenario
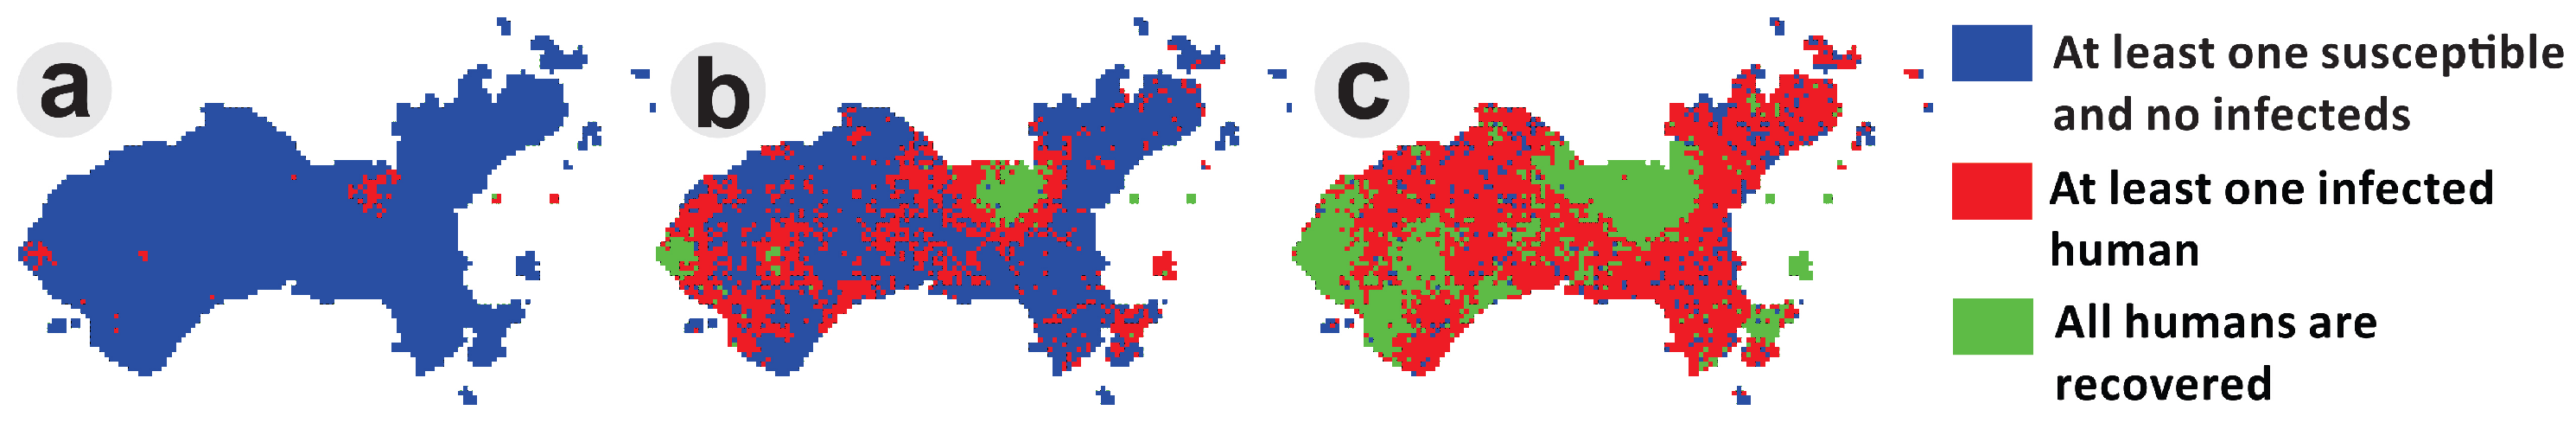
The spatial spread of dengue is the result of complex dynamic interactions between humans, mosquitoes and the different virus serotypes. In this model, there are two classes of agents, humans and Ae. aegypti females, and only one serotype was considered. The presence of the virus in each agent is represented as human and vector attributes. Each cell corresponds to a square area unit that can represent a residential area or an area of public space. Human agents were distributed in residential areas, while vector agents were distributed across all of the cell space. Mosquitoes bite humans according to a daily biting rate, and the transmission of the virus occurs according to a given transmission probability. The mobility of mosquitoes was designed to occur locally (in the nearest neighborhood), while human mobility was designed to be concentrated in public locations, but including movements to residential areas. To illustrate this dynamic, Figure 10 shows the result of a spatial dengue spread simulation at Ilha do Governador. These simulations consider about 2500 human agents and 2000 mosquito agents. Epidemic waves travel from the commercial areas to residential areas of the island. This is an example of a dengue transmission agent-based model, adapted from Medeiros et al. (2011) [51], implemented in DengueME.
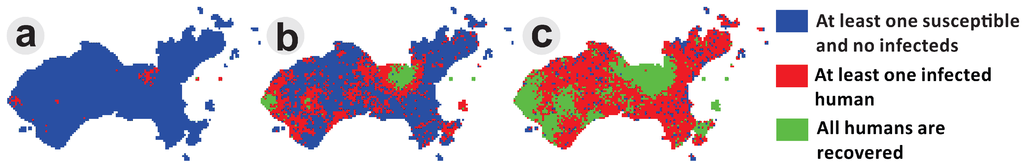
Figure 10.
Using DengueME to simulate dengue spread from commercial to residential areas of a city. Panels show three moments of a simulated epidemic in the study area. (a) Beginning of the simulation with a few hotspots; (b) propagation waves from the hotspots; (c) overall dissemination and pockets of immunity [63].
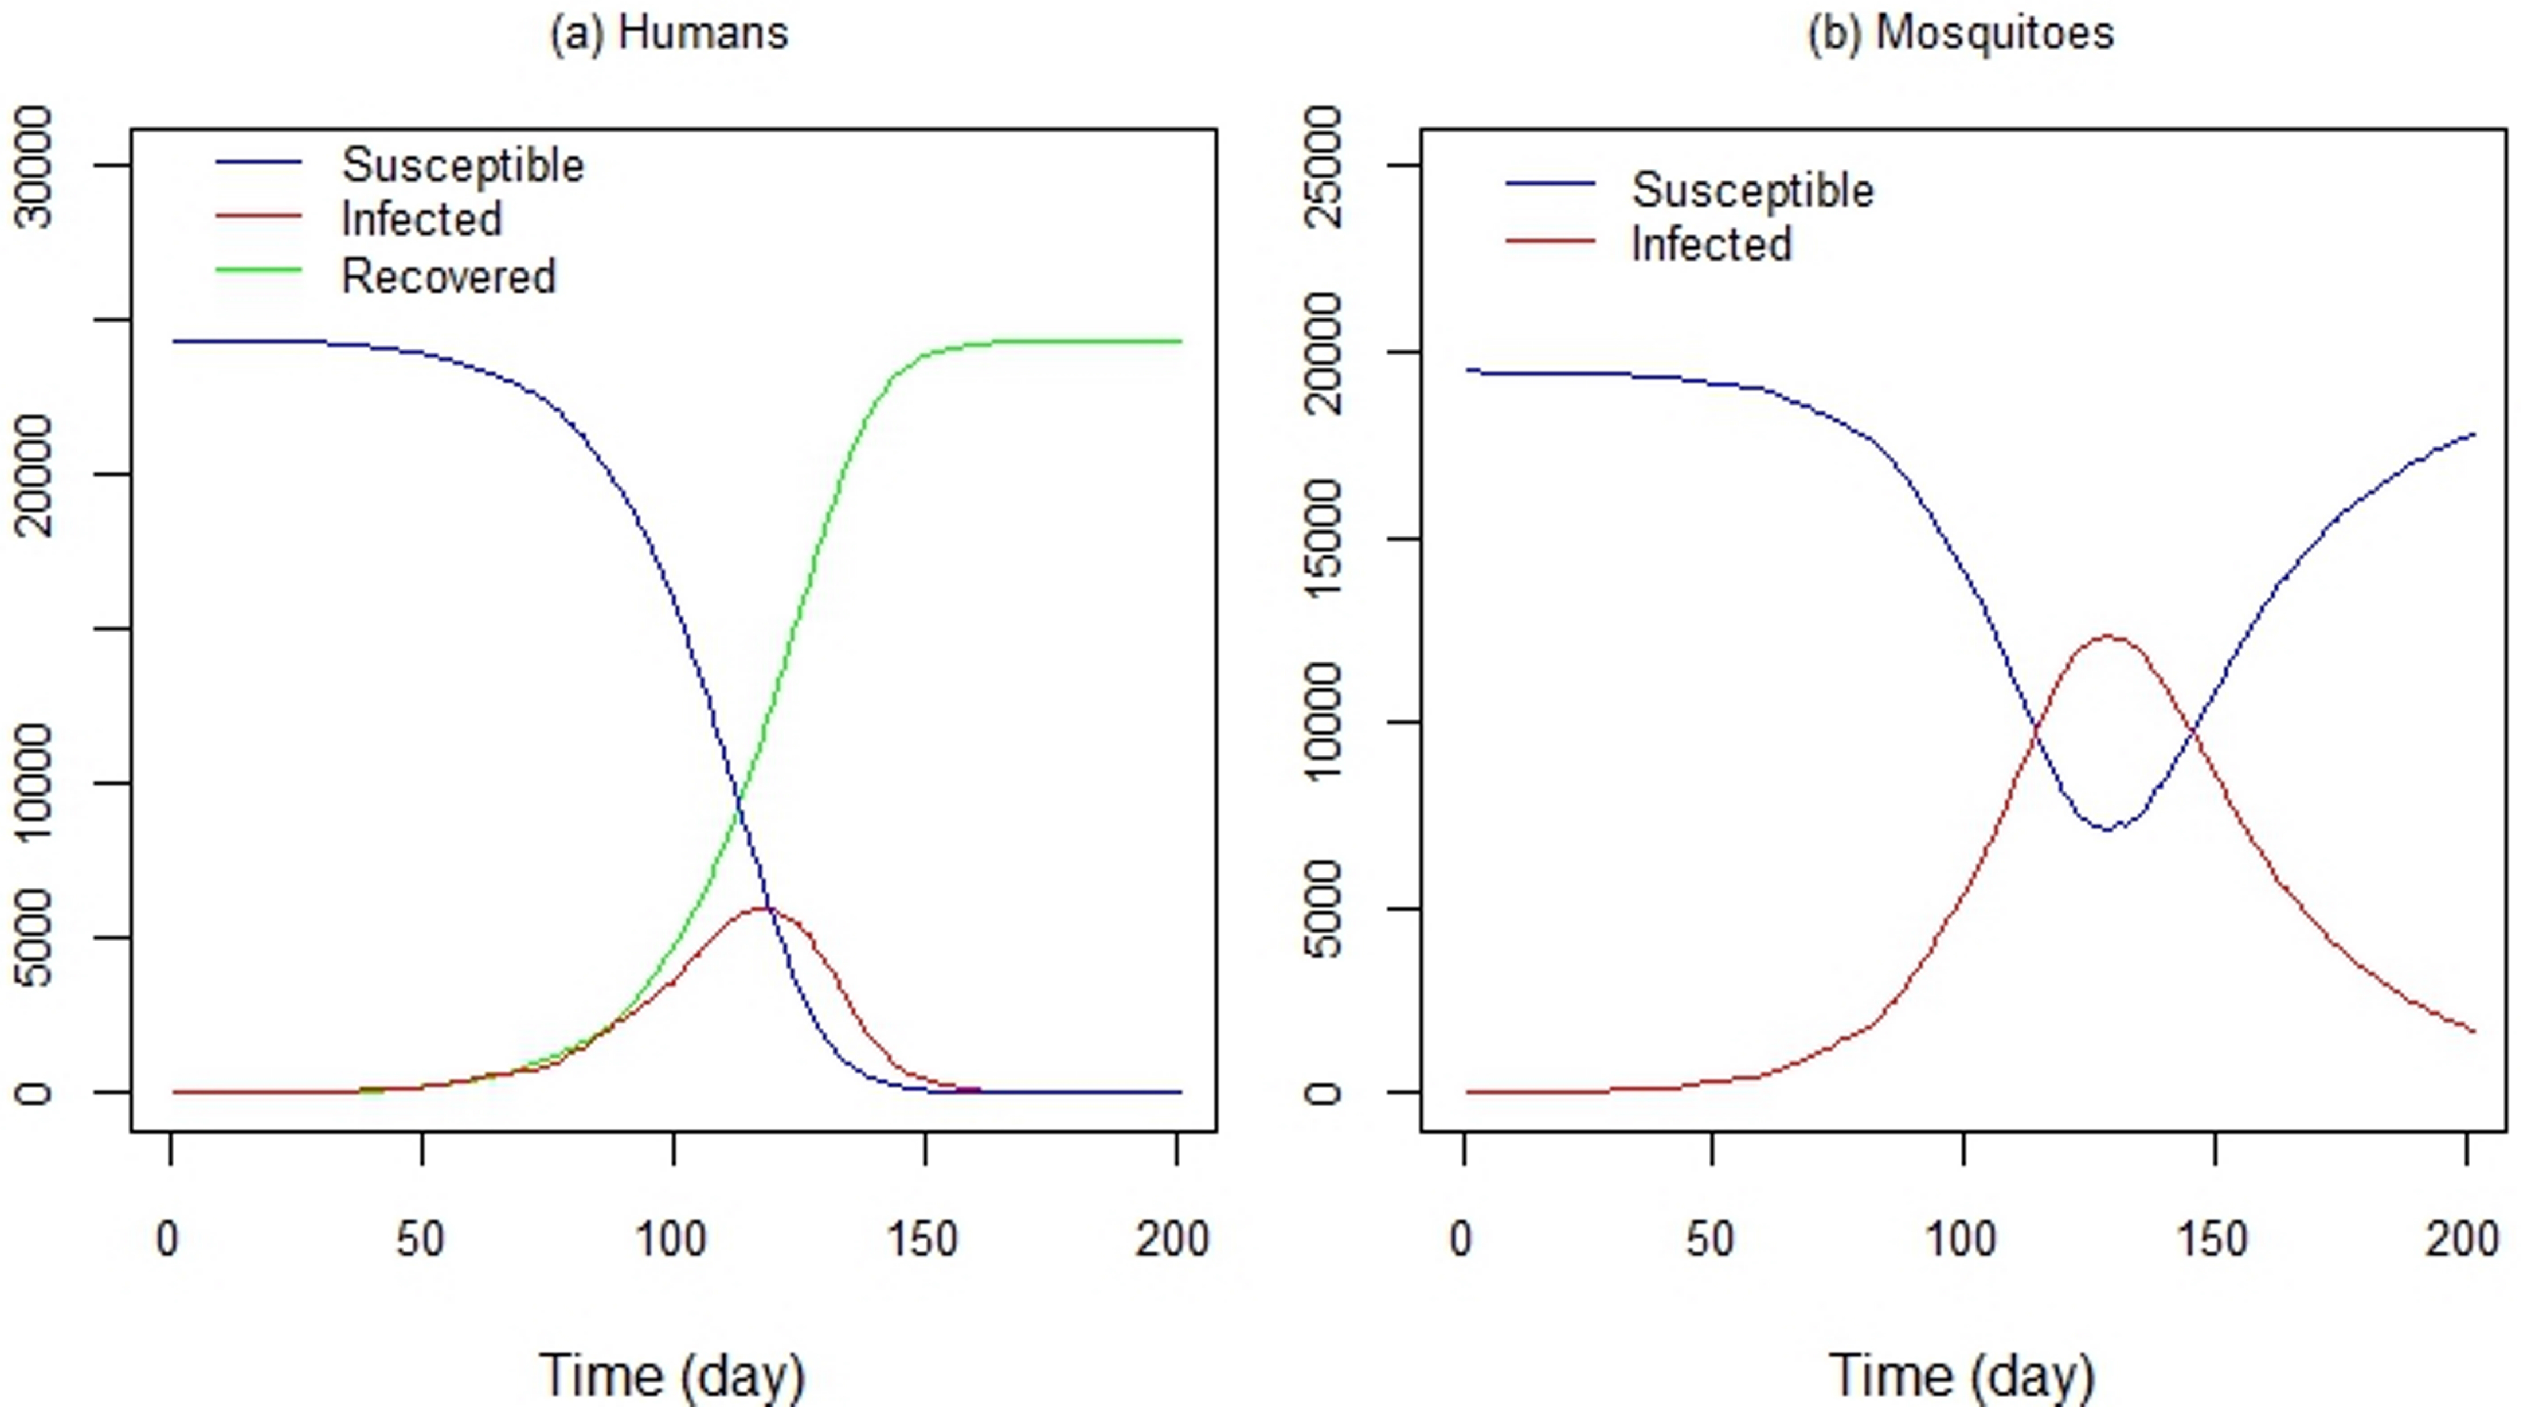
Figure 11a shows the time series of susceptible, infected and recovered humans, and Figure 11b shows the time series of susceptible and infected mosquitoes, respectively. Control strategies were not implemented in this experiment; only human and mosquito mobility and the virus transmission were considered. Despite this, modeling the dengue transmission dynamics is a powerful tool for evaluating control strategies, such as vaccine programs (e.g., [112,113,114,115,116,117]), as well as strategies like public education programs or the use of mosquito repellents.
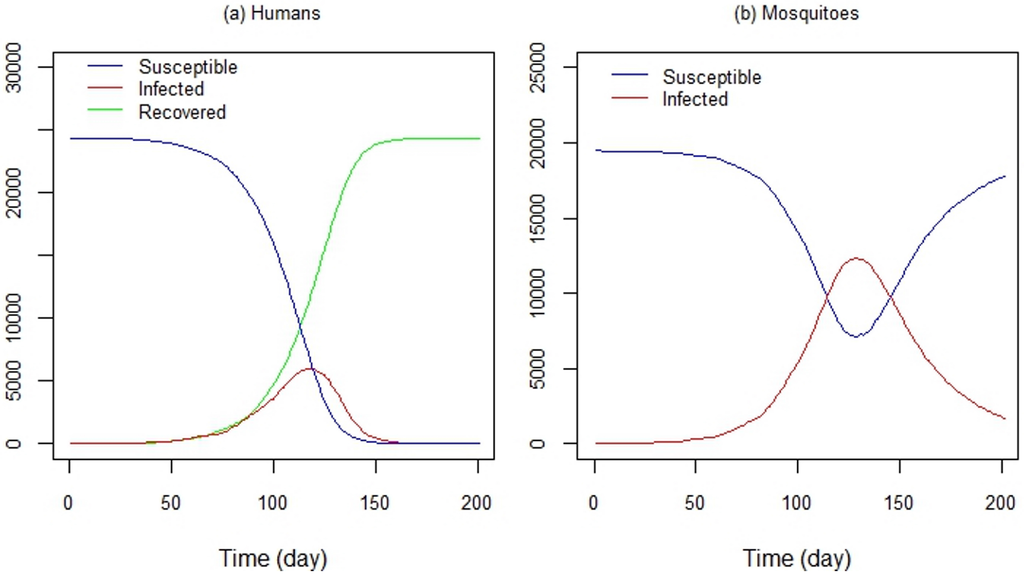
Figure 11.
DengueME output. Time series of (a) susceptible, infected and recovered humans and (b) susceptible and infected mosquitoes, generated by DengueME simulations [63].
5. DengueME Evaluation
An evaluation of the DengueME environment by potential users was carried out to identify their perception of the framework’s applicability and its usage for teaching, research and decision-making activities. The evaluation also serves as a source of information to help prioritize future development efforts. For this purpose, we conducted a group dynamic session during the III Symposium on Modeling Dengue, which took place between 8 and 10 May 2013. The group dynamic session began with a brief presentation about the framework and its objectives. Then, participants were invited to install the framework following a guide. Next, participants did an exercise parameterizing and running built-in DengueME models. At the end of the session, they were invited to fill in a questionnaire reporting their experience and providing feedback. Finally, we conducted a focus group discussion. Focus group discussions allow gathering data about participant perceptions through a moderated debate. Sixteen individuals with different backgrounds participated in the study, mostly university professors and students from several areas of expertise (entomology, medicine, epidemiology, biomedical engineering, statistics, biology, computer science, physics), with varied degrees of experience in programming and dengue modeling.
Overall, the results of this group session suggest that the DengueME VDE is friendly enough for building and running models and scenarios. All users completed the proposed tasks, most of them without any help. However, some participants reported difficulties in understanding the built-in models from the information offered by the development environment. This result indicates the need for improved documentation. Overall, we concluded that a graphical interface helps model building, and it is an important asset for fostering the use of DengueME as a tool to support the design of interventions.
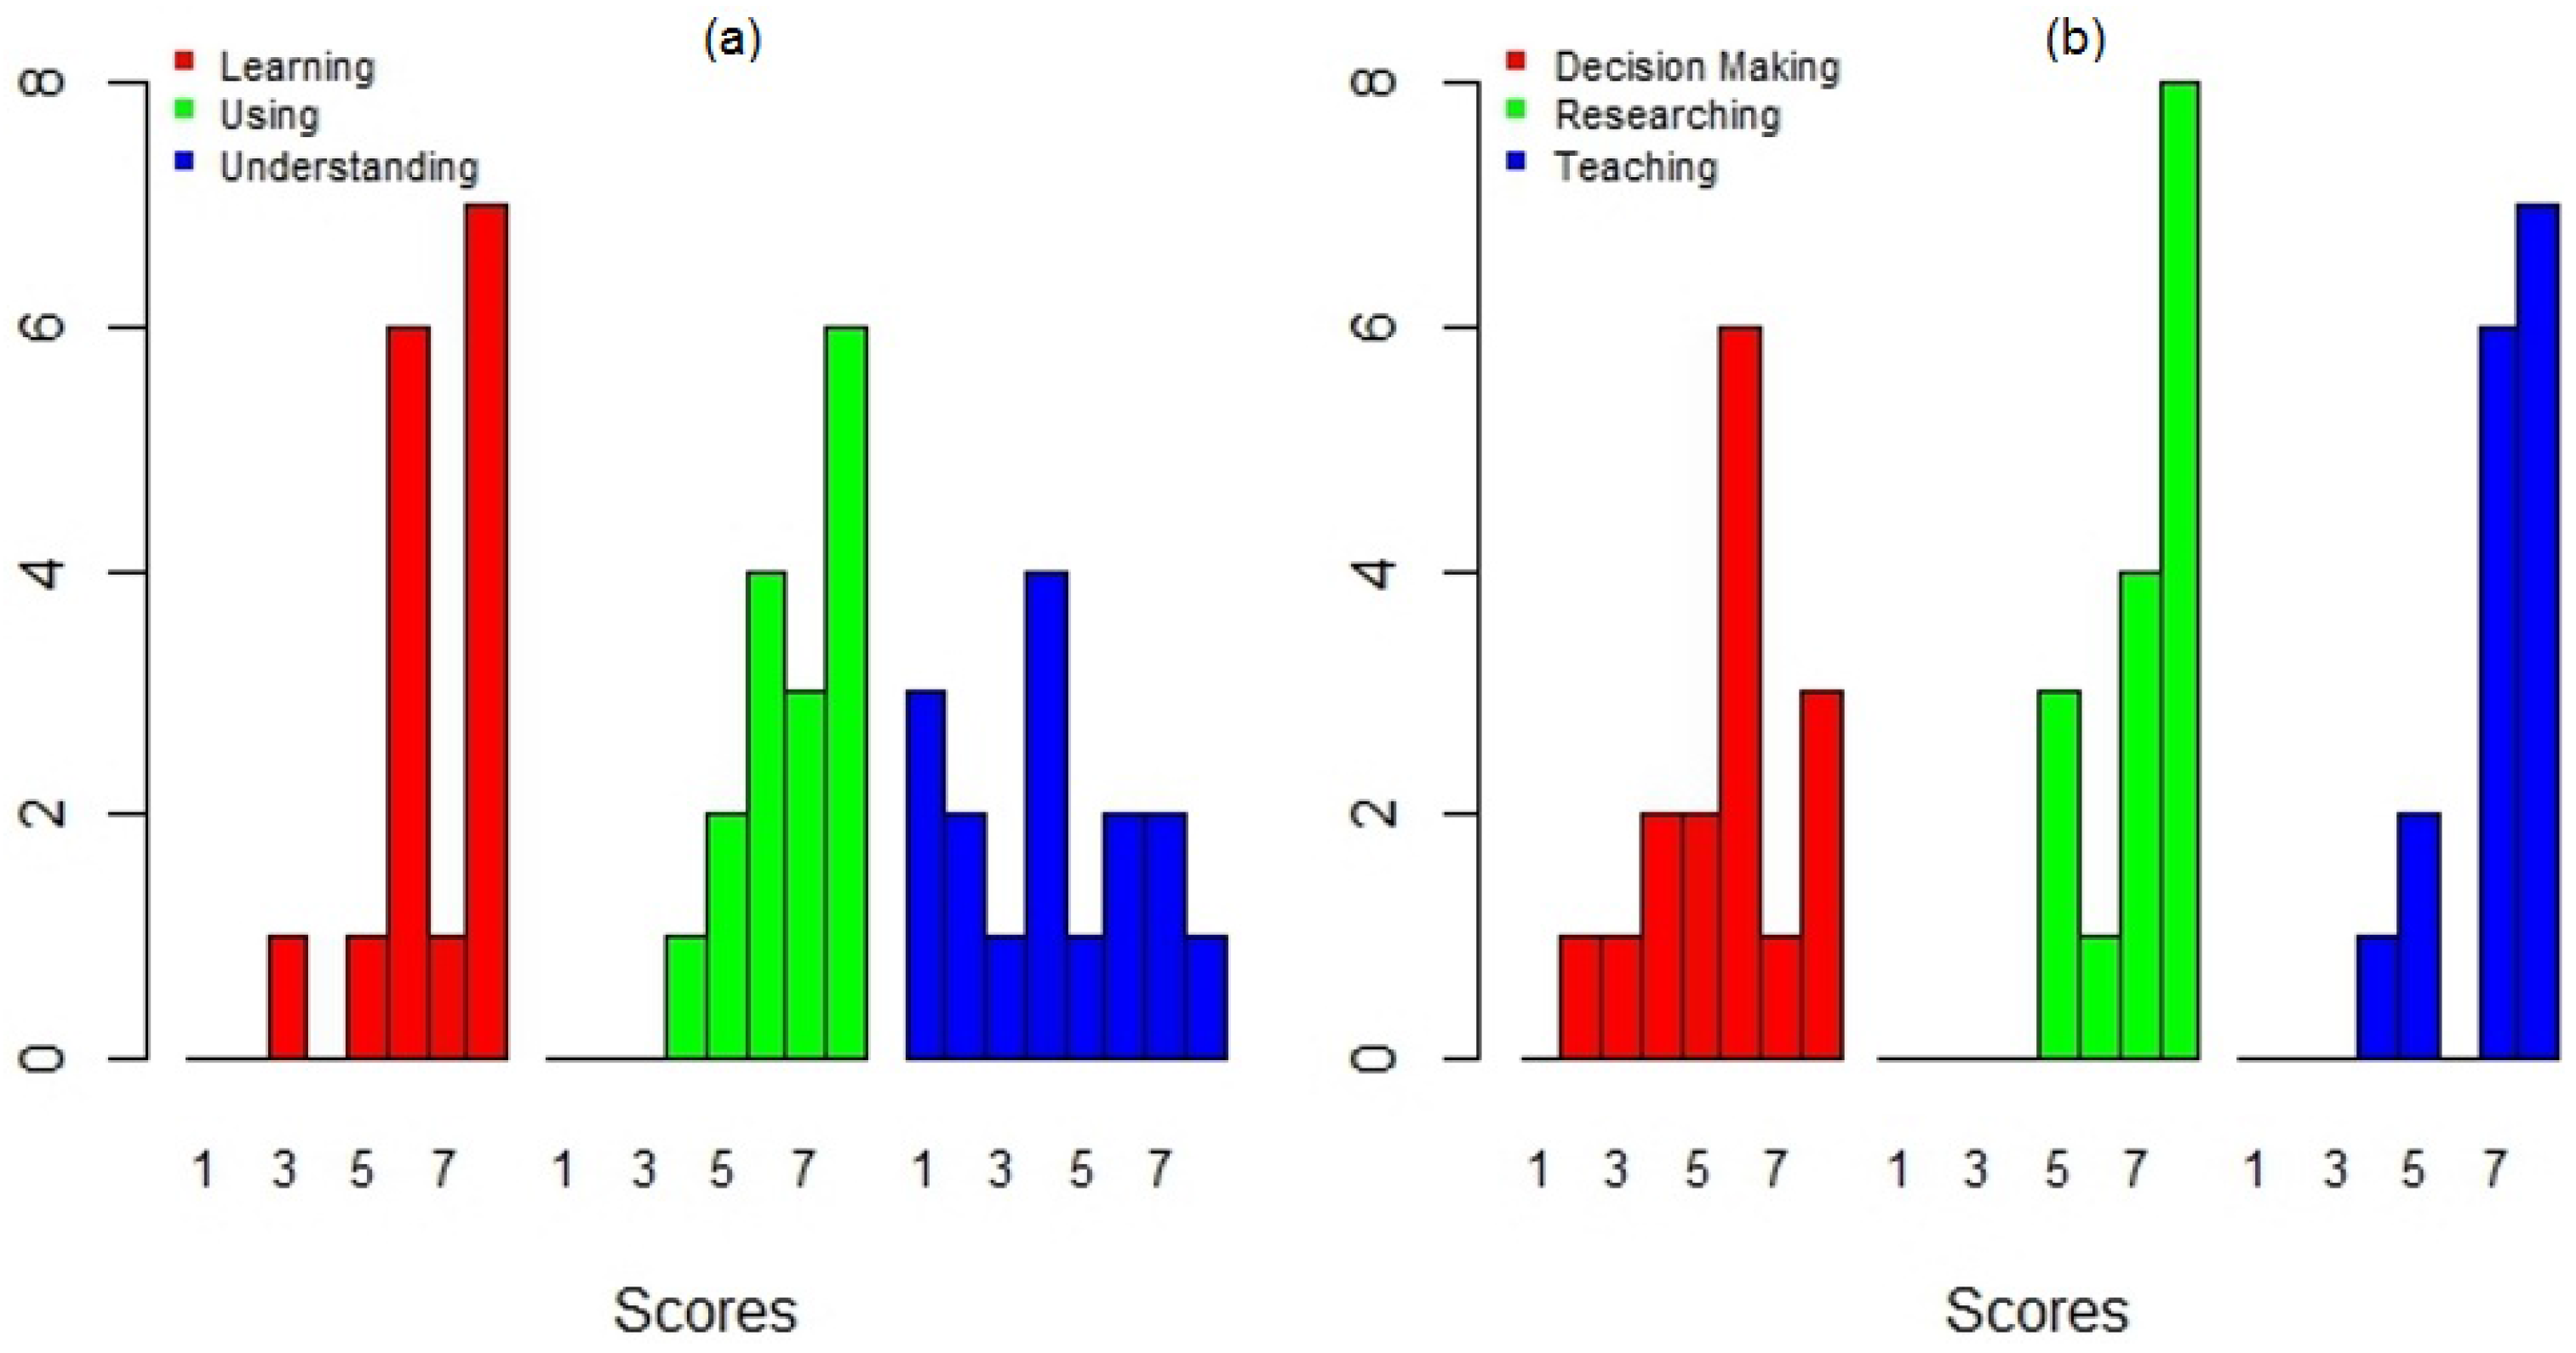
An important goal of this study was to identify the applicability and potential use of DengueME in various activities. A large fraction of the participants evaluated its applicability potential for supporting research and teaching positively (Figure 12b). Some participants even demonstrated an interest in using it in class and in collaborating on the creation of new models. The participants were more divided when asked about its application as a tool to support decision making (Figure 12b). This could be explained in part by the difficulties found while using the current version, regarding the available help information and the need for users to understand the models (Figure 12a). Further effort is required to make DengueME more accessible for non-expert users (e.g., health workers).

Figure 12.
User’s evaluation of the DengueME graphical interface: (a) support for learning, using and understanding dengue models; (b) applicability potential for supporting decision making, researching and teaching [63].
The issue of deciding the appropriate level of detail to consider in a model depends on its purpose [62]. Some simplifications were intentionally made in the models presented in this paper to illustrate the application of the framework. There is always a compromise involving the simplicity (or complexity) level chosen during the modeling process. When deciding what level of detail is appropriate, modelers should consider factors such as intentions, understandability, availability and quality of data, explanatory and analysis capabilities with acceptable confidence degrees, levels of uncertainty and error. For instance, the introduction of a large number of parameters and behaviors, aiming to obtain a high level of fidelity to reality, may cause a computational burden. Furthermore, it can induce implementation errors and divert the attention of modelers to computational aspects, rather than letting them focus on the model itself, as a simplified representation of reality. Complexity is not an unconditionally beneficial property of a model [62]. A model should contain sufficient complexity to explain a phenomenon, but no more [88]. With models, we are trying “to gain understanding of a complex real-world system via an understanding of simpler, hypothetical system that resembles it in relevant respects” [118]. Further discussions, including philosophical ones, can be found in [62,77,118,119,120,121,122,123].
Thereby, this work described the design, development and evaluation of the tool DengueME, which aims to support the study of spatiotemporal dynamics of dengue disease. Differences in modeling paradigms, spatiotemporal scales and parameters used in the models illustrate the extensibility and flexibility of the DengueME software architecture. The visual development environment for models and scenarios was positively evaluated by a group of experts on dengue and dengue modeling. The user evaluation experience provided rich feedback to outline the next steps for DengueME. These include improvements in the mechanism for model integration through XML files and enhancements in the extensibility and usability of the software architecture.
6. Conclusions
Despite the success of mathematical-computational models in explaining the spatiotemporal dynamics of vector ecology and dengue transmission, it is still necessary to promote further studies and encourage their use to support planning and decision making. Models should be used in the preliminary stages of a study, during the conceptual and design phases. The proper use of these models requires understanding model assumptions. However, such use should not require extensive experience in programming techniques or in model development. Currently, fast model reuse is still a challenge.
DengueME aims to provide resources to support and encourage the study of the spatiotemporal dynamics of dengue through modeling and simulation. Its user-friendly graphical interface allows users to create and customize scenarios from built-in models, and its extensible architecture permits adding new models. By comparing the outcomes of several models, users can better understand the capabilities and limitations of each one (and of their assumptions and underlying modeling paradigm) in their attempt to reproduce the dynamics and spatial patterns observed in dengue datasets. DengueME is a tool that can reach several types of users. Teenagers in schools could learn about the epidemiology of dengue using conceptual models, varying input parameters and analyzing the outcomes. Modelers might test, adapt, extend, integrate and compare different models and modeling approaches for dengue and its vectors. Teachers of undergraduate courses could use it as a pedagogical resource in classes from different areas, such as biology, math, epidemiology, physics and computer science. Decision makers might stimulate and promote debates about dengue dynamics and public health interventions for prevention and control.
There are many initiatives to make relevant data sources public, such as temperature and maps. However, the availability and accessibility of health data is still a challenge in Brazil [124] and worldwide [27]. Efforts that aim to use data from social networks [125], news, searches [126,127,128,129,130], crowdsourcing and volunteered geographic information [131] for modeling epidemics and health surveillance are interesting and show promising results. However, such data sources should be seen as complementary or confirmatory signals to be used in models and do not replace the need for reliable public data. The lack of reliable data imposes a great difficulty for building real-time (nowcasting) epidemic surveillance systems [132] and even more for predictive and descriptive models. Efforts should be made to promote the ease of access to data, education in modeling and simulation, methods and tools with user-friendly interfaces to support (re)using, building and integrating models. Disseminating the results of analyses and predictions among the general population is potentially a tool to engage citizens in prevention and control initiatives.
This work remains under development. Partial results were obtained, analyzed and positively evaluated, motivating its continuation. Future work includes: (i) developing features for evolving and maintaining the model library (e.g., use of standardized XML schemas for model integration as provided by OpenMI, customized generation of graphical interfaces for new models, web services for software updates); (ii) performing further framework usability evaluations with potential users; (iii) developing and adding new models into the framework, such as models that represent multiple serotypes; (iv) developing new case studies; and (v) providing tutorials and demo applications to support users. Finally, we intend to extend the framework to support the modeling and simulation of other arboviruses.
Acknowledgments
We kindly acknowledge the fruitful discussions with the DengueME Modeling Group, specially Raian V. Maretto, Leonardo B. L. Santos, Izabel C. Reis, Flávio C. Coelho, Antônio V. M. Monteiro and Leandro G. da Silva. This work was partially funded by Universidade Federal de Ouro Preto (UFOP), Fundação de Amparo à Pesquisa de Minas Gerais (FAPEMIG), Fundação de Amparo à Pesquisa do Rio de Janeiro (FAPERJ), Coordenação de Aperfeiçoamento de Pessoal de Nível Superior (CAPES), Brasil sem Miséria (BSM/CAPES) and Conselho Nacional de Desenvolvimento Científico e Tecnológico (CNPq).
Author Contributions
All authors contributed to the discussions and design of the framework. Tiago Lima, Gabriel Machado and Lucas Saraiva designed and developed the software architecture. Tiago Lima, Raquel Lana and Claudia Codeço implemented the SIR-SI model. Raquel Lana, Tiago Carneiro, Claudia Codeço and Tiago Lima conceived of and developed the vector model. Liliam Medeiros conceived and developed the epidemic model. Tiago Lima, Raquel Lana, Cláudia Codeço, Tiago Carneiro, Liliam Medeiros and Clodoveu Davis Jr. wrote the manuscript. All authors read and approved the final manuscript.
Conflicts of Interest
The authors declare no conflict of interest.
Abbreviations
The following abbreviations are used in this manuscript:
| CSV | Comma-Separated Values |
| DengueME | Dengue Modeling Environment |
| DengueME VDE | DengueME Visual Development Environment |
| GUI | Graphical User Interface |
| TerraME | Terra Modeling Environment |
| TerraML | Terra Modeling Language |
| XML | eXtensible Markup Language |
References
- Guzman, A.; Isturiz, R.E. Update on the global spread of dengue. Int. J. Antimicrob. Agents 2010, 36, S40–S42. [Google Scholar] [CrossRef] [PubMed]
- Brady, O.J.; Gething, P.W.; Bhatt, S.; Messina, J.P.; Brownstein, J.S.; Hoen, A.G.; Moyes, C.L.; Farlow, A.W.; Scott, T.W.; Hay, S.I. Refining the global spatial limits of dengue virus transmission by evidence-based consensus. PLoS Negl. Trop. Dis. 2012, 6, e1760. [Google Scholar] [CrossRef] [PubMed]
- Bhatt, S.; Gething, P.W.; Brady, O.J.; Messina, J.P.; Farlow, A.W.; Moyes, C.L.; Drake, J.M.; Brownstein, J.S.; Hoen, A.G.; Sankoh, O.; et al. The global distribution and burden of dengue. Nature 2013, 496, 504–507. [Google Scholar] [CrossRef] [PubMed]
- Simmons, C.P.; Farrar, J.J.; van Vinh, N.C.; Wills, B.; Nguyen, V.V.C. Dengue. N. Eng. J. Med. 2012, 366, 1423–1432. [Google Scholar] [CrossRef] [PubMed]
- Chikungunya. Available online: http://www.who.int/mediacentre/factsheets/fs327/en/ (accessed on 11 May 2016).
- One Year into the Zika Outbreak: How an Obscure Disease Became a Global Health Emergency. Available online: http://www.who.int/emergencies/zika-virus/articles/one-year-outbreak/en/ (accessed on 11 May 2016).
- Christophers, S.R. Aedes aegypti (L.) The Yellow Fever Mosquito: Its Lfe History, Bionomics, and Structure; Cambridge University Press: Cambridge, UK, 1960; p. 750. [Google Scholar]
- Kraemer, M.U.; Sinka, M.E.; Duda, K.A.; Mylne, A.Q.; Shearer, F.M.; Barker, C.M.; Moore, C.G.; Carvalho, R.G.; Coelho, G.E.; Van Bortel, W.; et al. The global distribution of the arbovirus vectors Aedes aegypti and Ae. albopictus. eLife 2015, 4, e08347. [Google Scholar] [CrossRef] [PubMed]
- Lambrechts, L.; Thomas, S.W.; Gubler, D.J. Consequences of the expanding global distribution of Aedes albopictus for dengue virus transmission. PLoS Negl. Trop. Dis. 2010, 4, e646. [Google Scholar] [CrossRef] [PubMed]
- Guzman, M.G.; Harris, E. Dengue. Lancet 2015, 385, 453–465. [Google Scholar] [CrossRef]
- Schaffner, F.; Mathis, A. Dengue and dengue vectors in the WHO European region: Past, present, and scenarios for the future. Lancet Infect. Dis. 2014, 14, 1271–1280. [Google Scholar] [CrossRef]
- Bouri, N.; Sell, T.K.; Franco, C.; Adalja, A.A. Return of epidemic dengue in the United States: Implications for the public health practitioner. Public Health Rep. 2012, 127, 259–266. [Google Scholar] [PubMed]
- Tatem, A.J.; Hay, S.I.; Rogers, D.J. Global traffic and disease vector dispersal. Proc. Natl. Acad. Sci. USA 2006, 103, 6242–6247. [Google Scholar] [CrossRef] [PubMed]
- Stoddard, S.T.; Forshey, B.M.; Morrison, A.; Paz-Soldan, V.A.; Vazquez-Prokopec, G.M.; Astete, H.; Reiner, R.C.; Vilcarromero, S.; Elder, J.P.; Halsey, E.S.; et al. House-to-house human movement drives dengue virus transmission. Proc. Natl. Acad. Sci. USA 2013, 110, 994–999. [Google Scholar] [CrossRef] [PubMed]
- Adams, B.; Kapan, D.D. Man bites mosquito: Understanding the contribution of human movement to vector-borne disease dynamics. PLoS ONE 2009, 4, e6763. [Google Scholar] [CrossRef] [PubMed]
- Codeco, C.T.; Lima, A.W.S.; Araujo, S.C.; Lima, J.B.P.; Maciel-de Freitas, R.; Honorio, N.A.; Galardo, A.K.R.; Braga, I.A.; Coelho, G.E.; Valle, D. Surveillance of Aedes aegypti: Comparison of house index with four alternative traps. PLoS Negl. Trop. Dis. 2015, 9, e0003475. [Google Scholar] [CrossRef] [PubMed]
- Beatty, M.E.; William, G.L.; Margolis, H.S. Estimating the global burden of dengue. Am. J. Trop. Med. Hyg. 2009, 81, 231. [Google Scholar]
- Van Kleef, E.; Bambrick, H.; Hales, S. The Geographic Distribution of Dengue Fever and the Potential Influence of Global Climate Change. Available online: http://journal.tropika.net/scielo.php?script=sciarttextpid=S2078-86062010005000001 (accessed on 6 September 2016).
- Hales, S.; de Wet, N.; Maindonald, J.; Woodward, A. Potential effect of population and climate changes on global distribution of dengue fever: An empirical model. Lancet 2002, 360, 830–834. [Google Scholar] [CrossRef]
- Rogers, D.J.; Wilson, A.J.; Hay, S.I.; Graham, A.J. The global distribution of yellow fever and dengue. Adv. Parasitol. 2006, 62, 181–220. [Google Scholar] [PubMed]
- Maciel-de Freitas, R.; Codeço, C.T.; Lourenço-de Oliveira, R. Daily survival rates and dispersal of Aedes aegypti females in Rio de Janeiro, Brazil. Am. J. Trop. Med. Hyg. 2007, 76, 659–665. [Google Scholar] [PubMed]
- Mohammed, A.; Chadee, D.D. Effects of different temperature regimens on the development of Aedes aegypti (L.) (Diptera: Culicidae) mosquitoes. Acta Trop. 2011, 119, 38–43. [Google Scholar] [CrossRef] [PubMed]
- Livdahl, T.P.; Edgerly, J.S. Egg hatching inhibition: Field evidence for population regulation in a tree hole mosquito. Ecol. Entomol. 1987, 12, 395–399. [Google Scholar] [CrossRef]
- Grech, M.G.; Sartor, P.D.; Almirón, W.R. Effects of different temperature regimens on the development of Aedes aegypti (L.) (Diptera: Culicidae) mosquitoes. Acta Trop. 2015, 146, 1–6. [Google Scholar] [CrossRef] [PubMed]
- World Health Organization. Atlas of Health and Climate; World Health Organization: Geneva, Switzerland, 2012; p. 68. [Google Scholar]
- Gubler, D.J. Dengue, urbanization and globalization: The unholy trinity of the 21(st) century. Trop. Med. Health 2011, 39, S3–S11. [Google Scholar] [CrossRef] [PubMed]
- Gubler, D.J. The many projected futures of dengue. Nat. Rev. Microbiol. 2015, 13, 230–239. [Google Scholar]
- Vong, S.; Khieu, V.; Glass, O.; Ly, S.; Duong, V.; Huy, R.; Ngan, C.; Wichmann, O.; Letson, G.W.; Margolis, H.S.; et al. Dengue incidence in urban and rural Cambodia: Results from population-based active fever surveillance, 2006–2008. PLoS Negl. Trop. Dis. 2010, 4, e903. [Google Scholar] [CrossRef] [PubMed]
- Gubler, D.J. Dengue and dengue hemorrhagic fever; its history and resurgence as a global public health problem. In Dengue and Dengue Hemorrhagic Fever; CAB International Press: Wallingford, UK, 1997; pp. 1–22. [Google Scholar]
- Sutherst, R.W. Global change and human vulnerability to vector-borne diseases. Clin. Microbiol. Rev. 2004, 17, 136–173. [Google Scholar] [CrossRef] [PubMed]
- Teixeira, T.R.; Medronho Rde, A. Socio-demographic factors and the dengue fever epidemic in 2002 in the State of Rio de Janeiro, Brazil. Cad. Saude Publica 2008, 24, 2160–2170. [Google Scholar] [CrossRef] [PubMed]
- Carbajo, A.E.; Cuto, S.I.; Schweigmann, N.J. Spatial distribution pattern of oviposition in the mosquito Aedes aegypti in relation to urbanization in Buenos Aires: Southern fringe bionomics of an introducted vector. Med. Vet. Entomol. 2006, 20, 209–218. [Google Scholar] [CrossRef] [PubMed]
- Lazcano, J.A.B.; Marquetti, M.C.; Portillo, R.; Rodríguez, M.M.; Suárez, S. Factores ecológicos asociados con la presencia de larvas de Aedes aegypti en zonas de alta infestación del municipio Playa, Ciudad de La Habana, Cuba. Rev. Panam. Salud Pública 2006, 19, 379–384. [Google Scholar] [CrossRef]
- Trpis, M.; Hausermann, W. Dispersal and other population parameters of Aedes aegypti in an African village and their possible significance in epidemiology of vector-borne diseases. Am. J. Trop. Med. Hyg. 1986, 35, 1263–1279. [Google Scholar] [PubMed]
- Harrington, L.C.; Scott, T.W.; Lerdthusnee, K.; Coleman, R.C.; Costero, A.; Clark, G.G.; Jones, J.J.; Kitthawee, S.; Kittayapong, P.; Sithiprasasna, R.; et al. Dispersal of the dengue vector Aedes aegypti within and between rural communities. Am. J. Trop. Med. Hyg. 2005, 72, 209–220. [Google Scholar] [PubMed]
- Smith, A.; Carter, I.D. International transportation of mosquitoes of public health importance. In Commerce and the Spread of Pests and Disease Vectors; Praeger Publishers Inc.: Santa Barbara, CA, USA, 1984; pp. 1–21. [Google Scholar]
- Murrell, S.; Wu, S.C.; Butler, M. Review of dengue virus and the development of a vaccine. Biotechnol. Adv. 2011, 29, 239–247. [Google Scholar] [CrossRef] [PubMed]
- Wan, S.; Lin, C.; Wang, S.; Chen, Y.; Yeh, T.; Liu, H.; Anderson, R.; Lin, Y. Current progress in dengue vaccines. J. Biomed. Sci. 2013, 20, 37. [Google Scholar] [CrossRef] [PubMed]
- Ganguly, A.; Malabadi, R.B.; Loebenberg, R.; Suresh, M.R.; Sunwoo, H.H. A mini-review of dengue vaccine development. Res. Pharm. 2015, 3, 18–25. [Google Scholar]
- Dengue Vaccine Research. Available online: http://www.who.int/immunization/research/development/denguevaccines/en/ (accessed on 8 July 2016).
- Vannice, K.; Durbin, A.; Hombach, J. Status of vaccine research and development of vaccines for dengue. Vaccine 2016, 34, 2934–2938. [Google Scholar] [CrossRef] [PubMed]
- Regis, L.N.; Acioli, R.V.; Silveira, J.C.J.; Melo-Santos, M.A.V.; Souza, W.V. Sustained reduction of the dengue vector population resulting from an integrated control strategy applied in two Brazilian cities. PLoS ONE 2013, 8, e67682. [Google Scholar] [CrossRef] [PubMed]
- Wise de Valdez, M.R.; Nimmo, D.; Betz, J.; Gong, H.F.; James, A.A.; Alphey, L.; Black, W.C. Genetic elimination of dengue vector mosquitoes. Proc. Natl. Acad. Sci. USA 2011, 108, 4772–4775. [Google Scholar] [CrossRef] [PubMed]
- Moreira, L.A.; Iturbe-Ormaetxe, I.; Jeffery, J.A.; Lu, G.; Pyke, A.T.; Hedges, L.M.; Rocha, B.C.; Hall-Mendelin, S.; Day, A.; Riegler, M.; et al. A Wolbachia symbiont in Aedes aegypti limits infection with dengue, Chikungunya, and Plasmodium. Cell 2009, 139, 1268–1278. [Google Scholar] [CrossRef] [PubMed]
- Hoffmann, A.A.; Montgomery, B.L.; Popovici, J.; Iturbe-Ormaetxe, I.; Johnson, P.H.; Muzzi, F.; Greenfield, M.; Durkan, M.; Leong, Y.S.; Dong, Y.; et al. Successful establishment of Wolbachia in Aedes populations to suppress dengue transmission. Nature 2011, 476, 454–457. [Google Scholar] [CrossRef] [PubMed]
- Cook, P.E.; McMeniman, C.J.; O’Neill, S.L. Modifying insect population age structure to control vector-borne disease. In Transgenesis and the Management of Vector-Borne Disease; Springer: Berlin, Germany, 2008; pp. 126–140. [Google Scholar]
- Walker, T.; Johnson, P.H.; Moreira, L.A.; Iturbe-Ormaetxe, I.; Frentiu, F.D.; McMeniman, C.J.; Leong, Y.S.; Dong, Y.; Axford, J.; Kriesner, P.; et al. The wMel Wolbachia strain blocks dengue and invades caged Aedes aegypti populations. Nature 2011, 476, 450–453. [Google Scholar] [CrossRef] [PubMed]
- Eisen, L.; Beaty, B.J.; Morrison, A.C.; Scott, T.W. ProactiveVector control strategies and improved monitoring and evaluation practices for dengue prevention. J. Med. Entomol. 2009, 46, 1245–1255. [Google Scholar] [CrossRef] [PubMed]
- Santos, L.B.L.; Costa, M.C.; Pinho, S.T.R.; Andrade, R.F.S.; Barreto, F.R.; Teixeira, M.G.; Barreto, M.L. Periodic forcing in a three-level cellular automata model for a vector-transmitted disease. Phys. Rev. E Stat. Nonlinear Soft Matter Phys. 2009, 80, 016102. [Google Scholar] [CrossRef] [PubMed]
- Pinho, S.T.R.; Ferreira, C.P.; Esteva, L.; Barreto, F.R.; Morato, V.C.S.; Teixeira, M.G.L. Modelling the dynamics of dengue real epidemics. Philos. Trans. A. Math. Phys. Eng. Sci. 2010, 368, 5679–5693. [Google Scholar] [CrossRef] [PubMed]
- de Castro Medeiros, L.C.; Castilho, C.A.R.; Braga, C.; de Souza, W.V.; Regis, L.; Monteiro, A.M.V. Modeling the dynamic transmission of dengue fever: Investigating disease persistence. PLoS Negl. Trop. Dis. 2011, 5, e942. [Google Scholar]
- Chen, S.C.; Hsieh, M.H. Modeling the transmission dynamics of dengue fever: Implications of temperature effects. Sci. Total Environ. 2012, 431, 385–391. [Google Scholar] [CrossRef] [PubMed]
- Yang, H.M.; Ferreira, C.P. Assessing the effects of vector control on dengue transmission. Appl. Math. Comput. 2008, 198, 401–413. [Google Scholar] [CrossRef]
- Otero, M.; Solari, H.G.; Schweigmann, N. A stochastic population dynamics model for Aedes aegypti: Formulation and application to a city with temperate climate. Bull. Math. Biol. 2006, 68, 1945–1974. [Google Scholar] [CrossRef] [PubMed]
- Otero, M.; Schweigmann, N.; Solari, H. A stochastic spatial dynamical model for Aedes aegypti. Bull. Math. Biol. 2008, 70, 1297–1325. [Google Scholar] [CrossRef] [PubMed]
- Lana, R.M.; Carneiro, T.G.S.; Honorio, N.A.; Codeco, C.T. Seasonal and nonseasonal dynamics of Aedes aegypti in Rio de Janeiro, Brazil: Fitting mathematical models to trap data. Acta Trop. 2014, 129, 25–32. [Google Scholar] [CrossRef] [PubMed]
- Ezanno, P.; Aubry-Kientz, M.; Arnoux, S.; Cailly, P.; L’Ambert, G.; Tran, A. A generic weather-driven model to predict mosquito population dynamics applied to species of Anopheles, Culex and Aedes genera of southern France. Prev. Vet. Med. 2015, 120, 39–50. [Google Scholar] [CrossRef] [PubMed]
- Campbell, L.P.; Luther, C.; Moo-Llanes, D.; Ramsey, J.M.; Danis-Lozano, R.; Peterson, A.T. Climate change influences on global distributions of dengue and chikungunya virus vectors. Philos. Trans. R. Soc. Lond. B Biol. Sci. 2015, 370, 20140135. [Google Scholar] [CrossRef] [PubMed]
- Simoy, M.I.; Simoy, M.V.; Canziani, G.A. The effect of temperature on the population dynamics of Aedes aegypti. Ecol. Model. 2015, 314, 100–110. [Google Scholar] [CrossRef]
- Focks, D.A.; Haile, D.G.; Daniels, E.; Mount, G.A. Dynamic life table model for Aedes aegypti (Diptera: Culicidae): Simulation results and validation. J. Med. Entomol. 1993, 30, 1018–1028. [Google Scholar] [CrossRef] [PubMed]
- Smith, D.L.; Battle, K.E.; Hay, S.I.; Barkr, C.M.; Scott, T.W.; McKenzie, F.E. Ross, macdonald, and a theory for the dynamics and control of mosquito-transmitted pathogens. PLoS Pathog. 2012, 129, 25–32. [Google Scholar] [CrossRef] [PubMed]
- Reiner, R.C.; Perkins, T.A.; Barker, C.M.; Niu, T.; Chaves, L.F.; Ellis, A.M.; Buckee, C.; George, D.B.; Le Menach, A.; Pulliam, J.R.C.; et al. A systematic review of mathematical models of mosquito-borne pathogen transmission: 1970–2010. J. R. Soc. Interface 2013, 10, 20120921. [Google Scholar] [CrossRef] [PubMed]
- Lima, T.; Carneiro, T.; Silva, L.; Lana, R.; Codeco, C.; Reis, I.; Maretto, R.; Santos, L.; Monteiro, A.; Medeiros, L.; et al. A framework for modeling and simulating Aedes aegypti and dengue fever dynamics. In Proceedings of the 2014 Winter Simulation Conference, Savannah, GA, USA, 7–10 December 2014; pp. 1481–1492.
- Padmanabha, H.; Correa, F.; Legros, M.; Nijhout, H.F.; Lord, C.; Lounibos, L.P. An eco-physiological model of the impact of temperature on Aedes aegypti life history traits. J. Insect. Physiol. 2012, 58, 1597–1608. [Google Scholar] [CrossRef] [PubMed]
- Smith, D.L.; Perkins, T.A.; Reiner, R.C.; Barker, C.M.; Niu, T.; Chaves, L.F.; Ellis, A.M.; George, D.B.; Le Menach, A.; Pulliam, J.R.C.; et al. Recasting the theory of mosquito-borne pathogen transmission dynamics and control. Trans. R. Soc. Trop. Med. Hyg. 2014, 108, 185–197. [Google Scholar] [CrossRef] [PubMed]
- Epstein, J.M. Why model? J. Artif. Soc. Soc. Simul. 2008, 11, 12. [Google Scholar]
- Homer, J.B.; Hirsch, G.B. System dynamics modeling for public health: background and opportunities. Am. J. Public Health 2006, 96, 452–458. [Google Scholar] [CrossRef] [PubMed]
- Auchincloss, A.H.; Roux, A.V.D. A new tool for epidemiology: The usefulness of dynamic-agent models in understanding place effects on health. Am. J. Epidemiol. 2008, 168, 1–8. [Google Scholar] [CrossRef] [PubMed]
- Keeling, M.J.; Eames, K.T. Networks and epidemic models. J. R. Soc. Interface 2005, 2, 295–307. [Google Scholar] [CrossRef] [PubMed]
- Luke, D.A.; Harris, J.K. Network analysis in public health: History, methods, and applications. Annu. Rev. Public Health 2007, 28, 69–93. [Google Scholar] [CrossRef] [PubMed]
- Massad, E.; Ma, S.; Chen, M.; Struchiner, C.J.; Stollenwerk, N.; Aguiar, M. Scale-free network of a dengue epidemic. Appl. Math. Comput. 2008, 195, 376–381. [Google Scholar] [CrossRef]
- Villabona-Arenas, C.J.; de Andrade Zanotto, P.M. Worldwide spread of Dengue virus type 1. PLoS ONE 2013, 8, e62649. [Google Scholar] [CrossRef] [PubMed]
- Knight, G.M.; Dharan, N.J.; Fox, G.J.; Stennis, N.; Zwerling, A.; Khurana, R.; Dowdy, D.W. Bridging the gap between evidence and policy for infectious diseases: How models can aid public health decision-making. Int. J. Infect. Dis. 2016, 42, 17–23. [Google Scholar] [CrossRef] [PubMed]
- Luke, D.A.; Stamatakis, K.A. Systems science methods in public health: Dynamics, networks, and agents. Annu. Rev. Public Health 2012, 33, 357–376. [Google Scholar] [CrossRef] [PubMed]
- Maglio, P.P.; Sepulveda, M.J.; Mabry, P.L. Mainstreaming modeling and simulation to accelerate public health innovation. Am. J. Public Health 2014, 104, 1181–1186. [Google Scholar] [CrossRef] [PubMed]
- Huang, S.M.; Abernethy, D.R.; Wang, Y.; Zhao, P.; Zineh, I. The utility of modeling and simulation in drug development and regulatory review. J. Pharm. Sci. 2013, 102, 2912–2923. [Google Scholar] [CrossRef] [PubMed]
- Basu, S.; Andrews, J. Complexity in mathematical models of public health policies: A guide for consumers of models. PLoS Med. 2013, 10, e1001540. [Google Scholar] [CrossRef] [PubMed]
- North, M.J.; Howe, T.R.; Collier, N.T.; Vos, J.R. The repast simphony development environment. In Proceedings of the Agent 2005 Conference on Generative Social Processes, Models, and Mechanisms, Chicago, IL, USA, October 2005; pp. 159–166.
- Lima, T.; Carneiro, T.; Faria, S.; Silva, P.; Pessoa, M. TerraME GIMS: An eclipse plug-in for environmental modeling. In Proceedings of the 3rd International Workshop on Developing Tools as Plug-Ins, San Francisco, CA, USA, 21 May 2013; pp. 37–42.
- Tisue, S.; Wilensky, U. Netlogo: A simple environment for modeling complexity. In Proceedings of the International Conference on Complex Systems, Boston, MA, USA, 16–21 May 2004; pp. 16–21.
- Muetzelfeldt, R.; Massheder, J. The Simile visual modelling environment. Eur. J. Agron. 2003, 18, 345–358. [Google Scholar] [CrossRef]
- Ford, D.A.; Kaufman, J.H.; Eiron, I. An extensible spatial and temporal epidemiological modelling system. Int. J. Health Geogr. 2006, 5, 4. [Google Scholar] [CrossRef] [PubMed]
- Balcan, D.; Gonçalves, B.; Hu, H.; Ramasco, J.J.; Colizza, V.; Vespignani, A. Modeling the spatial spread of infectious diseases: The GLobal Epidemic and Mobility computational model. Nat. Rev. Microbiol. 2010, 1, 132–145. [Google Scholar] [CrossRef] [PubMed]
- Hladish, T.; Melamud, E.; Barrera, L.A.; Galvani, A.; Meyers, L.A. EpiFire: An open source C++ library and application for contact network epidemiology. BMC Bioinform. 2012, 13, 76. [Google Scholar] [CrossRef] [PubMed]
- Malaria Tools. Available online: https://www1.imperial.ac.uk/malariamodelling/toolsdata/tools/ (accessed on 10 May 2016).
- Lana, R.M.; Carneiro, T.G.S.; Honório, N.A.; Codeço, C.T. Multiscale analysis and modelling of Aedes aegyti population spatial dynamics. J. Inf. Data Manag. 2011, 2, 211. [Google Scholar]
- Carneiro, T.G.S.; Andrade, P.R.; Câmara, G.; Monteiro, A.M.V.; Pereira, R.R. An extensible toolbox for modeling nature—Society interactions. Environ. Model. Softw. 2013, 46, 104–117. [Google Scholar] [CrossRef]
- Wainwright, J.; Mulligan, M. Modelling and model building. In Environmental Modelling: Finding Simplicity in Complexity; John Wiley & Sons: Hoboken, NJ, USA, 2005; pp. 7–73. [Google Scholar]
- Jakeman, A.J.; Letcher, R.A.; Norton, J.P. Ten iterative steps in development and evaluation of environmental models. Environ. Model. Softw. 2006, 21, 602–614. [Google Scholar] [CrossRef]
- Voinov, A.; Bousquet, F. Modelling with stakeholders. Environ. Model. Softw. 2010, 25, 1268–1281. [Google Scholar] [CrossRef]
- Krueger, T.; Page, T.; Hubacek, K.; Smith, L.; Hiscock, K. The role of expert opinion in environmental modelling. Environ. Model. Softw. 2012, 36, 4–18. [Google Scholar] [CrossRef]
- Crout, N.; Kokkonen, T.; Jakeman, A.; Norton, J.; Newham, L.; Anderson, R.; Assaf, H.; Croke, B.; Gaber, N.; Gibbons, J.; et al. Chapter two good modelling practice. Dev. Integr. Environ. Assess. 2008, 3, 15–31. [Google Scholar]
- Holzworth, D.P.; Huth, N.I.; de Voil, P.G. Simple software processes and tests improve the reliability and usefulness of a model. Environ. Model. Softw. 2011, 26, 510–516. [Google Scholar] [CrossRef]
- Turner, M.G.; Gardner, R.H. Introduction to models. In Landscape Ecology in Theory and Practice; Springer: Berlin, Germany, 2001; Volume 401, pp. 47–69. [Google Scholar]
- Lima, T.; Faria, S.; Carneiro, T. Development of a didactic model of the hydrologic cycle using the terrame graphical interface for modeling and simulation. In Computational Science and Its Applications—ICCSA; Springer: Berlin, Germany, 2011; pp. 75–90. [Google Scholar]
- Reich, N.G.; Shrestha, S.; King, A.A.; Rohani, P.; Lessler, J.; Kalayanarooj, S.; Yoon, I.K.; Gibbons, R.V.; Burke, D.S.; Cummings, D.A. Interactions between serotypes of dengue highlight epidemiological impact of cross-immunity. J. R. Soc. Interface 2013, 10, 20130414. [Google Scholar] [CrossRef] [PubMed]
- Chikaki, E.; Ishikawa, H. A dengue transmission model in Thailand considering sequential infections with all four serotypes. J. Infect. Dev. Cories. 2009, 3, 711–722. [Google Scholar] [CrossRef]
- Coudeville, L.; Garnett, G.P. Transmission dynamics of the four dengue serotypes in southern Vietnam and the potential impact of vaccination. PLoS ONE 2012, 7, e51244. [Google Scholar] [CrossRef] [PubMed]
- Wearing, H.J.; Rohani, P. Ecological and immunological determinants of dengue epidemics. Proc. Natl. Acad. Sci. USA 2006, 103, 11802–11807. [Google Scholar] [CrossRef] [PubMed]
- Adams, B.; Boots, M. Modelling the relationship between antibody-dependent enhancement and immunological distance with application to dengue. J. Theor. Biol. 2006, 242, 337–346. [Google Scholar] [CrossRef] [PubMed]
- Lourenço, J.; Recker, M. Natural, persistent oscillations in a spatial multi-strain disease system with application to dengue. PLoS Comput. Biol. 2013, 9, e1003308. [Google Scholar]
- Lourenço, J.; Recker, M. Dengue serotype immune-interactions and their consequences for vaccine impact predictions. Epidemics 2016, 16, 40–48. [Google Scholar] [CrossRef]
- Chao, D.L.; Longini, I.M., Jr.; Halloran, M.E. The effects of vector movement and distribution in a mathematical model of dengue transmission. PLoS ONE 2013, 8, e76044. [Google Scholar] [CrossRef] [PubMed]
- Wesolowski, A.; Qureshi, T.; Boni, M.F.; Sundsøy, P.R.; Johansson, M.A.; Rasheed, S.B.; Engø-Monsen, K.; Buckee, C.O. Impact of human mobility on the emergence of dengue epidemics in Pakistan. Proc. Natl. Acad. Sci. USA 2015, 112, 11887–11892. [Google Scholar] [CrossRef] [PubMed]
- dos Reis, I.C. Caracterização de Paisagens Urbanas Heterogêneas de Interesse Para a Vigilância e Controle da Dengue Com o Uso de Sensoriamento Remoto e Mineração de Padrões Espaciais: Um Estudo Para o Rio de Janeiro; Instituto Nacional de Pesquisas Espaciais: São José dos Campos, Brazil, 2010. [Google Scholar]
- Nishiura, H. Mathematical and statistical analyses of the spread of dengue. Dengue Bull. 2006, 30, 51–67. [Google Scholar]
- R Core Team. R: A Language and Environment for Statistical Computing; R Foundation for Statistical Computing: Vienna, Austria, 2016. [Google Scholar]
- Morin, C.W.; Monaghan, A.J.; Hayden, M.H.; Barrera, R.; Ernst, K. Meteorologically driven simulations of dengue epidemics in San Juan, PR. PLoS Negl. Trop. Dis. 2015, 9, e0004002. [Google Scholar] [CrossRef] [PubMed]
- Erickson, R.A.; Presley, S.M.; Allen, L.J.; Long, K.R.; Cox, S.B. A dengue model with a dynamic Aedes albopictus vector population. Ecol. Model. 2010, 221, 2899–2908. [Google Scholar] [CrossRef]
- Andraud, M.; Hens, N.; Marais, C.; Beutels, P. Dynamic epidemiological models for dengue transmission: A systematic review of structural approaches. PLoS ONE 2012, 7, e49085. [Google Scholar] [CrossRef] [PubMed]
- Luz, P.M.; Codeço, C.T.; Medlock, J.; Struchiner, C.J.; Valle, D.; Galvani, A.P. Impact of insecticide interventions on the abundance and resistance profile of Aedes aegypti. Epidemiol. Infect. 2009, 137, 1203. [Google Scholar] [CrossRef] [PubMed]
- Rico-Hesse, R. Dengue virus virulence and transmission determinants. In Dengue Virus; Springer: Berlin, Germany, 2010; pp. 45–55. [Google Scholar]
- Johansson, M.A.; Hombach, J.; Cummings, D.A.T. Models of the impact of dengue vaccines: A review of current research and potential approaches. Vaccine 2011, 29, 5860–5868. [Google Scholar] [CrossRef] [PubMed]
- Stephens, D.S.; Ahmed, R.; Orenstein, W.A. Vaccines at what price? Vaccine 2014, 32, 1029–1030. [Google Scholar] [CrossRef] [PubMed]
- Rodriguez-Barraquer, I.; Mier-y Teran-Romero, L.; Schwartz, I.B.; Burke, D.S.; Cummings, D.A.T. Potential opportunities and perils of imperfect dengue vaccines. Vaccine 2014, 32, 514–520. [Google Scholar] [CrossRef] [PubMed]
- Rodrigues, H.S.; Monteiro, M.T.T.; Torres, D.F.M. Vaccination models and optimal control strategies to dengue. Math. Biosci. 2014, 247, 1–12. [Google Scholar] [CrossRef] [PubMed]
- Carvalho, S.A.; da Silva, S.O.; Charret, I.D.C. Mathematical Modeling of Dengue Epidemic: Control Methods and Vaccination Strategies, 2015. Available online: https://arxiv.org/abs/1508.00961 (accessed on 10 May 2016).
- Godfrey-Smith, P. The strategy of model-based science. Biol. Philos. 2006, 21, 725–740. [Google Scholar] [CrossRef]
- Levins, R. The strategy of model building in population biology. Am. Sci. 1966, 54, 421–431. [Google Scholar]
- Odenbaugh, J. Complex systems, trade-offs, and theoretical population biology: Richard Levin’s “Strategy of model building in population biology” revisited. Philos. Sci. 2003, 70, 1496–1507. [Google Scholar] [CrossRef]
- Weisberg, M. Forty years of ‘‘The strategy’’: Levins on model building and idealization. Biol. Philos. 2006, 21, 623–645. [Google Scholar] [CrossRef]
- Orzack, S.H. Discussion: What, if anything, is “the strategy of model building in population biology?” A comment on Levins (1966) and Odenbaugh (2003). Philos. Sci. 2005, 72, 479–485. [Google Scholar] [CrossRef]
- Odenbaugh, J. The strategy of “The strategy of model building in population biology”. Biol. Philos. 2006, 21, 607–621. [Google Scholar] [CrossRef]
- Coelho, F.C.; Codeço, C.T.; Cruz, O.G.; Camargo, S.; Bliman, P.A. Epidemiological data accessibility in Brazil. Lancet Infect. Dis. 2016, 16, 524525. [Google Scholar] [CrossRef]
- Gomide, J.; Veloso, A.; Meira, W., Jr.; Almeida, V.; Benevenuto, F.; Ferraz, F.; Teixeira, M. Dengue surveillance based on a computational model of spatio-temporal locality of Twitter. In Proceedings of the ACM 3rd International Web Science Conference, Koblenz, Germany, 15–17 June 2011; p. 3.
- Ginsberg, J.; Mohebbi, M.H.; Patel, R.S.; Brammer, L.; Smolinski, M.S.; Brilliant, L. Detecting influenza epidemics using search engine query data. Nature 2009, 457, 1012–1014. [Google Scholar] [CrossRef] [PubMed]
- Chan, E.H.; Sahai, V.; Conrad, C.; Brownstein, J.S. Using web search query data to monitor dengue epidemics: A new model for neglected tropical disease surveillance. PLoS Negl. Trop. Dis. 2011, 5, e1206. [Google Scholar] [CrossRef] [PubMed]
- Althouse, B.M.; Ng, Y.Y.; Cummings, D. Prediction of dengue incidence using search query surveillance. PLoS Negl. Trop. Dis. 2011, 5, e1258. [Google Scholar] [CrossRef] [PubMed]
- Madoff, L.C.; Fisman, D.N.; Kass-Hout, T. A new approach to monitoring dengue activity. PLoS Negl. Trop. Dis. 2011, 5, e1215. [Google Scholar] [CrossRef] [PubMed]
- Gluskin, R.T.; Johansson, M.A.; Santillana, M.; Brownstein, J.S. Evaluation of Internet-based dengue query data: Google Dengue Trends. PLoS Negl. Trop. Dis. 2014, 8, e2713. [Google Scholar] [CrossRef] [PubMed]
- Goodchild, M.F. Citizens as sensors: The world of volunteered geography. GeoJournal 2007, 69, 211–221. [Google Scholar] [CrossRef]
- Codeco, C.; Cruz, O.; Riback, T.I.; Degener, C.M.; Gomes, M.F.; Villela, D.; Bastos, L.; Camargo, S.; Saraceni, V.; Lemos, M.C.F.; et al. InfoDengue: A Nowcasting System for the Surveillance of Dengue Fever Transmission, 2016. Available online: http://biorxiv.org/content/early/2016/03/29/046193 (accessed on 11 May 2016).


© 2016 by the authors; licensee MDPI, Basel, Switzerland. This article is an open access article distributed under the terms and conditions of the Creative Commons Attribution (CC-BY) license (http://creativecommons.org/licenses/by/4.0/).