
Appropriate LDL-C-to-HDL-C Ratio Cutoffs for Categorization of Cardiovascular Disease Risk Factors among Uygur Adults in Xinjiang, China

Abstract
:1. Introduction
2. Methods
2.1. Study Design and Subject Recruitment
2.2. Baseline Examination and Laboratory Tests
2.3. Definition of Risk Factors
2.4. Statistical Analysis
3. Results
3.1. Age-Standardized CVD Risk Factors in Uygur by LDL-C/HDL-C Ratio Category
3.2. Prevalence of Risk Factors in Uygur by LDL-C/HDL-C Ratio Category
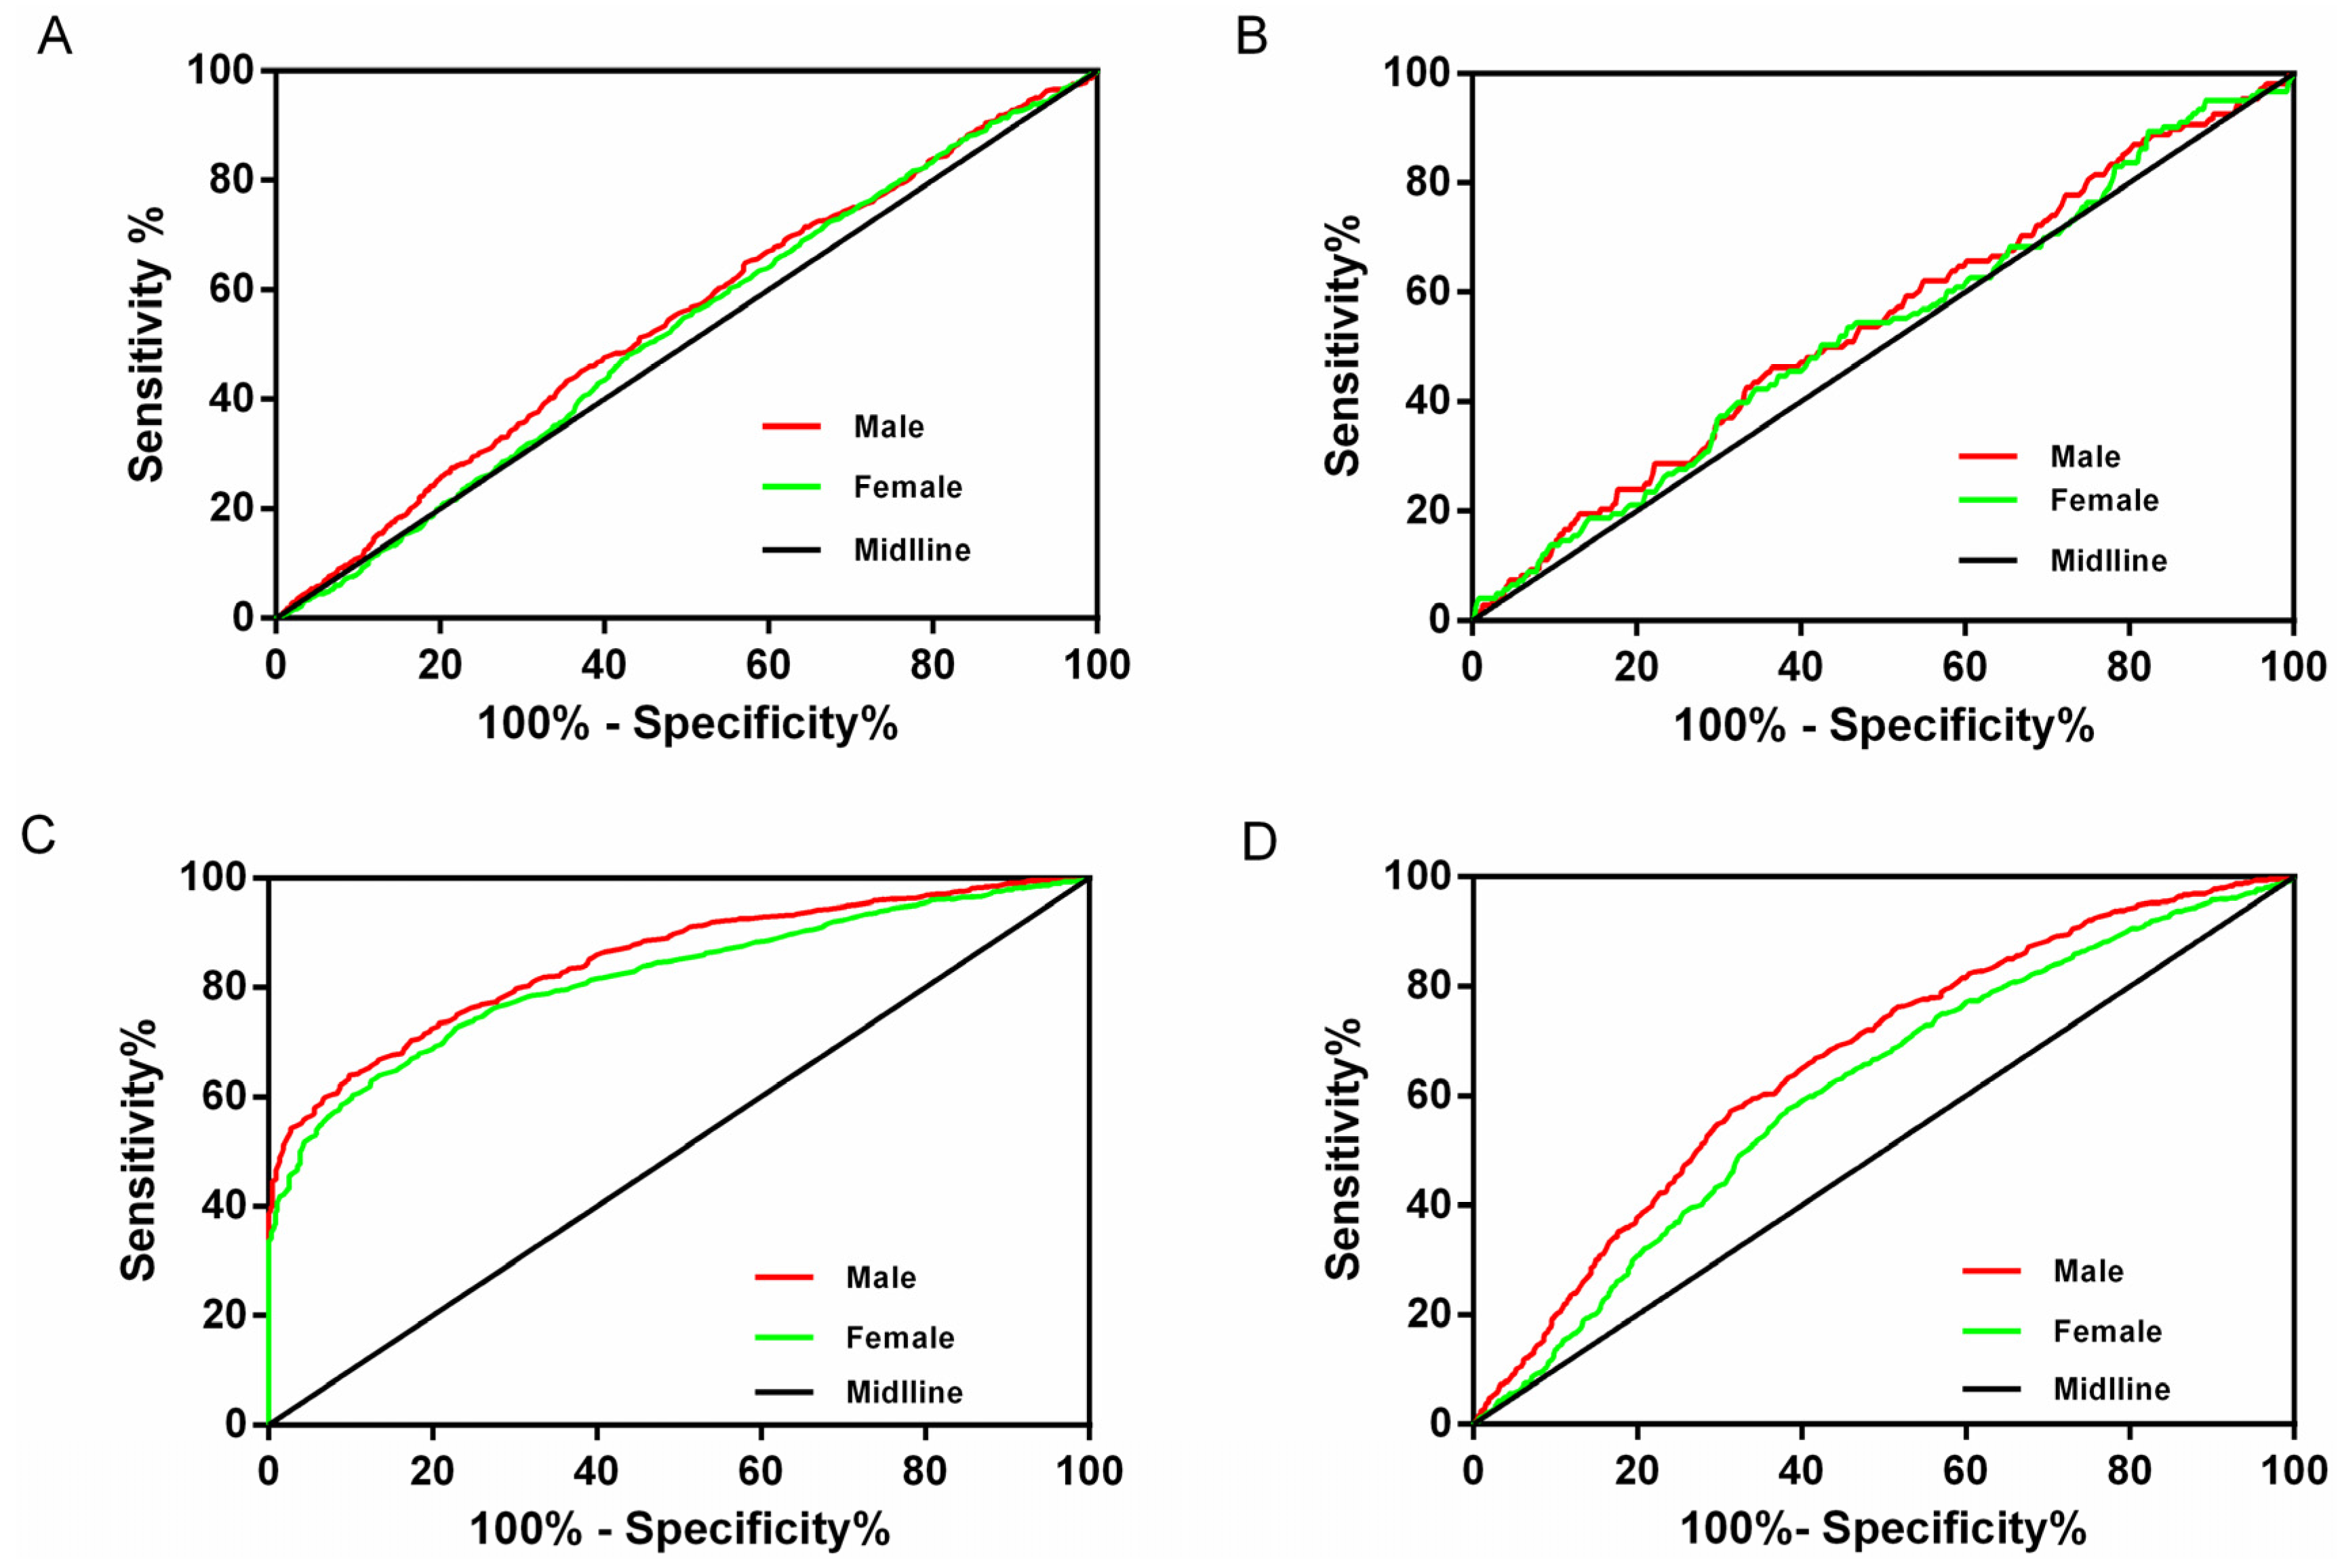
3.3. Sensitivity, Specificity, and Distance in the Receiver Operating Characteristic (ROC) Curve for LDL-C/HDL-C Ratio Cutoff Points in Uygur
4. Discussion
5. Conclusions
Acknowledgments
Author Contributions
Conflicts of Interest
References
- Schaiff, R.A.; Moe, R.M.; Krichbaum, D.W. An overview of cholesterol management. Am. Health Drug Benefits 2008, 1, 39–48. [Google Scholar] [PubMed]
- Zuccala, A. Guidelines for management of hypertension: Why doesn’t evidence lead to unanimity? G. Ital. Nefrol. 2009, 26, 226–235. [Google Scholar] [PubMed]
- Xie, X.; Ma, Y.T.; Yang, Y.N.; Fu, Z.Y.; Li, X.M.; Huang, D.; Ma, X.; Chen, B.D.; Liu, F. Polymorphisms in the SAA1/2 gene are associated with carotid intima media thickness in healthy han chinese subjects: The cardiovascular risk survey. PLoS ONE 2010, 5, e13997. [Google Scholar] [CrossRef] [PubMed]
- Joint Committee for Developing Chinese guidelines on Prevention and Treatment of Dyslipidemia in Adults. Chinese guidelines on prevention and treatment of dyslipidemia in adults. Zhonghua Xin Xue Guan Bing Za Zhi 2007, 35, 390–419. [Google Scholar]
- Johnston, N.; Jernberg, T.; Lagerqvist, B.; Siegbahn, A.; Wallentin, L. Improved identification of patients with coronary artery disease by the use of new lipid and lipoprotein biomarkers. Am. J. Cardiol. 2006, 97, 640–645. [Google Scholar] [CrossRef] [PubMed]
- Lippi, U.; Cappelletti, P.; Signori, D.; Burelli, C. Clinical chemical indexes and severity of coronary atherosclerosis. Clin. Chim. Acta 1983, 130, 283–289. [Google Scholar] [CrossRef]
- Katakami, N.; Kaneto, H.; Osonoi, T.; Saitou, M.; Takahara, M.; Sakamoto, F.; Yamamoto, K.; Yasuda, T.; Matsuoka, T.A.; Matsuhisa, M.; et al. Usefulness of lipoprotein ratios in assessing carotid atherosclerosis in japanese type 2 diabetic patients. Atherosclerosis 2011, 214, 442–447. [Google Scholar] [PubMed]
- Nicholls, S.J.; Tuzcu, E.M.; Sipahi, I.; Grasso, A.W.; Schoenhagen, P.; Hu, T.; Wolski, K.; Crowe, T.; Desai, M.Y.; Hazen, S.L.; et al. Statins, high-density lipoprotein cholesterol, and regression of coronary atherosclerosis. JAMA 2007, 297, 499–508. [Google Scholar] [PubMed]
- Millan, J.; Pinto, X.; Munoz, A.; Zuniga, M.; Rubies-Prat, J.; Pallardo, L.F.; Masana, L.; Mangas, A.; Hernandez-Mijares, A.; Gonzalez-Santos, P.; et al. Lipoprotein ratios: Physiological significance and clinical usefulness in cardiovascular prevention. Vasc. Health Risk Manag. 2009, 5, 757–765. [Google Scholar] [PubMed]
- Orchard, T.J.; Temprosa, M.; Goldberg, R.; Haffner, S.; Ratner, R.; Marcovina, S.; Fowler, S.; Diabetes Prevention Program Research Group. The effect of metformin and intensive lifestyle intervention on the metabolic syndrome: The diabetes prevention program randomized trial. Ann. Intern. Med. 2005, 142, 611–619. [Google Scholar] [PubMed]
- Goldberg, R.B.; Mather, K. Targeting the consequences of the metabolic syndrome in the diabetes prevention program. Arterioscler. Thromb. Vasc. Biol. 2012, 32, 2077–2090. [Google Scholar] [CrossRef] [PubMed]
- Grundy, S.M.; Cleeman, J.I.; Daniels, S.R.; Donato, K.A.; Eckel, R.H.; Franklin, B.A.; Gordon, D.J.; Krauss, R.M.; Savage, P.J.; Smith, S.C., Jr.; et al. Diagnosis and management of the metabolic syndrome: An american heart association/national heart, lung, and blood institute scientific statement. Circulation 2005, 112, 2735–2752. [Google Scholar] [PubMed]
- NHLBI Obesity Education Initiative Expert Panel on the Identification, Evaluation; Treatment of Obesity in Adults (US). Clinical guidelines on the identification, evaluation, and treatment of overweight and obesity in adults—The evidence report. National institutes of health. Obes. Res. 1998, 6 (Suppl. 2), 51S–209S. [Google Scholar] [PubMed]
- Klipsic, D.; Landrock, D.; Martin, G.G.; McIntosh, A.L.; Landrock, K.K.; Mackie, J.T.; Schroeder, F.; Kier, A.B. Impact of Scp-2/Scp-x gene ablation and dietary cholesterol on hepatic lipid accumulation. Am. J. Physiol. Gastrointest. Liver Physiol. 2015, 309, G387–G399. [Google Scholar] [CrossRef] [PubMed]
- Fan, W.; Shen, C.; Wu, M.; Zhou, Z.Y.; Guo, Z.R. Association and interaction of pparalpha, delta, and gamma gene polymorphisms with low-density lipoprotein-cholesterol in a chinese han population. Genet. Test. Mol. Biomark. 2015, 19, 379–386. [Google Scholar] [CrossRef] [PubMed]
- Lai, H.M.; Li, X.M.; Yang, Y.N.; Ma, Y.T.; Xu, R.; Pan, S.; Zhai, H.; Chen, B.D.; Zhao, Q. Genetic variation in NFKB1 and NFKBIA and susceptibility to coronary artery disease in a Chinese Uygur population. PLoS ONE 2015, 10, e0129144. [Google Scholar] [CrossRef] [PubMed]
- Xie, X.; Ma, Y.T.; Yang, Y.N.; Fu, Z.Y.; Li, X.M.; Zheng, Y.Y.; Huang, D.; Ma, X.; Chen, B.D.; Liu, F. Polymorphisms in the SAA1 gene are associated with ankle-to-brachial index in han chinese healthy subjects. Blood Press. 2011, 20, 232–238. [Google Scholar] [CrossRef] [PubMed]
- Bosse, Y.; Perusse, L.; Vohl, M.C. Genetics of ldl particle heterogeneity: From genetic epidemiology to DNA-based variations. J. Lipid Res. 2004, 45, 1008–1026. [Google Scholar] [CrossRef] [PubMed]
- Hishida, A.; Wakai, K.; Naito, M.; Suma, S.; Sasakabe, T.; Hamajima, N.; Hosono, S.; Horita, M.; Turin, T.C.; Suzuki, S.; et al. Polymorphisms of genes involved in lipid metabolism and risk of chronic kidney disease in japanese—Cross-sectional data from the j-micc study. Lipids Health Disease 2014, 13, 162. [Google Scholar] [CrossRef]
- National Institutes of Health. Third Report of the National Cholesterol Education Program (Ncep) Expert Panel on Detection, Evaluation, and Treatment of High Blood Cholesterol in Adults (Adult Treatment Panel III). Available online: http://www.nhlbi.nih.gov/sites/www.nhlbi.nih.gov/files/Circulation-2002-ATP-III-Final-Report-PDF-3143.pdf (accessed on 17 February 2016).
- Krauss, R.M. Dietary and genetic probes of atherogenic dyslipidemia. Arterioscler. Thromb. Vasc. Biol. 2005, 25, 2265–2272. [Google Scholar] [CrossRef] [PubMed]

| Sex/Age | 35–39 | 40–44 | 45–49 | 50–54 | 55–59 | 60–64 | 65–69 | 70–74 | 75–79 | 80–84 | 85–89 | Total |
|---|---|---|---|---|---|---|---|---|---|---|---|---|
| Years | Years | Years | Years | Years | Years | Years | Years | Years | Years | Years | ||
| Men | 187 | 257 | 229 | 236 | 226 | 236 | 168 | 115 | 51 | 19 | 19 | 1743 |
| Women | 368 | 399 | 369 | 333 | 284 | 251 | 180 | 69 | 27 | 18 | 6 | 2304 |
| LHR < 1.5 | 1.5 ≤ LHR < 2 | 2 ≤ LHR < 2.5 | 2.5 ≤ LHR < 3 | 3 ≤ LHR < 3.5 | 3.5 ≤ LHR < 4 | 4 ≤ LHR < 4.5 | 4.5 ≤ LHR < 5 | LHR ≥ 5 | p Value | |
|---|---|---|---|---|---|---|---|---|---|---|
| Men | ||||||||||
| Population distribution (%) | 214 (11.4%) | 378 (20.2%) | 441 (23.5%) | 361 (19.3%) | 233 (12.4%) | 139 (7.4%) | 61 (3.3%) | 36 (1.9%) | 12 (0.6%) | |
| Systolic blood pressure (mmHg) | 132.29 ± 20.04 | 131.18 ± 19.04 | 131.47 ± 19.34 | 132.09 ± 21.13 | 129.70 ± 17.68 | 132.57 ± 18.78 | 126.07 ± 16.27 | 133.37 ± 24.53 | 139.33 ± 29.58 | 0.285 |
| Diastolic blood pressure (mmHg) | 81.57 ± 14.36 | 80.54 ± 14.35 | 79.84 ± 13.84 | 81.27 ± 15.07 | 79.48 ± 14.19 | 81.89 ± 14.63 | 76.82 ± 13.10 | 78.91 ± 17.47 | 81.75 ± 23.40 | 0.29 |
| Total cholesterol (mmol/L) | 4.21 ± 1.03 | 4.34 ± 1.03 | 4.27 ± 1.10 | 4.25 ± 1.06 | 4.38 ± 1.11 | 4.42 ± 1.03 | 4.20 ± 0.97 | 4.25 ± 1.25 | 3.99 ± 0.96 | 0.44 |
| HDL-C cholesterol (mmol/L) | 1.63 ± 0.45 | 1.43 ± 0.38 | 1.26 ± 0.32 | 1.20 ± 0.30 | 1.06 ± 0.27 | 0.97 ± 0.26 | 0.87 ± 0.25 | 0.81 ± 0.27 | 0.62 ± 0.21 | <0.001 |
| LDL-C cholesterol (mmol/L) | 2.05 ± 0.57 | 2.47 ± 0.64 | 2.78 ± 0.72 | 3.18 ± 0.78 | 3.35 ± 0.84 | 3.57 ± 0.97 | 3.58 ± 0.98 | 3.70 ± 1.26 | 3.16 ± 1.03 | <0.001 |
| Triglycerides (mmol/L) | 1.60 ± 1.26 | 1.66 ± 1.25 | 1.58 ± 1.08 | 1.62 ± 1.23 | 1.54 ± 0.92 | 1.83 ± 1.59 | 1.69 ± 1.09 | 2.09 ± 3.14 | 1.89 ± 0.79 | 0.22 |
| Fasting glucose (mmol/L) | 4.91 ± 1.80 | 4.92 ± 1.71 | 4.81 ± 1.52 | 4.93 ± 1.98 | 4.79 ± 1.18 | 5.02 ± 1.94 | 5.80 ± 3.86 | 4.92 ± 1.08 | 4.92 ± 1.31 | 0.027 |
| Women | ||||||||||
| Population distribution (%) | 273 (10.8%) | 555 (21.9%) | 603 (23.8%) | 480 (19%) | 279 (11%) | 182 (7.2%) | 84 (3.3%) | 40 (1.6%) | 35 (1.4%) | |
| Systolic blood pressure (mmHg) | 131.78 ± 24 | 131.86 ± 21.21 | 132.10 ± 21.88 | 129.56 ± 21.81 | 128.45 ± 21.37 | 132.54 ± 24.96 | 132.67 ± 24.02 | 129.28 ± 24.22 | 129.4 ± 17.91 | 0.272 |
| Diastolic blood pressure (mmHg) | 80.98 ± 16.25 | 80.36 ± 14.98 | 80.05 ± 15.09 | 78.54 ± 15.09 | 77.91 ± 14.60 | 80.79 ± 16.85 | 79.49 ± 14.47 | 78.26 ± 15.24 | 77.8 ± 13.70 | 0.174 |
| Total cholesterol (mmol/L) | 4.34 ± 1.19 | 4.46 ± 1.10 | 4.34 ± 1.11 | 4.36 ± 1.11 | 4.31 ± 1.23 | 4.45 ± 1.05 | 4.53 ± 1.21 | 4.33 ± 1.03 | 4.64 ± 1.08 | 0.352 |
| HDL-C cholesterol (mmol/L) | 1.68 ± 0.45 | 1.43 ± 0.38 | 1.27 ± 0.32 | 1.14 ± 0.30 | 1.08 ± 0.30 | 0.99 ± 0.26 | 0.87 ± 0.25 | 0.78 ± 0.20 | 0.64 ± 0.22 | <0.001 |
| LDL-C cholesterol (mmol/L) | 2.09 ± 0.58 | 2.46 ± 0.66 | 2.80 ± 0.70 | 3.04 ± 0.80 | 3.36 ± 0.94 | 3.60 ± 0.95 | 3.61 ± 1.03 | 3.70 ± 0.91 | 3.31 ± 1.13 | <0.001 |
| Triglycerides (mmol/L) | 1.50 ± 1.01 | 1.61 ± 1.22 | 1.61 ± 1.16 | 1.60 ± 0.99 | 1.52 ± 0.94 | 1.62 ± 0.98 | 1.65 ± 1.07 | 1.62 ± 0.67 | 2.20 ± 1.44 | 0.075 |
| Fasting glucose (mmol/L) | 5.02 ± 1.65 | 4.92 ± 1.49 | 4.83 ± 1.21 | 4.92 ± 1.62 | 4.94 ± 1.52 | 4.74 ± 1.44 | 4.76 ± 0.93 | 4.64 ± 0.75 | 4.95 ± 1.23 | 0.45 |
| LHR < 1.5 | 1.5 ≤ LHR < 2 | 2 ≤ LHR < 2.5 | 2.5 ≤ LHR < 3 | 3 ≤ LHR < 3.5 | 3.5 ≤ LHR < 4 | 4 ≤ LHR < 4.5 | 4.5 ≤ LHR < 5 | LHR ≥ 5 | p Value | |
|---|---|---|---|---|---|---|---|---|---|---|
| Men | ||||||||||
| Hypertension | 36.4% | 39.7% | 43.1% | 46.3% | 50.6% | 48.2% | 44.3% | 61.1% | 33.3% | 0.016 |
| Diabetes | 5.0% | 6.1% | 5.4% | 6.8% | 4.8% | 8.8% | 8.3% | 5.9% | 8.3% | 0.85 |
| Hypercholesterolemia | 12.4% | 14.5% | 16.3% | 16.1% | 20.3% | 19.1% | 15.0% | 20.6% | 16.7% | 0.53 |
| High LDL cholesterol | 2.8% | 14.8% | 33.1% | 53.5% | 63.1% | 64.0% | 67.2% | 75.0% | 50.0% | <0.001 |
| Low HDL cholesterol | 8.4% | 13.8% | 24.7% | 32.4% | 49.4% | 64.0% | 75.4% | 91.7% | 100.0% | <0.001 |
| Hypertriglyceridemia | 26.9% | 34.2% | 31.9% | 31.7% | 30.4% | 36.0% | 35.0% | 35.3% | 50.0% | 0.57 |
| Women | ||||||||||
| Hypertension | 35.9% | 40.7% | 43.3% | 45.4% | 45.2% | 48.9% | 40.5% | 35.0% | 37.1% | 0.122 |
| Diabetes | 6.8% | 6.1% | 4.4% | 4.5% | 5.8% | 2.8% | 2.4% | 0.0% | 14.7% | 0.049 |
| Hypercholesterolemia | 19.5% | 19.6% | 17.4% | 17.8% | 18.2% | 19.3% | 22.9% | 23.7% | 23.5% | 0.904 |
| High LDL cholesterol | 5.1% | 15.0% | 32.8% | 45.6% | 59.9% | 72.5% | 67.9% | 70.0% | 57.1% | <0.001 |
| Low HDL cholesterol | 9.2% | 14.1% | 24.7% | 38.3% | 47.3% | 60.4% | 73.8% | 92.5% | 94.3% | <0.001 |
| Hypertriglyceridemia | 29.3% | 30.3% | 34.2% | 35.4% | 30.8% | 33.1% | 39.8% | 44.7% | 44.1% | 0.168 |
| LDL-C/HDL-C Ratio | LHR < 1.5 | 1.5 ≤ LHR < 2 | 2 ≤ LHR < 2.5 | 2.5 ≤ LHR < 3 | 3 ≤ LHR < 3.5 | 3.5 ≤ LHR < 4 | 4 ≤ LHR < 4.5 | 4.5 ≤ LHR < 5 | LHR ≥ 5 |
|---|---|---|---|---|---|---|---|---|---|
| Healthy subjects | 37.7% | 26.0% | 13.6% | 3.4% | 0.0% | 0.0% | 0.0% | 0.0% | 0.0% |
| Subjects with CVD risk factors | 62.3% | 74.0% | 86.4% | 96.6% | 100.0% | 100.0% | 100.0% | 100.0% | 100.0% |
| Odds Ratio | Proportion | Hypertension | Dyslipidemia | Diabetes | ≥2 Risk Factors | ||||||||
|---|---|---|---|---|---|---|---|---|---|---|---|---|---|
| LDL-C/HDL-C Cutoffs | Percentile | Sens % | Spec % | Distance in ROC Curve | Sens % | Spec % | Distance in ROC Curve | Sens % | Spec % | Distance in ROC Curve | Sens % | Spec % | Distance in ROC Curve |
| Men | |||||||||||||
| 1.5 | 12.3 | 89.9 | 14.2 | 0.87 | 94.6 | 31.7 | 0.69 | 90.9 | 12.3 | 0.88 | 95.4 | 16.8 | 0.83 |
| 2 | 33 | 70.2 | 36.3 | 0.70 | 79.6 | 69.8 | 0.36 | 70 | 33.2 | 0.73 | 80.6 | 41.4 | 0.62 |
| 2.5 | 57.1 | 46.9 | 60.5 | 0.66 | 56.6 | 95.6 | 0.44 | 49.1 | 57.1 | 0.67 | 59.2 | 66.5 | 0.53 |
| 3 | 75.7 | 27.5 | 78.4 | 0.76 | 32.8 | 100 | 0.67 | 28.2 | 75.8 | 0.30 | 35.4 | 82.2 | 0.67 |
| 3.5 | 87.2 | 14.1 | 88.3 | 0.87 | 17.3 | 100 | 0.83 | 18.2 | 87.4 | 0.83 | 18.6 | 90.6 | 0.82 |
| 4 | 94.6 | 5.8 | 95.2 | 0.94 | 7.2 | 100 | 0.93 | 7.3 | 94.8 | 0.93 | 7.8 | 96.2 | 0.92 |
| 4.5 | 97.9 | 2.2 | 98.1 | 0.98 | 2.8 | 100 | 0.97 | 2.7 | 98 | 0.97 | 3 | 98.5 | 1.00 |
| 5 | 99.5 | 0.4 | 99.4 | 1.00 | 0.7 | 100 | 0.99 | 0.9 | 99.5 | 0.99 | 0.6 | 99.6 | 0.99 |
| Women | |||||||||||||
| 1.5 | 10.79 | 90.10 | 13.60 | 0.87 | 93.90 | 28.20 | 0.72 | 85.70 | 11.80 | 0.89 | 94.00 | 15.30 | 0.85 |
| 2 | 32.71 | 68.20 | 37.10 | 0.71 | 77.90 | 69.50 | 0.38 | 57.10 | 34.30 | 0.79 | 76.70 | 41.10 | 0.63 |
| 2.5 | 56.54 | 44.00 | 60.70 | 0.68 | 54.40 | 94.10 | 0.46 | 38.90 | 58.40 | 0.74 | 53.70 | 65.40 | 0.58 |
| 3 | 75.50 | 23.20 | 78.50 | 0.80 | 30.40 | 100.00 | 0.70 | 21.40 | 77.50 | 0.82 | 29.40 | 81.70 | 0.73 |
| 3.5 | 86.53 | 12.40 | 87.30 | 0.89 | 17.20 | 100.00 | 0.83 | 9.50 | 87.20 | 0.91 | 15.60 | 89.10 | 0.85 |
| 4 | 93.72 | 5.00 | 93.80 | 0.95 | 7.80 | 100.00 | 0.92 | 5.60 | 94.30 | 0.95 | 6.40 | 94.70 | 0.94 |
| 4.5 | 97.04 | 2.20 | 97.00 | 0.98 | 3.70 | 100.00 | 0.96 | 4.00 | 97.40 | 0.96 | 3.00 | 97.50 | 0.97 |
| 5 | 98.62 | 1.00 | 98.70 | 0.98 | 1.60 | 100.00 | 0.98 | 3.20 | 98.90 | 0.97 | 1.50 | 99.00 | 0.99 |
| AUC | Men (95% CI) | Women (95% CI) |
|---|---|---|
| Hypertension | 0.544 (0.517, 0.572) | 0.523 (0.499, 0.546) |
| Diabetes | 0.543 (0.486, 0.599) | 0.513 (0.478, 0.584) |
| Dyslipidemia | 0.849 (0.831, 0.867) | 0.818 (0.801, 0.835) |
| ≥2 risk factors | 0.663 (0.637, 0.689) | 0.609 (0.586, 0.633) |
© 2016 by the authors; licensee MDPI, Basel, Switzerland. This article is an open access article distributed under the terms and conditions of the Creative Commons by Attribution (CC-BY) license (http://creativecommons.org/licenses/by/4.0/).
Share and Cite
Chen, Q.-J.; Lai, H.-M.; Chen, B.-D.; Li, X.-M.; Zhai, H.; He, C.-H.; Pan, S.; Luo, J.-Y.; Gao, J.; Liu, F.; et al. Appropriate LDL-C-to-HDL-C Ratio Cutoffs for Categorization of Cardiovascular Disease Risk Factors among Uygur Adults in Xinjiang, China. Int. J. Environ. Res. Public Health 2016, 13, 235. https://doi.org/10.3390/ijerph13020235
Chen Q-J, Lai H-M, Chen B-D, Li X-M, Zhai H, He C-H, Pan S, Luo J-Y, Gao J, Liu F, et al. Appropriate LDL-C-to-HDL-C Ratio Cutoffs for Categorization of Cardiovascular Disease Risk Factors among Uygur Adults in Xinjiang, China. International Journal of Environmental Research and Public Health. 2016; 13(2):235. https://doi.org/10.3390/ijerph13020235
Chicago/Turabian StyleChen, Qing-Jie, Hong-Mei Lai, Bang-Dang Chen, Xiao-Mei Li, Hui Zhai, Chun-Hui He, Shuo Pan, Jun-Yi Luo, Jing Gao, Fen Liu, and et al. 2016. "Appropriate LDL-C-to-HDL-C Ratio Cutoffs for Categorization of Cardiovascular Disease Risk Factors among Uygur Adults in Xinjiang, China" International Journal of Environmental Research and Public Health 13, no. 2: 235. https://doi.org/10.3390/ijerph13020235
APA StyleChen, Q.-J., Lai, H.-M., Chen, B.-D., Li, X.-M., Zhai, H., He, C.-H., Pan, S., Luo, J.-Y., Gao, J., Liu, F., Ma, Y.-T., & Yang, Y.-N. (2016). Appropriate LDL-C-to-HDL-C Ratio Cutoffs for Categorization of Cardiovascular Disease Risk Factors among Uygur Adults in Xinjiang, China. International Journal of Environmental Research and Public Health, 13(2), 235. https://doi.org/10.3390/ijerph13020235