
Fatigue in Emergency Services Operations: Assessment of the Optimal Objective and Subjective Measures Using a Simulated Wildfire Deployment


Abstract
:1. Introduction
2. Experimental Section
2.1. Participants
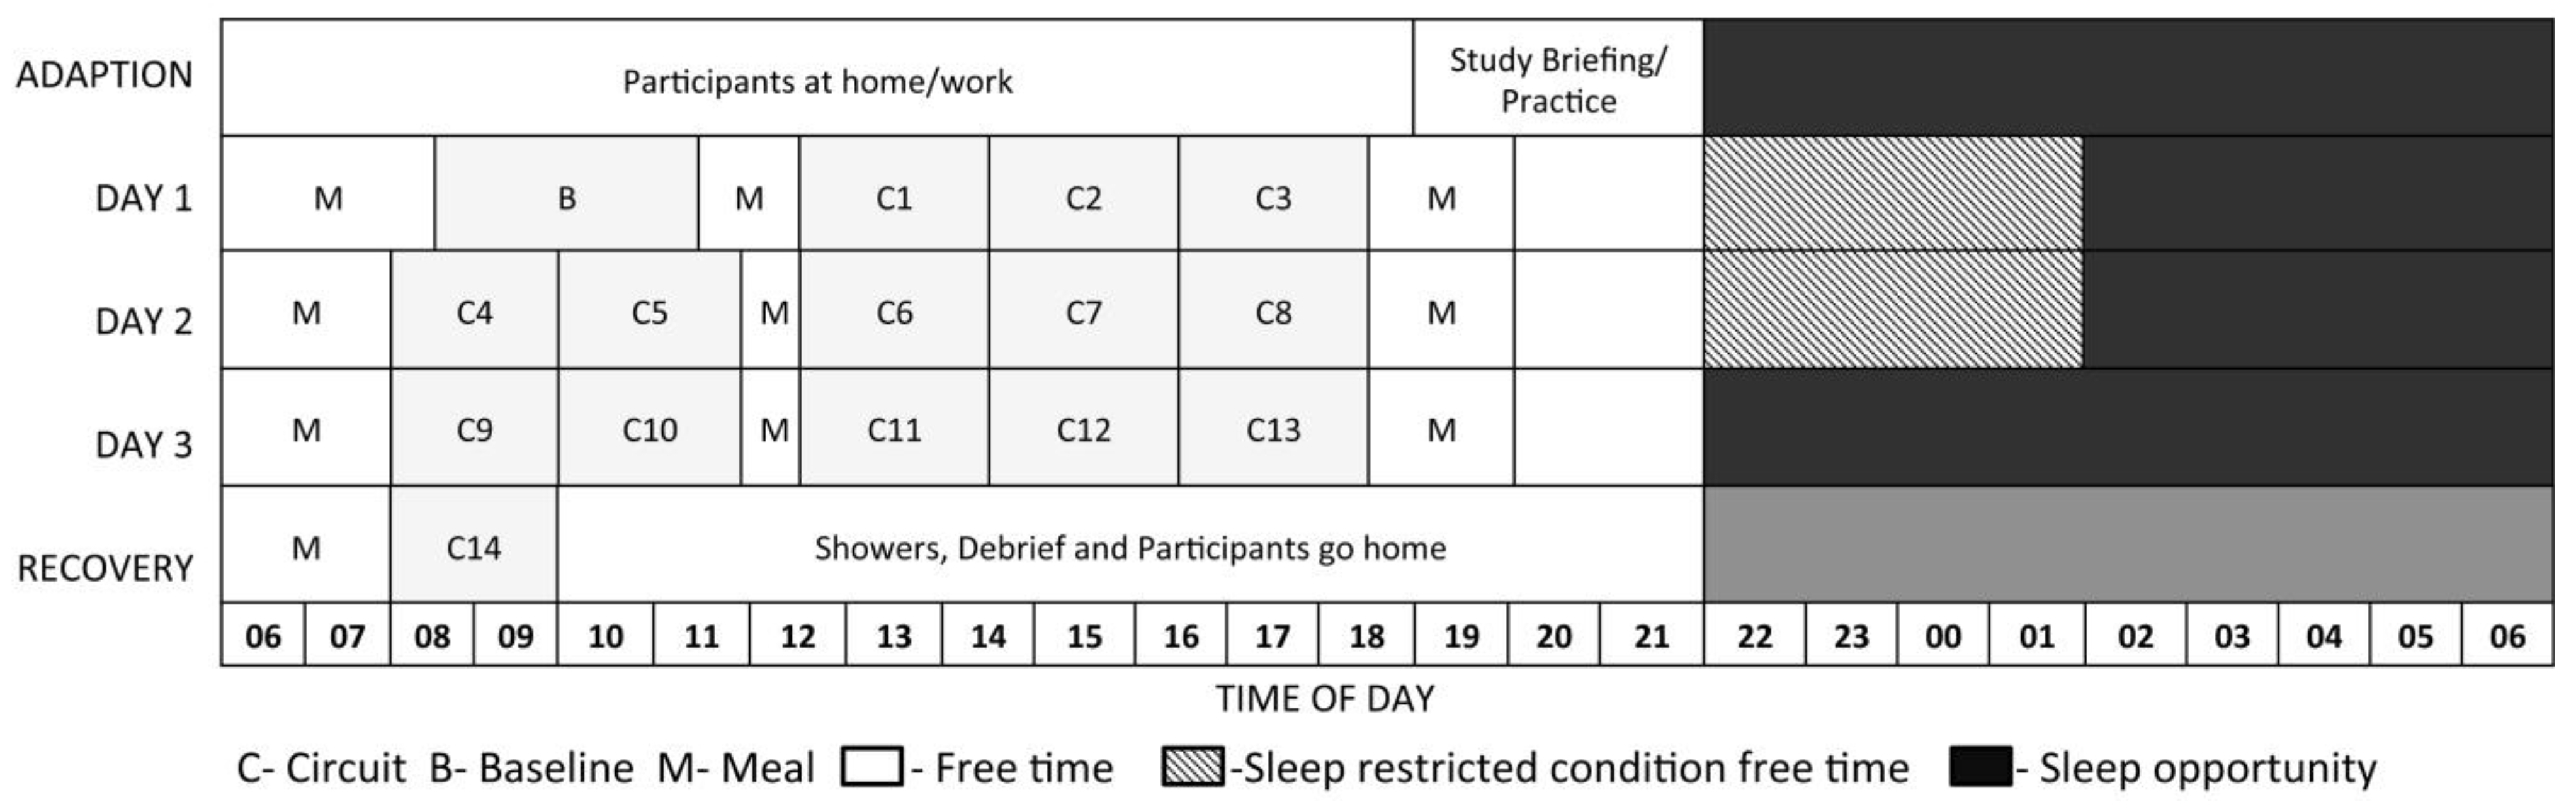
2.2. Procedure
2.3. Physical Tasks
2.4. Cognitive Tasks
2.5. Subjective Measures
3. Results
3.1. Objective Measures

| Condition | Model: OSPAT | Model: Memory | Model: PVT Mean Reaction Time | Model: Stroop % Correct | Model: Stroop Reaction Time | Model: Go-No-Go % Correct | Model: Go-No-Go Reaction Time |
|---|---|---|---|---|---|---|---|
| Sleep restricted/cool | 0.40 | 0.09 | −0.43 *** | −0.01 | −0.02 | −0.01 | 0.05 *** |
| (0.27) | (0.22) | (0.09) | (0.03) | (0.03) | (0.03) | (0.01) | |
| Sleep restricted/hot | −0.24 | −0.46 | −0.63 *** | −0.01 | 0.03 | −0.07 | 0.06 *** |
| (0.38) | (0.31) | (0.13) | (0.04) | (0.04) | (0.04) | (0.01) | |
| Normal sleep/cool | 0.03 | 0.50 * | −0.26 ** | −0.05 | −0.06 * | −0.00 | 0.03 ** |
| (0.25) | (0.21) | (0.08) | (0.03) | (0.03) | (0.02) | (0.01) | |
| Normal sleep/hot | 0.08 | 0.17 | 0.08 | −0.03 | −0.10 ** | 0.00 | 0.04 *** |
| (0.31) | (0.25) | (0.10) | (0.03) | (0.03) | (0.03) | (0.01) | |
| R2 | 0.03 | 0.09 | 0.41 | 0.06 | 0.17 | 0.04 | 0.48 |
| Adj. R2 | −0.01 | 0.05 | 0.38 | 0.01 | 0.13 | −0.00 | 0.45 |
| Num. obs. | 88 | 88 | 88 | 88 | 88 | 88 | 88 |
| F(4,94) | 0.68 | 2.12 | 14.60 ** | 1.27 | 4.17 ** | .90 | 19.28 *** |
| Condition | Model: OSPAT | Model: Memory | Model: PVT Mean Reaction Time | Model: Stroop % Correct | Model: Stroop Reaction Time | Model: Go-No-Go % Correct | Model: Go-No-Go Reaction Time |
|---|---|---|---|---|---|---|---|
| Sleep restricted/cool | 0.25 | −0.31 | 0.35 *** | −0.00 | −0.07 ** | 0.06 ** | −0.02 * |
| (0.28) | (0.19) | (0.07) | (0.02) | (0.02) | (0.02) | (0.01) | |
| Sleep restricted/hot | 0.48 | 0.38 | 0.54 *** | 0.03 | −0.11 ** | 0.09 ** | −0.04 *** |
| (0.39) | (0.27) | (0.10) | (0.03) | (0.03) | (0.03) | (0.01) | |
| Normal sleep/cool | 0.28 | −0.12 | 0.13 | 0.02 | −0.03 | 0.06 *** | −0.00 |
| (0.26) | (0.18) | (0.07) | (0.02) | (0.02) | (0.02) | (0.01) | |
| Normal sleep/hot | −0.17 | −0.24 | 0.14 | 0.06 ** | −0.04 | 0.05 * | −0.02 * |
| (0.32) | (0.22) | (0.08) | (0.02) | (0.03) | (0.02) | (0.01) | |
| R2 | 0.04 | 0.07 | 0.40 | 0.10 | 0.21 | 0.31 | 0.22 |
| Adj. R2 | −0.00 | 0.02 | 0.38 | 0.06 | 0.18 | 0.28 | 0.18 |
| Num. obs. | 88 | 88 | 88 | 88 | 88 | 88 | 88 |
| F(4,84) | 0.94 | 1.52 | 14.21 *** | 2.44 | 5.69 *** | 9.61 *** | 5.89 *** |
3.2. Subjective Measures
| Condition | Model: Samn-Perelli Fatigue Scale | Model: Alertness | Model: Pre-Performance | Model: Motivation |
|---|---|---|---|---|
| Sleep restricted/cool | 1.32 *** | −14.90 *** | −10.16 * | −0.23 ** |
| (0.29) | (4.21) | (3.99) | (0.08) | |
| Sleep restricted/hot | 3.08 *** | −40.62 *** | −32.92 *** | −0.49 *** |
| (0.41) | (5.96) | (5.64) | (0.11) | |
| Normal sleep/cool | 1.39 *** | −16.83 *** | −12.55 ** | −0.30 *** |
| (0.27) | (3.99) | (3.77) | (0.07) | |
| Normal sleep/hot | 1.58 *** | −19.81 *** | −24.74 *** | −0.30 *** |
| (0.33) | (4.80) | (4.54) | (0.09) | |
| R2 | 0.60 | 0.53 | 0.49 | 0.42 |
| Adj. R2 | 0.58 | 0.51 | 0.47 | 0.39 |
| Num. obs. | 88 | 88 | 88 | 88 |
| F(4,84) | 31.32 *** | 23.45 *** | 20.34 *** | 15.13 *** |
| Condition | Model: Samn-Perelli Fatigue Scale | Model: Alertness | Model: Pre-Performance | Model: Motivation |
|---|---|---|---|---|
| Sleep restricted/cool | −1.21 *** | 12.03 ** | 6.93 * | 0.10 |
| (0.24) | (4.06) | (3.46) | (0.06) | |
| Sleep restricted/hot | −3.23 *** | 37.92 *** | 31.15 *** | 0.43 *** |
| (0.34) | (5.74) | (4.90) | (0.09) | |
| Normal sleep/cool | −0.97 *** | 8.34 * | 7.90 * | 0.17 ** |
| (0.23) | (3.85) | (3.28) | (0.06) | |
| Normal sleep/hot | −2.17 *** | 26.35 *** | 21.98 *** | 0.36 *** |
| (0.27) | (4.63) | (3.95) | (0.07) | |
| R2 | 0.70 | 0.52 | 0.49 | 0.44 |
| Adj. R2 | 0.69 | 0.49 | 0.47 | 0.41 |
| Num. obs. | 88 | 88 | 88 | 88 |
| F(4,84) | 49.3 *** | 22.36 *** | 20.31 *** | 16.25 *** |
3.3. Subjective versus Objective Measures
| Predictor | Model 1 | Model 2 | Model 3 | Model 4 | Model 5 | Model 6 | Model 7 |
|---|---|---|---|---|---|---|---|
| (Intercept) | −0.009 | −0.010 | −0.000 | 0.004 | 0.033 | 0.033 | 0.061 |
| (0.083) | (0.082) | (0.083) | (0.083) | (0.088) | (0.085) | (0.088) | |
| Samn-Perelli Fatigue Scale | −0.240 *** | −0.272 *** | −0.234 *** | −0.286 *** | |||
| (0.062) | (0.055) | (0.049) | (0.041) | ||||
| Alertness | 0.092 | 0.270 *** | |||||
| (0.082) | (0.044) | ||||||
| Motivation | 0.123 | 0.149 * | 0.107 | 0.256 *** | |||
| (0.067) | (0.063) | (0.056) | (0.048) | ||||
| Pre-Performance | −0.132 | −0.100 | 0.195 *** | ||||
| (0.074) | (0.067) | (0.048) | |||||
| AIC | 624.2 | 620.3 | 617 | 614 | 626 | 632 | 643 |
| Var(Betw.) | 0.481 | 0.469 | 0.488 | 0.496 | 0.567 | 0.516 | 0.566 |
| Var(Resid.)_ | 0.317 | 0.321 | 0.318 | 0.320 | 0.324 | 0.347 | 0.356 |
4. Discussion
5. Conclusions
Acknowledgements
Author Contributions
Conflicts of Interest
References
- Brown, I. Driver fatigue. Hum. Factors 1994, 36, 298–314. [Google Scholar] [PubMed]
- Phillips, R. A review of fatigue- and a step towards a whole definition. Transp. Res. Part F 2015, 29, 48–56. [Google Scholar] [CrossRef]
- Dawson, D.; McCulloch, K. Managing Fatigue: It’s about sleep. Sleep Med. Rev. 2005, 9, 365–380. [Google Scholar] [CrossRef] [PubMed]
- Gander, P.; Graeber, R.; Belenky, G. Fatigue risk management. In Principles and Practices of Sleep Medicine; Kryger, M., Roth, T., Dement, W., Eds.; W.B. Saunders Company: Philadelphia, PA, USA, 2010; pp. 760–768. [Google Scholar]
- Lerman, S.; Eskin, E.; Flower, D.; George, E.; Gerson, B.; Hartenbaum, N.; Hursh, S.; Moore-Ede, M. ACOEM Guidance Statement. Fatigue risk management in the workplace. J. Occup. Environ. Med. 2012, 54, 231–258. [Google Scholar] [CrossRef] [PubMed]
- Belenky, G.; Wesensten, N.; Thorne, D.; Thomas, M.; Sing, H.; Redmond, D.; Russo, M.; Balkin, T. Patterns of performance degradation and restoration during sleep restriction and subsequent recovery: A sleep dose-response study. J. Sleep Res. 2003, 12, 1–12. [Google Scholar] [CrossRef] [PubMed]
- Willamson, A.; Lombardi, D.; Folkard, S.; Stutts, J.; Courtney, T.; Connor, J. The link between fatigue and safety. Accid. Anal. Prev. 2011, 43, 498–515. [Google Scholar] [CrossRef] [PubMed]
- Dinges, D.; Pack, F.; Williams, K.; Gillen, K.; Powell, J.; Ott, G.; Aptowicz, C.; Pack, A. Cumulative sleepiness, mood disturbance, and psychomotor vigilance performance decrements during a week of sleep restricted to 4–5 h per night. Sleep 1997, 20, 267–277. [Google Scholar] [PubMed]
- Dorrian, J.; Rogers, N.; Dinges, D. Psychomotor vigilance performance: Neurocognitive assay sensitive to sleep loss. In Sleep Deprivation: Clinical Issues, Pharmacology, and Sleep Loss Effects; Kushida, C., Ed.; Marcel Dekker: New York, NY, USA, 2005; pp. 39–68. [Google Scholar]
- Dorrian, J.; Lamond, N.; Dawson, D. The ability to self-monitor performance when fatigued. J. Sleep Res. 2000, 9, 137–144. [Google Scholar] [CrossRef] [PubMed]
- Akerstedt, T.; Kecklund, G.; Axelsson, J. Effects of context on sleepiness self-ratings during repeated partial sleep deprivation. Chronobiol. Int. 2008, 25, 271–278. [Google Scholar] [CrossRef] [PubMed]
- Aisbett, B.; Nichols, D. Fighting fatigue whilst fighting bushfire: An overview of factors contributing to firefighter fatigue during bushfire suppression. Aust. J. Emerg. Manag. 2007, 22, 31–39. [Google Scholar]
- Aisbett, B.; Wolkow, A.; Sprajcer, M.; Ferguson, S. “Awake, smoky and hot”: Providing an evience-base for managing the risks associated with occupational stressors encountered by wildland firefighters. Appl. Ergon. 2012, 43, 916–925. [Google Scholar] [CrossRef] [PubMed]
- McLennan, J.; Birch, A. A potential crisis in wildfire emergency response capability? Australia’s volunteer firefighters. Glob. Environ. Change Part B: Environ. Hazards 2005, 6, 101–107. [Google Scholar] [CrossRef]
- Ferguson, S.; Aisbett, B.; Jay, S.; Onus, K.; Lord, C.; Sprajcer, M.; Thomas, M. Design of a valid simulation for researching physical, physiological and cognitive performance in volunteer firefighters during bushfire. In Proceedings of the Bushfire CRC & AFAC 2011 Conference Science Day, Sydney, Australia, 1 September 2011; Thornton, R., Ed.; Australasian Fire and Emergency Service Authorities Council: Melbourne, Australia, 2011; pp. 196–204. [Google Scholar]
- Phillips, M.; Payne, W.; Lord, C.; Netto, K.; Nichols, D.; Aisbett, B. Identification of physically demanding tasks performed during bushfire suppression by Australian rural firefighters. Appl. Ergon. 2012, 43, 435–441. [Google Scholar] [CrossRef] [PubMed]
- Vincent, G.; Ferguson, S.; Tran, J.; Larsen, B.; Wolkow, A.; Aisbett, B. Sleep restriction during simulated wildfire suppression: Effect on physical task performance. PLoS ONE 2015, 10, e0115329. [Google Scholar] [CrossRef]
- Lamond, N.; Dawson, D.; Roach, G. Fatigue assessment in the field: Validation of a hand-held electronic psychomotor vigilance task. Aviat. Space Environ. Med. 2005, 76, 486–489. [Google Scholar] [PubMed]
- Thorne, D.; Johnson, D.; Redmond, D.; Sing, H.; Belenky, G.; Shapiro, J. The Walter Reed palm-held psychomotor vigilance test. Behav. Res. Methods 2005, 37, 111–118. [Google Scholar] [CrossRef] [PubMed]
- Cain, S.; Silva, E.; Change, A.; Ronda, J.; Duffy, J. One night sleep deprivation affects reaction time, but not interference or facilitation in a stroop task. Brain Cognit. 2011, 76, 37–42. [Google Scholar] [CrossRef] [PubMed]
- MacLeod, C. Half a century of research on the Stroop effect: An integrative review. Psychol. Bull. 1991, 109, 163–203. [Google Scholar] [CrossRef] [PubMed]
- Drummond, S.; Paulus, M.; Tapert, S. Effects of two nights sleep deprivation and two nights recovery sleep on response inhibition. J. Sleep Res. 2006, 15, 261–265. [Google Scholar] [CrossRef] [PubMed]
- Petrilli, R.; Jay, S.; Dawson, D.; Lamond, N. The impact of sustained wakefulness and time-of-day on OSPAT performance. Ind. Health 2005, 43, 186–192. [Google Scholar] [CrossRef] [PubMed][Green Version]
- Samn, S.; Perelli, L. Estimating Aircrew Fatigue: A Technique with Application to Airlift Operations; Technical Report SAM-TR-82-21; Brooks AFB, USAF School of Aerospace Medicine: San, Antonio, TX, USA, 1982. [Google Scholar]
- Wewers, M.; Lowe, N. A critical review of visual analogue scales in the measurement of clinical phenomena. Res. Nurs. Health 1990, 13, 227–236. [Google Scholar] [CrossRef] [PubMed]
- Harrison, Y.; Horne, J. The impact of sleep deprivation on decision making: A review. J. Exp. Psychol. 2000, 6, 236–249. [Google Scholar] [CrossRef]
- Van Dongen, H.; Baynard, M.; Maislin, G.; Dinges, D. Systematic interindividual differences in neurobehavioural impairment from sleep loss: Evidence of trait-like differential vulnerability. Sleep 2004, 27, 423–433. [Google Scholar] [PubMed]
© 2016 by the authors; licensee MDPI, Basel, Switzerland. This article is an open access article distributed under the terms and conditions of the Creative Commons by Attribution (CC-BY) license (http://creativecommons.org/licenses/by/4.0/).
Share and Cite
Ferguson, S.A.; Smith, B.P.; Browne, M.; Rockloff, M.J. Fatigue in Emergency Services Operations: Assessment of the Optimal Objective and Subjective Measures Using a Simulated Wildfire Deployment. Int. J. Environ. Res. Public Health 2016, 13, 171. https://doi.org/10.3390/ijerph13020171
Ferguson SA, Smith BP, Browne M, Rockloff MJ. Fatigue in Emergency Services Operations: Assessment of the Optimal Objective and Subjective Measures Using a Simulated Wildfire Deployment. International Journal of Environmental Research and Public Health. 2016; 13(2):171. https://doi.org/10.3390/ijerph13020171
Chicago/Turabian StyleFerguson, Sally A., Bradley P. Smith, Matthew Browne, and Matthew J. Rockloff. 2016. "Fatigue in Emergency Services Operations: Assessment of the Optimal Objective and Subjective Measures Using a Simulated Wildfire Deployment" International Journal of Environmental Research and Public Health 13, no. 2: 171. https://doi.org/10.3390/ijerph13020171
APA StyleFerguson, S. A., Smith, B. P., Browne, M., & Rockloff, M. J. (2016). Fatigue in Emergency Services Operations: Assessment of the Optimal Objective and Subjective Measures Using a Simulated Wildfire Deployment. International Journal of Environmental Research and Public Health, 13(2), 171. https://doi.org/10.3390/ijerph13020171