
Childhood Fish Consumption and Learning and Behavioral Disorders

 ,
,
Abstract
:1. Introduction
2. Materials and Methods
2.1. Study Population
2.2. Assessment of Fish Consumption
2.3. Assessment of Learning and Behavioral Problems
2.4. Assessment of Covariates
2.5. Statistical Analysis
3. Results
3.1. Study Population
3.2. Overall Frequency of Childhood Fish Consumption
3.3. Childhood Fish Consumption, by Fish Type
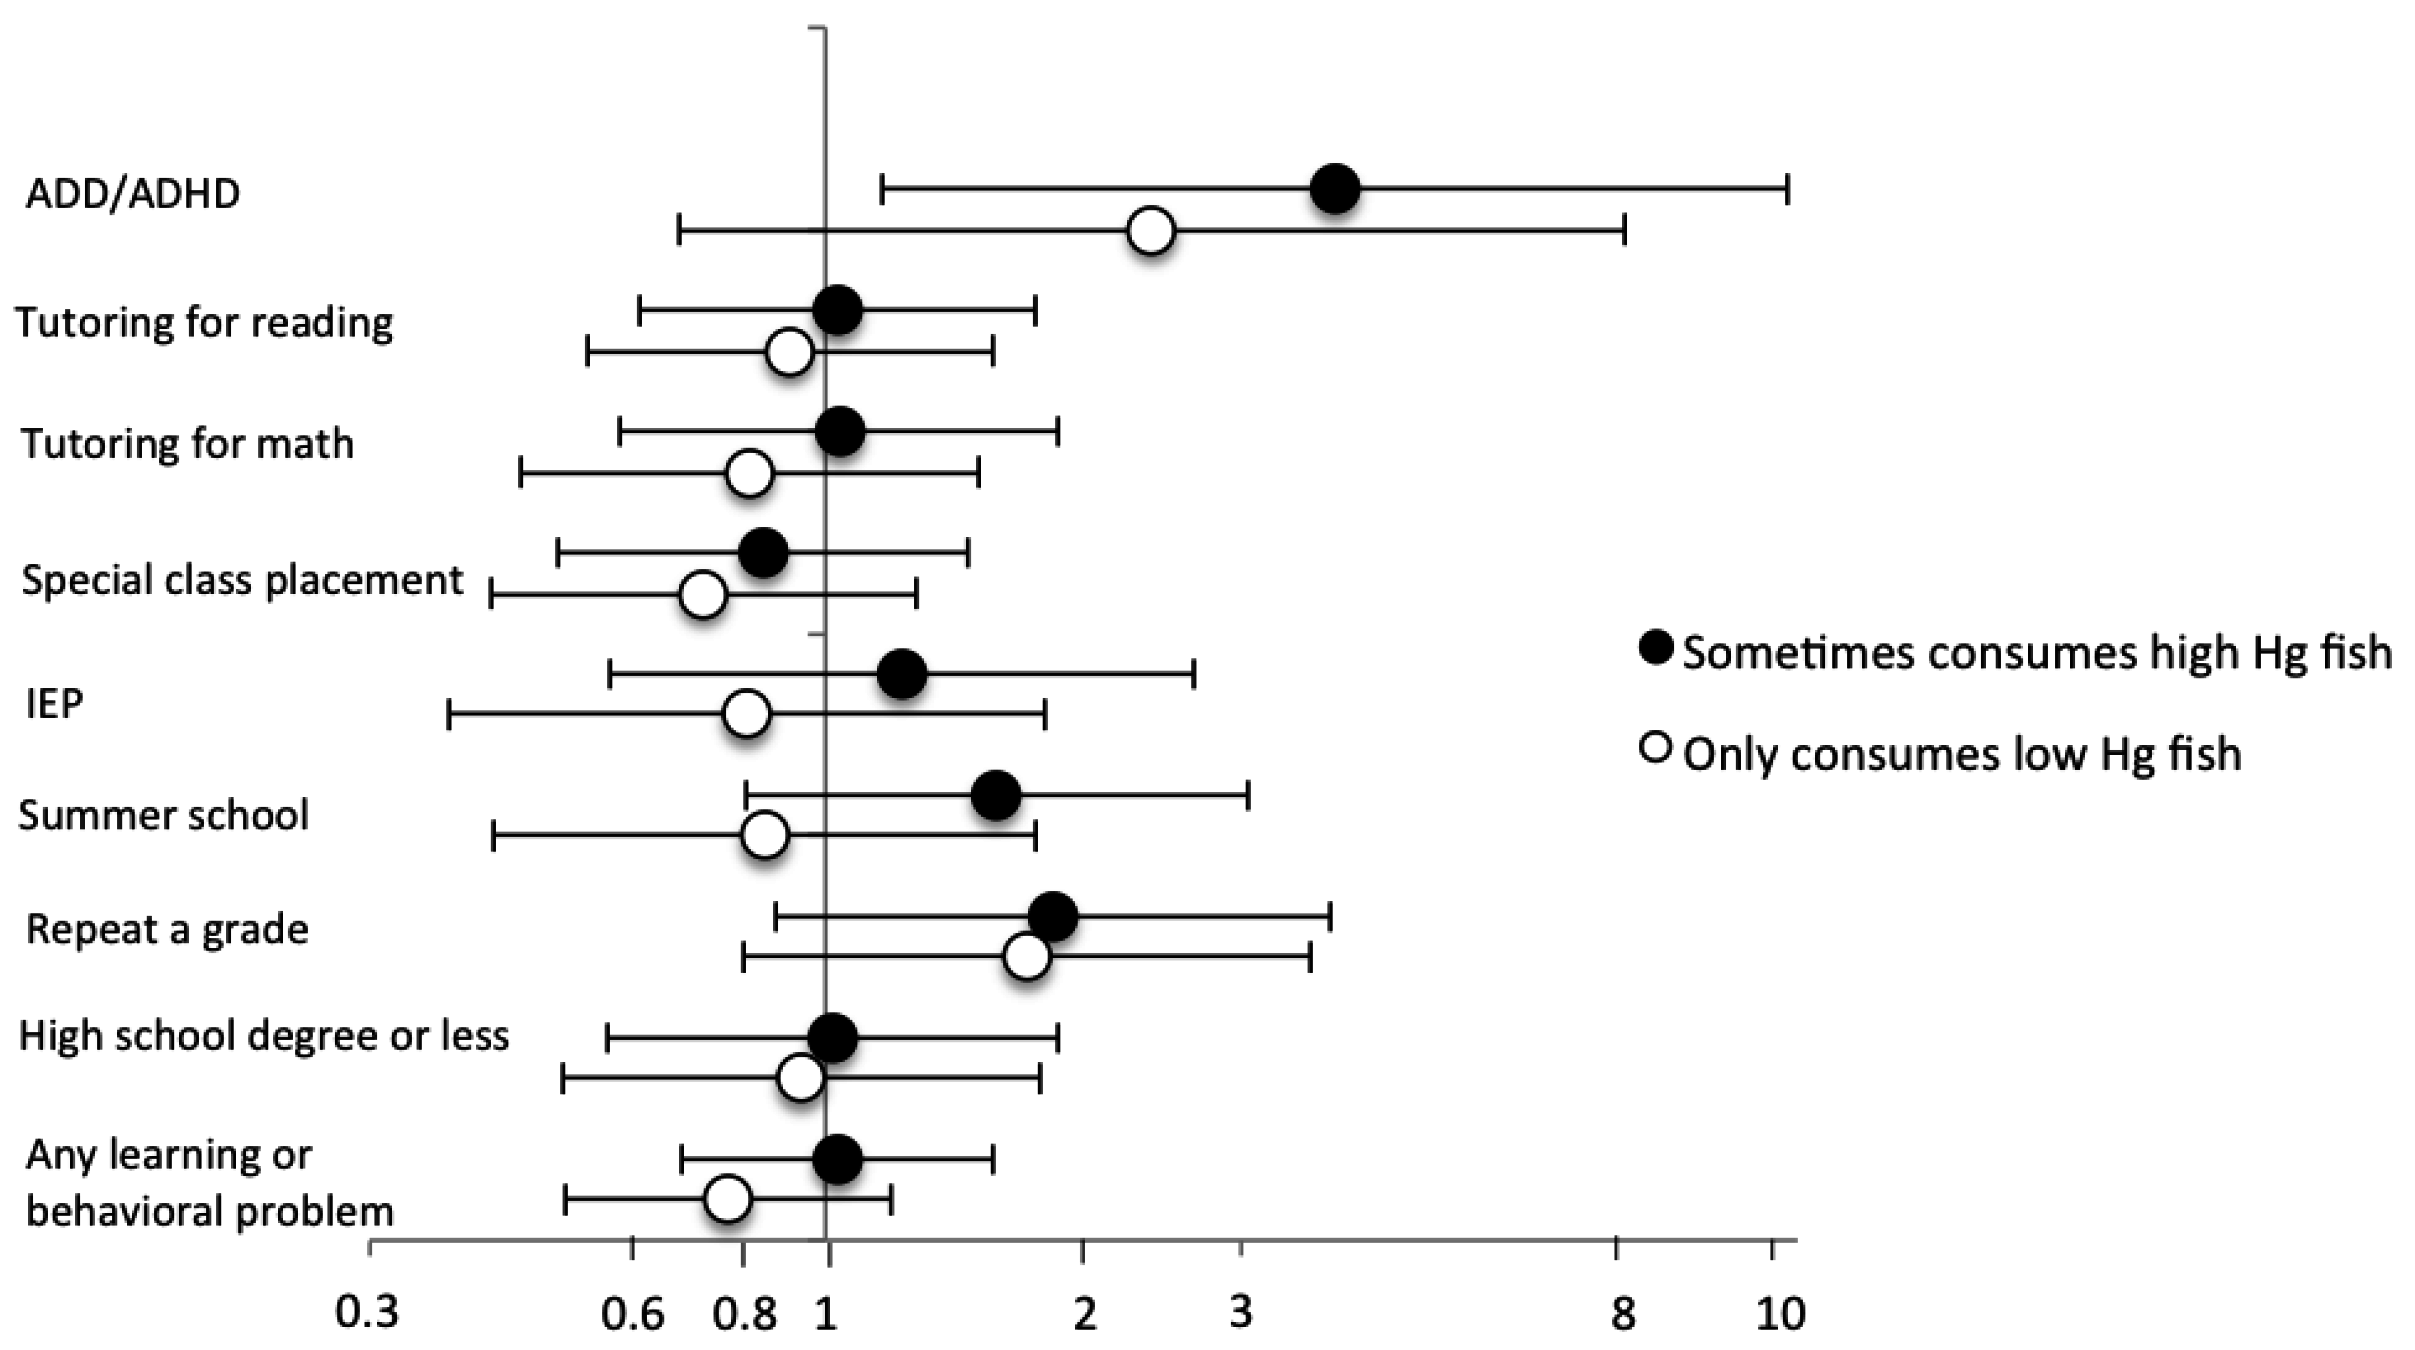
3.4. Frequency of High-Mercury Fish Consumption
3.5. Sensitivity Analyses
4. Discussion
4.1. Previous Studies
4.2. Strengths and Limitations
5. Conclusions
Supplementary Materials
Acknowledgments
Author Contributions
Conflicts of Interest
References
- Kris-Etherton, P.M.; Taylor, D.S.; Yu-Poth, S.; Huth, P.; Moriarty, K.; Fishell, V.; Hargrove, R.L.; Zhao, G.; Etherton, T.D. Polyunsaturated fatty acids in the food chain in the United States. Am. J. Clin. Nutr. 2000, 71, 179S–188S. [Google Scholar] [PubMed]
- Oken, E.; Bellinger, D.C. Fish consumption, methylmercury and child neurodevelopment. Curr. Opin. Pediatr. 2008, 20, 178–183. [Google Scholar] [CrossRef] [PubMed]
- Sagiv, S.K.; Thurston, S.W.; Bellinger, D.C.; Amarasiriwardena, C.; Korrick, S.A. Prenatal exposure to mercury and fish consumption during pregnancy and attention-deficit/hyperactivity disorder-related behavior in children. Arch. Pediatr. Adolesc. Med. 2012, 166, 1123–1131. [Google Scholar] [CrossRef] [PubMed]
- Jacobson, J.L.; Jacobson, S.W.; Muckle, G.; Kaplan-Estrin, M.; Ayotte, P.; Dewailly, E. Beneficial effects of a polyunsaturated fatty acid on infant development: Evidence from the Inuit of Arctic Quebec. J. Pediatr. 2008, 152, 356–364. [Google Scholar] [CrossRef] [PubMed]
- Boucher, O.; Jacobson, S.W.; Plusquellec, P.; Dewailly, E.; Ayotte, P.; Forget-Dubois, N.; Jacobson, J.L.; Muckle, G. Prenatal methylmercury, postnatal lead exposure, and evidence of attention deficit/hyperactivity disorder among Inuit children in Arctic Quebec. Environ. Health Perspect. 2012, 120, 1456–1461. [Google Scholar] [CrossRef] [PubMed]
- Jacobson, J.L.; Muckle, G.; Ayotte, P.; Dewailly, E.; Jacobson, S.W. Relation of Prenatal Methylmercury Exposure from Environmental Sources to Childhood IQ. Environ. Health Perspect. 2015, 123, 827–833. [Google Scholar] [CrossRef] [PubMed]
- Kuratko, C.N.; Barrett, E.C.; Nelson, E.B.; Salem, N., Jr. The relationship of docosahexaenoic acid (DHA) with learning and behavior in healthy children: A review. Nutrients 2013, 5, 2777–2810. [Google Scholar] [CrossRef] [PubMed]
- Bloch, M.H.; Qawasmi, A. Omega-3 fatty acid supplementation for the treatment of children with attention-deficit/hyperactivity disorder symptomatology: Systematic review and meta-analysis. J. Am. Acad. Child Adolesc. Psychiatry 2011, 50, 991–1000. [Google Scholar] [CrossRef] [PubMed]
- Aberg, M.A.; Aberg, N.; Brisman, J.; Sundberg, R.; Winkvist, A.; Toren, K. Fish intake of Swedish male adolescents is a predictor of cognitive performance. Acta Paediatr. 2009, 98, 555–560. [Google Scholar] [CrossRef] [PubMed]
- Daniels, J.L.; Longnecker, M.P.; Rowland, A.S.; Golding, J. Fish intake during pregnancy and early cognitive development of offspring. Epidemiology 2004, 15, 394–402. [Google Scholar] [CrossRef] [PubMed]
- De Groot, R.H.; Ouwehand, C.; Jolles, J. Eating the right amount of fish: Inverted U-shape association between fish consumption and cognitive performance and academic achievement in Dutch adolescents. Prostaglandins Leukot. Essent. Fat. Acids 2012, 86, 113–117. [Google Scholar] [CrossRef] [PubMed]
- Freire, C.; Ramos, R.; Lopez-Espinosa, M.J.; Diez, S.; Vioque, J.; Ballester, F.; Fernandez, M.F. Hair mercury levels, fish consumption, and cognitive development in preschool children from Granada, Spain. Environ. Res. 2010, 110, 96–104. [Google Scholar] [CrossRef] [PubMed]
- Kim, J.L.; Winkvist, A.; Aberg, M.A.; Aberg, N.; Sundberg, R.; Toren, K.; Brisman, J. Fish consumption and school grades in Swedish adolescents: A study of the large general population. Acta Paediatr. 2010, 99, 72–77. [Google Scholar] [CrossRef] [PubMed]
- Aschengrau, A.; Weinberg, J.M.; Janulewicz, P.A.; Romano, M.E.; Gallagher, L.G.; Winter, M.R.; Martin, B.R.; Vieira, V.M.; Webster, T.F.; White, R.F.; et al. Affinity for risky behaviors following prenatal and early childhood exposure to tetrachloroethylene (PCE)-contaminated drinking water: A retrospective cohort study. Environ. Health 2011, 10, 102. [Google Scholar] [CrossRef] [PubMed]
- Aschengrau, A.; Weinberg, J.M.; Janulewicz, P.A.; Romano, M.E.; Gallagher, L.G.; Winter, M.R.; Martin, B.R.; Vieira, V.M.; Webster, T.F.; White, R.F.; et al. Occurrence of mental illness following prenatal and early childhood exposure to tetrachloroethylene (PCE)-contaminated drinking water: A retrospective cohort study. Environ. Health 2012, 11, 2. [Google Scholar] [CrossRef] [PubMed]
- Getz, K.D.; Janulewicz, P.A.; Rowe, S.; Weinberg, J.M.; Winter, M.R.; Martin, B.R.; Vieira, V.M.; White, R.F.; Aschengrau, A. Prenatal and early childhood exposure to tetrachloroethylene and adult vision. Environ. Health Perspect. 2012, 120, 1327–1332. [Google Scholar] [CrossRef] [PubMed]
- Aschengrau, A.; Weinberg, J.; Rogers, S.; Gallagher, L.; Winter, M.; Vieira, V.; Webster, T.; Ozonoff, D. Prenatal exposure to tetrachloroethylene-contaminated drinking water and the risk of adverse birth outcomes. Environ. Health Perspect. 2008, 116, 814–820. [Google Scholar] [CrossRef] [PubMed]
- Aschengrau, A.; Weinberg, J.M.; Gallagher, L.G.; Winter, M.R.; Vieira, V.M.; Webster, T.F.; Ozonoff, D.M. Exposure to Tetrachloroethylene-Contaminated Drinking Water and the Risk of Pregnancy Loss. Water Qual. Expo. Health 2009, 1, 23–34. [Google Scholar] [CrossRef] [PubMed]
- Janulewicz, P.A.; White, R.F.; Winter, M.R.; Weinberg, J.M.; Gallagher, L.E.; Vieira, V.; Webster, T.F.; Aschengrau, A. Risk of learning and behavioral disorders following prenatal and early postnatal exposure to tetrachloroethylene (PCE)-contaminated drinking water. Neurotoxicol. Teratol. 2008, 30, 175–185. [Google Scholar] [CrossRef] [PubMed]
- U.S. Food and Drug Administration. A Quantitative Assessment of the Net Effects on Fetal Neurodevelopment from Eating Commercial Fish (as Measured by IQ and also Early Age Verbal Development in Children); Center for Food Safety and Applied Nutrition: Silver Spring, MD, USA, 2014.
- U.S. Food and Drug Administration. Fish: What Pregnant Women and Parents Should Know. Draft Updated Advice by the FDA and EPA. Available online: http://www.fda.gov/Food/FoodborneIllnessContaminants/Metals/ucm393070.htm (accessed on 18 June 2014).
- Bhutta, A.T.; Cleves, M.A.; Casey, P.H.; Cradock, M.M.; Anand, K.J. Cognitive and behavioral outcomes of school-aged children who were born preterm: A meta-analysis. JAMA 2002, 288, 728–737. [Google Scholar] [CrossRef] [PubMed]
- Schneider, H.; Eisenberg, D. Who receives a diagnosis of attention-deficit/hyperactivity disorder in the United States elementary school population? Pediatrics 2006, 117, e601–e609. [Google Scholar] [CrossRef] [PubMed]
- Sclar, D.A.; Robison, L.M.; Bowen, K.A.; Schmidt, J.M.; Castillo, L.V.; Oganov, A.M. Attention-deficit/hyperactivity disorder among children and adolescents in the United States: Trend in diagnosis and use of pharmacotherapy by gender. Clin. Pediatr. 2012, 51, 584–589. [Google Scholar] [CrossRef] [PubMed]
- Byrd, R.S.; Weitzman, M.L. Predictors of early grade retention among children in the United States. Pediatrics 1994, 93, 481–487. [Google Scholar] [PubMed]
- Sirin, S. Socioeconomic status and academic achievement: A meta-analytic review of research. Rev. Educ. Res. 2005, 75, 417–453. [Google Scholar] [CrossRef]
- Ha, M.; Kwon, H.J.; Lim, M.H.; Jee, Y.K.; Hong, Y.C.; Leem, J.H.; Sakong, J.; Bae, J.M.; Hong, S.J.; Roh, Y.M.; et al. Low blood levels of lead and mercury and symptoms of attention deficit hyperactivity in children: A report of the children’s health and environment research (CHEER). Neurotoxicology 2009, 30, 31–36. [Google Scholar] [CrossRef] [PubMed]
- Kim, S.; Arora, M.; Fernandez, C.; Landero, J.; Caruso, J.; Chen, A. Lead, mercury, and cadmium exposure and attention deficit hyperactivity disorder in children. Environ. Res. 2013, 126, 105–110. [Google Scholar] [CrossRef] [PubMed]
- Nicolescu, R.; Petcu, C.; Cordeanu, A.; Fabritius, K.; Schlumpf, M.; Krebs, R.; Kramer, U.; Winneke, G. Environmental exposure to lead, but not other neurotoxic metals, relates to core elements of ADHD in Romanian children: Performance and questionnaire data. Environ. Res. 2010, 110, 476–483. [Google Scholar] [CrossRef] [PubMed]
- Grandjean, P.; Weihe, P.; White, R.F.; Debes, F.; Araki, S.; Yokoyama, K.; Murata, K.; Sorensen, N.; Dahl, R.; Jorgensen, P.J. Cognitive deficit in 7-year-old children with prenatal exposure to methylmercury. Neurotoxicol. Teratol. 1997, 19, 417–428. [Google Scholar] [CrossRef]
- Russell, G.; Ford, T.; Rosenberg, R.; Kelly, S. The association of attention deficit hyperactivity disorder with socioeconomic disadvantage: Alternative explanations and evidence. J. Child Psychol. Psychiatry 2014, 55, 436–445. [Google Scholar] [CrossRef] [PubMed]
- Tran, N.L.; Barraj, L.M.; Bi, X.; Schuda, L.C.; Moya, J. Estimated long-term fish and shellfish intake—National health and nutrition examination survey. J. Expo. Sci. Environ. Epidemiol. 2013, 23, 128–136. [Google Scholar] [CrossRef] [PubMed]
- Getahun, D.; Jacobsen, S.J.; Fassett, M.J.; Chen, W.; Demissie, K.; Rhoads, G.G. Recent trends in childhood attention-deficit/hyperactivity disorder. JAMA Pediatr. 2013, 167, 282–288. [Google Scholar] [CrossRef] [PubMed]
- Robison, L.M.; Sclar, D.A.; Skaer, T.L.; Galin, R.S. National trends in the prevalence of attention-deficit/hyperactivity disorder and the prescribing of methylphenidate among school-age children: 1990–1995. Clin. Pediatr. 1999, 38, 209–217. [Google Scholar] [CrossRef]
- Faraone, S.V.; Sergeant, J.; Gillberg, C.; Biederman, J. The worldwide prevalence of ADHD: Is it an American condition? World Psychiatry 2003, 2, 104–113. [Google Scholar] [PubMed]
- Froehlich, T.E.; Lanphear, B.P.; Epstein, J.N.; Barbaresi, W.J.; Katusic, S.K.; Kahn, R.S. Prevalence, recognition, and treatment of attention-deficit/hyperactivity disorder in a national sample of US children. Arch. Pediatr. Adolesc. Med. 2007, 161, 857–864. [Google Scholar] [CrossRef] [PubMed]
- Ryan, C.; Siebens, J. Educational Attainment in the United States: 2009; U.S. Census Bureau: Washington, DC, USA, 2012.

| Exclusion Criteria | Fish Consumption (N = 1526) | No Fish Consumption (N = 163) | Total (N = 1689) |
|---|---|---|---|
| Not included in previous study a | 294 (19.3) a | 24 (14.7) | 318 (18.8) |
| Missing data on childhood fish consumption | 58 (3.8) b | 0 (0.0) | 73 (4.3) |
| Multiple birth | 28 (1.8) | 7 (4.3) | 35 (2.1) |
| Prenatal exposure to ≥7 alcoholic drinks/week | 19 (1.3) | 3 (1.8) | 22 (1.3) |
| Prenatal exposure to known teratogen | 7 (0.5) | 1 (0.6) | 8 (0.5) |
| History of deafness or blindness | 13 (0.9) | 3 (1.8) | 16 (0.9) |
| Mental retardation | 4 (0.3) | 0 (0.0) | 4 (0.2) |
| Lead poisoning | 6 (0.4) | 0 (0.0) | 6 (0.4) |
| Missing data on key covariates | 25 (1.6) | 3 (1.8) | 28 (1.7) |
| Total eligible c | 1057 (69.3) | 122 (74.9) | 1179 (69.8) |
| Characteristic | Childhood Fish Consumption (Meals) | ||||
|---|---|---|---|---|---|
| None (N = 122) | Once a Month or Less (N = 153) | A Couple of Times a Month (N = 356) | About Once a Week (N = 423) | Several Times a Week (N = 125) | |
| Year of birth | |||||
| 1969–1974 | 21 (17.2) | 29 (19.0) | 81 (22.8) | 122 (28.8) | 44 (35.2) |
| 1975–1980 | 72 (59.0) | 78 (51.0) | 184 (51.7) | 203 (48.0) | 59 (47.2) |
| 1981–1983 | 29 (23.8) | 46 (30.1) | 91 (25.6) | 98 (23.2) | 22 (17.6) |
| Current age (years), mean ± SD | 29.1 ± 3.5 | 28.9 ± 3.8 | 29.6 ± 4.0 | 30.0 ± 3.9 | 30.7 ± 3.9 |
| Male | 52 (42.6) | 52 (34.0) | 145 (40.7) | 168 (39.7) | 54 (43.2) |
| White race | 122 (100.0) | 153 (100.0) | 349 (98.0) | 416 (98.4) | 123 (98.4) |
| Birthweight (grams), mean ± SD a,b | 3480 ± 537 | 3507 ± 500 | 3458 ± 471 | 3460 ± 508 | 3451 ± 494 |
| Preterm (<37 weeks gestation) | 8 (6.6) | 4 (2.6) | 18 (5.1) | 20 (4.7) | 4 (3.2) |
| Participant was breastfed | 70 (57.4) | 94 (62.3) | 222 (63.6) | 273 (66.4) | 76 (62.3) |
| Current level of education | |||||
| High school graduate or less | 17 (13.9) | 27 (17.7) | 38 (10.7) | 42 (9.9) | 20 (16.0) |
| Some college | 37 (30.3) | 32 (20.9) | 96 (27.0) | 88 (20.8) | 33 (26.4) |
| ≥4 years of college | 68 (55.7) | 94 (61.4) | 221 (62.3) | 293 (69.3) | 72 (57.6) |
| Mother’s age at participant’s birth (years), mean ± SD | 27.4 ± 4.3 | 26.6 ± 4.3 | 27.2 ± 4.7 | 27.2 ± 4.4 | 26.3 ± 4.8 |
| Father’s age at participant’s birth (years), mean ± SD | 30.1 ± 6.2 | 28.2 ± 4.5 | 29.7 ± 5.8 | 29.9 ± 5.5 | 28.6 ± 5.6 |
| Mother’s education level at participant’s birth | |||||
| High school graduate or less | 49 (40.2) | 56 (36.6) | 131 (36.8) | 123 (29.1) | 44 (35.2) |
| Some college | 41 (33.6) | 48 (31.4) | 107 (30.1) | 137 (32.4) | 38 (30.4) |
| ≥4 years of college | 32 (26.2) | 49 (32.0) | 118 (33.2) | 163 (38.5) | 43 (34.4) |
| Father’s occupation at participant’s birth | |||||
| White collar | 59 (49.2) | 71 (46.4) | 178 (50.6) | 237 (57.0) | 58 (46.8) |
| Blue collar | 39 (32.5) | 49 (32.0) | 103 (29.3) | 126 (30.3) | 44 (35.5) |
| Other | 22 (18.3) | 33 (21.6) | 71 (20.2) | 53 (12.7) | 22 (17.7) |
| Mother received prenatal care during participant’s gestation | 121 (100.0) | 150 (99.3) | 352 (99.4) | 418 (99.8) | 125 (100.0) |
| Maternal smoking during pregnancy | |||||
| None | 83 (68.6) | 118 (77.1) | 260 (73.9) | 310 (74.0) | 86 (69.4) |
| Smoked ≤ 10 cigarettes a day | 12 (9.9) | 15 (9.8) | 48 (13.6) | 47 (11.2) | 15 (12.1) |
| Smoked ≥ 11 cigarettes a day | 26 (21.5) | 20 (13.1) | 44 (12.5) | 62 (14.8) | 23 (18.6) |
| Maternal alcohol consumption during pregnancy | |||||
| None | 66 (54.6) | 93 (61.6) | 198 (56.4) | 214 (51.0) | 69 (55.7) |
| 1–3 drinks/month | 36 (29.8) | 42 (27.8) | 105 (29.9) | 130 (31.0) | 36 (29.0) |
| ≥1 drink/week | 19 (15.7) | 16 (10.6) | 48 (13.7) | 76 (18.1) | 19 (15.3) |
| Family history of ADD/ADHD | 25 (21.0) | 19 (12.9) | 56 (16.1) | 52 (12.7) | 26 (21.7) |
| Family history of learning disabilities | 22 (19.0) | 21 (14.0) | 77 (22.3) | 76 (19.0) | 31 (25.2) |
| Sometimes consumed high-mercury fish | 0 (0.0) | 46 (30.1) | 172 (48.3) | 279 (66.0) | 99 (79.2) |
| Both pre- and postnatal perchloroethylene (PCE) exposure | 70 (66.7) | 85 (65.9) | 158 (55.1) | 221 (62.6) | 61 (61.0) |
| OR (95% CI) | Childhood Fish Consumption (Meals) | |||||
|---|---|---|---|---|---|---|
| None (N = 122) | Once a Month or Less (N = 153) | A Couple Times a Month (N = 356) | About Once a Week (N = 423) | Several Times a Week (N = 125) | p-Trend a | |
| ADD/ADHD | ||||||
| Events/N | 3/117 | 12/153 | 21/353 | 29/421 | 13/123 | |
| Model 1: Crude logistic | 1.0 (Reference) | 3.2 (0.9–12) | 2.4 (0.7–8.2) | 2.8 (0.8–9.4) | 4.5 (1.2–16) | 0.04 |
| Model 2: Unadjusted GEE | 1.0 (Reference) | 3.2 (0.9–12) | 2.4 (0.7–8.1) | 2.8 (0.8–9.3) | 4.5 (1.2–16) | 0.04 |
| Model 3: Adjusted GEE b | 1.0 (Reference) | 3.8 (1.1–13) | 2.6 (0.8–8.8) | 3.0 (0.9–9.7) | 5.2 (1.5–18) | 0.02 |
| Tutoring for reading | ||||||
| Events/N | 20/122 | 18/152 | 56/355 | 62/417 | 24/124 | |
| Model 1: Crude logistic | 1.0 (Reference) | 0.7 (0.3–1.4) | 1.0 (0.5–1.7) | 0.9 (0.5–1.5) | 1.2 (0.6–2.4) | 0.23 |
| Model 2: Unadjusted GEE | 1.0 (Reference) | 0.7 (0.4–1.3) | 1.0 (0.5–1.7) | 0.9 (0.5–1.5) | 1.2 (0.6–2.3) | 0.26 |
| Model 3: Adjusted GEE b | 1.0 (Reference) | 0.8 (0.4–1.5) | 1.0 (0.6–1.7) | 1.0 (0.6–1.6) | 1.3 (0.7–2.6) | 0.19 |
| Tutoring for math | ||||||
| Events/N | 18/114 | 18/150 | 53/342 | 51/404 | 24/124 | |
| Model 1: Crude logistic | 1.0 (Reference) | 0.7 (0.4–1.5) | 1.0 (0.5–1.8) | 0.8 (0.4–1.4) | 1.3 (0.7–2.5) | 0.23 |
| Model 2: Unadjusted GEE | 1.0 (Reference) | 0.8 (0.4–1.6) | 1.0 (0.5–1.8) | 0.8 (0.4–1.4) | 1.3 (0.6–2.5) | 0.33 |
| Model 3: Adjusted GEE b | 1.0 (Reference) | 0.8 (0.4–1.6) | 1.0 (0.5–1.9) | 0.8 (0.4–1.5) | 1.3 (0.7–2.7) | 0.26 |
| Special class placement c | ||||||
| Events/N | 20/122 | 23/152 | 45/353 | 43/419 | 22/125 | |
| Model 1: Crude logistic | 1.0 (Reference) | 0.9 (0.5–1.7) | 0.7 (0.4–1.3) | 0.6 (0.3–1.0) | 1.1 (0.6–2.1) | 0.56 |
| Model 2: Unadjusted GEE | 1.0 (Reference) | 0.9 (0.5–1.8) | 0.7 (0.4–1.3) | 0.6 (0.3–1.0) | 1.1 (0.6–2.1) | 0.59 |
| Model 3: Adjusted GEE b | 1.0 (Reference) | 1.0 (0.5–2.0) | 0.8 (0.4–1.3) | 0.6 (0.4–1.1) | 1.1 (0.6–2.2) | 0.52 |
| Individualized Education Plan | ||||||
| Events/N | 9/121 | 11/152 | 25/353 | 28/417 | 11/125 | |
| Model 1: Crude logistic | 1.0 (Reference) | 1.0 (0.4–2.4) | 0.9 (0.4–2.1) | 0.9 (0.4–2.0) | 1.2 (0.5–3.0) | 0.59 |
| Model 2: Unadjusted GEE | 1.0 (Reference) | 1.0 (0.4–2.6) | 1.0 (0.4–2.2) | 0.9 (0.4–2.0) | 1.2 (0.5–3.1) | 0.64 |
| Model 3: Adjusted GEE b | 1.0 (Reference) | 1.1 (0.4–2.8) | 1.0 (0.4–2.2) | 1.0 (0.4–2.2) | 1.3 (0.5–3.4) | 0.54 |
| Attend summer school | ||||||
| Events/N | 11/121 | 16/153 | 37/356 | 44/418 | 15/124 | |
| Model 1: Crude logistic | 1.0 (Reference) | 1.2 (0.5–2.6) | 1.2 (0.6–2.4) | 1.2 (0.6–2.4) | 1.4 (0.6–3.1) | 0.49 |
| Model 2: Unadjusted GEE | 1.0 (Reference) | 1.1 (0.6–2.3) | 1.2 (0.6–2.3) | 1.3 (0.5–2.9) | 1.1 (0.6–2.3) | 0.65 |
| Model 3: Adjusted GEE b | 1.0 (Reference) | 1.3 (0.6–3.0) | 1.2 (0.6–2.4) | 1.2 (0.6–2.5) | 1.3 (0.5–3.0) | 0.72 |
| Repeat a grade | ||||||
| Events/N | 9/120 | 12/152 | 41/354 | 55/417 | 16/125 | |
| Model 1: Crude logistic | 1.0 (Reference) | 1.1 (0.4–2.6) | 1.6 (0.8–3.4) | 1.9 (0.9–3.9) | 1.8 (0.8–4.3) | 0.18 |
| Model 2: Unadjusted GEE | 1.0 (Reference) | 1.6 (0.8–3.5) | 1.9 (0.9–3.9) | 1.8 (0.8–4.3) | 1.6 (0.8–3.5) | 0.16 |
| Model 3: Adjusted GEE b | 1.0 (Reference) | 1.2 (0.5–2.9) | 1.7 (0.8–3.6) | 2.1 (1.0–4.4) | 1.9 (0.8–4.5) | 0.18 |
| High school degree or less | ||||||
| Events/N | 17/122 | 27/153 | 38/355 | 42/423 | 20/125 | |
| Model 1: Crude logistic | 1.0 (Reference) | 1.3 (0.7–2.6) | 0.7 (0.4–1.4) | 0.7 (0.4–1.2) | 1.2 (0.6–2.4) | 0.67 |
| Model 2: Unadjusted GEE | 1.0 (Reference) | 1.2 (0.6–2.5) | 0.7 (0.4–1.4) | 0.7 (0.4–1.2) | 1.2 (0.6–2.3) | 0.72 |
| Model 3: Adjusted GEE b | 1.0 (Reference) | 1.4 (0.7–2.8) | 0.8 (0.4–1.6) | 0.9 (0.5–1.6) | 1.4 (0.6–3.0) | 0.39 |
| No Fish Consumption (N = 122) | Eat Fish, Never High-Mercury Varieties (N = 460) | Eat Fish, Occasionally High-Mercury Varieties (N = 535) | Eat Fish, Typically High-Mercury Varieties (N = 62) | |
|---|---|---|---|---|
| Year of birth | ||||
| 1969–1974 | 21 (17.2) | 119 (25.9) | 141 (26.4) | 16 (25.8) |
| 1975–1980 | 72 (59.0) | 243 (52.8) | 255 (47.7) | 26 (41.9) |
| 1981–1983 | 29 (23.8) | 98 (21.3) | 139 (26.0) | 20 (32.3) |
| Current age (years), mean ± SD | 29.1 ± 3.5 | 29.9 ± 3.8 | 29.7 ± 4.0 | 29.2 ± 3.9 |
| Male | 52 (42.6) | 145 (31.5) | 243 (45.4) | 31 (50.0) |
| White race | 122 (100) | 453 (98.5) | 526 (98.3) | 62 (100) |
| Birthweight (grams), mean ± SD a,b | 3480 ± 537 | 3446 ± 512 | 3479 ± 489 | 3482 ± 458 |
| Preterm (<37 weeks gestation) | 8 (6.6) | 20 (4.4) | 22 (4.1) | 4 (6.5) |
| Participant was breastfed | 70 (57.4) | 283 (63.0) | 340 (65.0) | 42 (68.9) |
| Current level of education | ||||
| High school graduate or less | 17 (13.9) | 56 (12.2) | 64 (12.0) | 7 (11.3) |
| Some college | 37 (30.3) | 127 (27.7) | 109 (20.4) | 13 (21.0) |
| ≥4 years of college | 68 (55.7) | 276 (60.1) | 362 (67.7) | 42 (67.7) |
| Mother’s age at participant’s birth (years), mean ± SD | 27.4 ± 4.3 | 26.7 ± 4.5 | 27.3 ± 4.5 | 27.4 ± 4.4 |
| Father’s age at participant’s birth (years), mean ± SD | 30.1 ± 6.2 | 28.9 ± 5.3 | 29.8 ± 5.7 | 29.8 ± 5.4 |
| Mother’s education level at participant’s birth | ||||
| High school graduate or less | 49 (40.2) | 179 (38.9) | 160 (29.9) | 15 (24.2) |
| Some college | 41 (33.6) | 145 (31.5) | 167 (31.2) | 18 (29.0) |
| ≥4 years of college | 32 (26.2) | 136 (29.6) | 208 (38.9) | 29 (46.8) |
| Father’s occupation at participant’s birth | ||||
| White collar | 59 (49.2) | 207 (45.6) | 301 (56.9) | 36 (58.1) |
| Blue collar | 39 (32.5) | 153 (33.7) | 153 (28.9) | 16 (25.8) |
| Other | 22 (18.3) | 94 (20.7) | 75 (14.2) | 10 (16.1) |
| Mother received prenatal care during participant’s gestation | 121 (100) | 454 (99.6) | 530 (99.6) | 61 (100) |
| Maternal smoking during pregnancy | ||||
| None | 83 (68.6) | 338 (74.1) | 393 (74.0) | 43 (70.5) |
| Smoked ≤ 10 cigarettes a day | 12 (9.9) | 58 (12.7) | 58 (10.9) | 9 (14.8) |
| Smoked ≥ 11 cigarettes a day | 26 (21.5) | 60 (13.2) | 80 (15.1) | 9 (14.8) |
| Maternal alcohol consumption during pregnancy | ||||
| None | 66 (54.6) | 263 (57.8) | 278 (52.5) | 33 (54.1) |
| 1–3 drinks/month | 36 (29.8) | 137 (30.1) | 155 (29.3) | 21 (34.4) |
| ≥1 drink/week | 19 (15.7) | 55 (12.1) | 97 (18.3) | 7 (11.5) |
| Family history of ADD/ADHD | 25 (21.0) | 58 (12.9) | 85 (16.5) | 10 (17.0) |
| Family history of learning disabilities | 22 (19.0) | 83 (18.5) | 112 (21.8) | 10 (17.0) |
© 2016 by the authors; licensee MDPI, Basel, Switzerland. This article is an open access article distributed under the terms and conditions of the Creative Commons Attribution (CC-BY) license (http://creativecommons.org/licenses/by/4.0/).
Share and Cite
Carwile, J.L.; Butler, L.J.; Janulewicz, P.A.; Winter, M.R.; Aschengrau, A. Childhood Fish Consumption and Learning and Behavioral Disorders. Int. J. Environ. Res. Public Health 2016, 13, 1069. https://doi.org/10.3390/ijerph13111069
Carwile JL, Butler LJ, Janulewicz PA, Winter MR, Aschengrau A. Childhood Fish Consumption and Learning and Behavioral Disorders. International Journal of Environmental Research and Public Health. 2016; 13(11):1069. https://doi.org/10.3390/ijerph13111069
Chicago/Turabian StyleCarwile, Jenny L., Lindsey J. Butler, Patricia A. Janulewicz, Michael R. Winter, and Ann Aschengrau. 2016. "Childhood Fish Consumption and Learning and Behavioral Disorders" International Journal of Environmental Research and Public Health 13, no. 11: 1069. https://doi.org/10.3390/ijerph13111069
APA StyleCarwile, J. L., Butler, L. J., Janulewicz, P. A., Winter, M. R., & Aschengrau, A. (2016). Childhood Fish Consumption and Learning and Behavioral Disorders. International Journal of Environmental Research and Public Health, 13(11), 1069. https://doi.org/10.3390/ijerph13111069