
Rapid Assessment of Environmental Health Impacts for Policy Support: The Example of Road Transport in New Zealand


Abstract
:1. Introduction
- To demonstrate the feasibility of undertaking simple, speedy assessments of complex policy issues within the context of limited data and prior knowledge;
- To outline some of the methods and approaches that can be applied in this context, including simple approximation and modelling techniques;
- To identify and estimate the scale of uncertainties that arise in the assessment, and compare the results with those from other studies both within New Zealand and overseas;
- To discuss the implications of the results of the assessment for national policy on road transport and associated indicator development in New Zealand.
2. The Context
3. Methods
3.1. Scoping and Framework
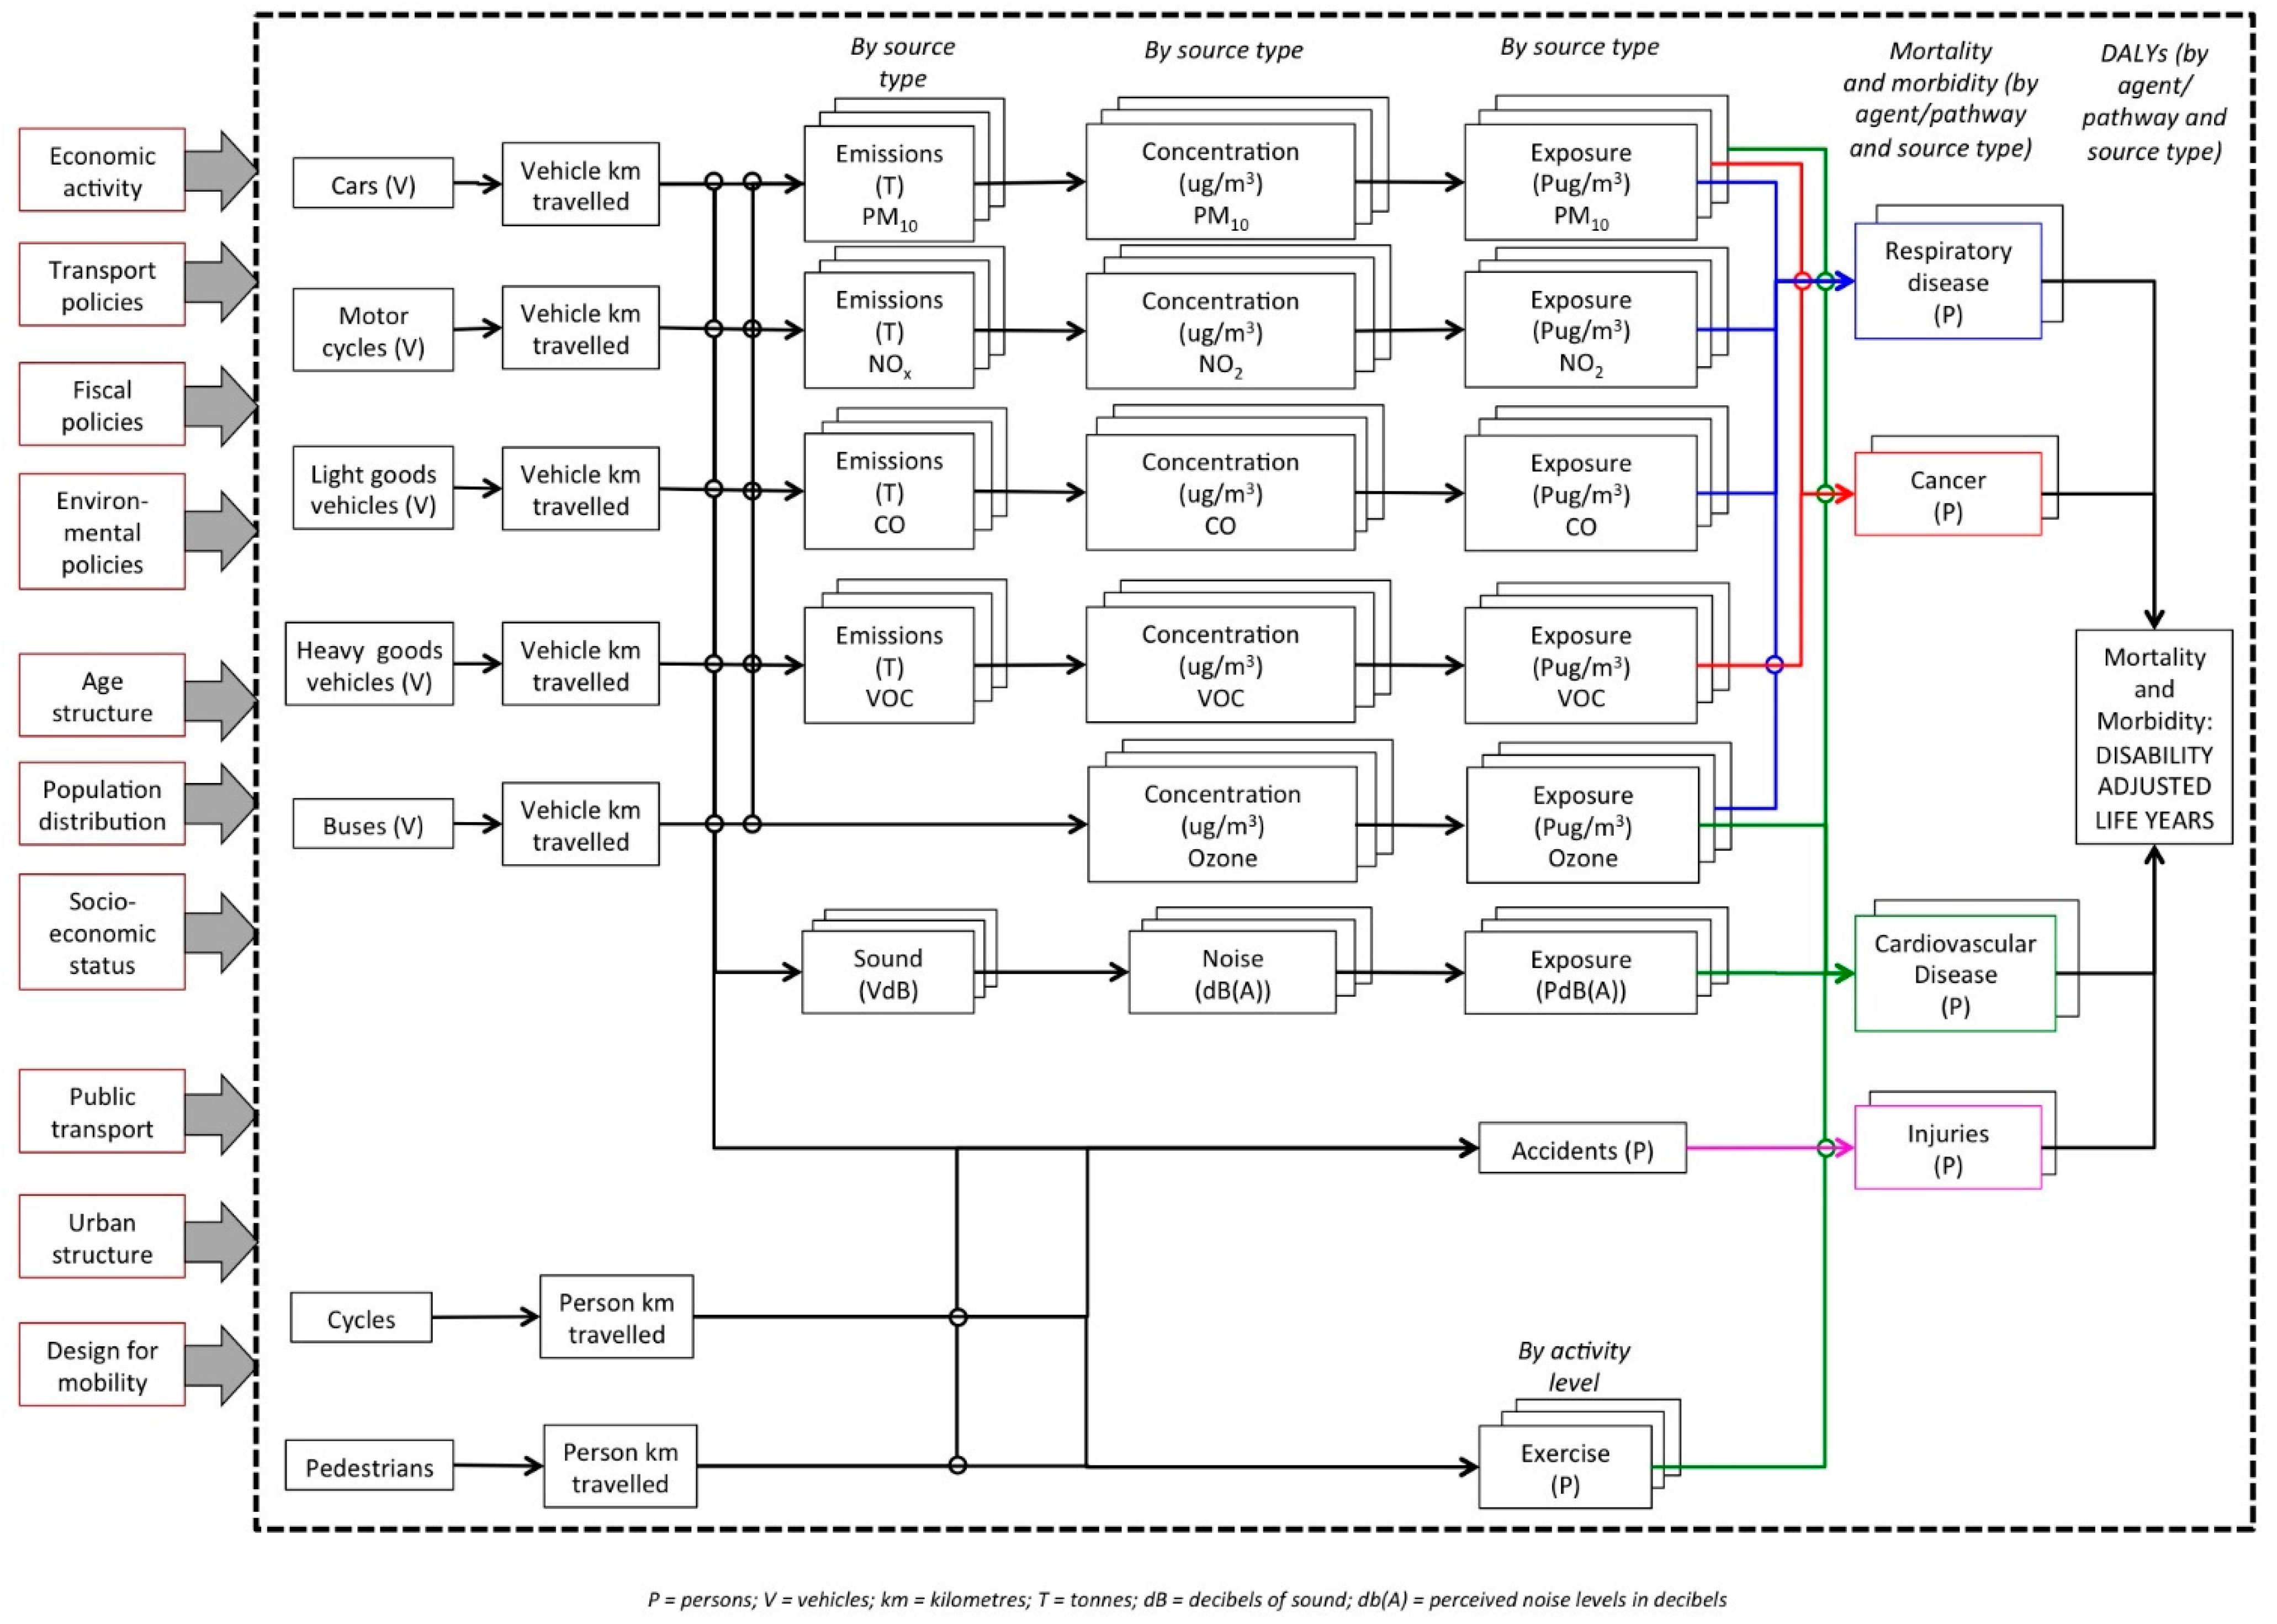
3.1.1. Conceptual Model
3.1.2. Identifying Relevant Exposures and Health Impacts

3.2. Overview of Approach to Estimating Health Burden
3.3. Exposure-Response Functions

| Exposure | Health Outcome | Age Group | Exposure—Response Function/Relative Risk (RR) | Health Data | Source |
|---|---|---|---|---|---|
| Particulate matter (PM10) | All-cause mortality | 30+ years | 1.07 (1.03–1.10) per 10 µg/m3 annual average | All-cause mortality excluding external causes (V00–Y98) | Hales et al. [46] |
| Infants (1 month to 1 year) | 1.05 (1.02–1.08) per 10 µg/m3 annual average | All-cause mortality excluding external causes (V00–Y98) | Lacasana et al. [47] | ||
| Nitrogen dioxide | All-cause mortality | 30+ years | 1.055 (1.031–1.08) per 10 µg/m3 annual average, for levels above 20 µg/m3 | All-cause mortality excluding external causes (V00–Y98) | Atkinson et al. [48] |
| Road traffic noise | Ischaemic heart disease | 30+ years | 1.046 (1.015–1.079) per 10 dBA increase in Lden above 48 dBA | ICD10: I20–I25 | Vienneau et al. [49] |
| Stroke | 30+ years | 1.014 (0.964–1.066) per 10 dBA increase in Lden above 48 dBA | ICD10: I60–I64 (excluding I63.6) | Vienneau et al. [49] | |
| Hypertensive diseases | 30+ years | 1.076 (1.032–1.121) per 10 dBA increase in Lden above 48 dBA | ICD10: I10–I15 | Vienneau et al. [49] | |
| Physical activity 1 | Ischaemic heart disease | 30–64 years | High: RR = 1.00 | ICD10: I20–I25 | Danaei et al. [41] |
| Moderate: RR = 1.15 | |||||
| Low: RR = 1.66 | |||||
| Inactive: RR = 1.97 | |||||
| Ischaemic stroke | 30–64 years | High: RR = 1.00 | Stroke: ICD10: I60–I69 (then applied 36%) | ||
| Moderate: RR = 1.12 | |||||
| Low: RR = 1.23 | |||||
| Inactive: RR = 1.72 | |||||
| Breast cancer | 30–64 years | High: RR = 1.00 | ICD10: C50 | ||
| Moderate: RR = 1.25 | |||||
| Low: RR = 1.41 | |||||
| Inactive: RR = 1.56 (for 30–44 years); 1.67 (for 45–64 years) | |||||
| Colon cancer | 30–64 years | High: RR = 1.00 | ICD10: C18 | ||
| Moderate: RR = 1.07 | |||||
| Low: RR = 1.27 | |||||
| Inactive: RR = 1.80 | |||||
| Diabetes mellitus (type 2) | 30–64 years | High: RR = 1.00 | ICD10: E11 | ||
| Moderate: RR = 1.21 | |||||
| Low: RR = 1.50 | |||||
| Inactive: RR =1.76 | |||||
| Traffic injuries | Deaths and injuries from road transport | All ages | 100% attributable | Road transport injuries from ICD10: V00–V89 |
3.4. Data and Analysis
3.4.1. Traffic Injuries
3.4.2. Particulate Matter
3.4.3. Nitrogen Dioxide
3.4.4. Road Traffic Noise
3.4.5. Physical Activity
3.4.6. Health Data
3.4.7. Estimating Health Impacts by Transport Mode
3.4.8. Estimating Uncertainties
4. Results
4.1. Attributable Health Burden from Road Transport
| Agent/Pathway | Outcomes | Mode/Agent | Estimated Attributable Burden (2012) | ||||||
|---|---|---|---|---|---|---|---|---|---|
| Deaths (% of Total) | Years of Life Lost (YLLs) (% of Total) | YLD/YLL Ratio | DALYs (% of Total) | ||||||
| Traffic injuries | Road transport injuries | Total road transport deaths | 308 | (47%) | 13,974 | (73%) | 21,244 | (80%) | |
| Cars/HGVs | 217 | (33%) | 9990 | (53%) | 0.53 | 15,264 | (57%) | ||
| Motorcycles | 50 | (8%) | 2202 | (11%) | 0.47 | 3231 | (12%) | ||
| Pedestrians | 33 | (5%) | 1487 | (8%) | 0.53 | 2279 | (9%) | ||
| Cyclists | 8 | (1%) | 296 | (2%) | 0.59 | 469 | (2%) | ||
| Air pollution | All-cause mortality (30+ years) | Air pollution | 283 | (44%) | 4449 | (23%) | 0 | 4449 | (17%) |
| PM10 | 218 | (34%) | 3426 | (18%) | 3426 | (13%) | |||
| Nitrogen dioxide | 65 | (10%) | 1023 | (5%) | 1023 | (4%) | |||
| Road traffic noise | IHD, stroke, hypertensive diseases (30+ years) | Noise from road vehicles | 59 | (9%) | 821 | (4%) | 917 | (3%) | |
| IHD | 49 | 685 | 0.11 | 762 | (3%) | ||||
| Stroke | 6 | 79 | 0.15 | 91 | (<1%) | ||||
| Hypertensive diseases | 5 | 57 | 0.12 | 64 | (<1%) | ||||
| Total (adverse effects) | 650 | 19,244 | 26,610 | ||||||
| Physical activity | IHD, ischaemic stroke, diabetes, breast cancer, colon cancer (30–64 years) | Current use of active transport to work (current health savings) | −40 | −1,429 | −1874 | ||||
| IHD | −30 | −1043 | −1216 | ||||||
| Ischaemic stroke | −1 | −25 | −43 | ||||||
| Diabetes | −3 | −115 | −355 | ||||||
| Breast cancer | −3 | −131 | −142 | ||||||
| Colon cancer | −3 | −115 | −119 | ||||||
| Total (net) | 610 | 17,815 | 24,736 | ||||||
4.2. Results by Transport Mode
| Transport Mode | Billion Vehicle km Travelled (% total) 2 | Estimated Number of Attributable Deaths, by Source 1 | |||||
|---|---|---|---|---|---|---|---|
| Traffic Injuries | PM10 | NO2 | Noise | Total (%) | Deaths per Billion Vehicle km Travelled | ||
| Cars | 30.6 (74.3) | 172 | 94 | 28 | 46 | 340 (52.3) | 10.7 |
| LGV | 6.1 (14.8) | 33 | 61 | 18 | 9 | 121 (18.6) | 19.8 |
| HGV | 2.6 (6.3) | 52 | 60 | 18 | 4 | 134 (20.6) | 51.5 |
| Buses | 0.2 (0.5) | 1 | 2 | 1 | 0 | 4 (0.6) | 20.0 |
| Motorcycles | 0.4 (1.0) | 50 | 1 | 0 | 0 | 51 (7.8) | 127.5 |
| Total | 40.0 | 308 | 218 | 65 | 59 | 650 | 16.3 |
4.3. Uncertainties
5. Discussion
5.1. Key Findings
5.2. International Comparisons
5.3. Policy Implications
5.4. Developing Environmental Health Indicators
6. Conclusions
Acknowledgments
Author Contributions
Conflicts of Interest
Appendix
| Transport mode (Victim) | Distance (bkm) | Hours (Million) | Deaths | Injuries | Deaths (%) | Injuries (%) | Deaths/1b km | Deaths/1m h | Injuries/1b km | Injuries/1m h |
|---|---|---|---|---|---|---|---|---|---|---|
| HGV | 2.6 | 70 | 10 | 246 | 3.2 | 2.0 | 3.8 | 0.14 | 94.6 | 3.5 |
| Car/LGV | 36.7 | 991 | 207 | 8975 | 67.2 | 74.3 | 5.6 | 0.21 | 244.6 | 9.1 |
| Motorcycle | 0.4 | 6 | 50 | 1138 | 16.2 | 9.4 | 125.0 | 8.33 | 2845.0 | 189.7 |
| Cyclist | 0.31 | 25 | 8 | 798 | 2.6 | 6.6 | 25.8 | 0.32 | 2574.2 | 31.9 |
| Pedestrian | 0.81 | 205 | 33 | 917 | 10.7 | 7.6 | 40.7 | 0.16 | 1132.1 | 4.5 |
| Total/Average | 40.8 | 1297 | 308 | 12,074 | 100 | 100 | 7.5 | 0.24 | 295.8 | 9.3 |
| Pathway | Assumption in Best Estimate | Alternative Condition | Attributable Deaths |
|---|---|---|---|
| Road accidents | Baseline scenario | 308 | |
| Use traffic accident statistics for 2012 | Use traffic accident statistics, averaged over 5 years (2010–2014) | 303 | |
| Particulate matter (PM10) | Baseline scenario | 218 | |
| Assume that the proportion of deaths attributable to motor vehicles has remained at 22% from 2006 to 2012 | Use a lower proportion for motor vehicles than in 2006 (15% attributable) | 150 | |
| Use a higher proportion for motor vehicles than in 2006 (30% attributable) | 300 | ||
| Physical activity | Baseline scenario | −40 | |
| 346,000 people currently commuting by active transport | 150,000 people currently commuting by active transport (2013 Census) | −17 | |
| 500,000 people raised to moderate activity as result of combined effects of routine commuting (346,000 people) and social trips (140,000) by active transport | −58 | ||
| Nitrogen dioxide | Baseline scenario | 65 | |
| Relative risks/exposure-response function—best estimate used | Use lower and upper bounds of relative risks | 37–94 | |
| Road traffic noise | Baseline scenario | 59 | |
| Relative risks/exposure-response function—best estimate used | Use lower and upper bounds of relative risks | 12–80 |
References
- Bollen, J.; Hers, S.; van der Zwaan, B. An integrated assessment of climate change, air pollution, and energy security policy. Energ. Policy 2010, 38, 4021–4030. [Google Scholar] [CrossRef]
- Hellman, F.; Verburg, P.H. Impact assessment of the European biofuel directive on land use and biodiversity. J. Environ. Manag. 2010, 91, 1389–1396. [Google Scholar] [CrossRef] [PubMed]
- van Delden, H.; Stuczynski, T.; Ciaian, P.; Paracchini, M.L.; Hurkens, J.; Lopatka, A.; Shi, Y.; Prieto, O.G.; Calvo, S.; van Vliet, J.; et al. Integrated assessment of agricultural policies with dynamic land use change modelling. Ecol. Model 2010, 221, 2153–2166. [Google Scholar] [CrossRef]
- Briggs, D.J. A framework for integrated environmental health impact assessment of systemic risks. Environ. Health 2008, 7. [Google Scholar] [CrossRef] [PubMed]
- Prüss-Ustün, A.; Mathers, C.; Corvalán, C.; Woodward, A. Introduction and Methods: Assessing the Environmental Burden of Disease at National and Local Levels; WHO: Geneva, Switzerland, 2003. [Google Scholar]
- Pastakia, C.M.R.; Jensen, A. The rapid impact assessment matrix (RIAM) for EIA. Environ. Impact Assess. Rev. 1998, 18, 461–482. [Google Scholar] [CrossRef]
- Davenport, C.; Mathers, J.; Parry, J. Use of health impact assessment in incorporating health considerations in decision making. J. Epidemiol. Commun. Health 2003, 60, 196–201. [Google Scholar] [CrossRef] [PubMed]
- Mindell, J.; Ison, E.; Joffe, M. A glossary for health impact assessment. J. Epidemiol. Commun. Health 2003, 57. [Google Scholar] [CrossRef]
- Mindell, J.; Sheridan, L.; Joffe, M.; Samson-Barry, H.; Atkinson, S. Health impact assessment as an agent of policy change: Improving the health impacts of the mayor of London’s draft transport strategy. J. Epidemiol. Commun. Health 2004, 58, 169–174. [Google Scholar] [CrossRef]
- The Treasury. Financial Statements of the Government of New Zealand for the Year Ended 30 June 2014; The Treasury: Wellington, New Zealand, 2014.
- New Zealand Transport Agency State Highway Frequently Asked Questions. Available online: https://www.nzta.govt.nz/roads-and-rail/research-and-data/state-highway-frequently-asked-questions/#state-highways (accessed on 20 August 2015).
- Ministry of Transport. Comparing Travel Modes. New Zealand Household Travel Survey 2011–2014; New Zealand Government: Wellington, New Zealand, 2015.
- World Bank. Passenger Cars (per 1000 People). Available online: http://data.worldbank.org/indicator/IS.VEH.PCAR.P3/countries?display=default (accessed on 20 August 2015).
- Ministry of Transport. Freight and the Transport Industry: Freight Volume. Available online: http://www.transport.govt.nz/ourwork/tmif/freighttransportindustry/ft007/ (accessed on 20 August 2015).
- Ministry of Transport. Motor Vehicle Crashes in New Zealand 2014. Available online: http://www.transport.govt.nz/research/roadcrashstatistics/motorvehiclecrashesinnewzealand/motor-vehicle-crashes-in-new-zealand-2014 (accessed on 1 September 2015).
- International Transport Forum. Road Safety Report 2015, Summary; OECD/ITF: Paris, France, 2015. [Google Scholar]
- Fisher, G.; Kjellstom, T.; Hales, S.; Shrestha, R.; Sturman, A.; Sherman, M.; Fallon, C.O.; Cavanagh, J.E.; Durand, M. Health and Air Pollution in New Zealand Main Report; Health Research Council of New Zealand: Auckland, New Zealand, 2007. [Google Scholar]
- Kuschel, G.; Metcalfe, J.; Wilton, E.; Guria, J.; Hales, S.; Rolfe, K.; Woodward, A. Updated Health and Air Pollution in New Zealand Study; Emission Impossible Ltd.: Auckland, New Zealand, 2012. [Google Scholar]
- Ministry for the Environment and Statistics New Zealand. New Zealand’s Environmental Reporting Series: 2014 Air Domain Report; Ministry for the Environment: Wellington, New Zealand, 2014.
- Lindsay, G.; Macmillan, A.; Woodward, A. Moving urban trips from cars to bicycles: Impact on health and emissions. Aust. N.Z. J. Public Health 2011, 35, 54–60. [Google Scholar] [CrossRef] [PubMed]
- Dora, C. A different route to health: Implications of transport policies. Brit. Med. J. 1999, 318, 1686–1689. [Google Scholar] [CrossRef] [PubMed]
- Dora, C.; Phillips, M. Transport, Environment and Health (No. 89); WHO Regional Office Europe: Copenhagen, Denmark, 2008. [Google Scholar]
- Kjellström, T.; Hill, S. New Zealand Evidence for Health Impacts of Transport: A Background Paper Prepared for the Public Health Advisory Committee; National Health Committee: Wellington, New Zealand, 2002. [Google Scholar]
- Kjellström, T.; van Kerkhoff, L.; Bammer, G.; McMichael, T. Comparative assessment of transport risks: How it can contribute to health impact assessment of transport policies. Bull. WHO 2003, 81, 451–457. [Google Scholar] [PubMed]
- Thomson, H.; Jepson, R.; Hurley, F.; Douglas, M. Assessing the unintended health impacts of road transport policies and interventions: Translating research evidence for use in policy and practice. BMC Public Health 2008, 8. [Google Scholar] [CrossRef] [PubMed]
- Beelen, R.; Rasschou-Nielsen, O.; Staffogia, M.; Andersen, Z.J.; Weinmayr, G.; Hoffmann, B.; Wolf, K.; Samoli, E.; Fischer, P.; Nieuwenhuijsen, M.; et al. Effects of long-term exposure to air pollution on natural-cause mortality: An analysis of 22 European cohorts within the multicentre ESCAPE project. Lancet 2014, 383, 785–795. [Google Scholar] [CrossRef]
- Hoek, G.; Krishnan, R.M.; Beelen, R.; Peters, A.; Ostro, B.; Brunekreef, B.; Kaufman, J.D. Long-term air pollution exposure and cardio-respiratory mortality: A review. Environ. Health 2013, 12. [Google Scholar] [CrossRef] [PubMed]
- Pedersen, M.; Giorgis-Allemand, L.; Bernard, C.; Aguilera, I.; Andersen, A.-M.N.; Ballester, F.; Beelen, R.M.J.; Chatzi, L.; Cirach, M.; Danileviciute, A.; et al. Ambient air pollution and low birthweight: A European cohort study (ESCAPE). Lancet Resp. Med. 2013, 1, 695–704. [Google Scholar] [CrossRef]
- Stafoggia, M.; Cesaroni, G.; Peters, A.; Andersen, Z.J.; Badaloni, C.; Beelen, R.; Caracciolo, B.; Cyrys, J.; de Faire, U.; de Hoogh, K.; et al. Long-term exposure to ambient air pollution and incidence of cerebrovascular events: Results from 11 European cohorts within the ESCAPE project. Environ. Health Perspect. 2014, 122, 919–925. [Google Scholar] [CrossRef] [PubMed]
- WHO Regional Office for Europe. Review of Evidence on Health Aspects of Air Pollution—REVIHAAP Project; World Health Organization: Bonn, Germany, 2013. [Google Scholar]
- Rückerl, R.; Schneider, A.; Breitner, S.; Cyrys, J.; Peters, A. Health effects of particulate air pollution: A review of epidemiological evidence. Inhal. Toxicol. 2011, 23, 555–592. [Google Scholar] [CrossRef] [PubMed]
- Jacquemin, B.; Sunyer, J.; Forsberg, B.; Aguilera, I.; Briggs, D.; García-Esteban, R.; Gotschi, T.; Heinrich, J.; Jarvholm, B.; Jarvis, D.; et al. Home outdoor NO2 and new onset of self-reported asthma in adults. Epidemiology 2009, 20, 119–126. [Google Scholar] [CrossRef] [PubMed]
- Foraster, M. Is it traffic-related air pollution or road traffic noise, or both? Key questions not yet settled! Int. J. Public Health 2013, 58, 647–648. [Google Scholar] [CrossRef] [PubMed][Green Version]
- Stansfeld, S.A. Noise effects on public health in the context of air pollution exposure. Int. J. Environ. Res. Public Health 2015, 12, 12735–12760. [Google Scholar] [CrossRef] [PubMed]
- Babisch, W.; Neuhauser, H.; Thamm, M.; Seiwert, M. Blood pressure of 8–14 year old children in relation to traffic noise at home—Results of the German Environmental Survey for Children (GerES IV). Sci. Total Environ. 2009, 407, 5839–5843. [Google Scholar] [CrossRef] [PubMed]
- Bluhm, G.L.; Berglind, N.; Nordling, E.; Rosenlund, M. Road traffic noise and hypertension. Occup. Environ. Med. 2007, 64, 122–126. [Google Scholar] [CrossRef] [PubMed]
- van Kampen, E.; Babisch, W. The quantitative relationship between road traffic noise and hypertension: A meta-analysis. J. Hypertens. 2012, 30, 1075–1086. [Google Scholar] [CrossRef] [PubMed]
- Pucher, J.; Dill, J.; Handy, S. Infrastructure, programs, and policies to increase bicycling: An international review. Prev. Med. 2010, 50, S106–S125. [Google Scholar] [CrossRef] [PubMed]
- De Nazelle, A.; Nieuwenhuijsen, M.J.; Antó, J.M.; Brauer, M.; Briggs, D.; Braun-Fahrlander, C.; Cavill, N.; Cooper, A.R.; Desqueyroux, H.; Fruin, S.; et al. Improving health through policies that promote active travel: A review of evidence to support integrated health impact assessment. Environ. Int. 2011, 37, 766–777. [Google Scholar] [CrossRef] [PubMed]
- Allender, S.; Foster, C.; Scarborough, P.; Rayner, M. The burden of physical activity-related ill health in the UK. J. Epidemiol. Commun. Health 2007, 61, 344–348. [Google Scholar] [CrossRef] [PubMed]
- Danaei, G.; Ding, E.L.; Mozaffarian, D.; Taylor, B.; Rehm, J.; Murray, C.J.; Ezzati, M. The preventable causes of death in the United States: Comparative risk assessment of dietary, lifestyle, and metabolic risk factors. PLoS Med. 2009, 6. [Google Scholar] [CrossRef] [PubMed]
- Nocon, M.; Hiemann, T.; Müller-Riemenschneider, F.; Thalau, F.; Roll, S.; Willich, S.N. Association of physical activity with all-cause and cardiovascular mortality: A systematic review and meta-analysis. Eur. J. Cardiov. Prev. Rehabil. 2008, 15, 239–246. [Google Scholar] [CrossRef] [PubMed]
- Kjellström, T.; Ferguson, R.; Taylor, A. Health impact assessment of road transport in Sweden: A discussion paper describing the development and testing of HIA methodology. In Health Impact Assessment and Public Health Costs of the Road Transport Sector—Results from Two Studies; Lindström, K., Ed.; Swedish Road Administration: Stockholm, Sweden, 2009. [Google Scholar]
- Barendreg, J.J.; Veerman, J.L. Categorical versus continuous risk factors and the calculation of potential impact fractions. J. Epidemiol. Commun. Health 2010, 64, 209–212. [Google Scholar] [CrossRef] [PubMed]
- Cohen, A.J.; Anderson, R.; Ostro, B.; Pandey, K.D.; Krzyzanowski, M.; Künzli, N.; Gutschmidt, K.; Pope, C.A.; Romieu, I.; Samet, J.M.; et al. Urban air pollution. In Comparative Quantification of Health Risks: Global and Regional Burden of Disease Attributable to Selected Major Risk Factors; Ezzati, M., Lopez, A.D., Rodgers, A.R., Murray, J.L., Eds.; World Health Organization: Geneva, Switzerland, 2004. [Google Scholar]
- Hales, S.; Blakely, T.; Woodward, A. Air pollution and mortality in New Zealand: Cohort study. J. Epidemiol. Commun. Health 2010. [Google Scholar] [CrossRef] [PubMed]
- Lacasaña, M.; Esplugues, A.; Ballester, F. Exposure to ambient air pollution and prenatal and early childhood health effects. Eur. J. Epidemiol. 2005, 20, 183–199. [Google Scholar] [CrossRef] [PubMed]
- Atkinson, R.; Forastiere, F.; Hurley, F.; Krzyzanowski, M.; Mills, I.; Ostro, B.; Walton, H. HRAPIE Project Recommendations for Concentration-Response Functions for Cost-Benefit Analysis of Particulate Matter, Ozone and Nitrogen Dioxide; WHO Regional Office for Europe: Copenhagen, Denmark, 2013. [Google Scholar]
- Vienneau, D.; Perez, L.; Schindler, C.; Lieb, C.; Sommer, H.; Probst-Hensch, N.; Künzli, N.; Röösli, M. Years of life lost and morbidity cases attributable to transportation noise and air pollution: A comparative health risk assessment for Switzerland in 2010. Int. J. Hyg. Environ. Health 2015. [Google Scholar] [CrossRef] [PubMed]
- Ministry of Transport. Motor Vehicle Crashes in New Zealand 2012: Statistical Statement Calendar Year 2012; New Zealand Government: Wellington, New Zealand, 2013.
- Parliamentary Counsel Office. Resource Management Act 1991. Available online: http://www.legislation.govt.nz/act/public/1991/0069/latest/whole.html#DLM230265 (accessed on 20 August 2015).
- Gulliver, J.; Morley, D.; Vienneau, D.; Fabbri, F.; Bell, M.; Goodman, P.; Beevers, S.; Dajnak, D.; Kelly, F.; Fecht, D. Development of an open-source road traffic noise model for exposure assessment. Environ. Modell. Softw. 2015. [Google Scholar] [CrossRef]
- Vienneau, D.; Schindler, C.; Perez, L.; Probst-Hensch, N.; Röösli, M. The relationship between transport noise exposure and ischemic heart disease: A meta-analysis. Environ. Res. 2015, 138, 372–380. [Google Scholar] [CrossRef] [PubMed]
- Ministry of Health. Ways and Means: A Report on Methodology from the New Zealand Burden of Diseases, Injuries and Risk Factors Study, 2006-2-16; Ministry of Health: Wellington, New Zealand, 2013.
- Ministry of Health. The Health of New Zealand Adults 2011/12: Key Findings of the New Zealand Health Survey; Ministry of Health: Wellington, New Zealand, 2012.
- Krishnamurthi, R.V.; Feigin, V.L.; Forouzanfar, M.H.; Mensah, G.A.; Connor, M.; Bennett, D.A.; Moran, A.E.; Sacco, R.L.; Anderson, L.M.; Truelsen, T.; et al. Global and regional burden of first-ever ischaemic and haemorrhagic stroke during 1990–2010: Findings from the Global Burden of Disease Study 2010. Lancet 2012, 1. [Google Scholar] [CrossRef]
- Ministry of Health. Mortality 2012 Online Tables. Available online: http://www.health.govt.nz/publication/mortality-2012-online-tables (accessed on 20 August 2012).
- Institute of Health Metrics and Evaluation. Country Profiles, New Zealand. Available online: http://www.healthdata.org/new-zealand (accessed on 20 August 2012).
- Murray, C.J.L.; Vos, T.; Lozano, R.; Naghavi, M.N.; Flaxman, A.D.; Michaud, C.; Ezzati, M.; Shibuya, K.; Salomon, J.A.; Abdalla, S.; et al. Disability-adjusted life years (DALYs) for 291 diseases and injuries in 21 regions, 1990–2010: A systematic analysis for the Global Burden of Disease Study 2010. Lancet 2012, 380, 2197–2223. [Google Scholar] [CrossRef]
- Auckland Council. Auckland Motor Vehicle Emissions Inventory. Technical Report 2014/029; Auckland Council: Auckland, New Zealand, 2012. [Google Scholar]
- Briggs, D.J.; Sabel, C.E.; Lee, K. Uncertainty in epidemiology and health risk and impact assessment. Environ. Geochem. Health 2009, 31, 189–203. [Google Scholar] [CrossRef] [PubMed]
- Knol, A.B.; Petersen, A.C.; ven der Sluijs, J.P.; Lebret, E. Dealing with uncertainties in environmental burden of disease assessment. Environ. Health 2009, 8. [Google Scholar] [CrossRef] [PubMed]
- Forastiere, F.; Badaloni, C.; de Hoogh, K.; von Kraus, M.K.; Martuzzi, M.; Mitis, F.; Palkovicova, L.; Porta, D.; Preiss, P.; Ranzi, A.; et al. Health impact assessment of waste management facilities in three European countries. Environ. Health 2011, 10. [Google Scholar] [CrossRef] [PubMed]
- Knol, A.B.; de Hartog, J.J.; Boogaard, H.; Slottje, P.; van der Sluijs, J.P.; Lebret, E.; Cassee, F.R.; Wardekker, J.A.; Ayres, J.G.; Borm, P.J.; et al. Expert elicitation on ultrafine particles: Likelihood of health effects and causal pathways. Part. Fibre Toxicol. 2009, 6. [Google Scholar] [CrossRef] [PubMed]
- Intergovernmental Panel on Climate Change. Guidance Notes for Lead Authors on the IPCC Fourth Assessment Report on Addressing Uncertainty. Available online: https://www.ipcc.ch/pdf/supporting-material/uncertainty-guidance-note.pdf (accessed on 1 September 2015).
- Hoek, G.; Beelen, R.; de Hoogh, K.; Vienneau, D.; Gulliver, J.; Fischer, P.; Briggs, D. A review of land-use regression models to assess spatial variation of outdoor air pollution. Atmos. Environ. 2008, 42, 7561–7578. [Google Scholar] [CrossRef]
- Briggs, D.J. Risk communication and stakeholder participation in the governance of systemic environmental health risks. Int. J. Risk Assess. Manag. 2009, 13, 195–215. [Google Scholar] [CrossRef]
- Knol, A.B.; Staatsen, B.A.M. Trends in the Environmental Burden of Disease in the Netherlands, 1980–2020; RIVM: Bilthoven, The Netherlands, 2005. [Google Scholar]
- Institute for Health Metrics and Evaluation. Global Burden of Disease Study 2010: New Zealand Global Burden of Disease Study 2010 (GBD 2010) Results 1990–2010; IHME: Seattle, WA, USA, 2013. [Google Scholar]
- Hänninen, O.; Knol, A.B.; Jantunen, M.; Lim, T.-A.; Conrad, A.; Rappolder, M.; Carrer, P.; Fanetti, A.-C.; Kim, R.; Buekers, J.; et al. Environmental burden of disease in Europe: Assessing nine risk factors in six countries. Environ. Health Perspect. 2015, 122, 439–446. [Google Scholar] [CrossRef] [PubMed]
- Stassen, K.R.; Collier, P.; Torfs, R. Environmental burden of disease due to transportation noise in Flanders (Belgium). Transp. Environ. 2008, 13, 355–358. [Google Scholar] [CrossRef]
- Bureau of Transport and Regional Economics. Health Impacts of Transport Emissions in Australia: Economic Costs; Commonwealth of Australia: Canberra, Australia, 2005. [Google Scholar]
- Xia, T.; Nitschke, M.; Zhang, Y.; Shah, P.; Crabb, S.; Hansen, A. Traffic-related air pollution and health co-benefits of alternative transport in Adelaide, South Australia. Environ. Int. 2015, 74, 281–290. [Google Scholar] [CrossRef] [PubMed]
- Rojas-Rueda, D.; de Nazelle, A.; Texeidó, O.; Nieuwenhuijsen, M.J. Replacing car trips by increasing bike and public transport in the greater Barcelona metropolitan are: A health impact assessment study. Environ. Int. 2012, 49, 100–109. [Google Scholar] [CrossRef] [PubMed]
- Briggs, D.J. Methods for building environmental health indicators. In Decision-Making in Environmental Health: From Evidence to Action; Corvalan, C., Briggs, D.J., Zielhuis, G., Eds.; SPON Routledge: London, UK, 2003; pp. 57–75. [Google Scholar]
- Corvalan, C.; Briggs, D.; Kjellström, T. Development of environmental health indicators. In Linkage Methods for Environment and Health Analysis; Briggs, D., Corvalan, C., Nurminen, M., Eds.; UNEP, USEPA and WHO: Geneva, Switzerland, 1996; pp. 19–53. [Google Scholar]
- Tisch, C.; L. Pearson, A.; Kingham, S.; Borman, B.; Briggs, D. Environmental health indicators: A review of initiatives worldwide. Manag. Environ. Qual. Int. J. 2014, 25, 446–466. [Google Scholar] [CrossRef]
- European Environment Agency. Indicators. Available online: http://www.eea.europa.eu/data-and-maps/indicators/#c5=transport&c0=20&b_start=0 (accessed on 20 August 2015).
- Ministry of Transport. All Indicators by Number. Available online: http://www.transport.govt.nz/ourwork/tmif/allindicatorsbynumber/ (accessed on 20 August 2015).
- Murphy, E.; King, E.A. Strategic environmental noise mapping: Methodological issues concerning the implementation of the EU Environmental Noise Directive and their policy implications. Environ. Int. 2010, 36, 290–298. [Google Scholar] [CrossRef] [PubMed]
- Pearce, J.R.; Richardson, E.A.; Mitchell, R.J.; Shortt, N.K. Environmental justice and health: A study of multiple environmental deprivation and geographical inequalities in health in New Zealand. Soc. Sci. Med. 2011, 73, 410–420. [Google Scholar] [CrossRef] [PubMed]
© 2015 by the authors; licensee MDPI, Basel, Switzerland. This article is an open access article distributed under the terms and conditions of the Creative Commons by Attribution (CC-BY) license (http://creativecommons.org/licenses/by/4.0/).
Share and Cite
Briggs, D.; Mason, K.; Borman, B. Rapid Assessment of Environmental Health Impacts for Policy Support: The Example of Road Transport in New Zealand. Int. J. Environ. Res. Public Health 2016, 13, 61. https://doi.org/10.3390/ijerph13010061
Briggs D, Mason K, Borman B. Rapid Assessment of Environmental Health Impacts for Policy Support: The Example of Road Transport in New Zealand. International Journal of Environmental Research and Public Health. 2016; 13(1):61. https://doi.org/10.3390/ijerph13010061
Chicago/Turabian StyleBriggs, David, Kylie Mason, and Barry Borman. 2016. "Rapid Assessment of Environmental Health Impacts for Policy Support: The Example of Road Transport in New Zealand" International Journal of Environmental Research and Public Health 13, no. 1: 61. https://doi.org/10.3390/ijerph13010061
APA StyleBriggs, D., Mason, K., & Borman, B. (2016). Rapid Assessment of Environmental Health Impacts for Policy Support: The Example of Road Transport in New Zealand. International Journal of Environmental Research and Public Health, 13(1), 61. https://doi.org/10.3390/ijerph13010061