3.1. Concentrations of Heavy Metals in Soils
Heavy metal concentrations in the agricultural soils investigated in this study are shown in
Table 3. A wide range of heavy metals concentrations (As: 8.47–341.33 mg/kg, Pb: 19.91–837.52 mg/kg, Cu: 8.41–148.73 mg/kg, Cd: 0.35–6.47 mg/kg) was found in the soil samples collected from various cultivated lands in Suxian County (
Table 3). Compared with heavy metal concentrations in control soils (with mean values for As, Pb, Cu and Cd of 53.77 mg/kg, 64.34 mg/kg, 36.57 mg/kg, and 2.41 mg/kg, respectively), all heavy metals concentrations in the three functional areas were greatly elevated by the anthropogenic mining industry activities (
Table 4). The highest concentrations of soil heavy metals were found at Mining Area A, where the mean concentrations of As, Pb, Cu and Cd were 244.25 mg/kg, 540.07 mg/kg, 111.03 mg/kg, and 5.72 mg/kg, respectively. The mean concentrations of heavy metals in functional areas B and C were also higher than those from control area D, by approximately 1.5–5 times.
The MPLs (maximum permissible levels) of soil heavy metals are generally used to assess the pollution level of As (30 mg/kg), Pb (300 mg/kg), Cu (100 mg/kg) and Cd (0.3 mg/kg) in agricultural soils. In all soil samples, As and Cd concentrations exceeding their MPLs were found in a significant proportion of the samples: approximately 32.5% and 41.2% of the soil samples, respectively, were found to contain As and Cd concentrations exceeding their Chinese MPLs [
32]. The concentrations of the four heavy metals exceeded their MPLs according to Chinese standards for soil samples in all three functional areas. In contrast, within the scope of the control area, the vast majority of the sampled concentrations for the four heavy metals were lower than their respective Chinese MPLs standards.
Table 4.
Mean concentrations of heavy metals in soils from different functional areas (mg/kg d.m.).
Table 4.
Mean concentrations of heavy metals in soils from different functional areas (mg/kg d.m.).
| As | Pb | Cu | Cd |
|---|
| Mining Area A | 244.25 | 540.07 | 111.03 | 5.72 |
| Smelting Area B | 153.92 | 97.92 | 49.95 | 3.28 |
| Processing Area C | 170.84 | 315.29 | 93.99 | 5.06 |
| Control Area D | 53.77 | 64.34 | 36.57 | 2.41 |
Samples of paddy and vegetable soils in different functional areas to one another were compared using the paired samples
T-test and showed significant differences (
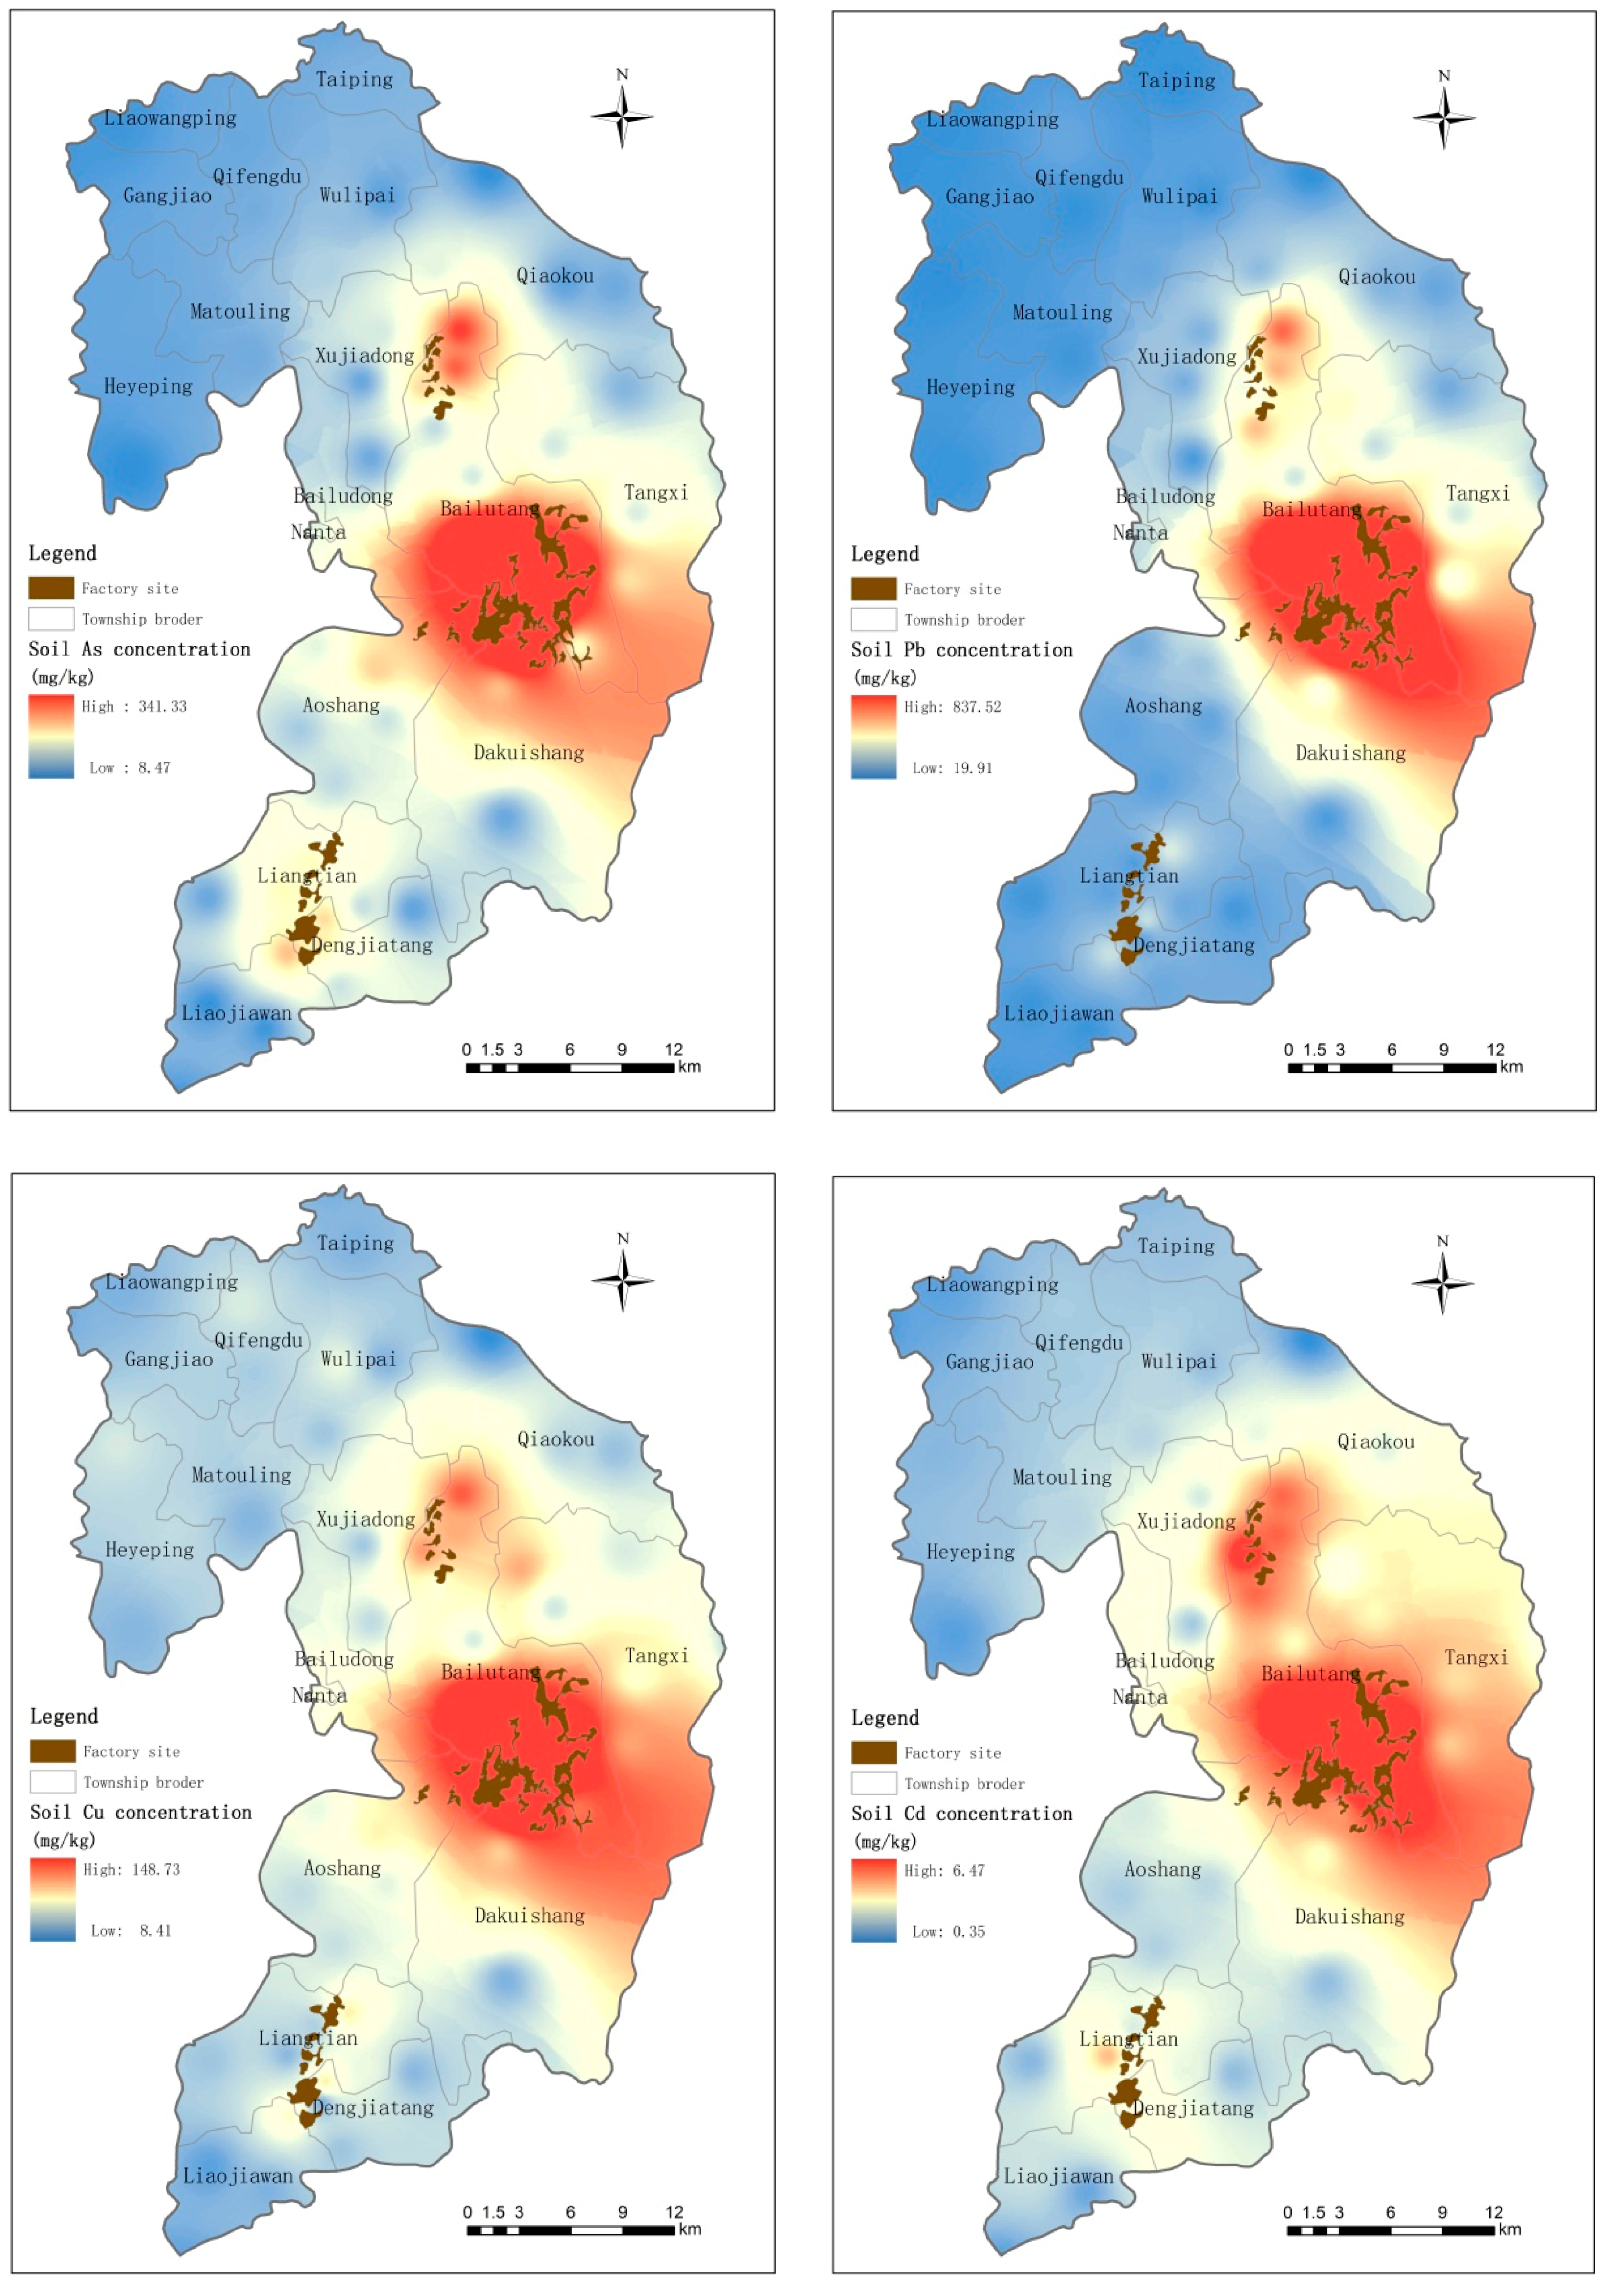
p < 0.05) in soil As, Pb, Cu and Cd concentrations between the two land use types. On the basis of Geographic Information System (GIS) mapping of the spatial distributions of heavy metals in agricultural soils (
Figure 1), three hotspot areas with high heavy metal concentrations were identified around the mine sites (Mining Area A), the metal processing sites (Processing Area C), and the smelting area (Smelting Area B) (
Figure 2). Although the concentration of heavy metals in the vicinity of Area B is not as high as those around Areas A and C, compared to the control area (Area D), the concentration of heavy metals in this area is still in a higher range (
Figure 2). Concentrations of heavy metals were found to decline with increasing distance from the mining area: the greatest soil heavy metal concentrations were found closest to Mining Area A (
Figure 2). At the three functional areas, the mean concentrations of heavy metals decrease in the order: Area A > Area C > Area B.
Figure 2.
Geographical distribution of As, Pb, Cu and Cd levels in soils from the investigated area.
Figure 2.
Geographical distribution of As, Pb, Cu and Cd levels in soils from the investigated area.
Heavy metal concentrations in most samples collected from Area A, which has been associated with activities at the Shizhuyuan, Dongbo and Manaoshan mines at relatively larger scales and for longer periods, were higher than those from other the other mine industrial areas. At functional areas B and C, the regional ore smelters and metal processing plants are concentrated, and the plants are relatively small in size. However, due to the long-term mining and metallurgical activities at all three functional areas, significant difference were observed between the soil heavy metal concentrations at these areas vs. the control area, D.
The average heavy metal concentrations in soil samples collected throughout the Suxian area are relatively high, especially those in the vicinity areas of areas A, B and C; the concentrations of As and Cd in these areas are particularly high, followed by Pb and Cu. The maximum heavy metal concentrations of As and Cd in the soil are 10 times more than the stage
II standard required by China Environmental Quality for Soils [
32]. This illustrates that the soil in the range of the Suxian functional areas are contaminated mostly by As and Cd. Though the contamination mostly reflects the effect of the mining industry, it may also be related in part to the acidic soil (pH < 6.5) in the study area. At the same time, the concentration of Pb in the soil exceeds the 300 mg/kg standard required by China Environmental Quality for Soils [
32]. The excess may also be related to the use of fertilizers and pesticides in the area.
3.2. Concentrations of Heavy Metals in Crops
The heavy metal concentrations in the measured crops are listed in
Table 5 and
Table 6.
Table 5.
Heavy metal concentrations in crop samples (mg/kg d.m.).
Table 5.
Heavy metal concentrations in crop samples (mg/kg d.m.).
| Rice | | Asparagus lettuce | | B. campestris |
|---|
| As | Pb | Cu | Cd | | As | Pb | Cu | Cd | | As | Pb | Cu | Cd |
|---|
| Min | 0.02 | 0.66 | 0.09 | ND | | 0.16 | 2.41 | 4.03 | 0.96 | | 2.18 | 4.79 | 9.39 | 0.55 |
| Max | 1.48 | 5.78 | 6.75 | 1.39 | | 10.7 | 33.5 | 21.6 | 6.91 | | 18.9 | 41.8 | 50.5 | 7.38 |
| Mean | 0.39 | 2.01 | 2.37 | 0.23 | | 3.42 | 10.6 | 9.23 | 2.23 | | 5.87 | 13.4 | 20.2 | 2.39 |
| Std | 0.31 | 0.62 | 2.34 | 0.47 | | 2.16 | 1.92 | 0.82 | 0.12 | | 1.09 | 1.41 | 1.21 | 0.31 |
| Capsicum | | String bean | | Pak choi |
| Min | 0.06 | 1.39 | 3.52 | 0.28 | | 0.14 | 1.55 | 2.43 | 0.18 | | 1.03 | 3.11 | 9.17 | 1.82 |
| Max | 1.93 | 17.4 | 22.6 | 3.43 | | 1.72 | 18.6 | 15.8 | 2.06 | | 31.6 | 95.1 | 71.1 | 8.23 |
| Mean | 0.53 | 4.78 | 8.36 | 1.21 | | 0.82 | 5.09 | 6.35 | 0.76 | | 9.15 | 36.3 | 23.1 | 3.93 |
| Std | 0.42 | 2.19 | 4.24 | 0.31 | | 0.22 | 1.13 | 1.86 | 0.34 | | 4.53 | 15.45 | 11.45 | 1.41 |
Table 6.
Mean heavy metal concentrations in crops from different functional areas (mg/kg d.m.).
Table 6.
Mean heavy metal concentrations in crops from different functional areas (mg/kg d.m.).
| As | | Pb | | Cu | | Cd |
|---|
| Rice | Vegetables | | Rice | Vegetables | | Rice | Vegetables | | Rice | Vegetables |
|---|
| Mining Area A | 1.07 | 9.13 | | 4.27 | 30.84 | | 1.12 | 27.73 | | 4.32 | 3.89 |
| Smelting Area B | 0.40 | 3.27 | | 1.99 | 12.96 | | 0.40 | 16.62 | | 1.91 | 2.45 |
| Processing Area C | 0.76 | 8.35 | | 3.63 | 27.87 | | 0.77 | 21.12 | | 3.63 | 3.27 |
| Control Area D | 0.22 | 3.06 | | 1.74 | 10.34 | | 0.22 | 14.41 | | 1.04 | 1.89 |
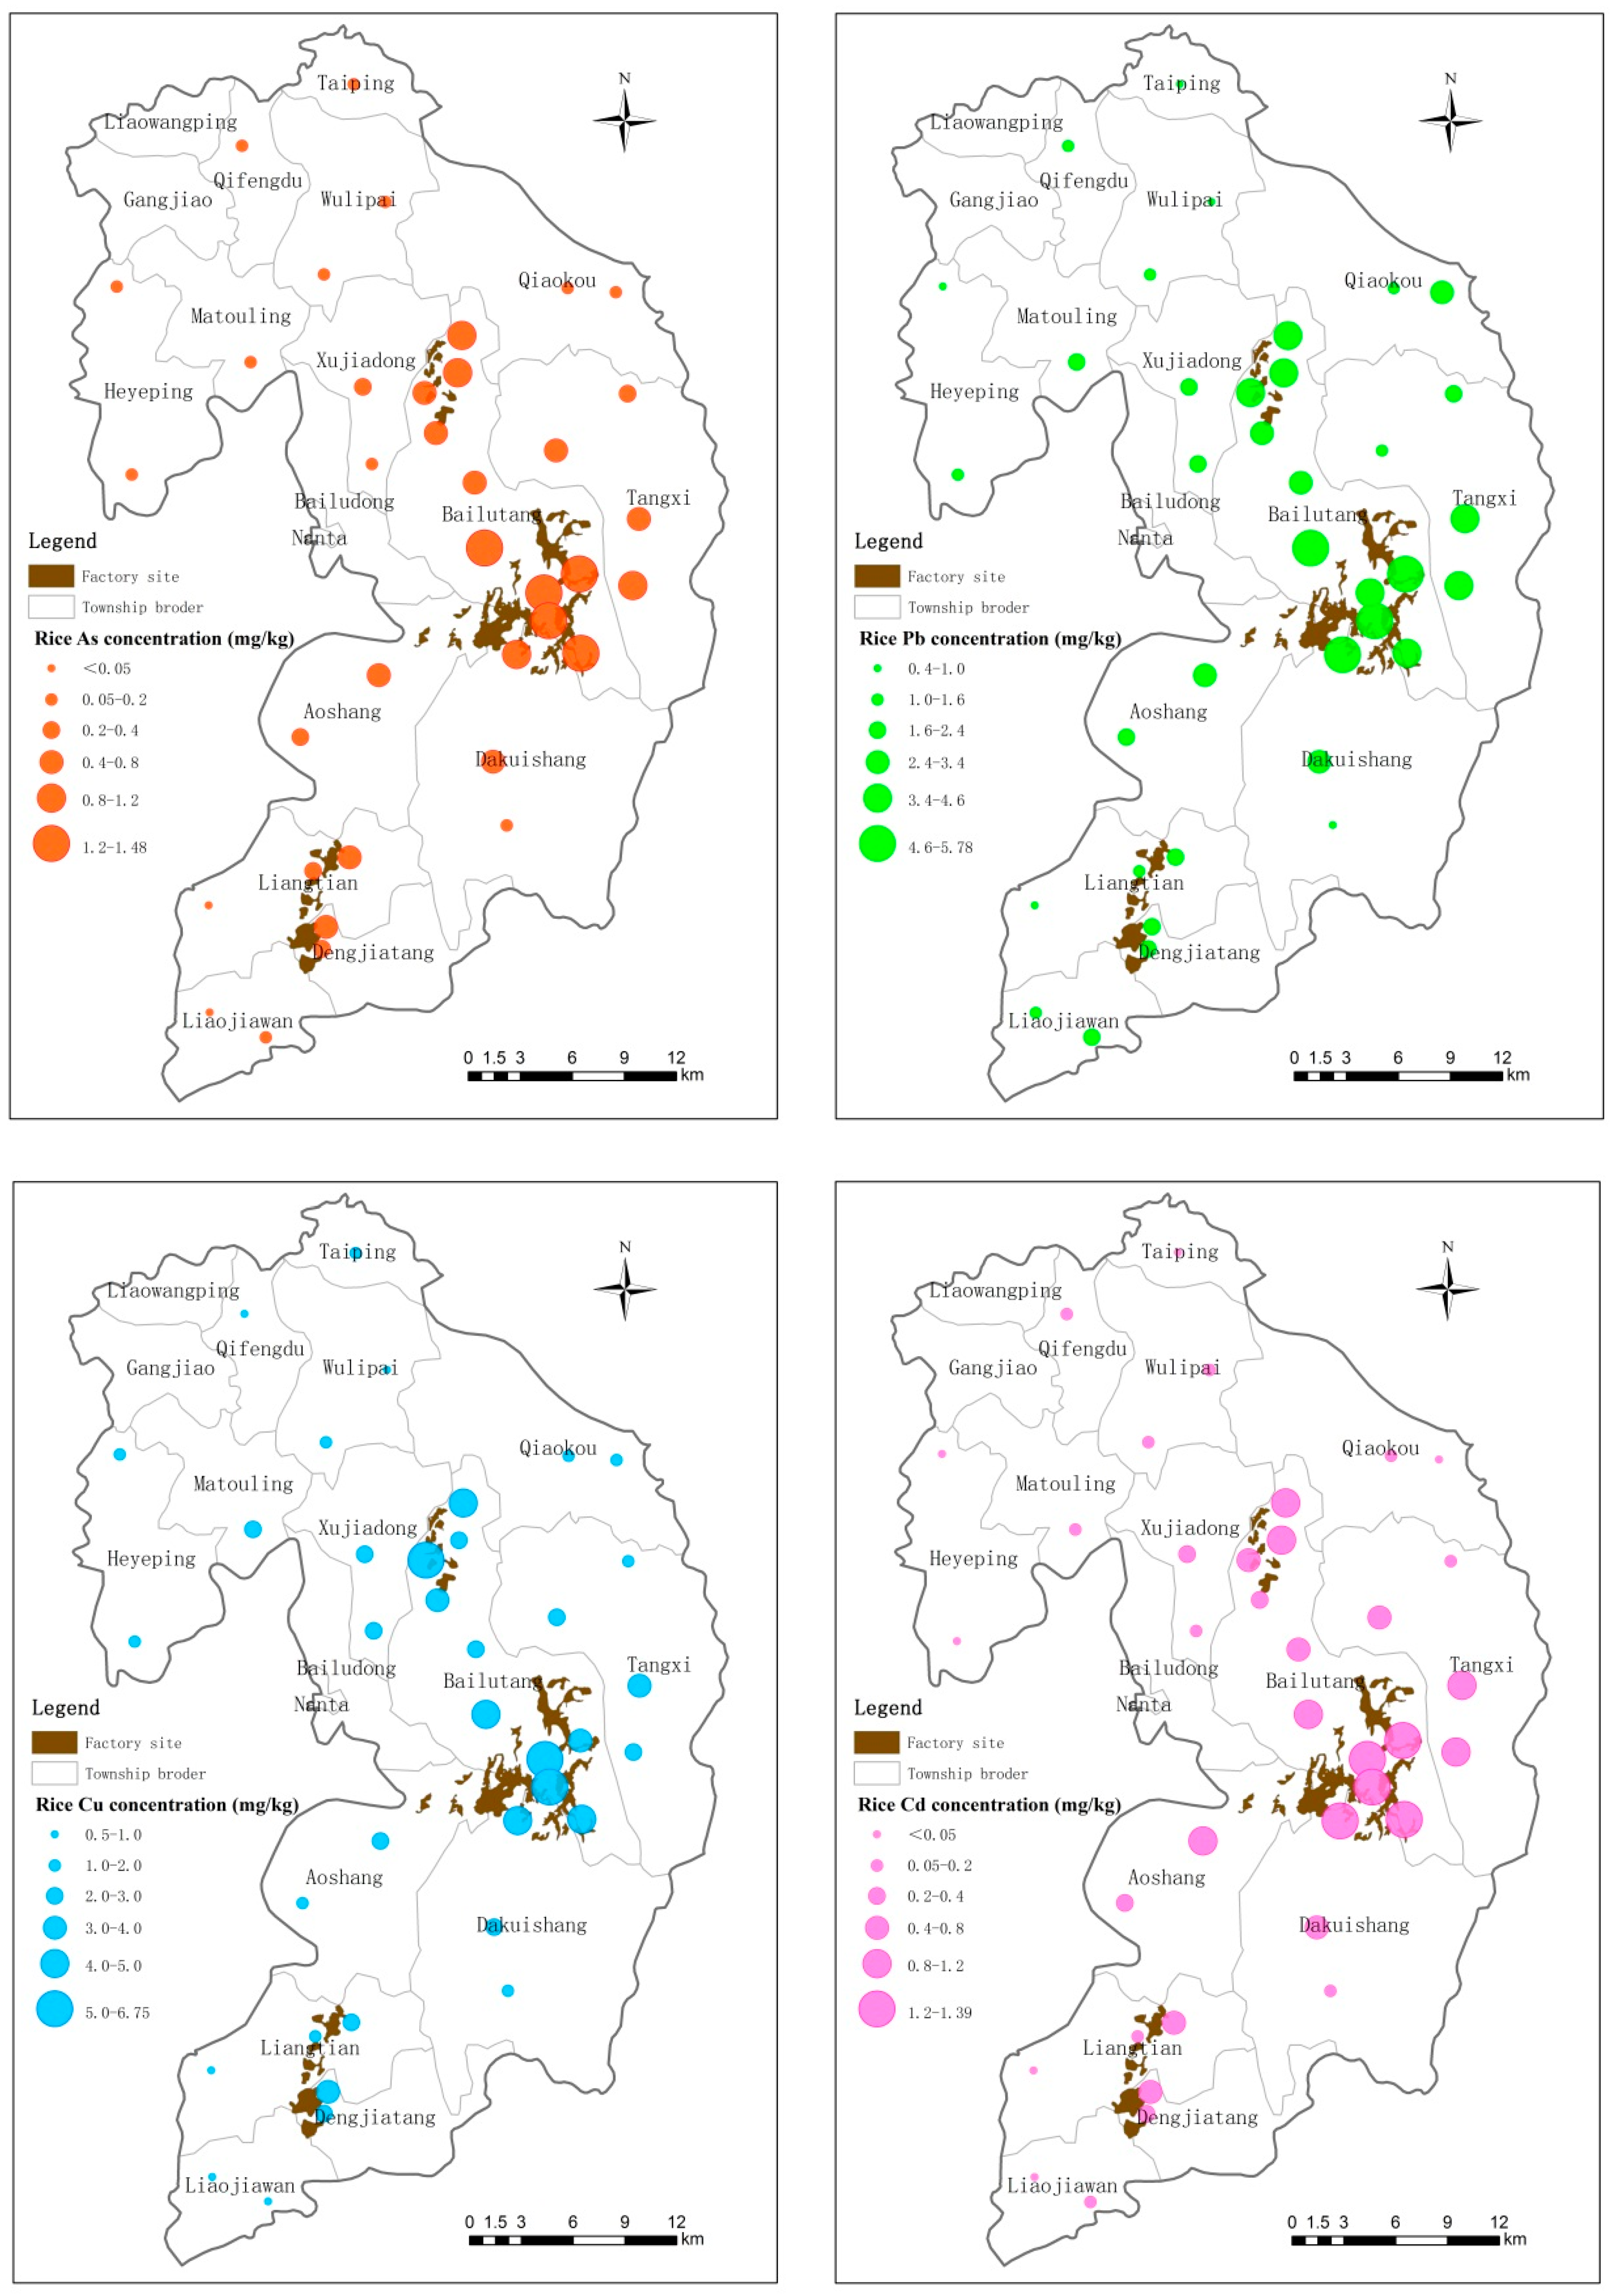
Rice samples collected from the study area exhibited the following average heavy metal concentrations: As—0.39 mg/kg; Pb—2.01 mg/kg; Cu—2.37 mg/kg; and Cd—0.23 mg/kg. The highest concentrations of heavy metals were found in the vicinity of Mining Area A, where the mean concentrations of As, Pb, Cu and Cd are 1.07 mg/kg, 4.27 mg/kg, 1.12 mg/kg, and 4.32 mg/kg, respectively. The concentrations of heavy metals in brown rice samples collected at different functional areas were significantly different. Mining Area A and Processing Area C exhibited heavy metal concentrations that were significantly higher than those in Control Area D; the concentrations of heavy metals at Smelting Area B were slightly higher than those in the control area (
Table 6 and
Figure 3).
Figure 3.
Concentrations of As, Pb, Cu and Cd in rice sampled from the investigated area.
Figure 3.
Concentrations of As, Pb, Cu and Cd in rice sampled from the investigated area.
Obvious differences in heavy metal concentrations in the edible parts were found among the five vegetables tested. The mean As, Pb, Cu and Cd concentrations in the edible parts of asparagus lettuce, B. campestris and pak choi were higher than those of the other fruity vegetables. Heavy metal concentrations in the edible parts of all investigated vegetables followed the trend: pak choi > B. campestris > asparagus lettuce > capsicum > string bean.
In the leafy vegetable samples, the highest heavy metal concentrations of As, Pb and Cd detected are higher than the MPLs allowed by the Sanitation Criterion for Food, China [
33]. The As, Pb and Cd concentrations were 4.3, 3.6 and 4.3 times higher, respectively, than their permissible values, whereas the Cu concentration detected was slightly lower than its permissible value. As for fruity vegetables, the highest heavy metal concentrations detected for Pb and Cd are also higher (by 9.1- and 6.8-fold, respectively) than the MPLs allowed by the Sanitation Criterion for Food, China [
33]. Similar to the spatial distribution of heavy metals in the soil, the plant samples that exceeded the permissible limits are located mostly near the three functional areas, particularly the town of Bailutang, which is near Mining Area A. The spatial distribution of heavy metals in vegetable samples indicates that the closer a sample is to a functional area, the higher the concentration of heavy metals can be found in it. Because China is faced with the scenario of a large population sharing limited land, it is a common phenomenon for residents living near mining functional areas to grow rice and vegetables in areas directly surrounding mines, resulting in heavy metal concentrations in food and vegetables higher than those in crops grown in unpolluted land.
Similar findings have also been reported in other parts of China. For example, Wang,
et al. [
34] analyzed the soil and plants around abandoned lead and zinc mines and showed that in radish edible parts, As and Pb, exceeded permissible levels by 5- to 220-fold, with As, Zn, Pb and Cu concentrations averaging 3.69 mg/kg, 73.23 mg/kg, 16.32 mg/kg and 62.20 mg/kg, respectively, in Shangyu city of Zhejiang province. Zhuang,
et al. [
35] reported that the concentrations of Cd and Pb in some food crop (rice grain, vegetable and soybean) samples were significantly higher than their MPLs in foods [
33] in Chenzhou City in Southern China. Li,
et al. [
36] reported that rice and root vegetables were polluted severely and that the percentages of rice samples that exceeded heavy metal MPLs were 94.3%, 91.4%, 88.6%, and 17.1% for Pb, Cr, Cd, and Cu, respectively, in the Pearl River Estuary of China. Thus, crops grown near mining areas tend to contain excessive levels of heavy metals. Long-term consumption of such crops may bring great risks to human health.
3.3. Daily Intakes via Various Exposure Pathways
Table 7 shows the mean daily estimated intake amounts of observed heavy metals in cereal (rice) and vegetables (pak choi,
B. campestris, string bean, asparagus lettuce and capsicum) at each area. The daily dietary intake of As, Pb, Cu and Cd from food (rice and vegetables) varied from 7.75 × 10
−4 to 3.23 × 10
−3 mg/(kg·d), 1.33 × 10
−3 to 3.58 × 10
−3 mg/(kg·d), 1.65 × 10
−3 to 3.46 × 10
−3 mg/(kg·d) and 4.86 × 10
−4 to 2.35 × 10
−3 mg/(kg·d), respectively, for an adult in the investigated area. The mean concentrations for the daily dietary intake of As, Pb, Cu and Cd from food in the intensive mining area (A) were 4.17, 2.69, 2.09 and 4.83 times higher, respectively, than the mean concentrations of these heavy metals in food from control areas. The daily heavy metal intake from food varied greatly among different functional areas; residents from Mining Area A had the highest intake of heavy metals from both rice and vegetables.
Table 7.
Daily dietary intake of heavy metals; exposure per day/(mg/(kg·d)).
Table 7.
Daily dietary intake of heavy metals; exposure per day/(mg/(kg·d)).
| As | Pb | Cu | Cd |
|---|
| Adults | Children | Adults | Children | Adults | Children | Adults | Children |
|---|
| Mining Area A | 3.23 × 10⁻³ | 4.91 × 10⁻³ | 3.58 × 10⁻³ | 5.66 × 10⁻³ | 3.46 × 10⁻³ | 5.38 × 10⁻³ | 2.35 × 10⁻³ | 3.61 × 10⁻³ |
| Smelting Area B | 1.13 × 10⁻³ | 1.73 × 10⁻³ | 1.44 × 10⁻³ | 2.27 × 10⁻³ | 1.48 × 10⁻³ | 2.33 × 10⁻³ | 1.11 × 10⁻³ | 1.69 × 10⁻³ |
| Processing Area C | 2.69 × 10⁻³ | 4.11 × 10⁻³ | 3.28 × 10⁻³ | 5.21 × 10⁻³ | 2.76 × 10⁻³ | 4.18 × 10⁻³ | 1.80 × 10⁻³ | 2.78 × 10⁻³ |
| Control Area D | 7.75 × 10⁻⁴ | 1.20 × 10⁻³ | 1.33 × 10⁻³ | 2.11 × 10⁻³ | 1.65 × 10⁻³ | 2.59 × 10⁻³ | 4.86 × 10⁻⁴ | 7.70 × 10⁻⁴ |
Table 8.
Daily soil intake of heavy metals; exposure per day/(mg/(kg·d)).
Table 8.
Daily soil intake of heavy metals; exposure per day/(mg/(kg·d)).
| As | Pb | Cu | Cd |
|---|
| Adults | Children | Adults | Children | Adults | Children | Adults | Children |
|---|
| Mining Area A | 8.52 × 10⁻⁴ | 2.72 × 10⁻³ | 1.78 × 10⁻³ | 5.69 × 10⁻³ | 3.69 × 10⁻⁴ | 1.18 × 10⁻³ | 3.47 × 10⁻⁵ | 1.31 × 10⁻⁴ |
| Smelting Area B | 5.52 × 10⁻⁴ | 1.76 × 10⁻³ | 7.76 × 10⁻⁴ | 2.48 × 10⁻³ | 1.48 × 10⁻⁴ | 4.75 × 10⁻⁴ | 1.64 × 10⁻⁵ | 5.13 × 10⁻⁵ |
| Processing Area C | 7.83 × 10⁻⁴ | 2.52 × 10⁻³ | 1.03 × 10⁻³ | 3.29 × 10⁻³ | 3.85 × 10⁻⁴ | 1.23 × 10⁻³ | 3.07 × 10⁻⁵ | 1.05 × 10⁻⁴ |
| Control Area D | 2.31 × 10⁻⁴ | 7.39 × 10⁻⁴ | 2.46 × 10⁻⁴ | 7.88 × 10⁻⁴ | 1.33 × 10⁻⁴ | 4.25 × 10⁻⁴ | 1.31 × 10⁻⁵ | 4.17 × 10⁻⁵ |
Table 8 indicates the mean daily estimated intake amounts of observed heavy metals in soils. The daily dietary intake of As, Pb, Cu and Cd from soils varied from 2.31 × 10
−4 to 8.52 × 10
−4 mg/(kg·d), 2.46 × 10
−4 to 1.78 × 10
−3 mg/(kg·d), 1.33 × 10
−4 to 3.69 × 10
−4 mg/(kg·d) and 1.31 × 10
−5 to 3.47 × 10
−5 mg/(kg·d), respectively, for an adult in the investigated area. For the ingestion of soils by children, the daily dietary intake of As, Pb, Cu and Cd from soils are significantly higher than those of adults, by approximately 3 times. Because children the amount of soil ingestion more than adults, and their weight lighter than adults.
The risk indices for As, Pb and Cd from food for residents in the mining and processing areas are greater than or close to 1, whereas those in the control areas with less mining activities are less than 1 (
Table 9). The risk indices for As and Pb from soil for residents in the mining, smelting and processing areas are close to 1, whereas the risk indices for soil Cu and Cd over the whole study area are far lower than 1 (
Table 10). The estimated exposures and risk indices for heavy metals demonstrate that there is an extremely high risk for adverse health effects from the consumption of rice and vegetables grown in the soil in functional areas where there are dense mining activities. The residents in the functional areas of Suxian County are potentially at risk for health problems resulting from food and soil consumption.
Table 9.
Hazard quotients and risks for each heavy metal in crops.
Table 9.
Hazard quotients and risks for each heavy metal in crops.
| As | Pb | Cu | Cd |
|---|
| Adults | Children | Adults | Children | Adults | Children | Adults | Children |
|---|
| Mining Area A | 1.076 | 1.638 | 1.025 | 1.618 | 0.086 | 0.135 | 2.353 | 3.610 |
| Smelting Area B | 0.378 | 0.576 | 0.411 | 0.651 | 0.036 | 0.058 | 1.109 | 1.693 |
| Processing Area C | 0.897 | 1.371 | 0.936 | 1.490 | 0.069 | 0.105 | 1.797 | 2.778 |
| Control Area D | 0.258 | 0.399 | 0.381 | 0.603 | 0.041 | 0.065 | 0.486 | 0.770 |
Table 10.
Hazard quotients and risks for each heavy metal in soils.
Table 10.
Hazard quotients and risks for each heavy metal in soils.
| As | Pb | Cu | Cd |
|---|
| Adult | Children | Adult | Children | Adult | Children | Adult | Children |
|---|
| Mining Area A | 0.283 | 0.906 | 0.507 | 1.623 | 0.009 | 0.030 | 0.035 | 0.131 |
| Smelting Area B | 0.183 | 0.586 | 0.222 | 0.710 | 0.004 | 0.012 | 0.016 | 0.051 |
| Processing Area C | 0.262 | 0.839 | 0.294 | 0.940 | 0.009 | 0.031 | 0.031 | 0.105 |
| Control Area D | 0.076 | 0.247 | 0.070 | 0.225 | 0.003 | 0.011 | 0.013 | 0.042 |
Table 11.
Risk indices for crops and soils from different functional areas.
Table 11.
Risk indices for crops and soils from different functional areas.
| Elements | THI (soil) | THI (food) | THI (total) |
|---|
| Adult | Children | Adult | Children | Adult | Children |
|---|
| Control Area | As | 0.076 | 0.247 | 0.258 | 0.399 | 0.334 | 0.646 |
| Pb | 0.070 | 0.225 | 0.381 | 0.603 | 0.451 | 0.828 |
| Cu | 0.003 | 0.011 | 0.041 | 0.065 | 0.044 | 0.076 |
| Cd | 0.013 | 0.042 | 0.486 | 0.770 | 0.499 | 0.812 |
| Functional Areas | As | 0.243 | 0.777 | 0.784 | 1.195 | 1.026 | 1.972 |
| Pb | 0.341 | 1.091 | 0.791 | 1.253 | 1.132 | 2.344 |
| Cu | 0.007 | 0.024 | 0.064 | 0.099 | 0.071 | 0.123 |
| Cd | 0.027 | 0.093 | 1.753 | 2.694 | 1.780 | 2.787 |
As shown in
Table 11, within the range of the study areas, the ingestion of four heavy metals through two routes, food and soil, contributes to the total non-carcinogenic risk index. The difference between functional areas and the control area is obvious; in the control area, the total hazard index (THI) values for non-carcinogenic risks from heavy metals in food and soil are all less than the safety threshold 1, and their sum is less than 1. This finding indicates that the potential health risks for residents in the control area are lower than those for residents in the functional areas, based on their dietary intake of heavy metals through food and soil. For the total population in the functional areas, the health risk evaluation index for children’s intake of Pb from soil reaches 1.091, which is greater than the safety threshold value of 1. For the ingestion of food by children, the THI values from As, Pb, and Cd are all greater than 1, having values of 1.195, 1.253 and 2.69, respectively. The THI value for an adult’s intake of the heavy metal Cd reaches 1.753, whereas the THI values for As and Pb come close to but do not exceed the safe threshold value of 1.
The THI analysis in
Table 11 shows that for each of the four types of heavy metals, the total non-carcinogenic THI values for the control area are below 1. However, these THI values, particularly for the heavy metals As, Pb and Cd, have been trending toward the safe threshold value of 1. This means that if the pollution continues to be severe, the health risks for residents even in the control area may become dangerous. In the functional areas, there are already health risks to residents from As, Pb, and Cd, three types of heavy metals for which the THI values exceed 1. Previous data shows that children’s risk indices are higher than those for adults, so children face higher health risks. The order of severity of the heavy metal total non-carcinogenic risk is Cd > Pb > As > Cu.
In China, some prior studies have shown that residents eating various vegetables will potentially incur major risks to their health through the intake of Pb and Cd contained in the vegetables; the risk to the health of children is higher than that for adults, and the risk for residents of mining areas is much higher than that for residents of a control area [
37,
38]. Other studies have shown that for residents in Japan and Korea, exposure to Cd primarily from a diet that is heavy in rice accounts for 40% and 23% of their total intake of Cd, respectively [
39,
40]. This indicates that arable land near mining areas is easily affected by mining; the surrounding soil can be polluted by sewage irrigation and falling dust.
Data from the United States Integrated Risk Information Database (US IRID) and WHO show that Pb can damage the brain and nervous system, causing neurological disorders and high blood pressure, and can lead to a slowing of growth in children, hearing impairment, headaches, reduction in learning ability, and abnormal behaviors [
41]. The intake of As can cause cancer in internal organs (such as liver, kidney, lung, bladder), and can increase the risk for skin cancer [
42]. With regard to the eating habits of residents in the study area, rice is the main cereal crop in Suxian County, and residents treat it as their staple food. The vast majority of local residents grow their own crops as a source of food in the study area, greatly increasing their health risks. However, because heavy metals have the characteristic that they tend to accumulate and persistent in an environment, the risk of other heavy metal contamination still exists. Related departments should pay increased attention to the situation, and they should take appropriate measures to address the problem of soil contamination and industrial dust emissions in Suxian County to reduce the harmful effects of heavy metals on people in the area, especially children.
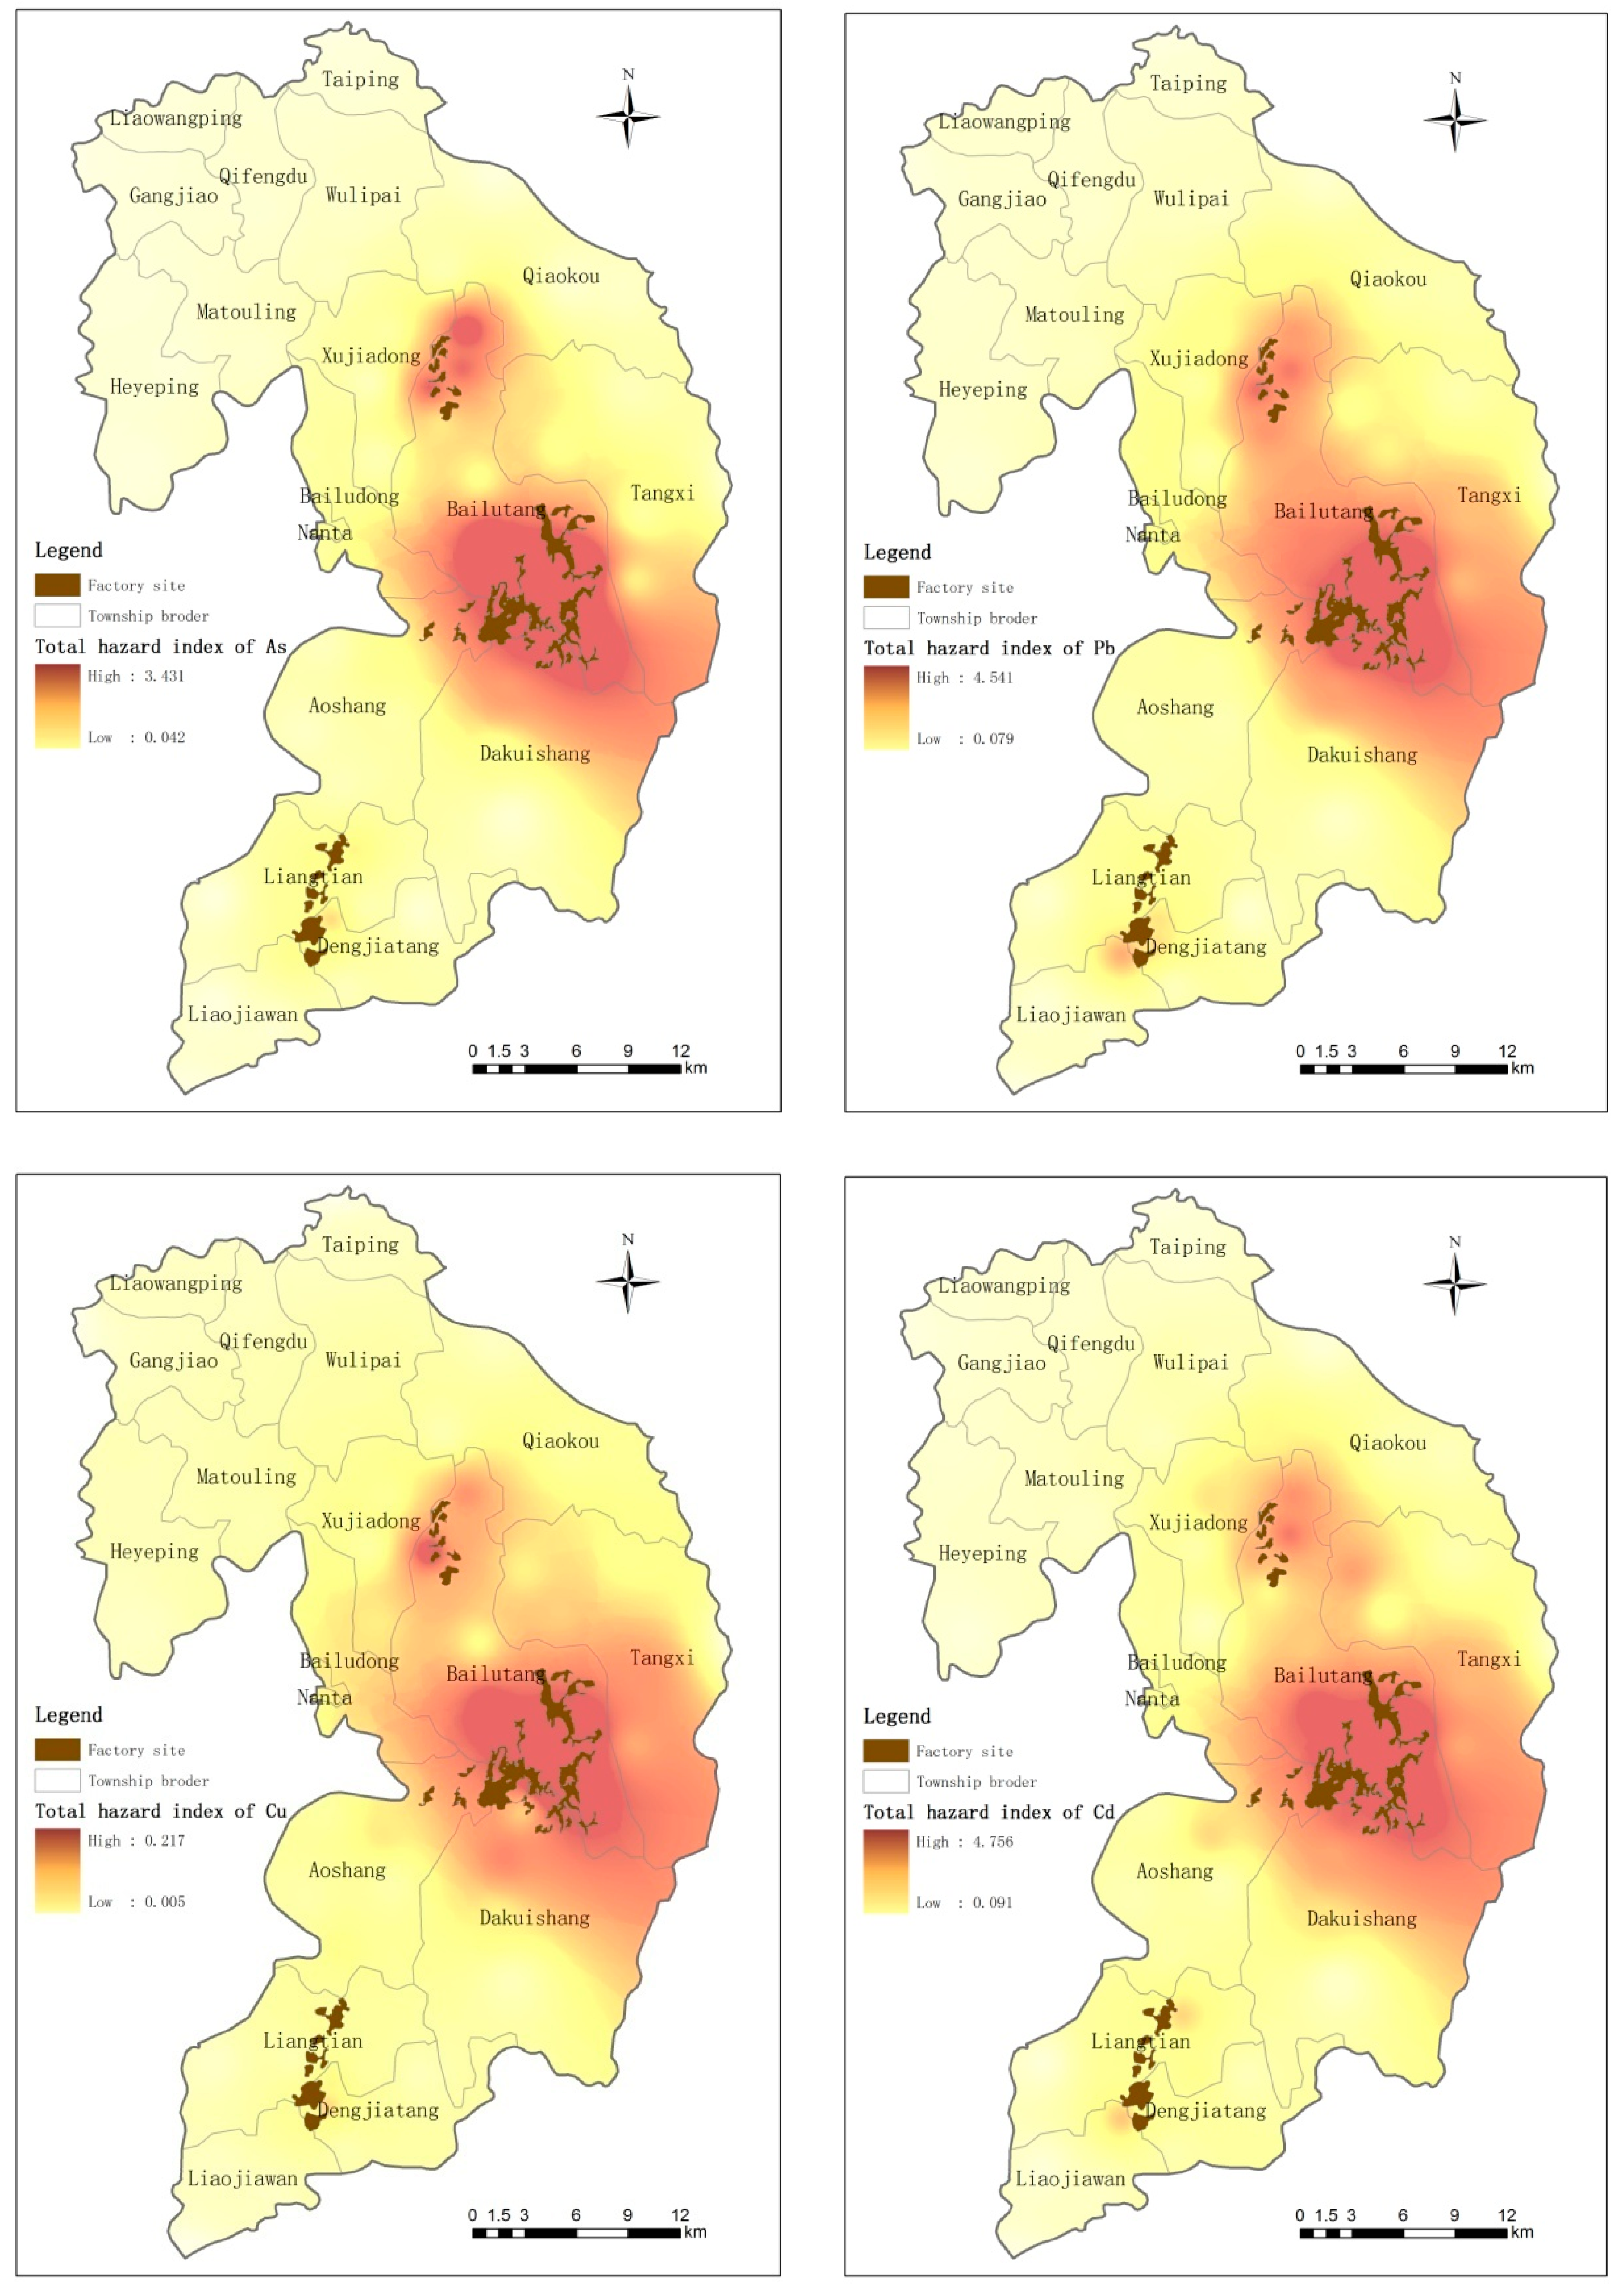
Figure 4 shows the spatial distribution of the total non-carcinogenic risk of As, Pb, Cu and Cd. As shown in the figure, the non-carcinogenic risk index values for Suxian functional areas are obviously higher than those for the control area, and different functional areas have different health risk levels. In order of decreasing health risk, the areas are Area A > Area C > Area B.
Figure 4.
Geographical distribution of As, Pb, Cu and Cd non-carcinogenic risk indices in the study area.
Figure 4.
Geographical distribution of As, Pb, Cu and Cd non-carcinogenic risk indices in the study area.


