Regional Projections of Extreme Apparent Temperature Days in Africa and the Related Potential Risk to Human Health
Abstract
:1. Introduction
2. Materials and Methods
2.1. Bias-Correction
2.2. Calculating Apparent Temperature
2.3. Apparent Temperature Thresholds
| Symptom Band | US NWS Classification | Apparent Temperature Range (°C) | US NWS Classified “Effect on Body” |
|---|---|---|---|
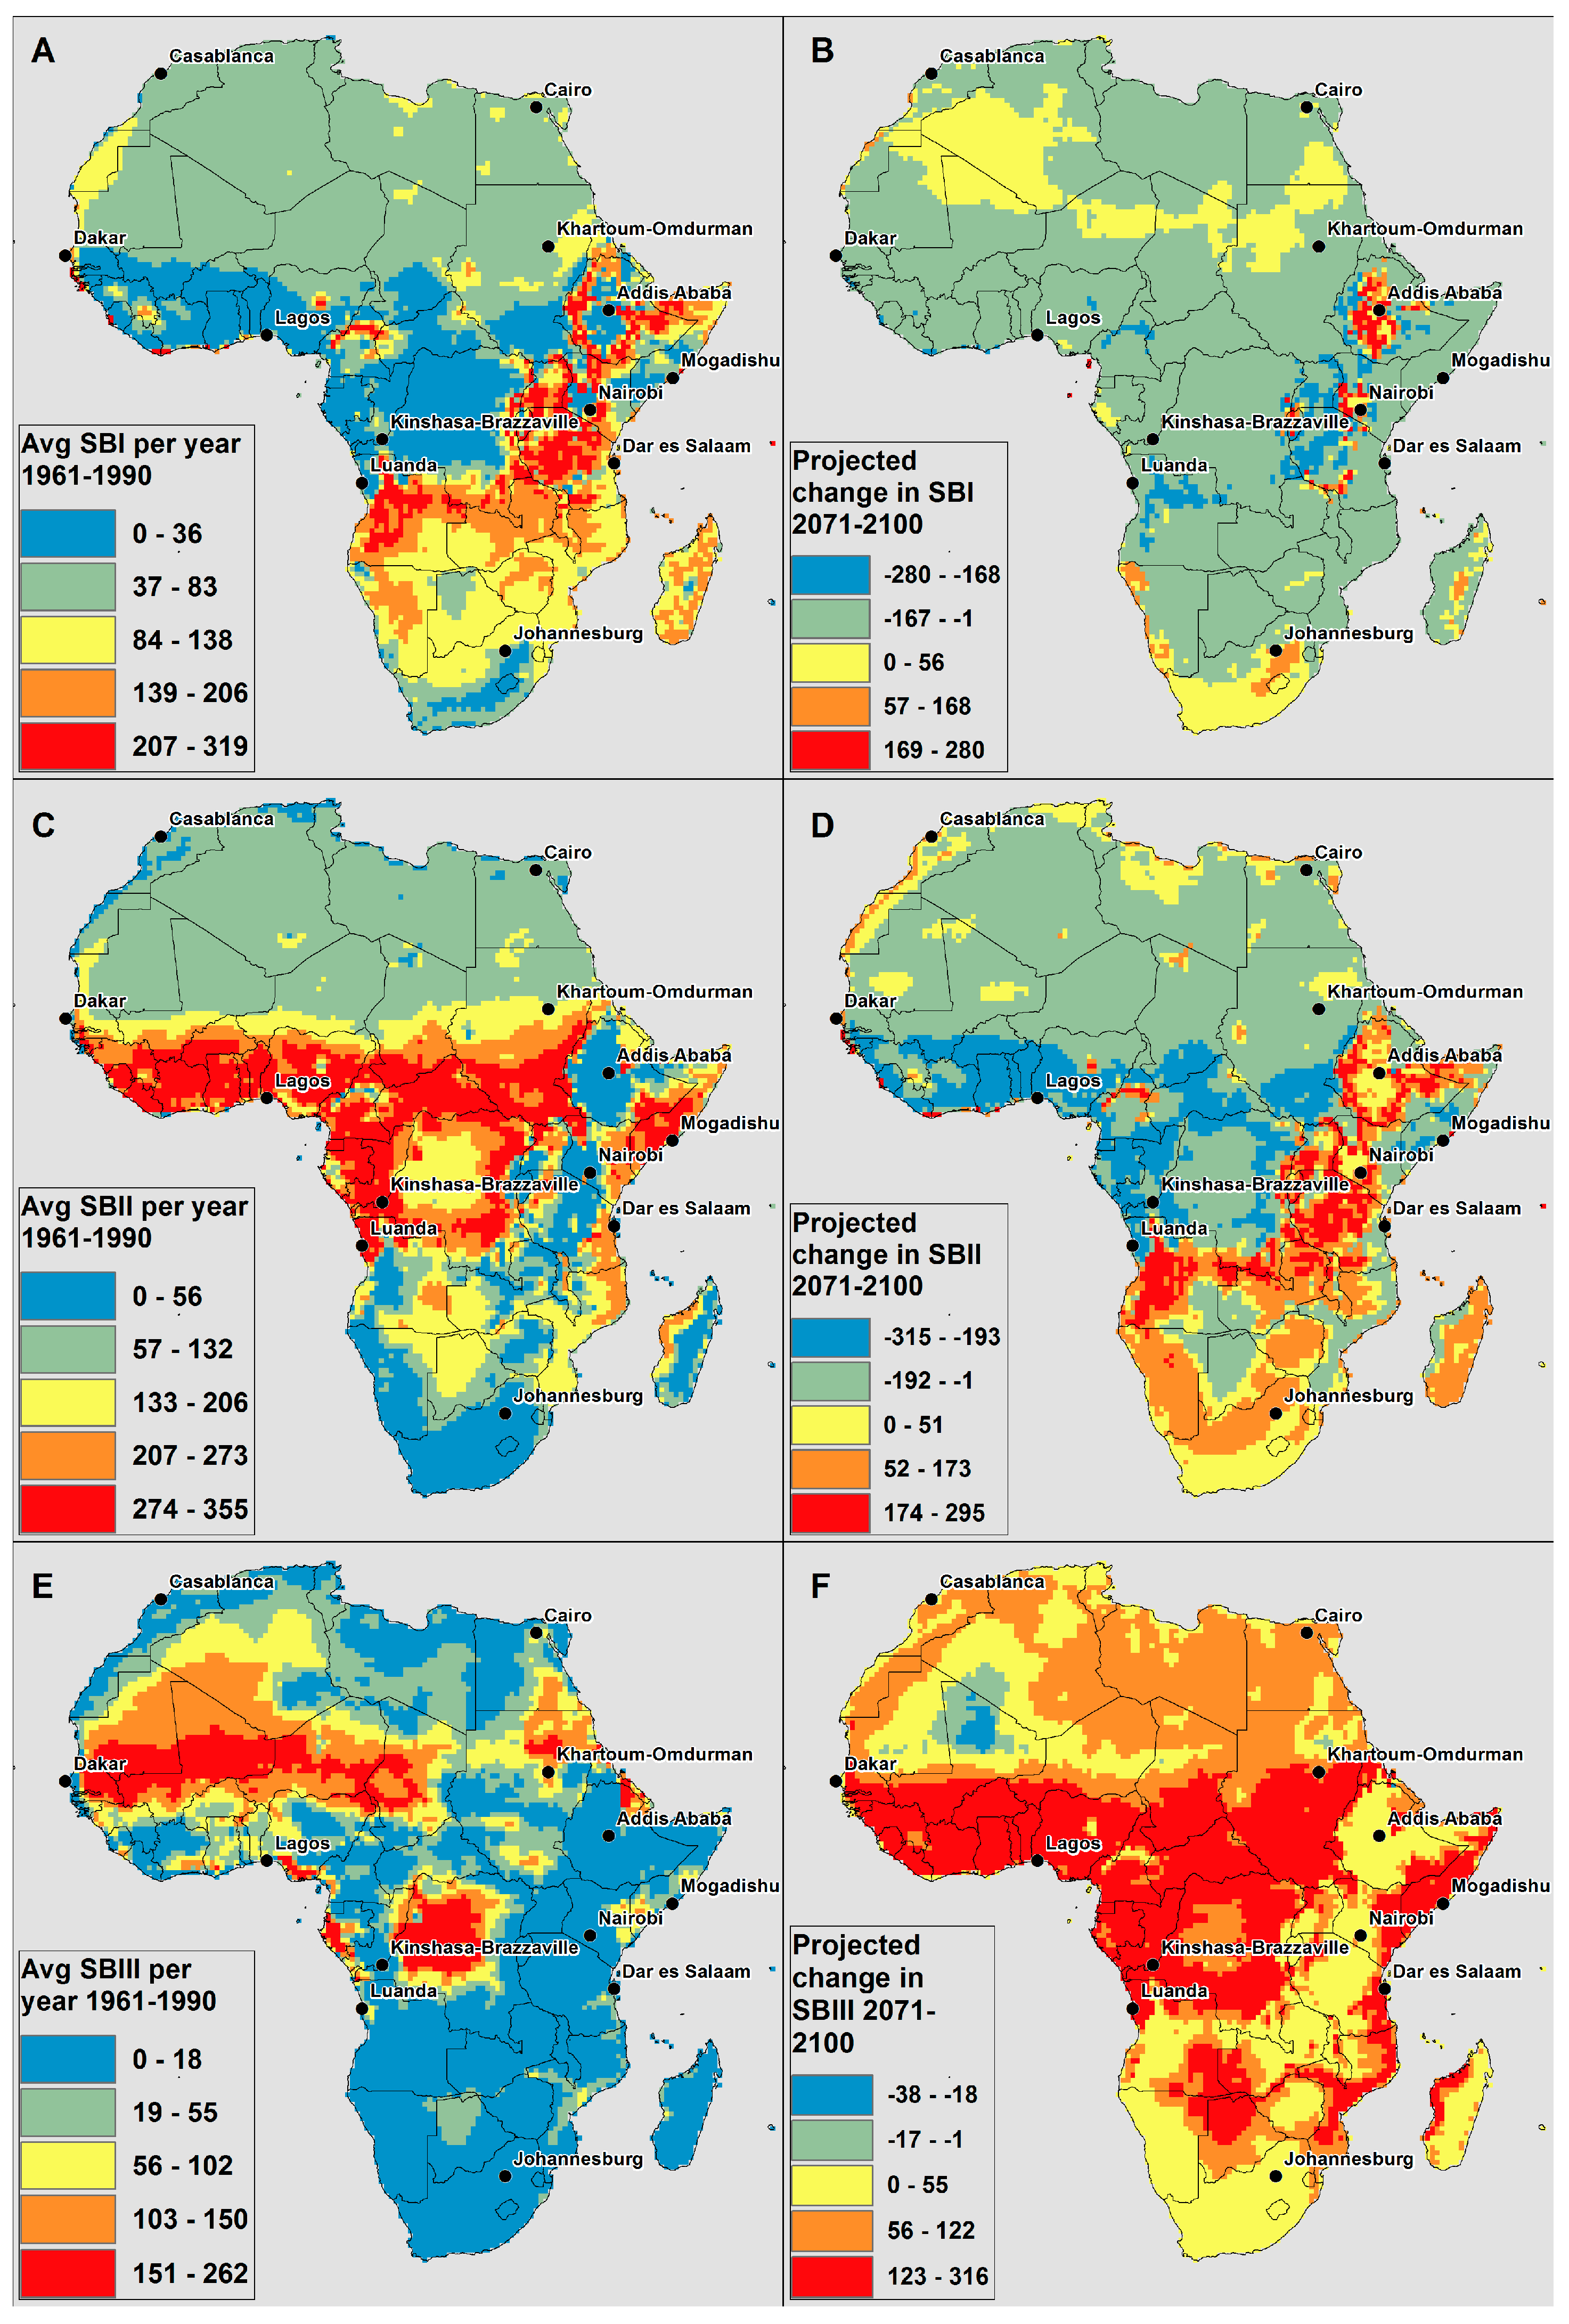
| I | Caution | 27–32 | Fatigue possible with prolonged exposure and/or physical activity |
| II | Extreme caution | 32–39 | Heat stroke, heat cramps, or heat exhaustion possible with prolonged exposure and/or physical activity |
| III | Danger | 39–51 | Heat cramps or heat exhaustion likely, and heat stroke possible with prolonged exposure and/or physical activity |
| IV | Extreme Danger | 51 | Heat stroke highly likely |
- Hda1 = Days where ATmax < 27 °C
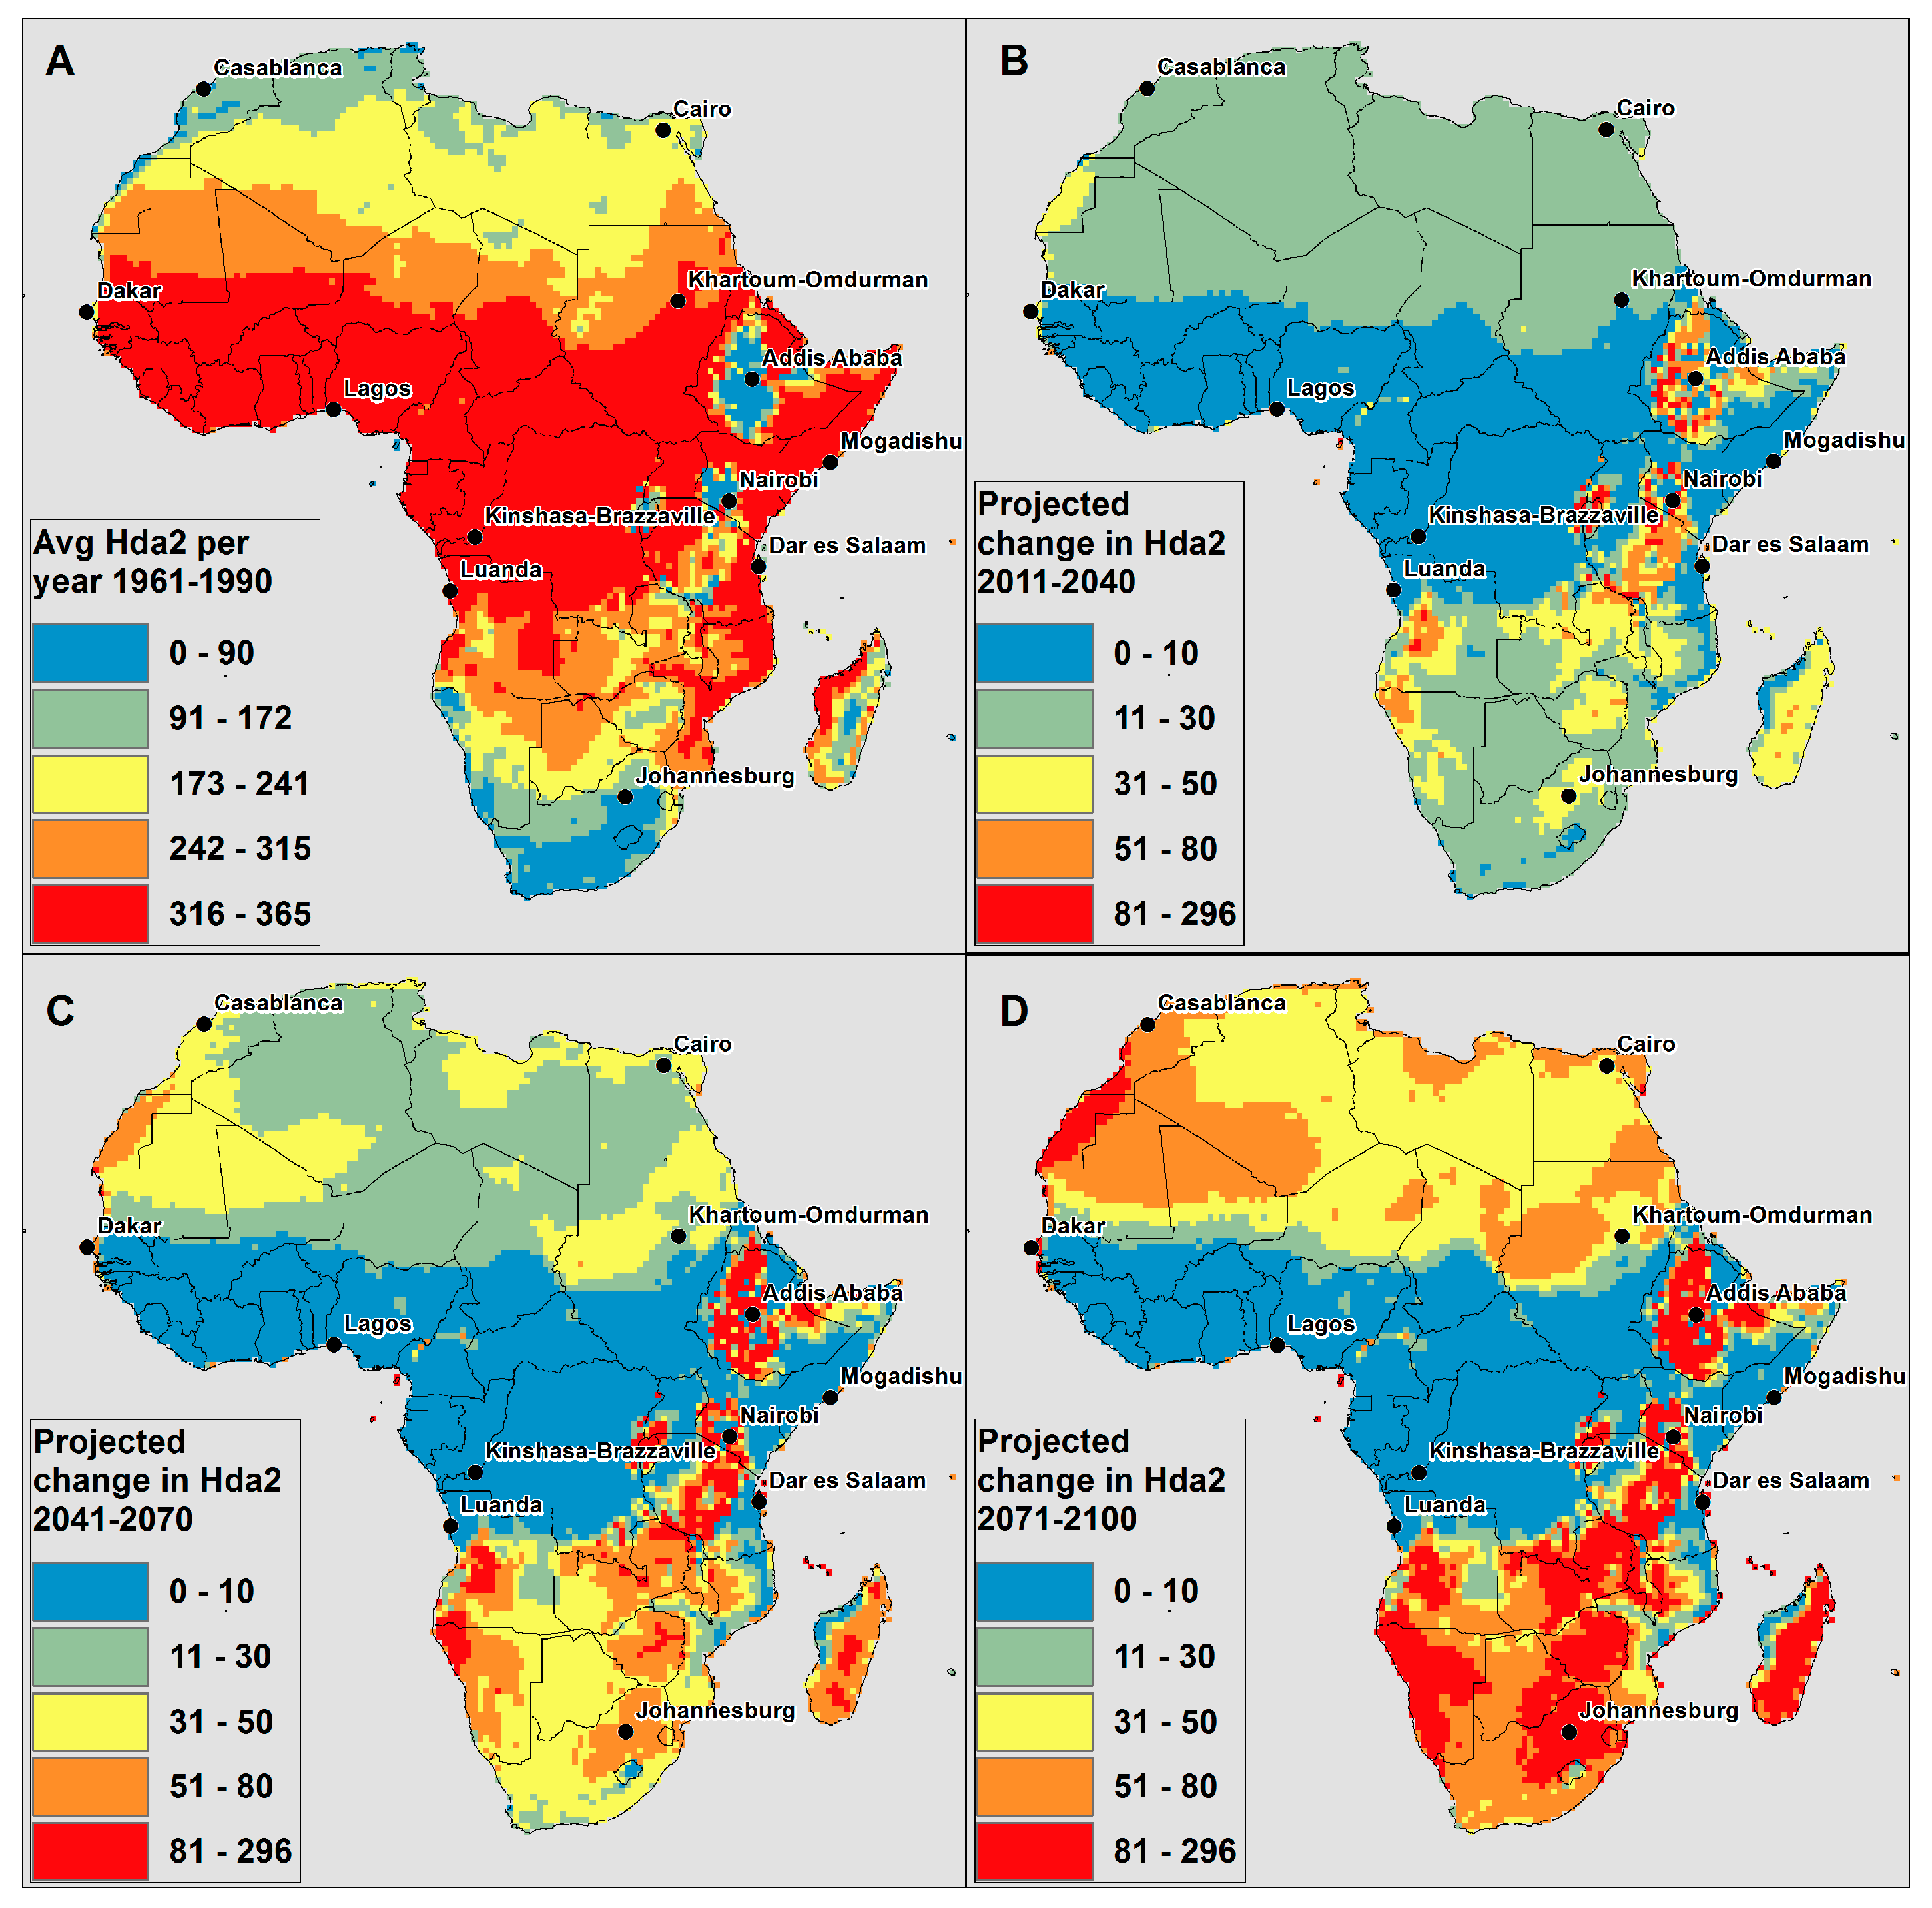
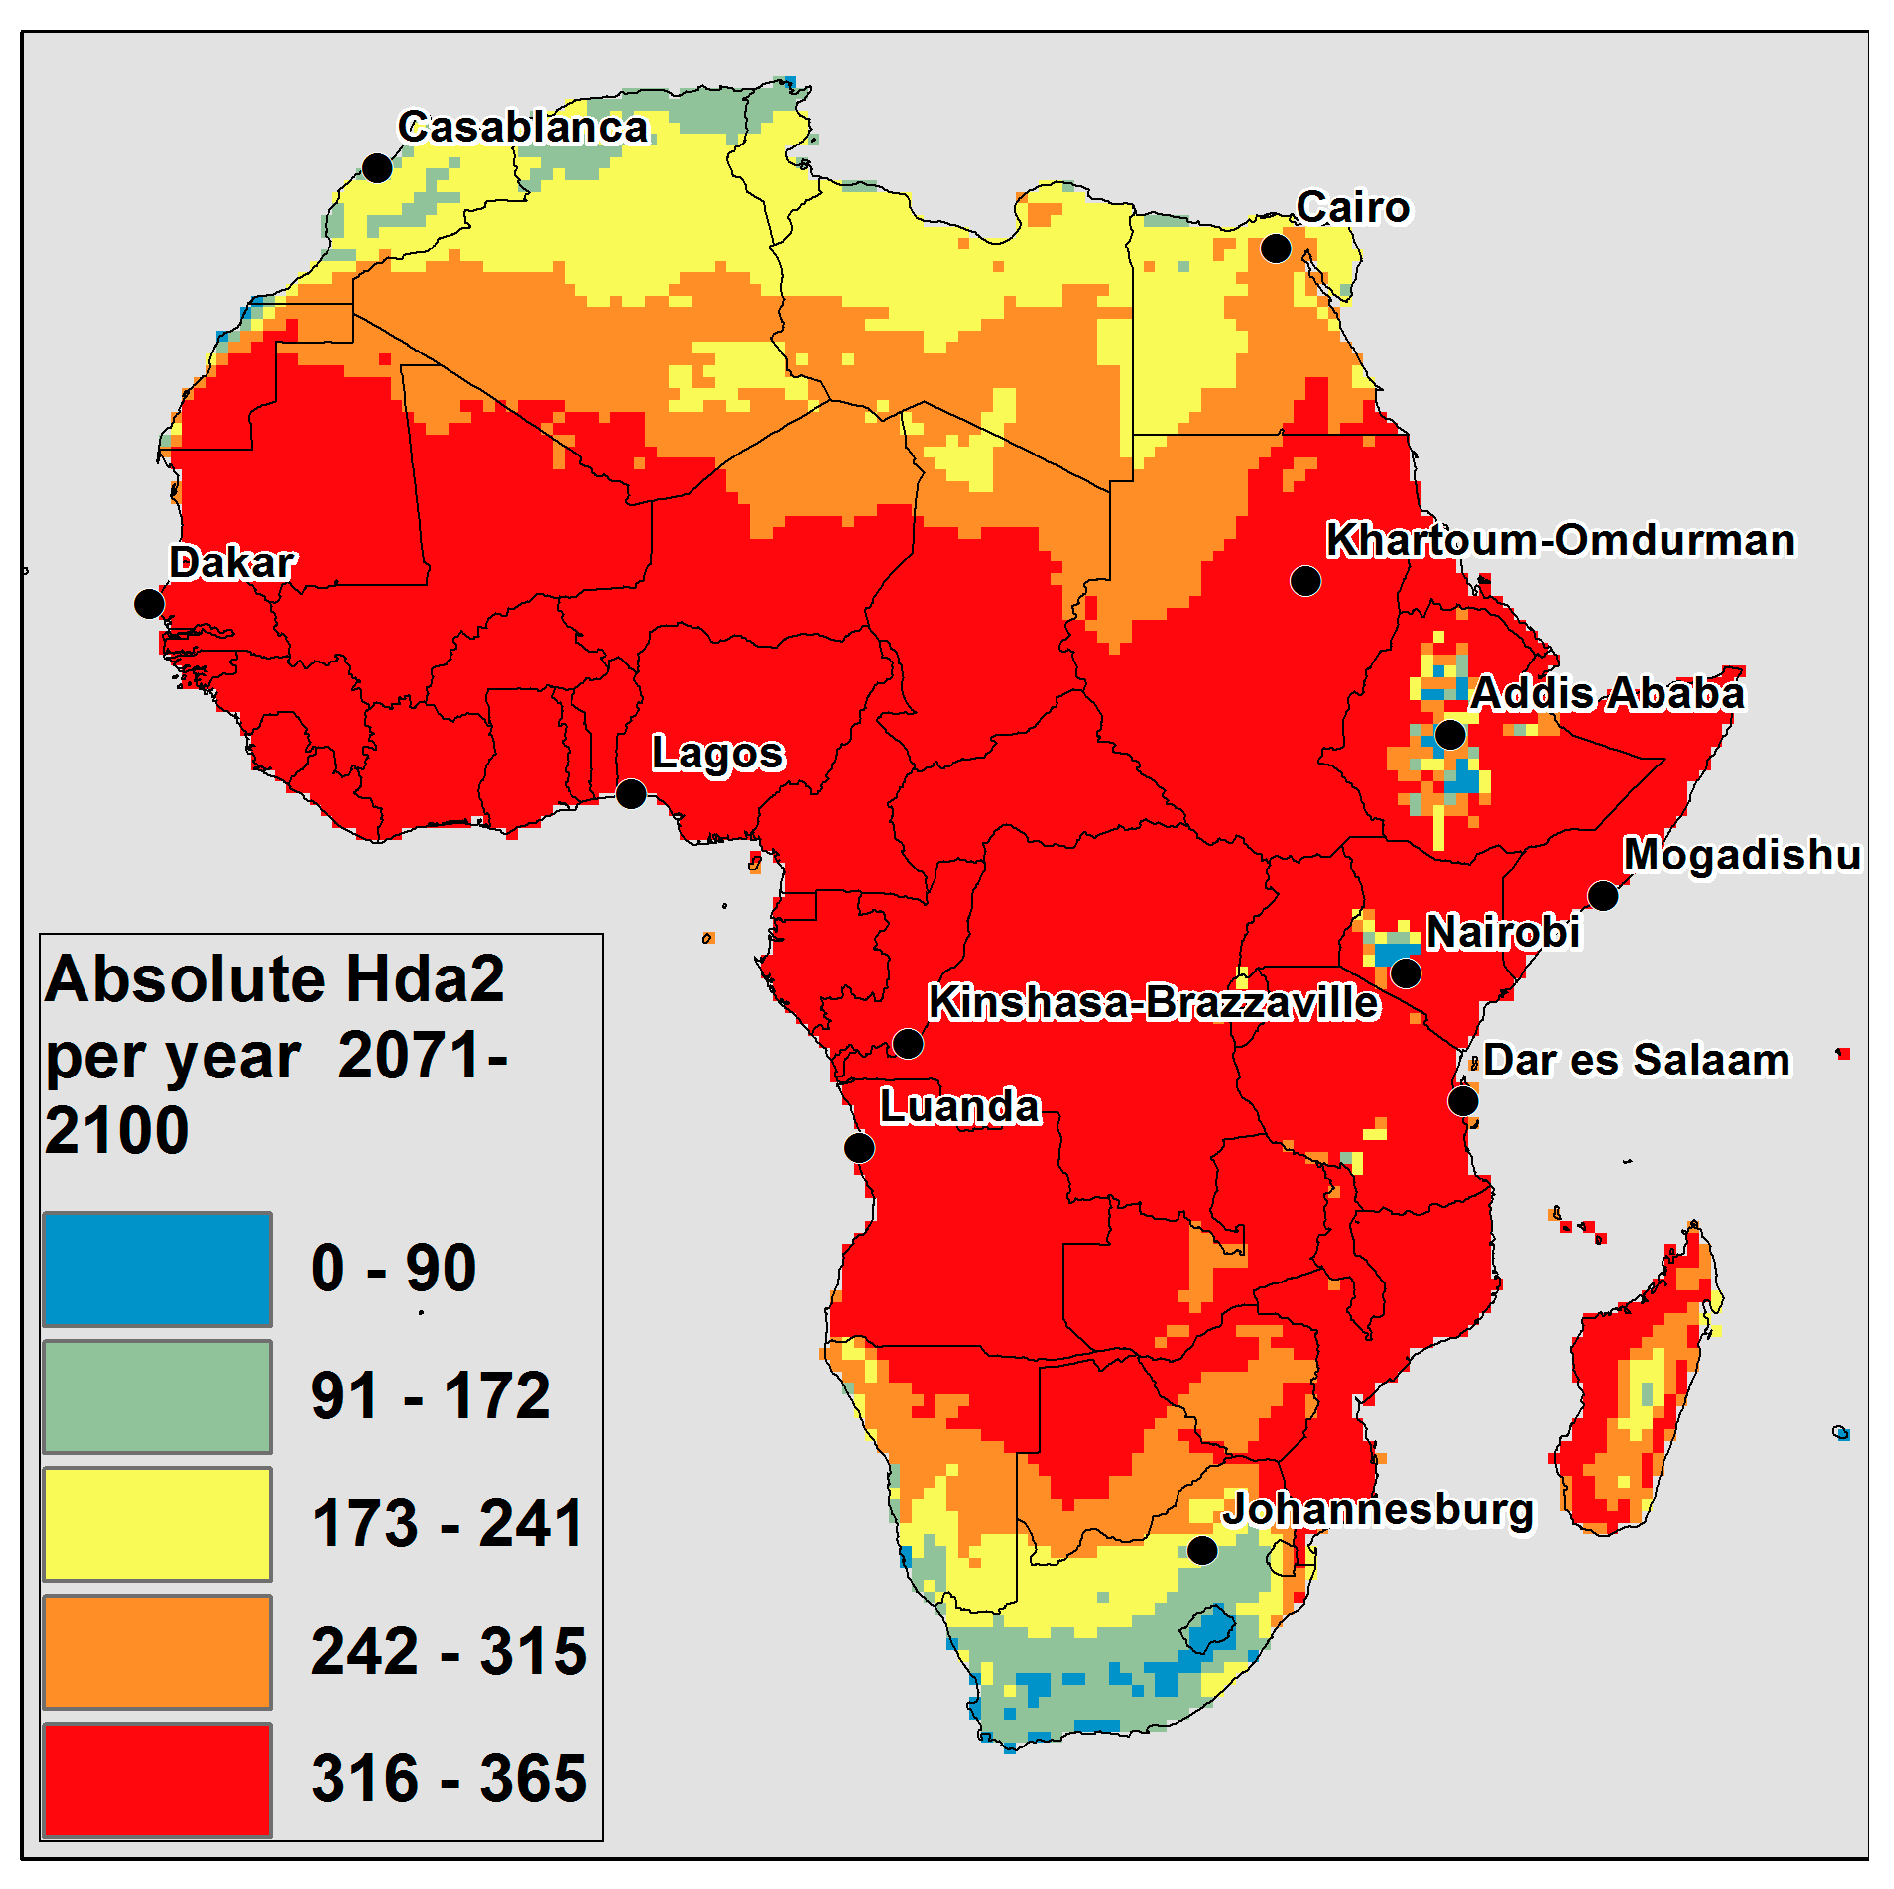
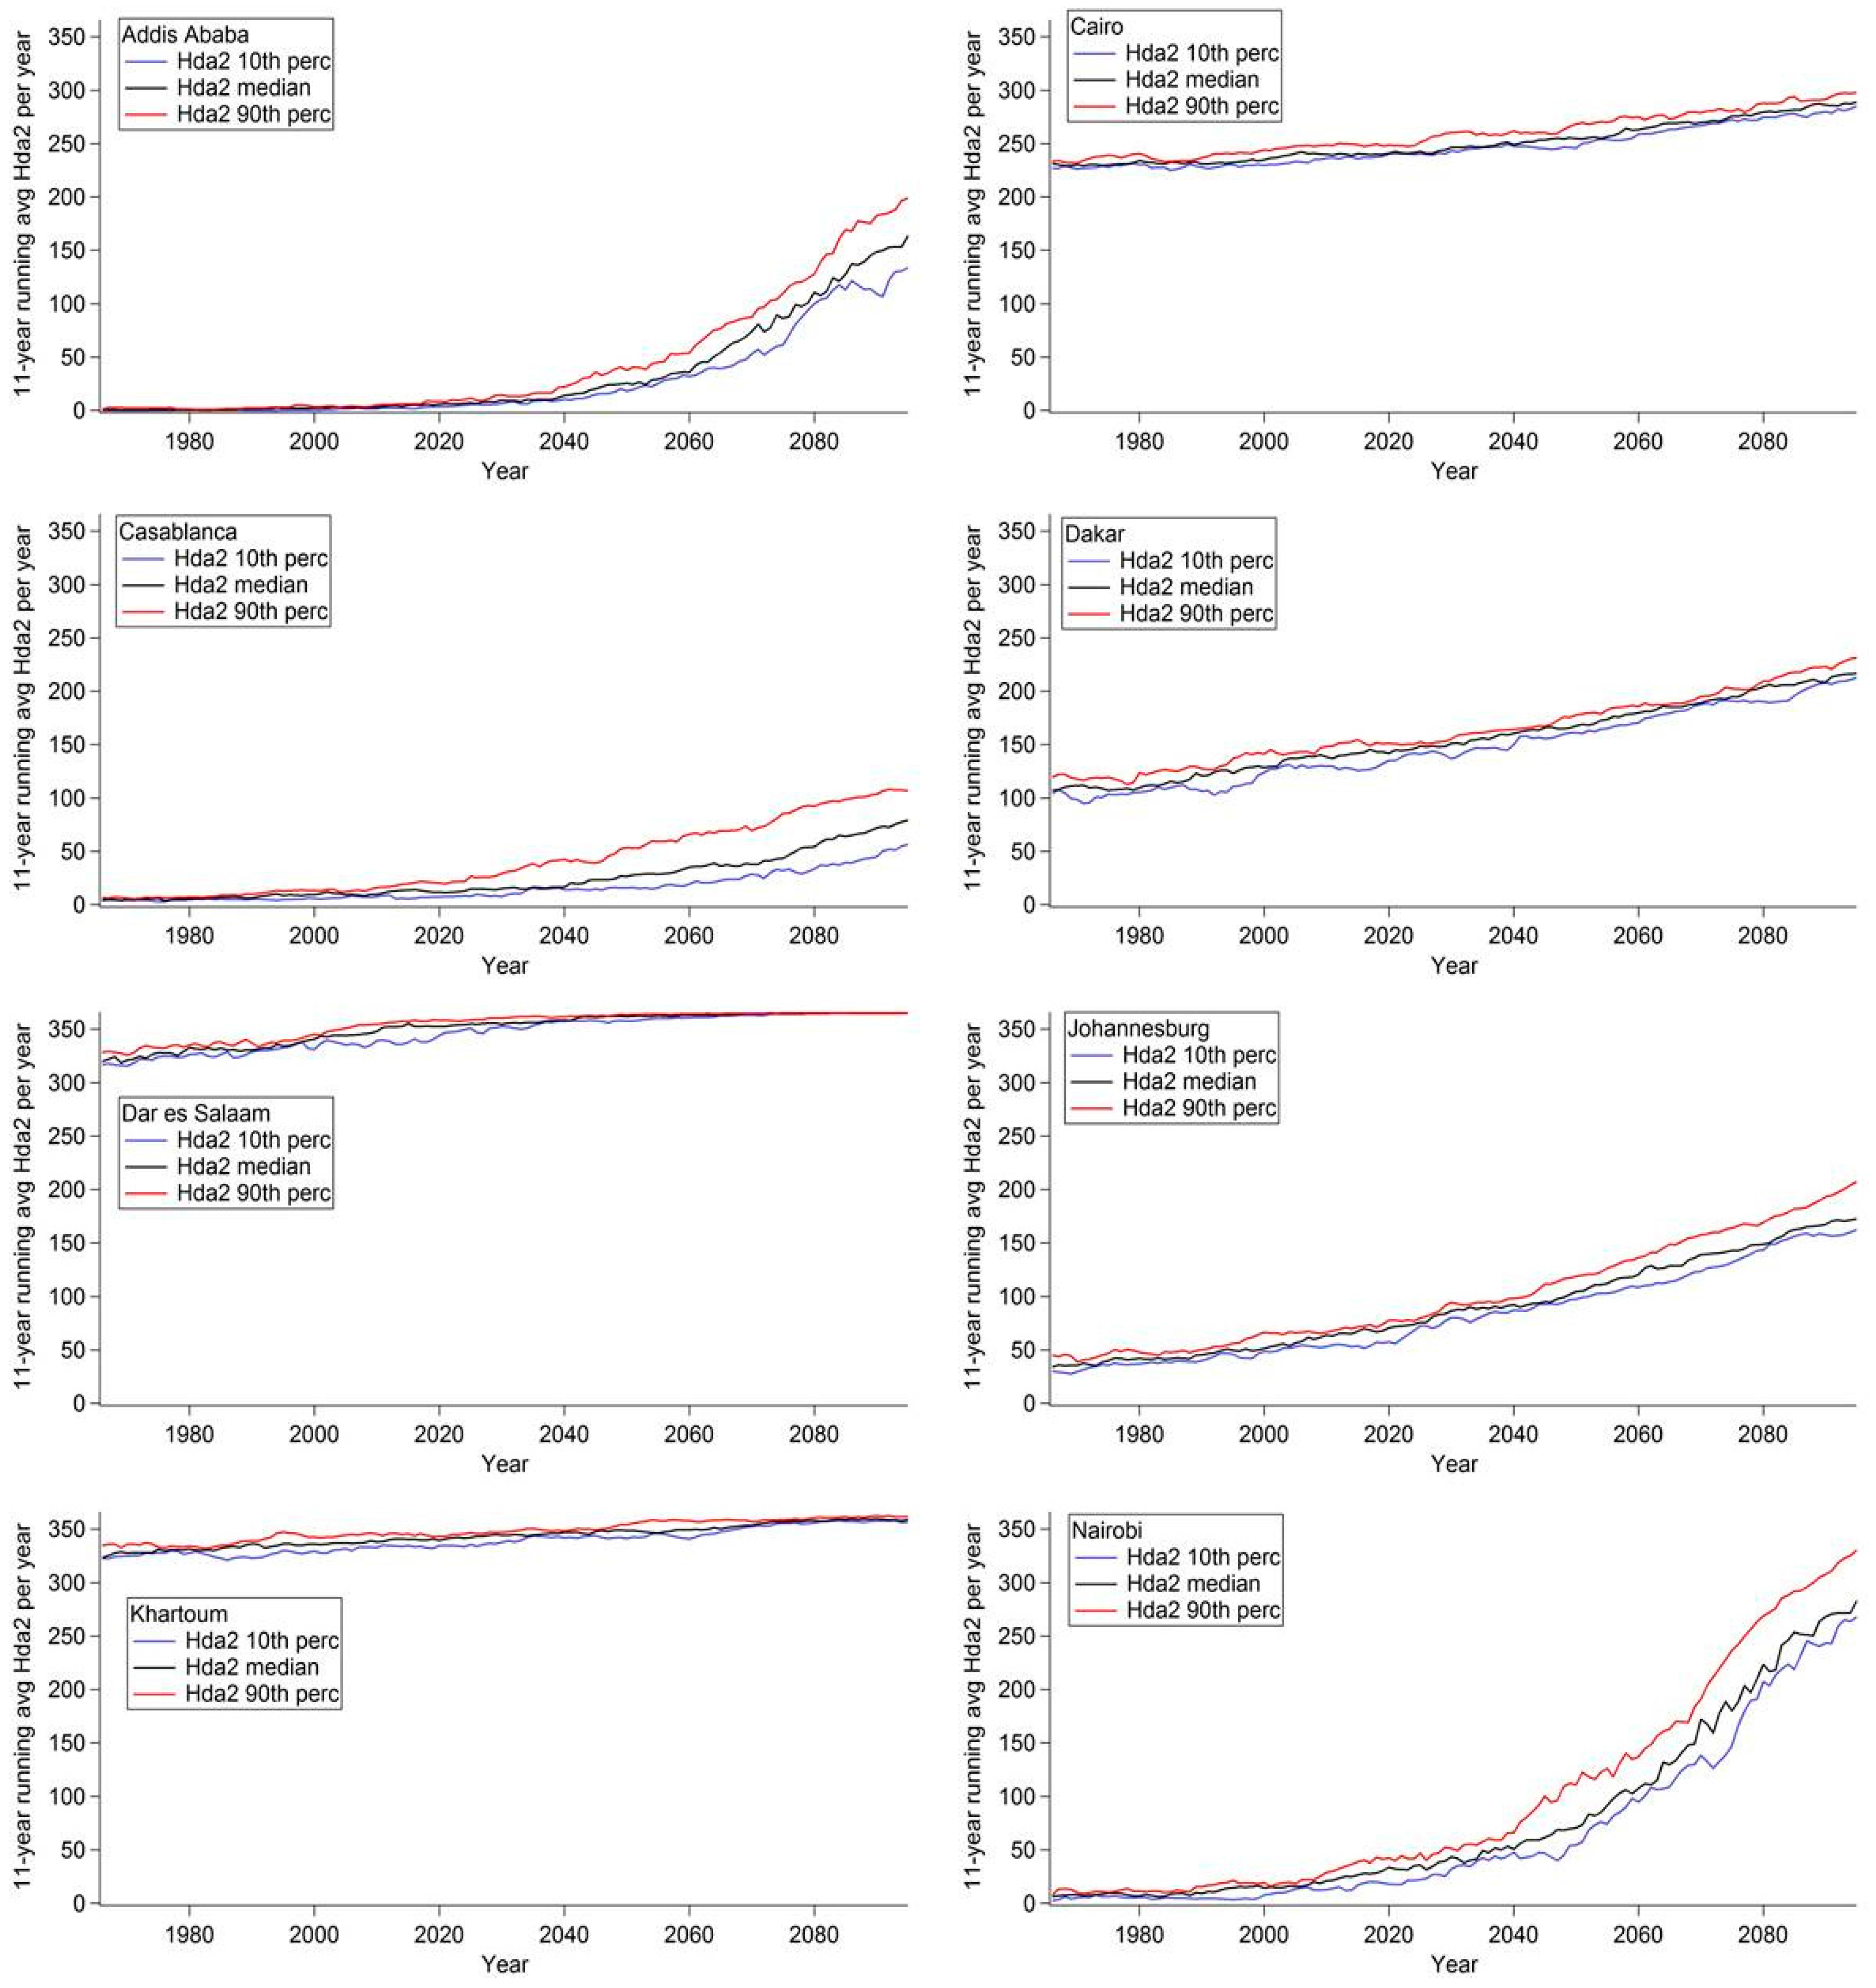
- Hda2 = Days where ATmax ≥ 27 °C
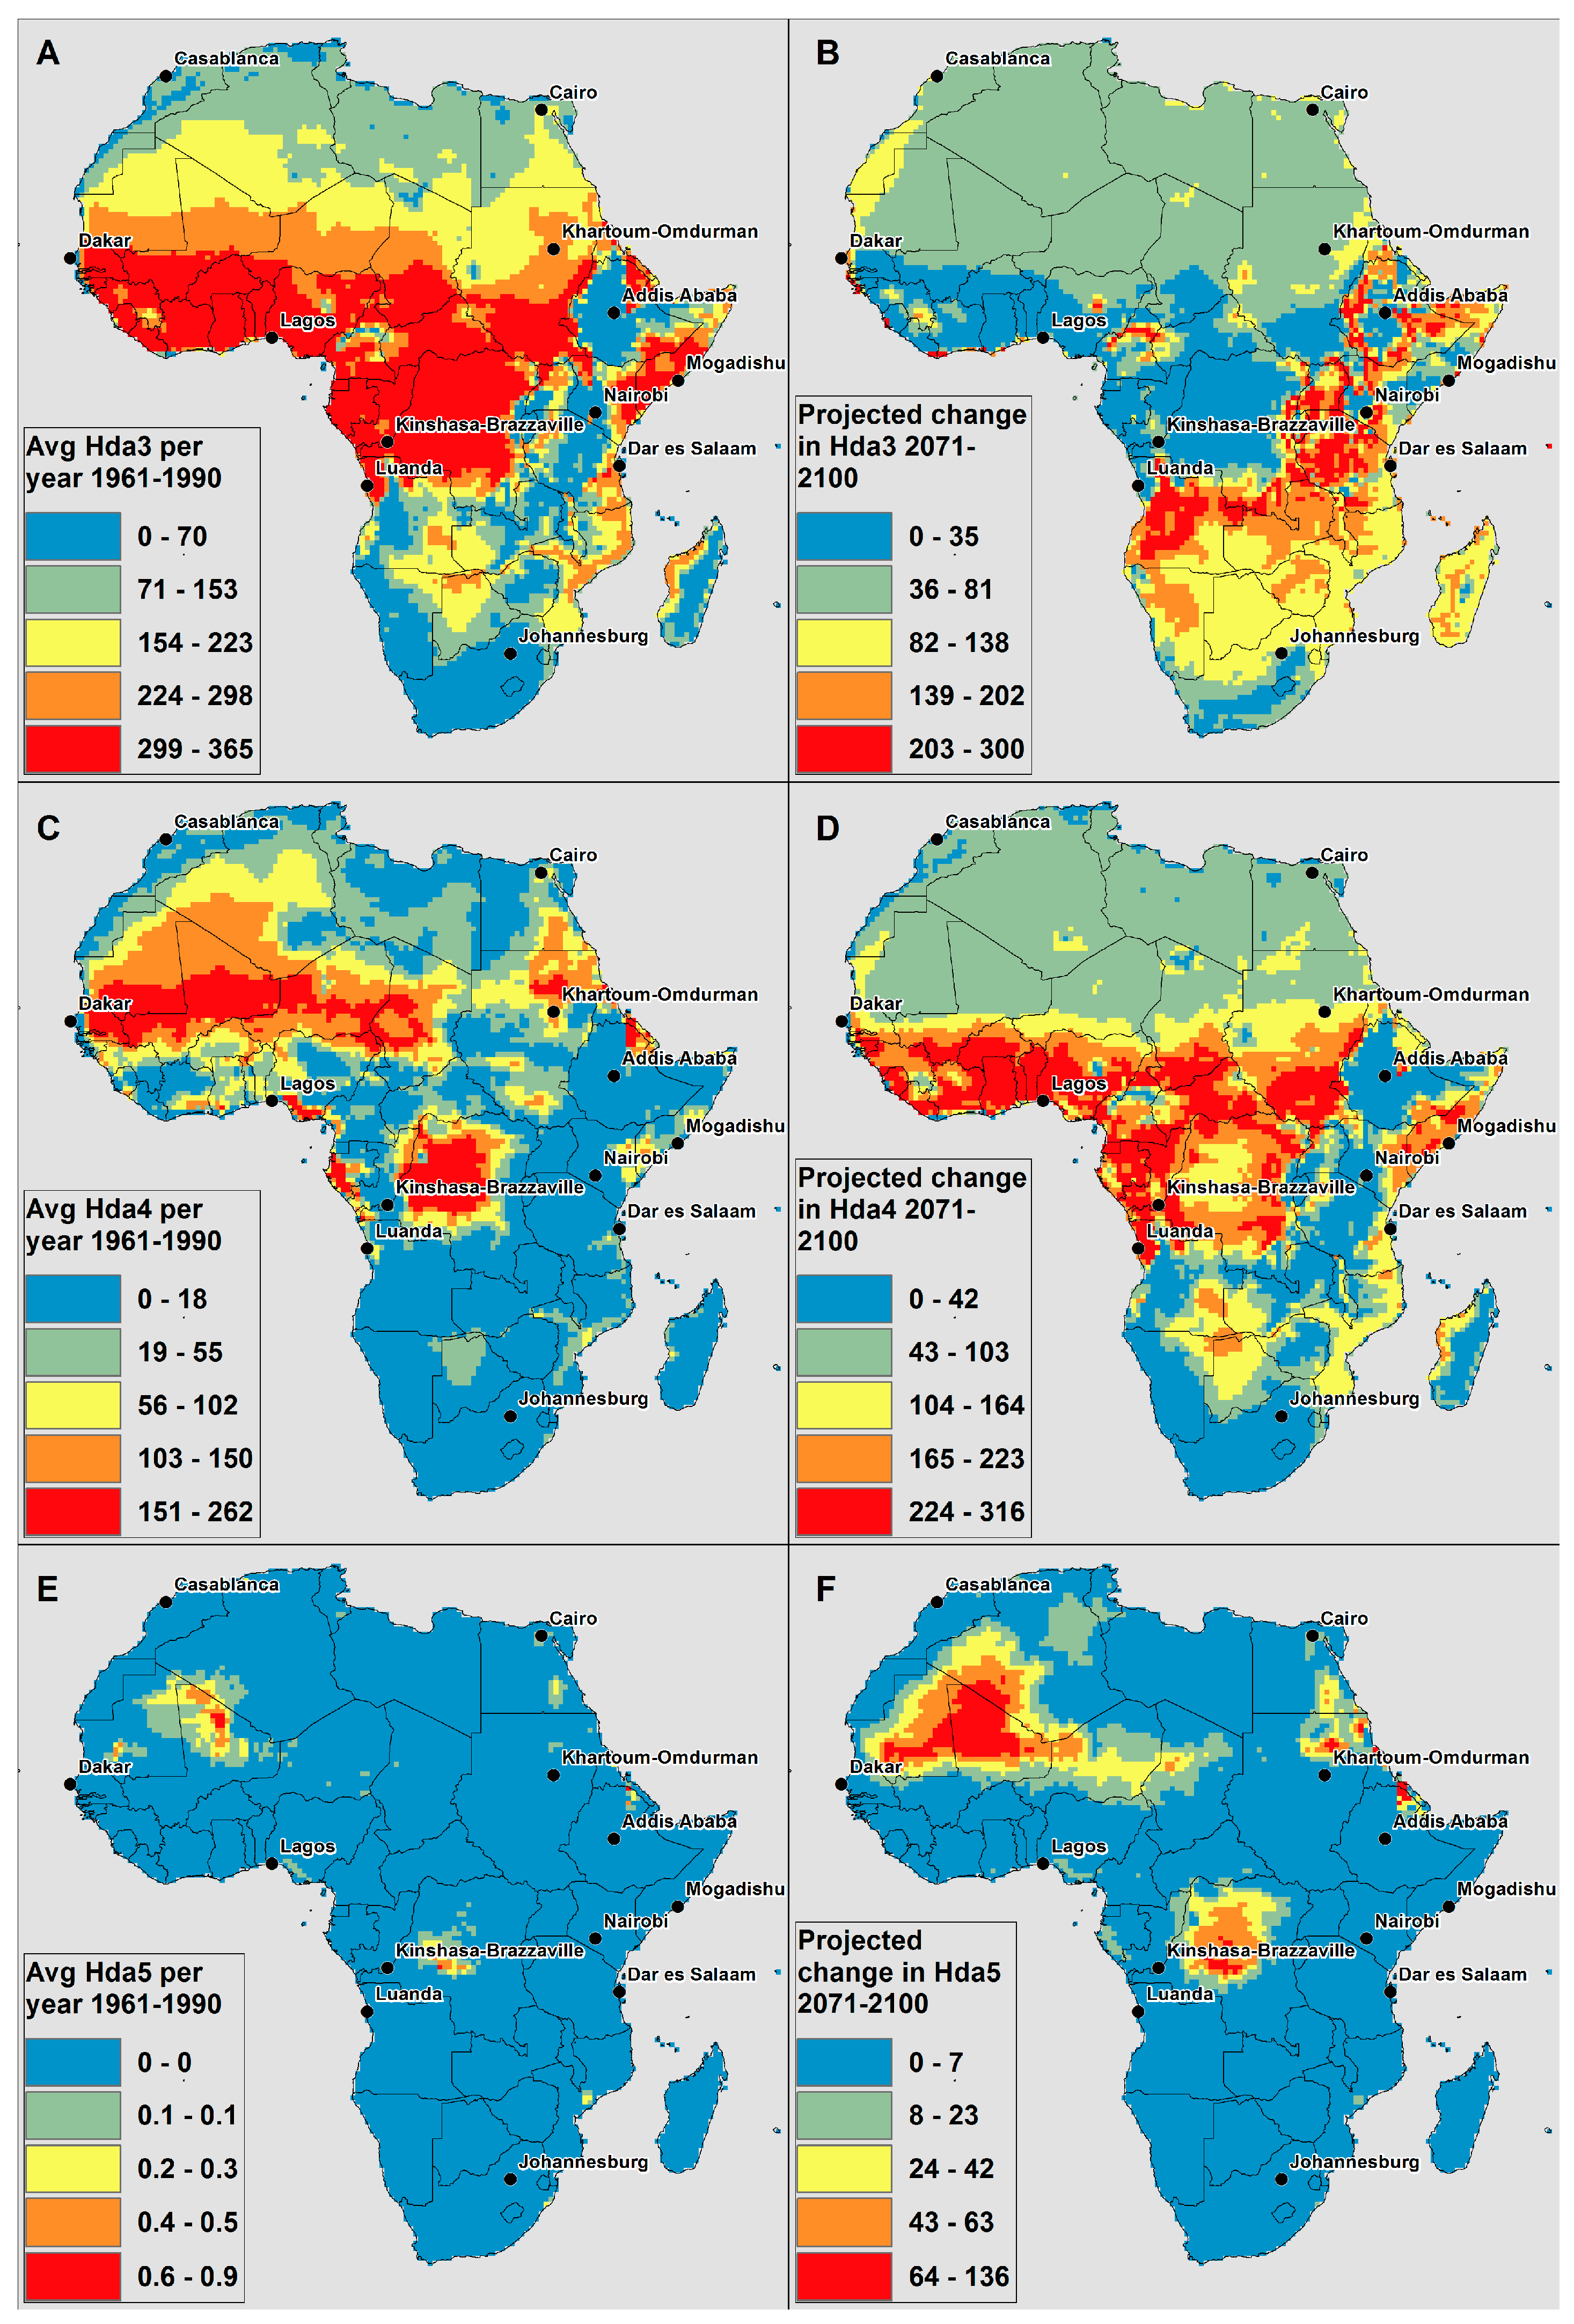
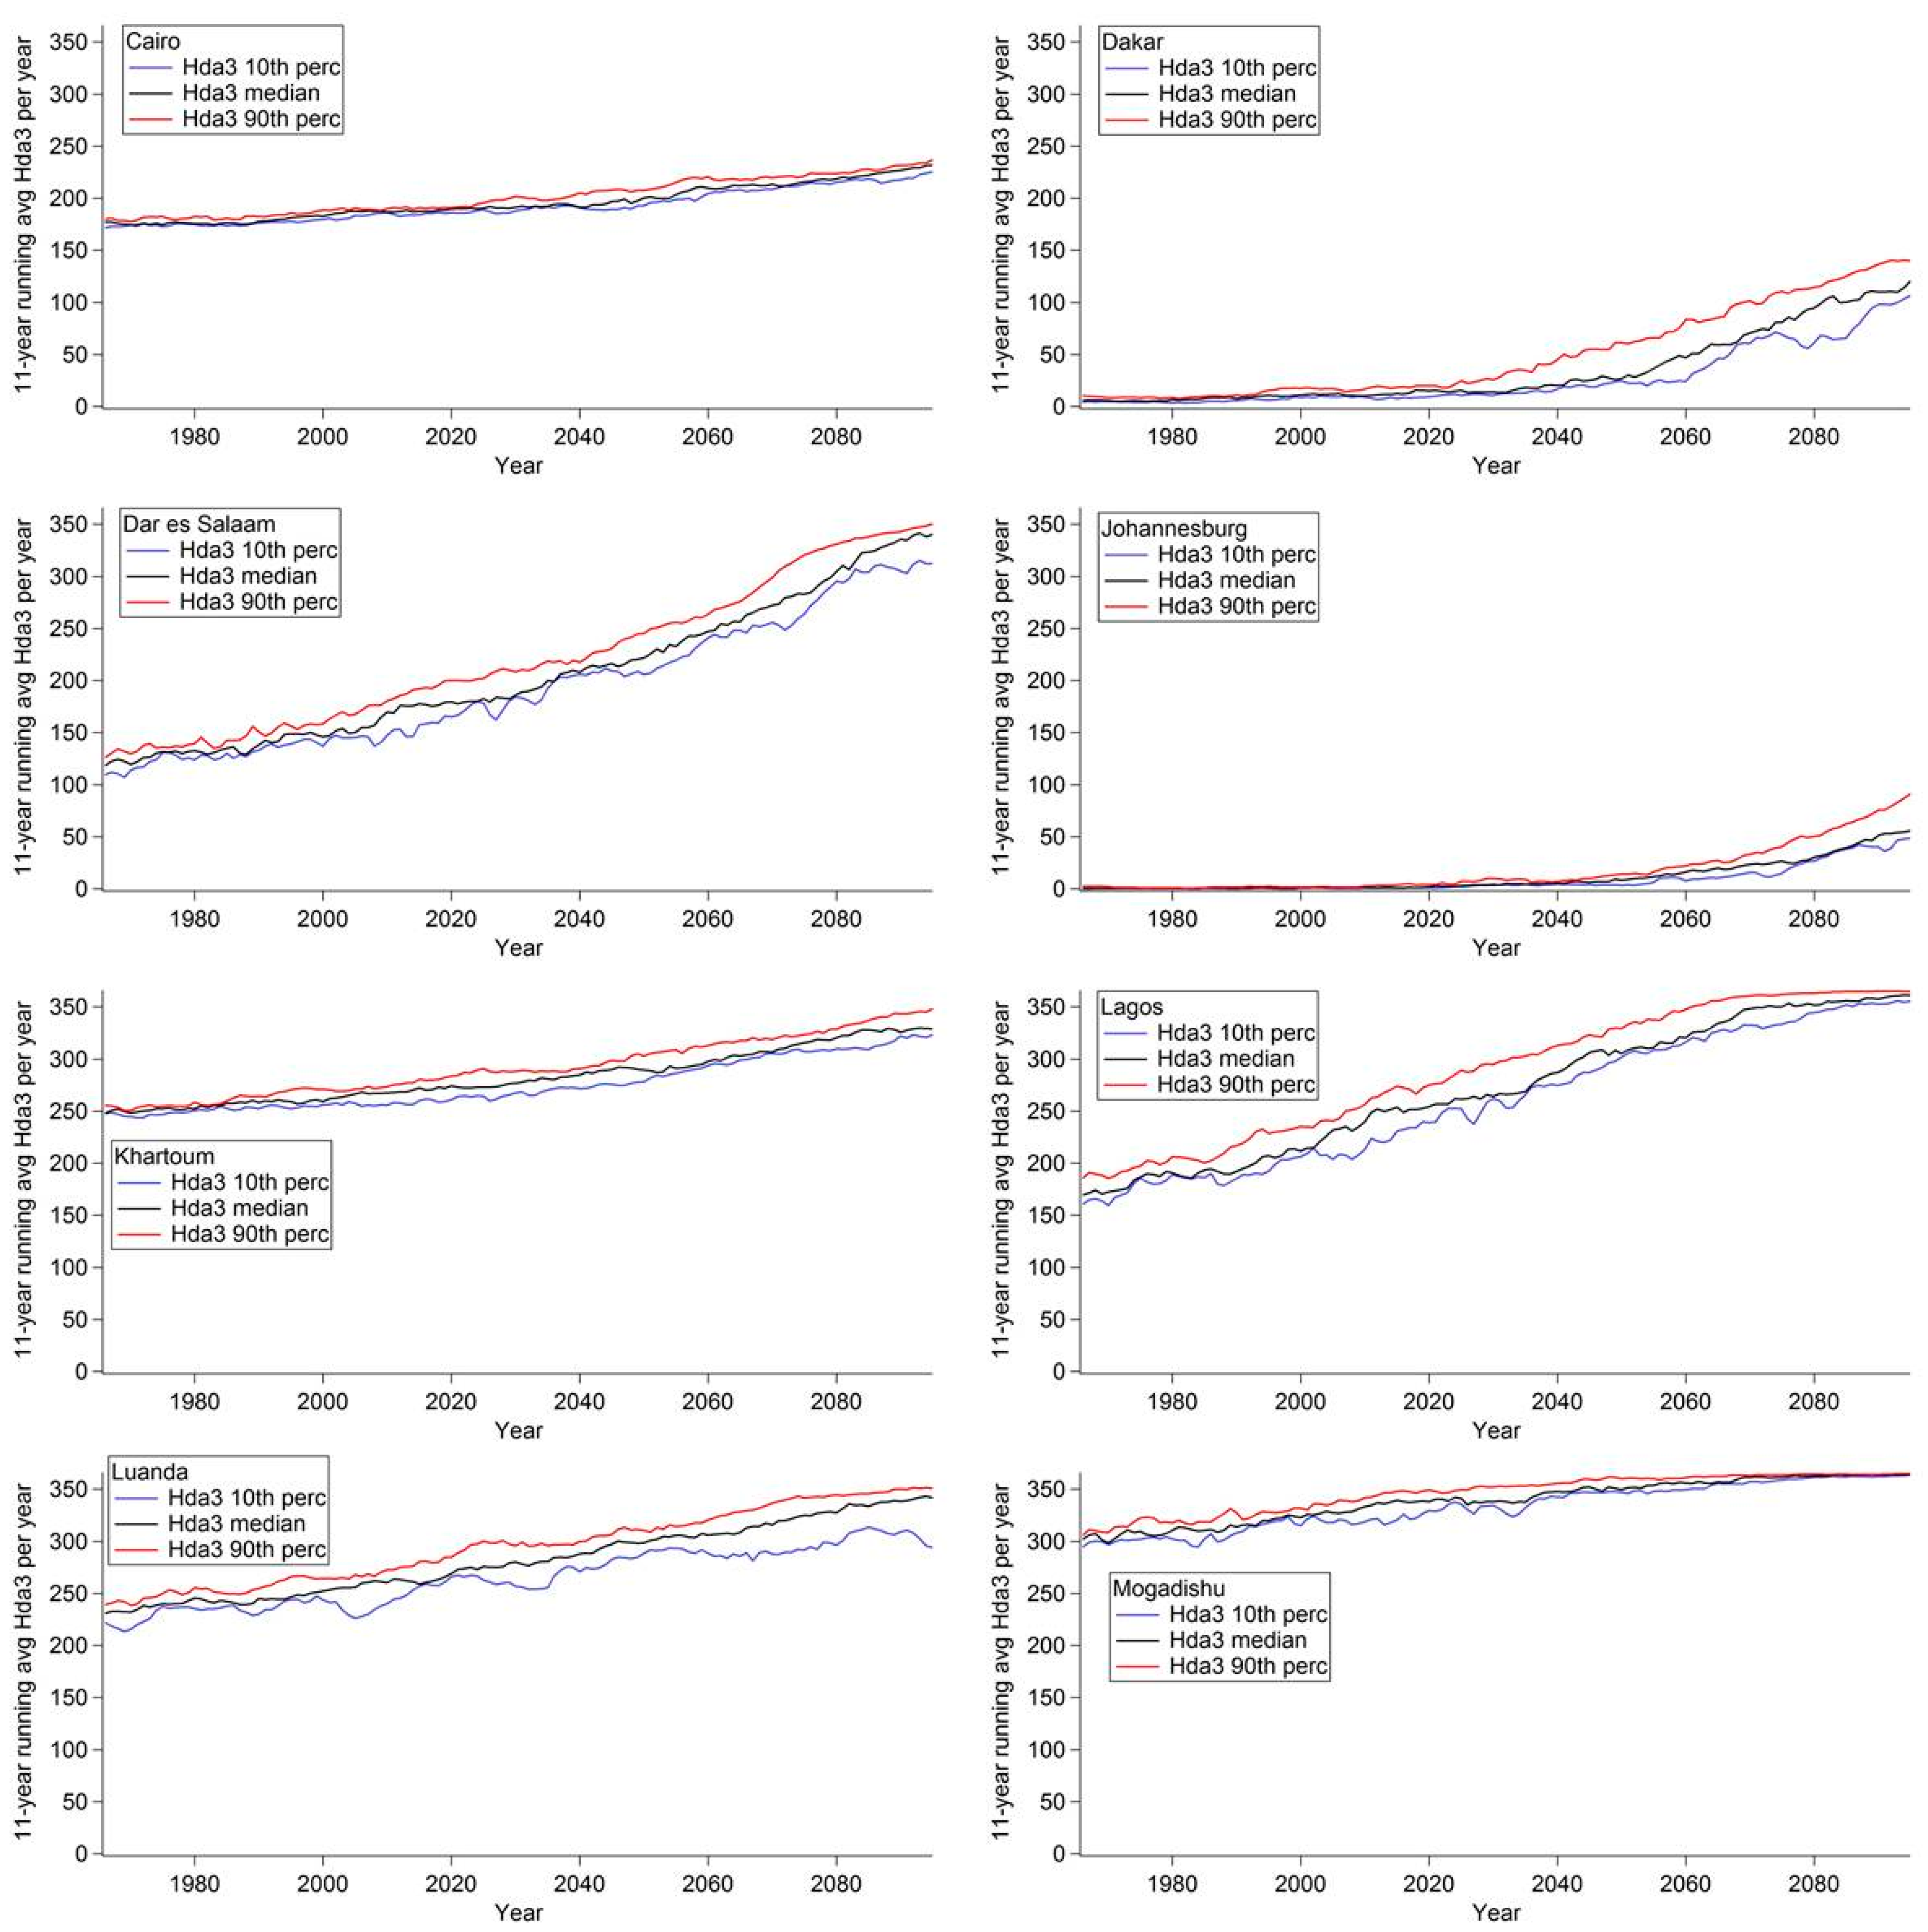
- Hda3 = Days where ATmax ≥ 32 °C
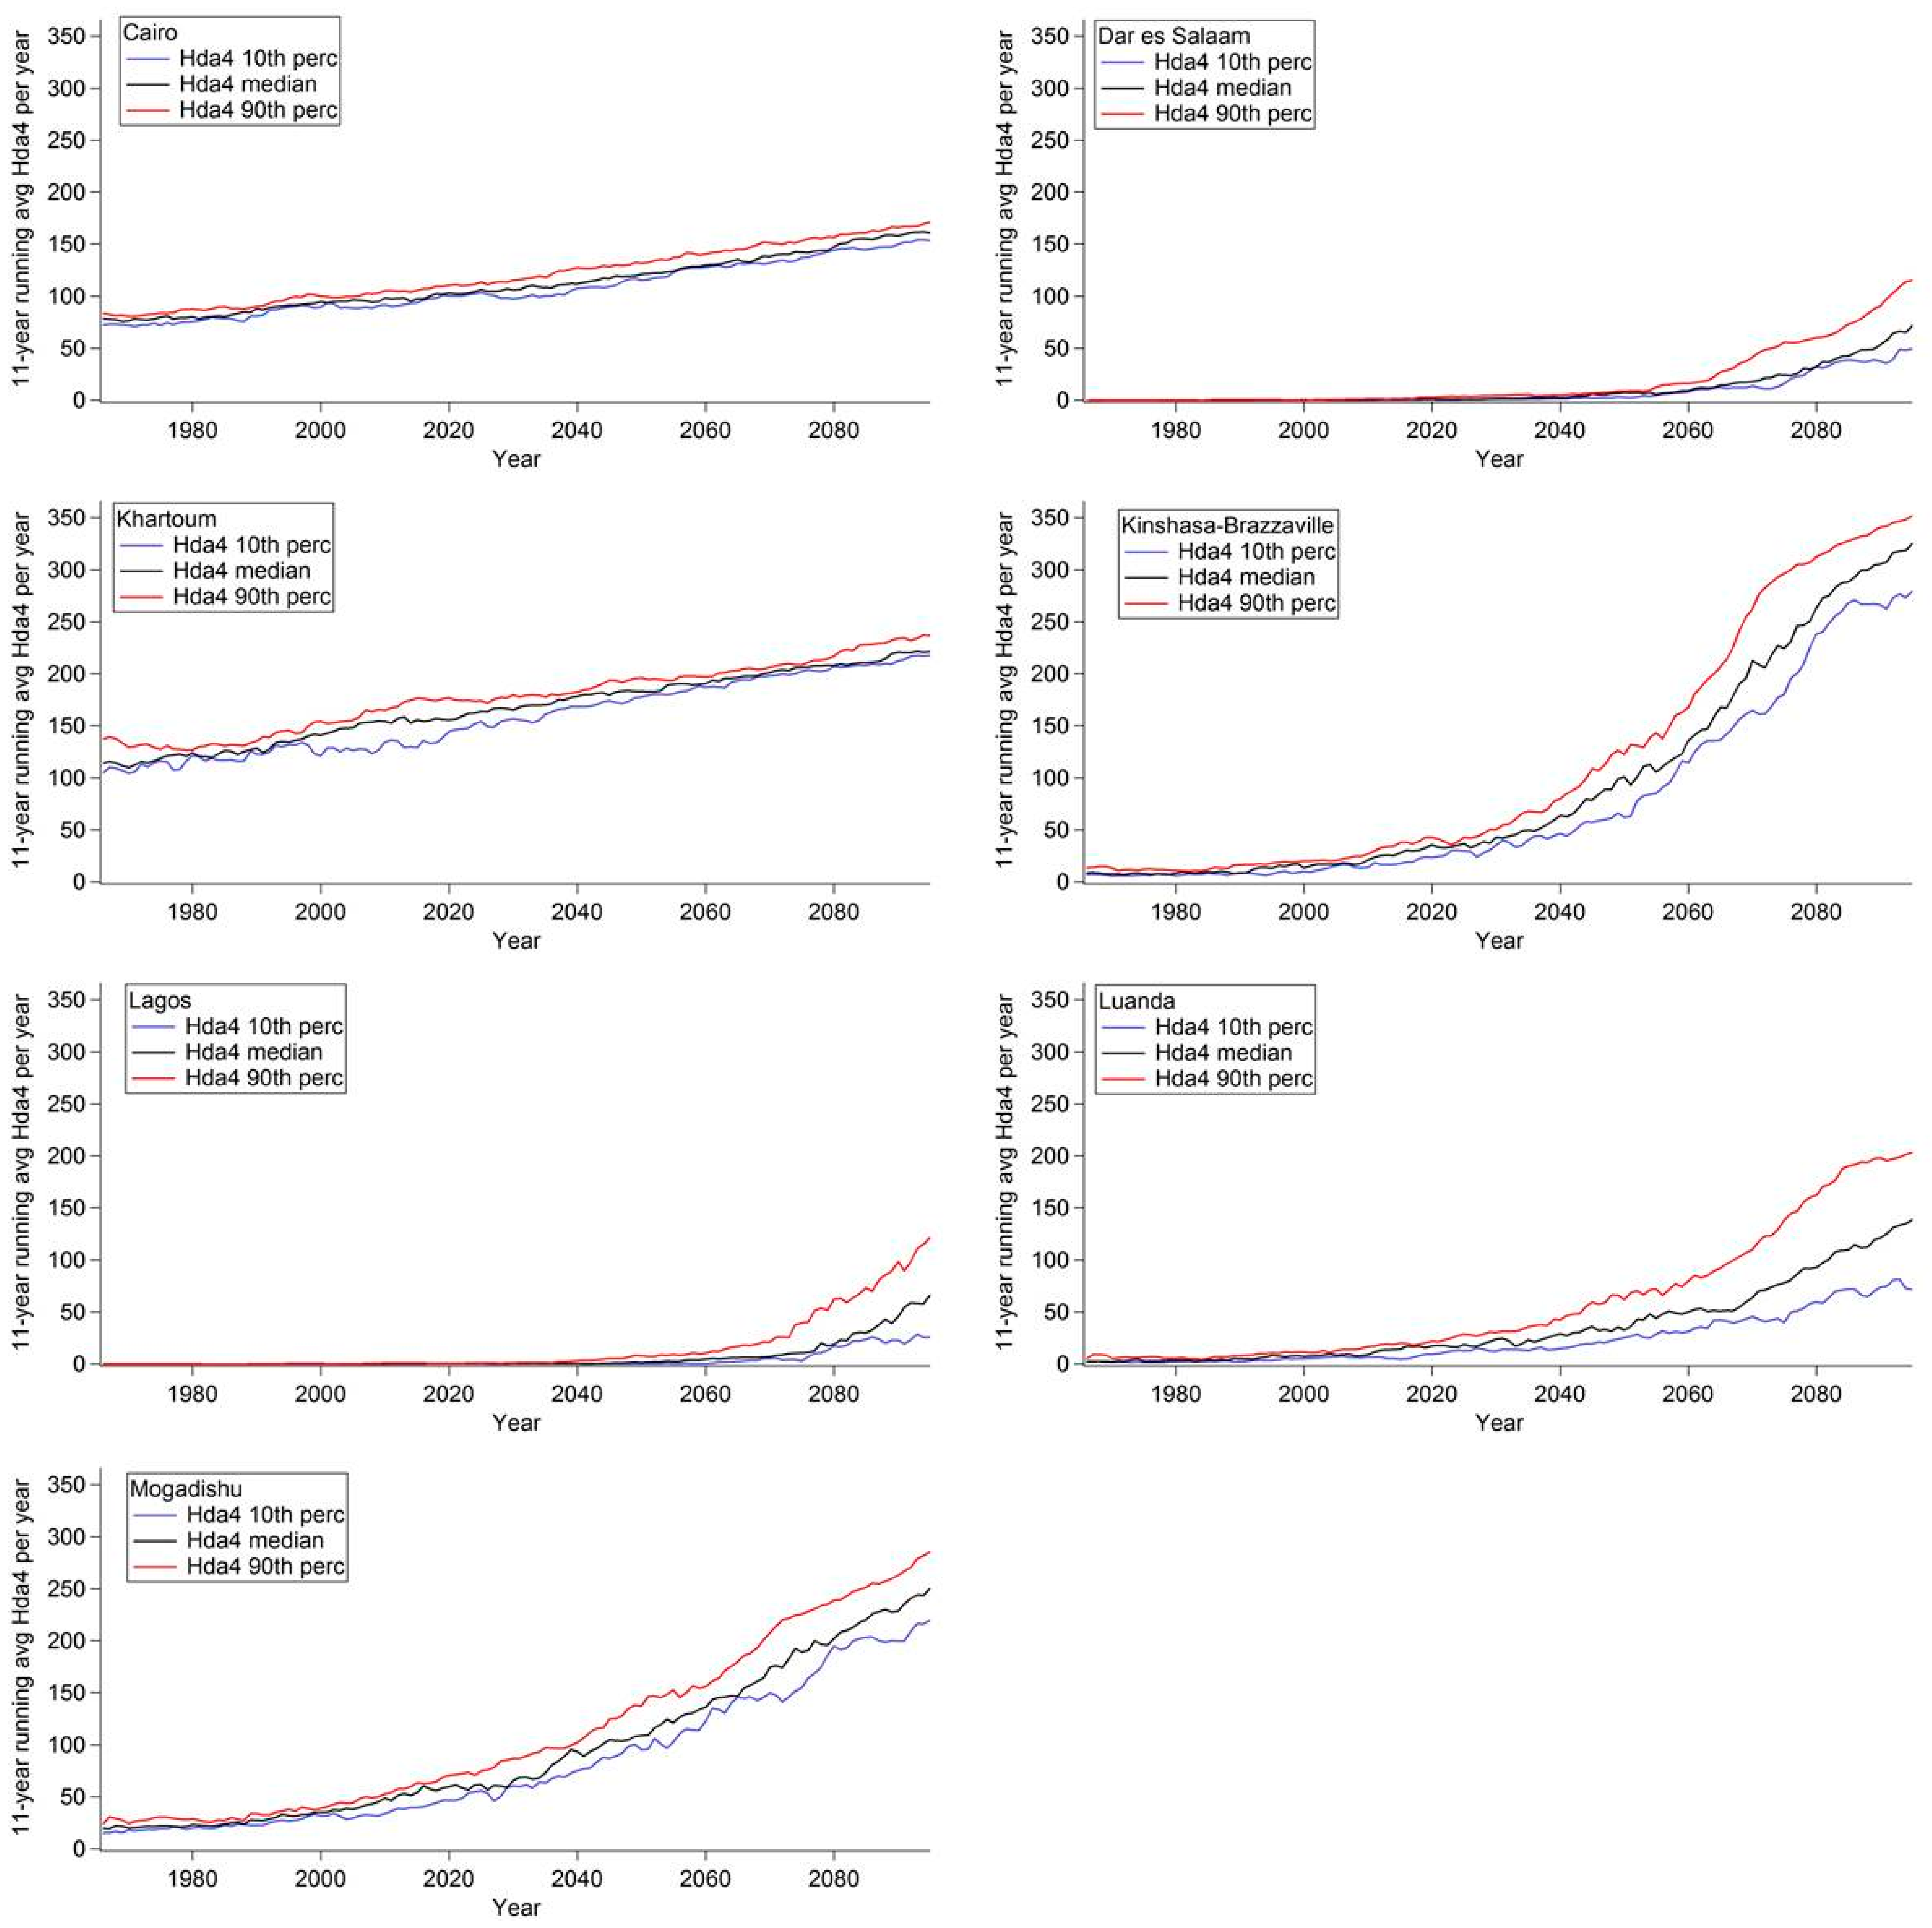
- Hda4 = Days where ATmax ≥ 39 °C
- Hda5 = Days where ATmax ≥ 51 °C
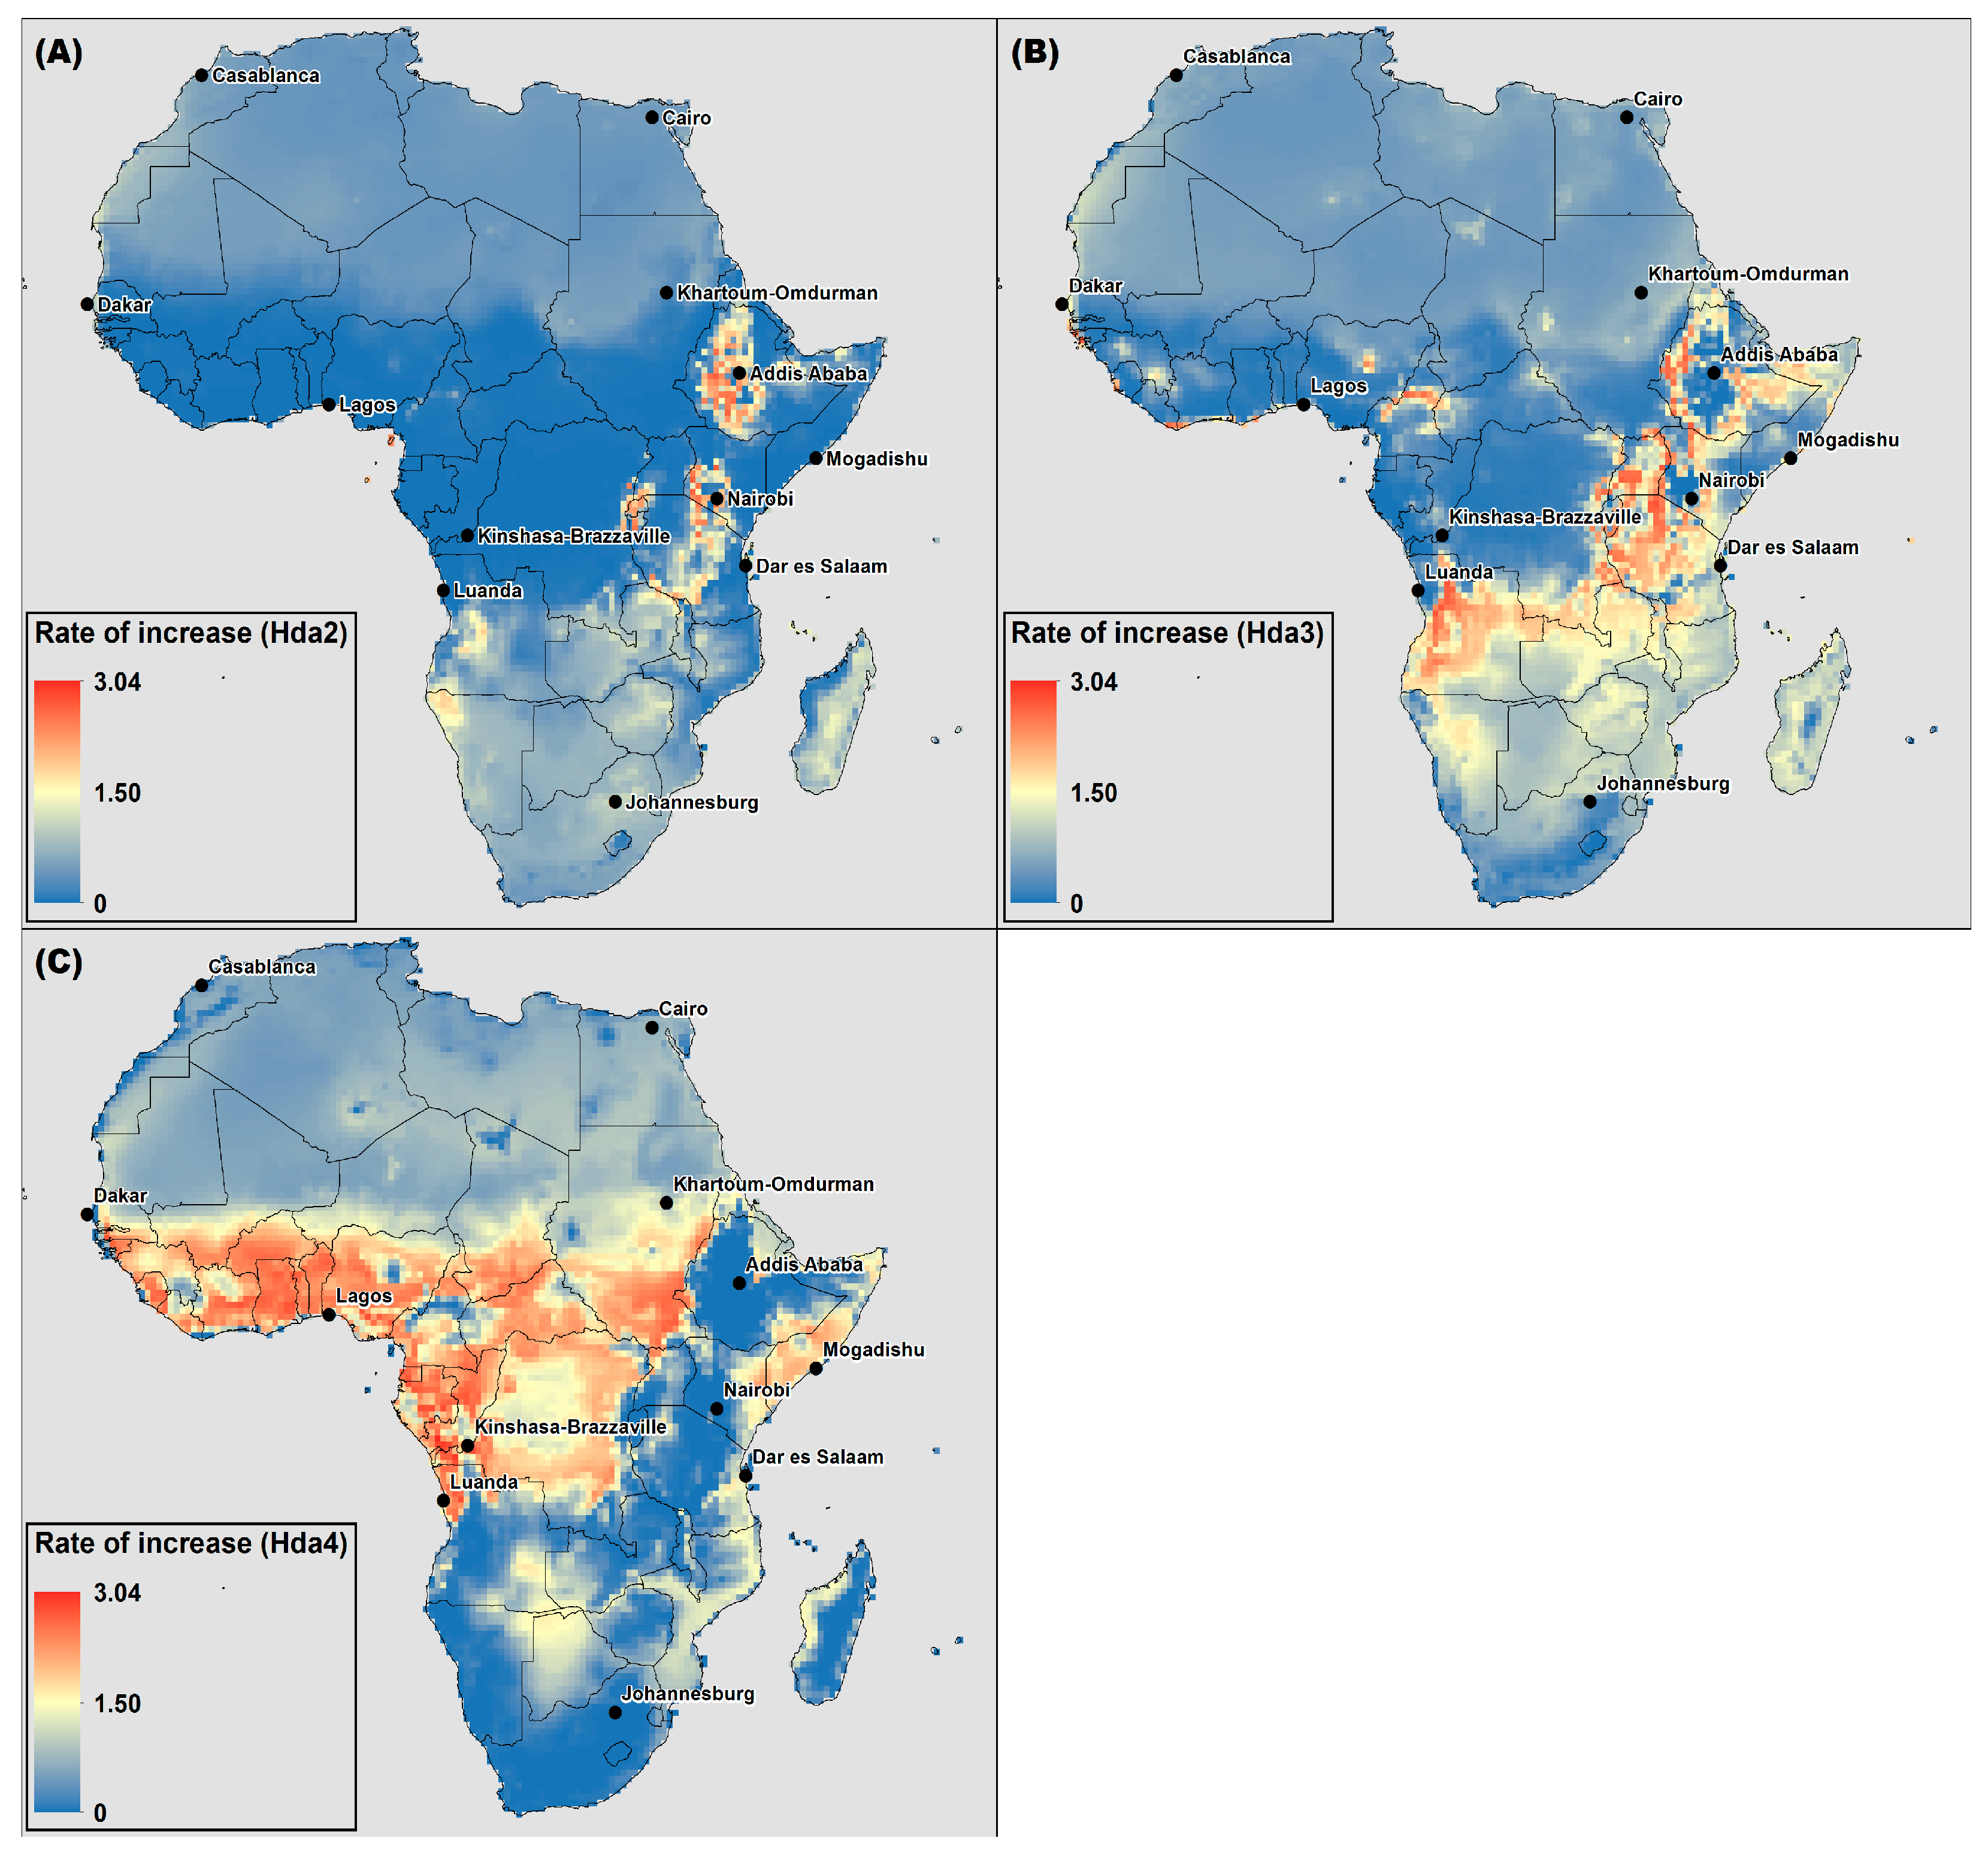
2.4. Rate of Increase of Projected Number of Hot Days
3. Results
3.1. Projected Number of Hot Days
3.2. Rate of Increase of Projected Number of Hot Days
| City, Country | Population in 2010 | Projected Population in 2020 | Projected Population in 2025 |
|---|---|---|---|
| Cairo, Egypt | 11,031,000 | 13,254,000 | 14,740,000 |
| Lagos, Nigeria | 10,788,000 | 15,825,000 | 18,857,000 |
| Kinshasa-Brazzaville conurbation, Democratic Republic of the Congo and Republic of the Congo | 9,972,000 | 14,396,000 | 16,899,000 |
| Luanda, Angola | 4,790,000 | 7,555,000 | 8,924,000 |
| Khartoum, Sudan | 4,516,000 | 6,018,000 | 7,090,000 |
| Johannesburg, South Africa | 3,763,000 | 4,421,000 | 4,732,000 |
| Nairobi, Kenya | 3,237,000 | 4,939,000 | 6,143,000 |
| Dar es Salaam, Tanzania | 3,415,000 | 5,677,000 | 7,276,000 |
| Casablanca, Morocco | 3,009,000 | 3,580,000 | 3,911,000 |
| Addis Ababa, Ethiopia | 2,919,000 | 3,881,000 | 4,705,000 |
| Dakar, Senegal | 2,926,000 | 4,227,000 | 5,064,000 |
| Mogadishu, Somalia | 1,426,000 | 2,693,000 | 3,309,000 |
3.3. Symptom Bands
4. Discussion and Conclusions
Supplementary Files
Supplementary File 1Acknowledgments
Author Contributions
Conflicts of Interest
References
- Collins, J.M. Temperature variability over Africa. J. Clim. 2011, 24, 3649–3666. [Google Scholar] [CrossRef]
- Niang, I.; Ruppel, O.C.; Abdrabo, M.A.; Essel, A.; Lennard, C.; Padgham, J.; Urquhart, P. Africa. In Climate change 2014: Impacts, Adaptation, and Vulnerability. Part B: Regional Aspects. Contribution of Working Group II to the Fifth Assessment Report of the Intergovernmental Panel of Climate Change; Barros, V.R., Field, C.B., Dokken, D.J., Mastrandrea, M.D., Mach, K.J., Bilir, T.E., Chatterjee, M., Ebi, K.L., Estrada, Y.O., Genova, R.C., et al., Eds.; Cambridge University Press: Cambridge, UK; New York, NY, USA, 2014; pp. 1199–1265. [Google Scholar]
- Kovats, R.S.; Hajat, S. Heat stress and public health: A critical review. Annu. Rev. Public Health 2008, 29, 41–55. [Google Scholar] [CrossRef] [PubMed]
- Kilbourne, E.M. Heat waves and hot environments. In The Public Health Consequences of Disasters; Noji, E.K., Ed.; Oxford University Press: New York, NY, USA, 1997. [Google Scholar]
- Chung, J.-Y.; Honda, Y.; Hong, Y.-C.; Pan, X.-C.; Guo, Y.-L.; Kim, H. Ambient temperature and mortality: An international study in four capital cities of east asia. Sci. Total Environ. 2009, 408, 390–396. [Google Scholar] [CrossRef] [PubMed]
- Baccini, M.; Biggeri, A.; Accetta, G.; Kosatsky, T.; Katsouyanni, K.; Analitis, A.; Anderson, H.R.; Bisanti, L.; D’Ippoliti, D.; Danova, J.; et al. Heat effects on mortality in 15 European cities. Epidemiology 2008, 19, 711–719. [Google Scholar] [CrossRef] [PubMed]
- Baccini, M.; Kosatsky, T.; Analitis, A.; Anderson, H.R.; D’Ovidio, M.; Menne, B.; Michelozzi, P.; Biggeri, A.; Grp, P.C. Impact of heat on mortality in 15 European cities: Attributable deaths under different weather scenarios. J. Epidemiol. Community Health 2011, 65, 64–70. [Google Scholar] [CrossRef] [PubMed]
- Rocklov, J.; Ebi, K.; Forsberg, B. Mortality related to temperature and persistent extreme temperatures: A study of cause-specific and age-stratified mortality. Occup. Environ. Med. 2011, 68, 531–536. [Google Scholar] [CrossRef] [PubMed]
- Basu, R.; Samet, J.M. Relation between elevated ambient temperature and mortality: A review of the epidemiologic evidence. Epidemiol. Rev. 2002, 24, 190–202. [Google Scholar] [CrossRef] [PubMed]
- Azhar, G.S.; Mavalankar, D.; Nori-Sarma, A.; Rajiva, A.; Dutta, P.; Jaiswal, A.; Sheffield, P.; Knowlton, K.; Hess, J.J.; on behalf of the Ahmedabad HeatClimate Study Group. Heat-related mortality in India: Excess all-cause mortality associated with the 2010 ahmedabad heat wave. Plos One 2014, 9. [Google Scholar] [CrossRef] [PubMed]
- Medina-Ramon, M.; Schwartz, J. Temperature, temperature extremes, and mortality: A study of acclimatisation and effect modification in 50 US cities. Occup. Environ. Med. 2007, 64, 827–833. [Google Scholar] [CrossRef] [PubMed]
- Burkart, K.; Breitner, S.; Schneider, A.; Khan, M.M.H.; Kraemer, A.; Endlicher, W. An analysis of heat effects in different subpopulations of Bangladesh. Int. J. Biometeorol. 2014, 58, 227–237. [Google Scholar] [CrossRef] [PubMed]
- Burkart, K.A.; Khan, M.M.H.; Schneider, A.; Breitner, S.; Langner, M.; Kraemer, A.; Endlicher, W. The effects of season and meteorology on human mortality in tropical climates: A systematic review. Trans. R. Soc. Trop. Med. Hyg. 2014, 108, 393–401. [Google Scholar] [CrossRef] [PubMed]
- Bell, M.L.; O’Neill, M.S.; Ranjit, N.; Borja-Aburto, V.H.; Cifuentes, L.A.; Gouveia, N.C. Vulnerability to heat-related mortality in Latin America: A case-crossover study in Sao Paulo, Brazil, Santiago, Chile and Mexico City, Mexico. Int. J. Epidemiol. 2008, 37, 796–804. [Google Scholar] [CrossRef] [PubMed]
- Diboulo, E.; Sie, A.; Rocklov, J.; Niamba, L.; Ye, M.; Bagagnan, C.; Sauerborn, R. Weather and mortality: A 10 year retrospective analysis of the nouna health and demographic surveillance system, Burkina Faso. Glob. Health Action 2012, 5. [Google Scholar] [CrossRef] [PubMed]
- Egondi, T.; Kyobutungi, C.; Kovats, S.; Muindi, K.; Ettarh, R.; Rocklov, J. Time-series analysis of weather and mortality patterns in Nairobi’s informal settlements. Glob. Health Action 2012, 5, 23–32. [Google Scholar] [CrossRef] [PubMed]
- Azongo, D.K.; Awine, T.; Wak, G.; Binka, F.N.; Oduro, A.R. A time series analysis of weather variability and all-cause mortality in the Kasena-Nankana districts of Northern Ghana, 1995–2010. Glob. Health Action 2012, 5, 14–22. [Google Scholar] [CrossRef] [PubMed]
- Smith, K.R.; Woodward, A.; Campbell-Lendrum, D.; Chadee, D.D.; Honda, Y.; Liu, Q.; Olwoch, J.M.; Revich, B.; Sauerborn, R. Human health: Impacts, adaptation, and co-benefits. In Climate Change 2014: Impacts, Adaptation, and Vulnerability. Part A: Global and Sectoral Aspects. Contribution of Working Group II to the Fifth Assessment Report of the Intergovernmental Panel of Climate Change; Field, C.B., Barros, V.R., Dokken, D.J., Mach, K.J., Mastrandrea, M.D., Bilir, T.E., Chatterjee, M., Ebi, K.L., Estrada, Y.O., Genova, R.C., et al., Eds.; Cambridge University Press: Cambridge, UK; New York, NY, USA, 2014; pp. 709–754. [Google Scholar]
- Ballester, J.; Robine, J.-M.; Herrmann, F.R.; Rodo, X. Long-term projections and acclimatization scenarios of temperature-related mortality in Europe. Nat. Commun. 2011, 2. [Google Scholar] [CrossRef] [PubMed]
- McMichael, A.J.; Campbell-Lendrum, D.; Kovats, R.S.; Edwards, S.; Wilkinson, P.; Wilson, T.; Nicholls, R.; Hales, S.; Tanser, F.; Le Sueur, D.; et al. Global climate change. In Comparative Quantification of Health Risks: Global and Regional Burden of Disease due to Selected Major Risk Factors; WHO: Geneva, Switzerland, 2004. [Google Scholar]
- Hajat, S.; Kosatky, T. Heat-related mortality: A review and exploration of heterogeneity. J. Epidemiol. Community Health 2010, 64, 753–760. [Google Scholar] [CrossRef] [PubMed]
- Huang, C.; Barnett, A.G.; Wang, X.; Vaneckova, P.; FitzGerald, G.; Tong, S. Projecting future heat-related mortality under climate change scenarios: A systematic review. Environ. Health Perspect. 2011, 119, 1681–1690. [Google Scholar] [CrossRef] [PubMed]
- Kynast-Wolf, G.; Preuss, M.; Sie, A.; Kouyate, B.; Becher, H. Seasonal patterns of cardiovascular disease mortality of adults in Burkina Faso, West Africa. Trop. Med. Int. Health 2010, 15, 1082–1089. [Google Scholar] [CrossRef] [PubMed]
- Kravchenko, J.; Abernethy, A.P.; Fawzy, M.; Lyerly, H.K. Minimization of heatwave morbidity and mortality. Am. J. Prev. Med. 2013, 44. [Google Scholar] [CrossRef] [PubMed]
- Sherwood, S.C.; Huber, M. An adaptability limit to climate change due to heat stress. Proc. Natl. Acad. Sci. USA 2010, 107, 9552–9555. [Google Scholar] [CrossRef] [PubMed]
- Rocklov, J.; Ebi, K.L. High dose extrapolation in climate change projections of heat-related mortality. J. Agric. Biol. Environ. Stat. 2012, 17, 461–475. [Google Scholar] [CrossRef]
- Anderson, G.B.; Bell, M.L. Heat waves in the United States: Mortality risk during heat waves and effect modification by heat wave characteristics in 43 U.S. Communities. Environ. Health Perspect. 2011, 119, 210–218. [Google Scholar] [CrossRef] [PubMed]
- Hajat, S.; Kovats, R.S.; Atkinson, R.W.; Haines, A. Impact of hot temperature on death in London: A time series approach. J. Epidemiol. Community Health 2002, 56, 367–372. [Google Scholar] [CrossRef] [PubMed]
- Vigotti, M.A.; Muggeo, V.M.R.; Cusimano, R. The effect of birthplace on heat tolerance and mortality in Milan, Italy, 1980–1989. Int. J. Biometeorol. 2006, 50, 335–341. [Google Scholar] [CrossRef] [PubMed]
- Bobb, J.F.; Peng, R.D.; Bell, M.L.; Dominici, F. Heat-related mortality and adaptation to heat in the United States. Environ. Health Perspect. 2014, 122, 811–816. [Google Scholar] [CrossRef] [PubMed]
- Davis, R.E.; Knappenberger, P.C.; Michaels, P.J.; Novicoff, W.M. Changing heat-related mortality in the United States. Environ. Health Perspect. 2003, 111, 1712–1718. [Google Scholar] [CrossRef] [PubMed]
- Donaldson, G.C.; Keatinge, W.R.; Nayha, S. Changes in summer temperature and heat-related mortality since 1971 in north Carolina, south Finland, and southeast England. Environ. Res. 2003, 91, 1–7. [Google Scholar] [CrossRef]
- Davis, R.E.; Knappenberger, P.C.; Novicoff, W.M.; Michaels, P.J. Decadal changes in summer mortality in US cities. Int. J. Biometeorol. 2003, 47, 166–175. [Google Scholar] [PubMed]
- Astrom, D.O.; Forsberg, B.; Edvinsson, S.; Rocklov, J. Acute fatal effects of short-lasting extreme temperatures in Stockholm, Sweden evidence across a century of change. Epidemiology 2013, 24, 820–829. [Google Scholar] [CrossRef] [PubMed]
- Petkov, E.P.; Gasparrini, A.; Kinney, P.L. Heat and mortality in new york city since the beginning of the 20th century. Epidemiology 2014, 25, 554–560. [Google Scholar] [CrossRef] [PubMed]
- McGregor, J.L. C-cam: Geometric Aspects And Dynamical Formulation; CSIRO Atmospheric Research: Aspendale, Australia, 2005; p. 43. [Google Scholar]
- McGregor, J.L.; Dix, M.R. An updated description of the conformal-cubic atmospheric model. In High Resolution Simulation of the Atmosphere and Ocean; Hamilton, K., Ohfuchi, W., Eds.; Springer-Verlag: New York, NY, USA, 2008; pp. 51–76. [Google Scholar]
- IPCC. Climate Change 2007: The Physical Science Basis. Contribution of Working Group I to the Fourth Assessment Report of the Intergovernmental Panel on Climate Change; Cambridge University Press: Cambridge, UK; New York, NY, USA, 2007; p. 996. [Google Scholar]
- Nakićenović, N.; Swart, R.E. Special Report on Emissions Scenarios. A Special Report of Working Group III of the Intergovernmental Panel on Climate Change; Cambridge University Press: Cambridge, United Kingdom; New York, NY, USA, 2000; p. 599. [Google Scholar]
- Engelbrecht, F.A.; Landman, W.A.; Engelbrecht, C.J.; Landman, S.; Bopape, M.M.; Roux, B.; McGregor, J.L.; Thatcher, M. Multi-scale climate modelling over southern Africa using a variable-resolution global model. Water SA 2011, 37, 647–658. [Google Scholar] [CrossRef]
- Engelbrecht, C.J.; Engelbrecht, F.A.; Dyson, L.L. High-resolution model-projected changes in mid-tropospheric closed-lows and extreme rainfall events over Southern Africa. Int. J. Climatol. 2013, 33, 173–187. [Google Scholar] [CrossRef]
- Engelbrecht, F.A.; McGregor, J.L.; Engelbrecht, C.J. Dynamics of the conformal-cubic atmospheric model projected climate-change signal over Southern Africa. Int. J. Climatol. 2009, 29, 1013–1033. [Google Scholar] [CrossRef]
- Malherbe, J.; Engelbrecht, F.A.; Landman, W.A. Projected changes in tropical cyclone climatology and landfall in the southwest Indian ocean region under enhanced anthropogenic forcing. Clim. Dyn. 2013, 40, 2867–2886. [Google Scholar] [CrossRef]
- Winsemius, H.C.; Dutra, E.; Engelbrecht, F.A.; Van Garderen, E.A.; Wetterhall, F.; Pappenberger, F.; Werner, M.G.F. The potential value of seasonal forecasts in a changing climate in Southern Africa. Hydrol. Earth Syst. Sci. 2014, 18, 1525–1538. [Google Scholar] [CrossRef]
- Mitchell, T.D.; Jones, P.D. An improved method of constructing a database of monthly climate observations and associated high-resolution grids. Int. J. Climatol. 2005, 25, 693–712. [Google Scholar] [CrossRef]
- Engelbrecht, C.J.; Engelbrecht, F.A. Shifts in köppen-geiger climate zones over Southern Africa in relation to key global temperature goals. Theor. Appl. Climatol. 2015. [Google Scholar] [CrossRef]
- Steadman, R.G. The assessment of sultriness part I: A temperature-humidity index based on human physiology and clothing science. J. Appl. Meteorol. 1979, 18, 861–873. [Google Scholar] [CrossRef]
- Michelozzi, P.; Accetta, G.; De Sario, M.; D’Ippoliti, D.; Marino, C.; Baccini, M.; Biggeri, A.; Anderson, H.R.; Katsouyanni, K.; Ballester, F.; et al. High temperature and hospitalizations for cardiovascular and respiratory causes in 12 European cities. Am. J. Respir. Crit. Care Med. 2009, 179, 383–389. [Google Scholar] [CrossRef] [PubMed]
- Astrom, D.O.; Schifano, P.; Asta, F.; Lallo, A.; Michelozzi, P.; Rocklov, J.; Forsberg, B. The effect of heat waves on mortality in susceptible groups: A cohort study of a mediterranean and a northern European city. Environ. Health 2015, 14. [Google Scholar] [CrossRef]
- Basu, R. High ambient temperature and mortality: A review of epidemiologic studies from 2001 to 2008. Environ. Health 2009, 8. [Google Scholar] [CrossRef] [PubMed]
- Basu, R.; Feng, W.-Y.; Ostro, B.D. Characterizing temperature and mortality in nine California counties. Epidemiology 2008, 19, 138–145. [Google Scholar] [CrossRef] [PubMed]
- Zanobetti, A.; Schwartz, J. Temperature and mortality in nine US cities. Epidemiology 2008, 19, 563–570. [Google Scholar] [CrossRef] [PubMed]
- Michelozzi, P.; De Sario, M.; Accetta, G.; De’Donato, F.; Kirchmayer, U.; D’Ovidio, M.; Perucci, C.A.; Grp, H.C. Temperature and summer mortality: Geographical and temporal variations in four Italian cities. J. Epidemiol. Community Health 2006, 60, 417–423. [Google Scholar] [CrossRef] [PubMed]
- Stafoggia, M.; Forastiere, F.; Agostini, D.; Biggeri, A.; Bisanti, L.; Cadum, E.; Caranci, N.; de’Donato, F.; De Lisio, S.; De Maria, M.; et al. Vulnerability to heat-related mortality—A multicity, population-based, case-crossover analysis. Epidemiology 2006, 17, 315–323. [Google Scholar] [CrossRef] [PubMed]
- Almeida, S.P.; Casimiro, E.; Calheiros, J. Effects of apparent temperature on daily mortality in Lisbon and Oporto, Portugal. Environ. Health 2010, 9. [Google Scholar] [CrossRef] [PubMed]
- Urban, A.; Kysely, J. Comparison of utci with other thermal indices in the assessment of heat and cold effects on cardiovascular mortality in the Czech Republic. Int. J. Environ. Res. Public Health 2014, 11, 952–967. [Google Scholar] [CrossRef] [PubMed]
- Wichmann, J.; Ketzel, M.; Ellermann, T.; Loft, S. Apparent temperature and acute myocardial infarction hospital admissions in Copenhagen, Denmark: A case-crossover study. Environ. Health 2012, 11. [Google Scholar] [CrossRef] [PubMed]
- Smoyer, K.E.; Rainham, D.G.C.; Hewko, J.N. Heat-stress-related mortality in five cities in Southern Ontario: 1980–1996. Int. J. Biometeorol. 2000, 44, 190–197. [Google Scholar] [CrossRef] [PubMed]
- Smoyer-Tomic, K.E.; Rainham, D.G.C. Beating the heat: Development and evaluation of a Canadian hot weather health-response plan. Environ. Health Perspect. 2001, 109, 1241–1248. [Google Scholar] [CrossRef] [PubMed]
- Steadman, R.G. Norms of apparent temperature in Australia. Aust. Meteorol. Mag. 1994, 43, 1–16. [Google Scholar]
- Australian Government Bureau of Meteorology. Thermal Comfort Observations. Available online: http://www.bom.gov.au/info/thermal_stress/ (accessed on 14 September 2015).
- National Weather Service Weather Forecast Office: Amarillo, T.X. What Is the Heat Index? Available online: http://www.srh.noaa.gov/ama/?n=heatindex (accessed on 14 September 2015).
- McMichael, A.J.; Wilkinson, P.; Kovats, R.S.; Pattenden, S.; Hajat, S.; Armstrong, B.; Vajanapoom, N.; Niciu, E.M.; Mahomed, H.; Kingkeow, C.; et al. International study of temperature, heat and urban mortality: The “ISOTHURM” project. Int. J. Epidemiol. 2008, 37, 1121–1131. [Google Scholar] [CrossRef] [PubMed]
- Mrema, S.; Shamte, A.; Selemani, M.; Masanja, H. The influence of weather on mortality in rural Tanzania: A time-series analysis 1999–2010. Glob. Health Action 2012, 5, 33–43. [Google Scholar] [CrossRef] [PubMed]
- CDO. Climate Data Operators. Available online: http://www.mpimet.mpg.de/cdo (accessed on 14 September 2015).
- Wilks, D.S. Statistical Methods in the Atmospheric Sciences, 3rd ed.; Academic Press: San Diego, CA, USA, 2011. [Google Scholar]
- Engelbrecht, F.A.; Adegoke, J.; Bopape, M.J.; Naidoo, M.; Garland, R.M.; Thatcher, M.; McGregor, J.L.; Katzfey, J.; Werner, M.; Ichoku, C.; et al. Projections of rapidly rising surface temperatures over Africa under low mitigation. Environ. Res. Lett. 2015, 10. [Google Scholar] [CrossRef]
- United Nations Human Settlements Programme. State of African Cities; ISBN 978-92-1-132598-0. UN-HABITAT: Nairobi, Kenya, 2014. [Google Scholar]
- IPCC. Climate Change 2013: The Physical Science Basis. Contribution of Working Group I to the Fifth Assessment Report of the Intergovernmental Panel on Climate Change; Cambridge University Press: Cambridge, United Kingdom; New York, NY, USA, 2013; p. 1535. [Google Scholar]
- Myers, J.; Young, T.; Galloway, M.; Manyike, P.; Tucker, T. Responding to climate change in southern Africa—The role of research. Samj S. Afr. Med. J. 2011, 101, 820–822. [Google Scholar] [PubMed]
- Ebi, K.L.; Burton, I. Identifying practical adaptation options: An approach to address climate change-related health risks. Environ. Sci. Policy 2008, 11, 359–369. [Google Scholar] [CrossRef]
- Berry, P.; Yusa, A.; Morris-Oswald, T.; Rogaeva, A. Heat alert and response systems in urban and rural communities in Canada. Chang. Adapt. Socioecol. Syst. 2014, 1, 84–97. [Google Scholar] [CrossRef]
- Schifano, P.; Leone, M.; De Sario, M.; de’Donato, F.; Bargagli, A.M.; D’Ippoliti, D.; Marino, C.; Michelozzi, P. Changes in the effects of heat on mortality among the elderly from 1998–2010: Results from a multicenter time series study in Italy. Environ. Health 2012, 11. [Google Scholar] [CrossRef] [PubMed]
- Kalkstein, L.S.; Jamason, P.F.; Greene, J.S.; Libby, J.; Robinson, L. The philadelphia hot weather-health watch warning system: Development and application, summer 1995. Bull. Am. Meteorol. Soc. 1996, 77, 1519–1528. [Google Scholar] [CrossRef]
- Sheridan, S.C.; Kalkstein, L.S. Progress in heat watch-warning system technology. Bull. Am. Meteorol. Soc. 2004, 85, 1931–1941. [Google Scholar] [CrossRef]
- Tan, J.G.; Kalkstein, L.S.; Huang, J.X.; Lin, S.B.; Yin, H.B.; Shao, D.M. An operational heat/health warning system in Shanghai. Int. J. Biometeorol. 2004, 48, 157–162. [Google Scholar] [CrossRef] [PubMed]
- Pascal, M.; Laaidi, K.; Ledrans, M.; Baffert, E.; Caserio-Schonemann, C.; Le Tertre, A.; Manach, J.; Medina, S.; Rudant, J.; Empereur-Bissonnet, P. France’s heat health watch warning system. Int. J. Biometeorol. 2006, 50, 144–153. [Google Scholar] [CrossRef] [PubMed]
- Lowe, D.; Ebi, K.L.; Forsberg, B. Heatwave early warning systems and adaptation advice to reduce human health consequences of heatwaves. Int. J. Environ. Res. Public Health 2011, 8, 4623–4648. [Google Scholar] [CrossRef] [PubMed]
- O’Neill, M.S.; Ebi, K.L. Temperature extremes and health: Impacts of climate variability and change in the United States. J. Occup. Environ. Med. 2009, 51, 13–25. [Google Scholar] [CrossRef] [PubMed]
- WHO. Heat-Health Action Plans; WHO: Copenhagen, Denmark, 2008. [Google Scholar]
- Lazenby, M.J.; Landman, W.A.; Garland, R.M.; DeWitt, D.G. Seasonal temperature prediction skill over southern Africa and human health. Meteorol. Appl. 2014, 21, 963–974. [Google Scholar] [CrossRef]
© 2015 by the authors; licensee MDPI, Basel, Switzerland. This article is an open access article distributed under the terms and conditions of the Creative Commons Attribution license (http://creativecommons.org/licenses/by/4.0/).
Share and Cite
Garland, R.M.; Matooane, M.; Engelbrecht, F.A.; Bopape, M.-J.M.; Landman, W.A.; Naidoo, M.; Merwe, J.V.d.; Wright, C.Y. Regional Projections of Extreme Apparent Temperature Days in Africa and the Related Potential Risk to Human Health. Int. J. Environ. Res. Public Health 2015, 12, 12577-12604. https://doi.org/10.3390/ijerph121012577
Garland RM, Matooane M, Engelbrecht FA, Bopape M-JM, Landman WA, Naidoo M, Merwe JVd, Wright CY. Regional Projections of Extreme Apparent Temperature Days in Africa and the Related Potential Risk to Human Health. International Journal of Environmental Research and Public Health. 2015; 12(10):12577-12604. https://doi.org/10.3390/ijerph121012577
Chicago/Turabian StyleGarland, Rebecca M., Mamopeli Matooane, Francois A. Engelbrecht, Mary-Jane M. Bopape, Willem A. Landman, Mogesh Naidoo, Jacobus Van der Merwe, and Caradee Y. Wright. 2015. "Regional Projections of Extreme Apparent Temperature Days in Africa and the Related Potential Risk to Human Health" International Journal of Environmental Research and Public Health 12, no. 10: 12577-12604. https://doi.org/10.3390/ijerph121012577
APA StyleGarland, R. M., Matooane, M., Engelbrecht, F. A., Bopape, M.-J. M., Landman, W. A., Naidoo, M., Merwe, J. V. d., & Wright, C. Y. (2015). Regional Projections of Extreme Apparent Temperature Days in Africa and the Related Potential Risk to Human Health. International Journal of Environmental Research and Public Health, 12(10), 12577-12604. https://doi.org/10.3390/ijerph121012577


