A Health Impact Assessment of Proposed Public Transportation Service Cuts and Fare Increases in Boston, Massachusetts (U.S.A.)

 and
and
Abstract
:1. Introduction

2. Experimental Section
2.1. HIA Process
2.2. HIA Assessment

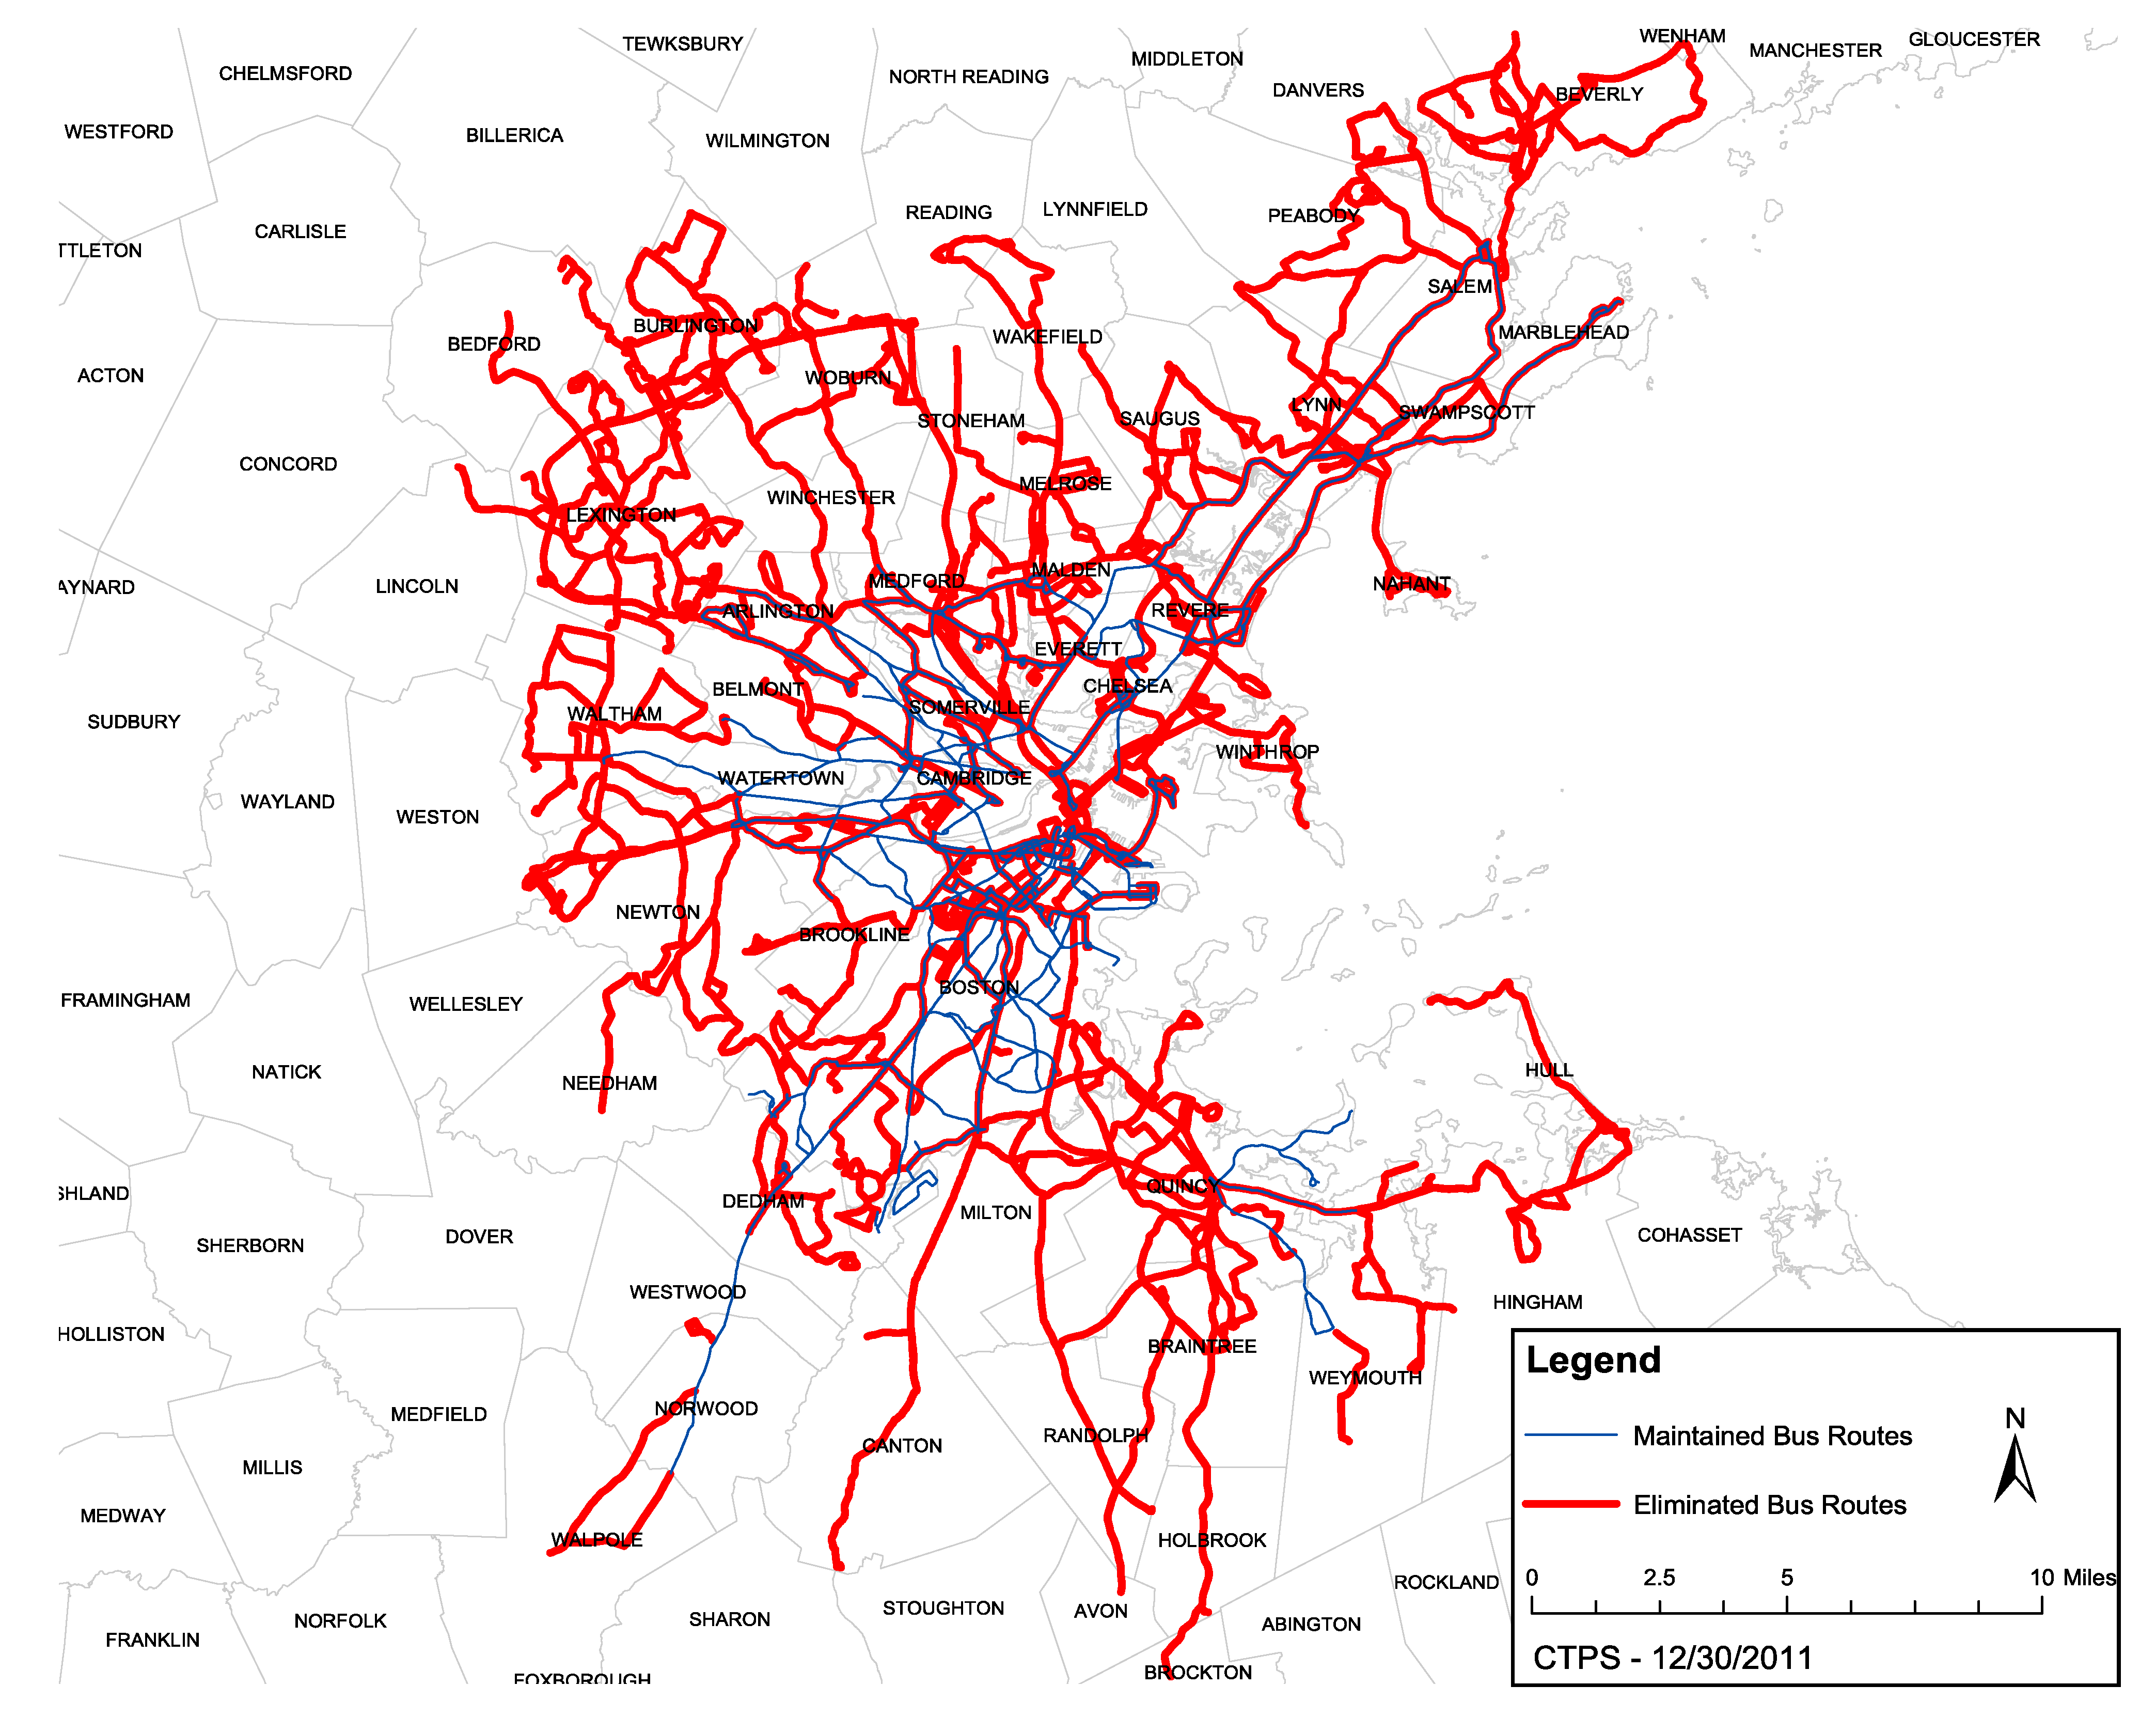
2.2.1. MBTA Service Area
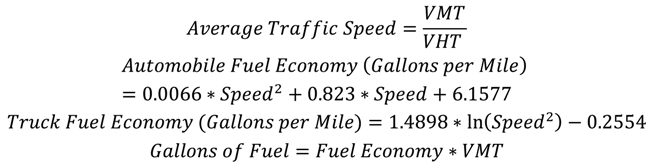
2.2.2. Time Spent in Traffic and Fuel Costs
2.2.3. Air Pollution
2.2.4. Physical Activity
2.2.5. Crashes
2.2.6. Access to Healthcare
2.2.7. Carbon Dioxide Emissions
2.2.8. Noise
2.2.9. Economic Value of Health Endpoints
2.3. Review Approach
3. Results and Discussion

| Pathway | Scenario 1: Fares increase by 43%, Service reductions affecting 34–48 million trips each year | Scenario 2: Fares increase by 35%, Service reductions affecting 53–64 million trips each year |
|---|---|---|
| Time Spent in Traffic and Fuel Costs |
|
|
| Air Pollution |
|
|
| Physical Activity |
|
|
| Crashes |
|
|
| Access to Healthcare |
|
|
| Carbon Emissions |
|
|
| Noise |
|
|
| Annual impact | Costs of Scenario 1: Fares increase by 43%, Service reductions affecting 34–48 million trips each year | Costs of Scenario 2: Fares increase by 35%, Service reductions affecting 53–64 million trips each year |
|---|---|---|
| Cost of additional time in traffic | $137.5 million | $186.0 million |
| Cost of additional fuel | $22.7 million | $31.8 million |
| Cost of additional car crashes, including crashes with bicycles and pedestrians | $33.6 million | $48.8 million |
| Cost of additional mortality and hospitalizations for asthma, chronic lung disease, heart attacks, heart disease, and major cardiovascular events due to air pollution | $1.5 million | $2.1 million |
| Cost of lives lost due to decreased physical activity | $74.9 million | $116.5 million |
| Cost of carbon emissions | $1.9 million | $1.7 million |
| Total annual cost | $272.1 million | $386.9 million |
Dissemination and Impact Evaluation
4. Conclusions
Acknowledgments
Author Contributions
Conflicts of Interest
References
- American Public Transportation Association. American Public Transportation Association 2013 Ridership Report; American Public Transportation Association: Washington, DC, USA, 2014. [Google Scholar]
- US Department of Transportation. Health in Transportation. Available online: http://www.fhwa.dot.gov/planning/health_in_transportation/faq/ (accessed on 3 April 2014).
- American Public Health Association. The Hidden Health Costs of Transportation; American Public Transportation Association: Washington, DC, USA, 2010. [Google Scholar]
- National Research Council. Improving Health in the United States: The Role of Health Impact Assessment; The National Research Council of the National Academies: Washington, DC, USA, 2011. [Google Scholar]
- US. Environmental Protection Agency. A Review of Health Impact Assessments in the US: Current State-of-Science, Best Practices, and Areas for Improvement; US EPA Office of Research and Development National Exposure Research Laboratory: Seattle, WA, USA, 2013. [Google Scholar]
- Health Impact Project. HIA in the United States. Available online: http://www.healthimpactproject.org/hia/us (accessed on 9 July 2014).
- Massachusetts Department of Transportation. Healthy Transportation Compact. Available online: http://www.massdot.state.ma.us/GreenDOT/HealthyTransportationCompact.aspx (accessed on 9 July 2014).
- Central Transportation Planning Staff. Potential MBTA Fare Increase and Service Reductions in 2012: Impact Analysis; Produced for the Massachusetts Bay Transportation Authority by the Central Transportation Planning Staff: Boston, MA, USA, 2011. [Google Scholar]
- Human Impact Partners. A Health Impact Assessment Toolkit: A Handbook to Conducting HIA, 3rd ed.; Human Impact Partners: Oakland, CA, USA, 2011. [Google Scholar]
- Cole, B.; Agyekum, G.; Hoffman, S.; Shimkhada, R. Mass Transit HIA: Potential Impacts of Governor’s Proposed Redirection of California State Transportation Spillover Funds; HIA-CLIC: Los Angeles, CA, USA, 2008. [Google Scholar]
- Massachusetts Bay Transportation Authority. Ridership and Service Statistics, 4th ed.; Massachusetts Bay Transportation Authority: Boston, MA, USA, 2014. [Google Scholar]
- Schrank, D.; Lomax, T.; Eisele, B. Urban Mobility Report; Texas Transportation Institute: The Texas A&M University System College Station, TX, USA, 2011. [Google Scholar]
- Peters, A.; Dockery, D.W.; Muller, J.E.; Mittleman, M.A. Increased particulate air pollution and the triggering of myocardial infarction. Circulation 2001, 103, 2810–2815. [Google Scholar] [CrossRef] [PubMed]
- Schwartz, J.; Coull, B.; Laden, F.; Ryan, L. The effect of dose and timing of dose on the association between airborne particles and survival. Environ. Health Perspect. 2008, 116, 64–69. [Google Scholar] [CrossRef] [PubMed]
- Health Effects Institute. Revised Analyses of Time-Series Studies of Air Pollution and Health. Special Report; Health Effects Institute: Boston, MA, USA, 2003. [Google Scholar]
- Dominici, F.; Peng, R.D.; Bell, M.L.; Pham, L.; McDermott, A.; Zeger, S.L.; Samet, J.M. Fine particulate air pollution and hospital admission for cardiovascular and respiratory diseases. JAMA 2006, 295, 1127–1134. [Google Scholar] [CrossRef] [PubMed]
- Levy, J.I.; Buonocore, J.J.; von Stackelberg, K. Evaluation of the public health impacts of traffic congestion: A health risk assessment. Environ. Health 2010, 9, 65. [Google Scholar] [CrossRef] [PubMed]
- Executive Office of Health and Human Services. Massachusetts Community Health Information Profile (Masschip). Available online: http://www.mass.gov/eohhs/researcher/community-health/masschip/ (accessed on 3 April 2014).
- Centers for Disease Control and Prevention; Statistics, N.C.F.H. CDC Wonder. Available online: http://wonder.cdc.gov/ (accessed on 3 April 2014).
- Abt Associates Inc. Environmental Benefits Mapping and Analysis Program User’s Manual; Prepared for Office of Air Quality Planning and Standards US Environmental Protection Agency: Research Triangle Park: Morrisville, NC, USA, 2012. [Google Scholar]
- Roman, H.A.; Walker, K.D.; Walsh, T.L.; Conner, L.; Richmond, H.M.; Hubbell, B.J.; Kinney, P.L. Expert judgment assessment of the mortality impact of changes in ambient fine particulate matter in the US. Environ. Sci. Technol. 2008, 42, 2268–2274. [Google Scholar] [CrossRef] [PubMed]
- Moolgavkar, S.H. Air pollution and hospital admissions for diseases of the circulatory system in three U.S. Metropolitan areas. J. Air Waste Manag. Assoc. 2000, 50, 1199–1206. [Google Scholar] [CrossRef]
- Moolgavkar, S.H. Air pollution and hospital admissions for chronic obstructive pulmonary disease in three metropolitan areas in the United States. Inhal. Toxicol. 2000, 12 (Suppl. 4), 75–90. [Google Scholar]
- Centers for Disease Control and Prevention. Behavioral Risk Factor Surveillance System Survey Data; US Department of Health and Human Services, Centers for Disease Control and Prevention: Atlanta, GA, USA, 2012. [Google Scholar]
- Besser, L.M.; Dannenberg, A.L. Walking to public transit: Steps to help meet physical activity recommendations. Am. J. Prev. Med. 2005, 29, 273–280. [Google Scholar] [CrossRef] [PubMed]
- Edwards, R.D. Public transit, obesity, and medical costs: Assessing the magnitudes. Prev Med. 2008, 46, 14–21. [Google Scholar] [CrossRef] [PubMed]
- World Health Organization. Health Economic Assessment Tool. Available online: http://www.heatwalkingcycling.org/ (accessed on 3 April 2014).
- Beck, L.F.; Dellinger, A.M.; O’Neil, M.E. Motor vehicle crash injury rates by mode of travel, United States: Using exposure-based methods to quantify differences. Am. J. Epidemiol. 2007, 166, 212–218. [Google Scholar] [CrossRef] [PubMed]
- National Highway Traffic Safety Administration. Fatality Analysis Reporting System (FARS). Available online: http://www-fars.nhtsa.dot.gov/Main/index.aspx (accessed on 3 April 2014).
- Cambridge Systematics, Inc. Crashes vs. Congestion—What’s the Cost to Society? Prepared for AAA; Cambridge Systematics, Inc.: Bethesda, MD, USA, 2011. [Google Scholar]
- Syed, S.T.; Gerber, B.S.; Sharp, L.K. Traveling towards disease: Transportation barriers to health care access. J. Commun. Health 2013, 38, 976–993. [Google Scholar] [CrossRef]
- Agrawal, A.; Schlossberg, M.; Irvin, K. How far, by which route, and why? A spatial analysis of pedestrian preference. Environ. Behav. 2008, 13, 81–98. [Google Scholar]
- Calthorpe, P. The Next American Metropolis: Ecology, Community, and the American Dream; Princeton Architectural Press: New York, NY, USA, 1993. [Google Scholar]
- Cervero, R. Alternative approaches to modeling the travel-demand impacts of smart growth. J. Am. Plann. Assoc. 2006, 72, 285–295. [Google Scholar] [CrossRef]
- Miller, L.M.; Vercaigne, L.M.; Moist, L.; Lok, C.E.; Tangri, N.; Komenda, P.; Rigatto, C.; Mojica, J.; Sood, M.M. The association between geographic proximity to a dialysis facility and use of dialysis catheters. BMC Nephrol. 2014, 15, 40. [Google Scholar] [CrossRef] [PubMed]
- Haines, A.; Patz, J.A. Health effects of climate change. JAMA 2004, 291, 99–103. [Google Scholar] [CrossRef] [PubMed]
- Patz, J.; Campbell-Lendrum, D.; Gibbs, H.; Woodruff, R. Health impact assessment of global climate change: Expanding on comparative risk assessment approaches for policy making. Annu. Rev. Public Health 2008, 29, 27–39. [Google Scholar] [PubMed]
- Patz, J.A.; Campbell-Lendrum, D.; Holloway, T.; Foley, J.A. Impact of regional climate change on human health. Nature 2005, 438, 310–317. [Google Scholar] [CrossRef] [PubMed]
- National Research Council. Hidden Costs of Energy: Unpriced Consequences of Energy Production and Use; National Research Council: Washington, DC, USA, 2010. [Google Scholar]
- US Census Bureau. American Housing Survey for the Boston Metropolitan Area: 2007; US Census Bureau: Washington, DC, USA, 2009.
- Basner, M.; Babisch, W.; Davis, A.; Brink, M.; Clark, C.; Janssen, S.; Stansfeld, S. Auditory and non-auditory effects of noise on health. Lancet 2014, 383, 1325–1332. [Google Scholar] [CrossRef] [PubMed]
- Babisch, W. Transportation noise and cardiovascular risk: Updated review and synthesis of epidemiological studies indicate that the evidence has increased. Noise Health 2006, 8, 1–29. [Google Scholar] [CrossRef] [PubMed]
- Van Kempen, E.; Babisch, W. The quantitative relationship between road traffic noise and hypertension: A meta-analysis. J. Hypertens 2012, 30, 1075–1086. [Google Scholar] [CrossRef] [PubMed]
- Federal Highway Administration. FHWA Traffic Noise Model (FHWA TNM) Technical Manual; Department of Transportation, Federal Highway Administration: Washington, DC, USA, 1998. [Google Scholar]
- Dockins, C.; Maguire, K.; Simon, N.; Sullivan, M. Value of a Statistical Life Analysis and Environmental Policy: A White Paper; US Environmental Protection Agency National Center for Environmental Economics: Washington, DC, USA, 2004. [Google Scholar]
- Child Health Impact Working Group. Unhealthy Consequences: Energy Costs and Child Health; Child Health Impact Working Group: Boston, MA, USA, 2007. [Google Scholar]
- Human Impact Partners. The First Annual Hippy Awards: 2012 in Review. Available online: http://www.humanimpact.org/from-the-hip-blog/the-first-annual-hippy-awards-2012-in-review/ (accessed on 3 April 2014).
- Boston Foundation; Network for Excellence in Health Innovation. Healthy People/Healthy Economy: A Coalition to Make Massachusetts the National Leader in Health and Wellness; Boston Foundation and NEHI: Boston, MA, USA, 2013. [Google Scholar]
© 2014 by the authors; licensee MDPI, Basel, Switzerland. This article is an open access article distributed under the terms and conditions of the Creative Commons Attribution license (http://creativecommons.org/licenses/by/3.0/).
Share and Cite
James, P.; Ito, K.; Buonocore, J.J.; Levy, J.I.; Arcaya, M.C. A Health Impact Assessment of Proposed Public Transportation Service Cuts and Fare Increases in Boston, Massachusetts (U.S.A.). Int. J. Environ. Res. Public Health 2014, 11, 8010-8024. https://doi.org/10.3390/ijerph110808010
James P, Ito K, Buonocore JJ, Levy JI, Arcaya MC. A Health Impact Assessment of Proposed Public Transportation Service Cuts and Fare Increases in Boston, Massachusetts (U.S.A.). International Journal of Environmental Research and Public Health. 2014; 11(8):8010-8024. https://doi.org/10.3390/ijerph110808010
Chicago/Turabian StyleJames, Peter, Kate Ito, Jonathan J. Buonocore, Jonathan I. Levy, and Mariana C. Arcaya. 2014. "A Health Impact Assessment of Proposed Public Transportation Service Cuts and Fare Increases in Boston, Massachusetts (U.S.A.)" International Journal of Environmental Research and Public Health 11, no. 8: 8010-8024. https://doi.org/10.3390/ijerph110808010
APA StyleJames, P., Ito, K., Buonocore, J. J., Levy, J. I., & Arcaya, M. C. (2014). A Health Impact Assessment of Proposed Public Transportation Service Cuts and Fare Increases in Boston, Massachusetts (U.S.A.). International Journal of Environmental Research and Public Health, 11(8), 8010-8024. https://doi.org/10.3390/ijerph110808010