Heavy Metal Contamination Assessment and Partition for Industrial and Mining Gathering Areas


Abstract
:1. Introduction
2. Methodology
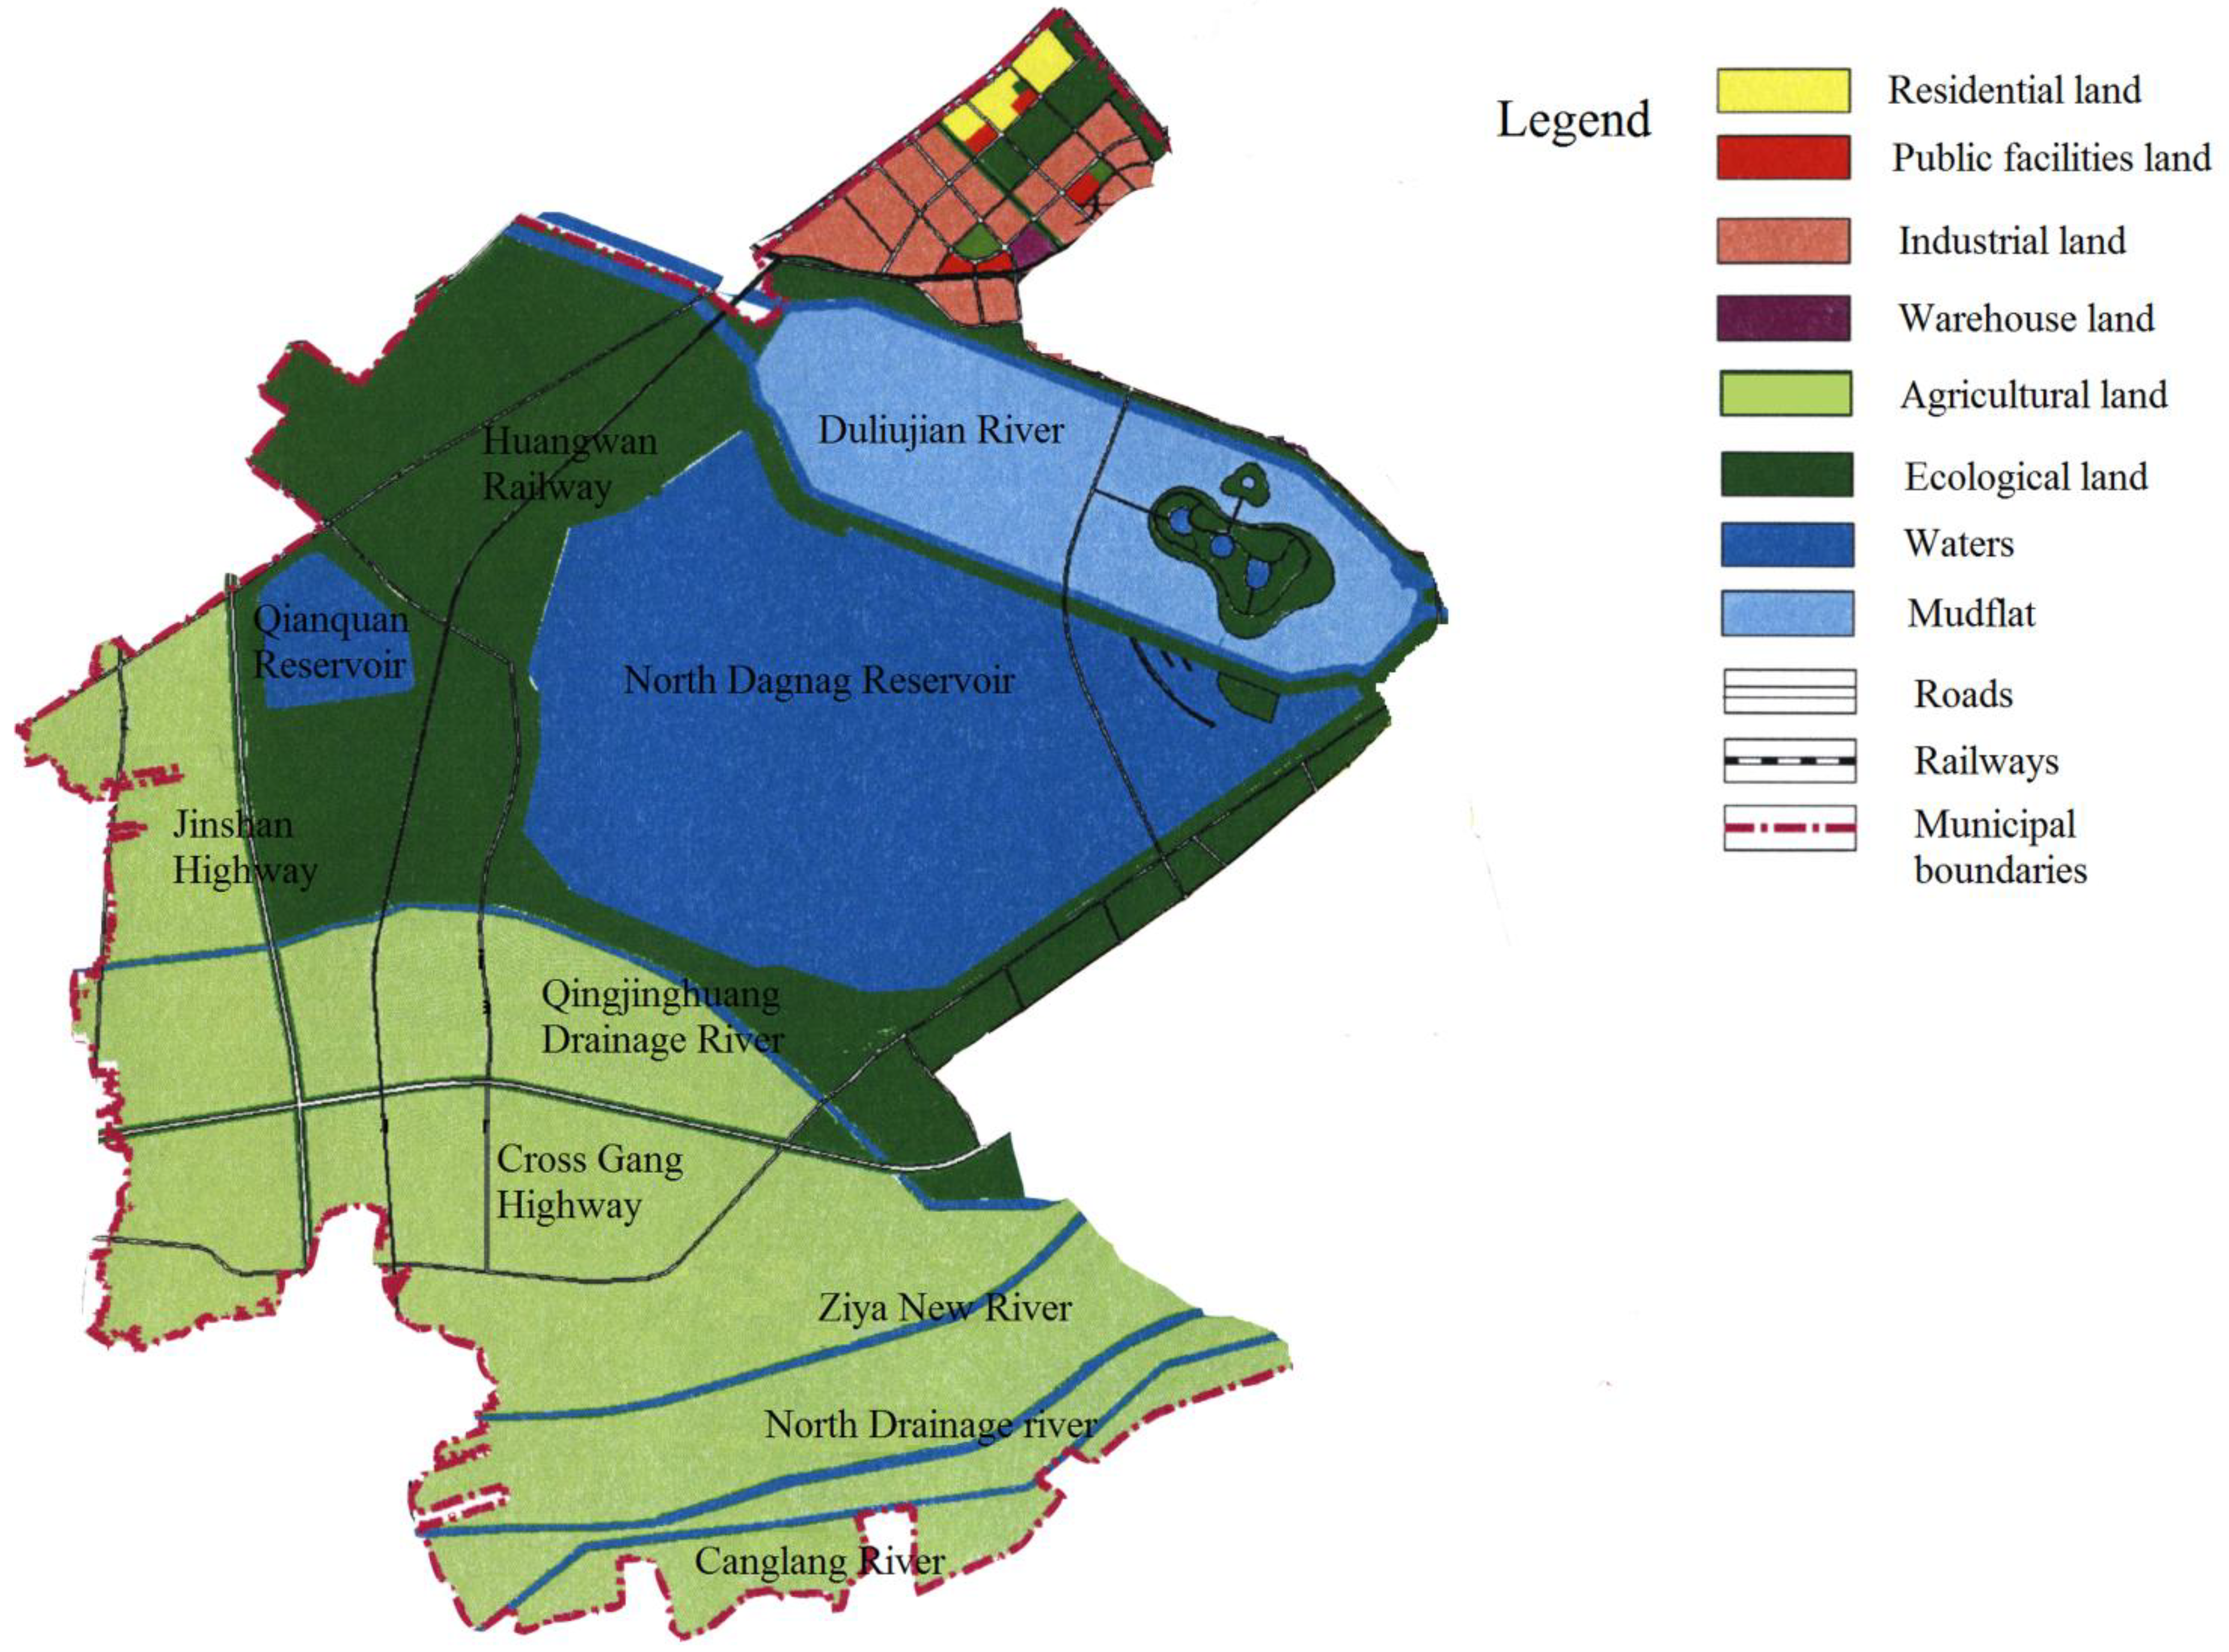
2.1. Study Area
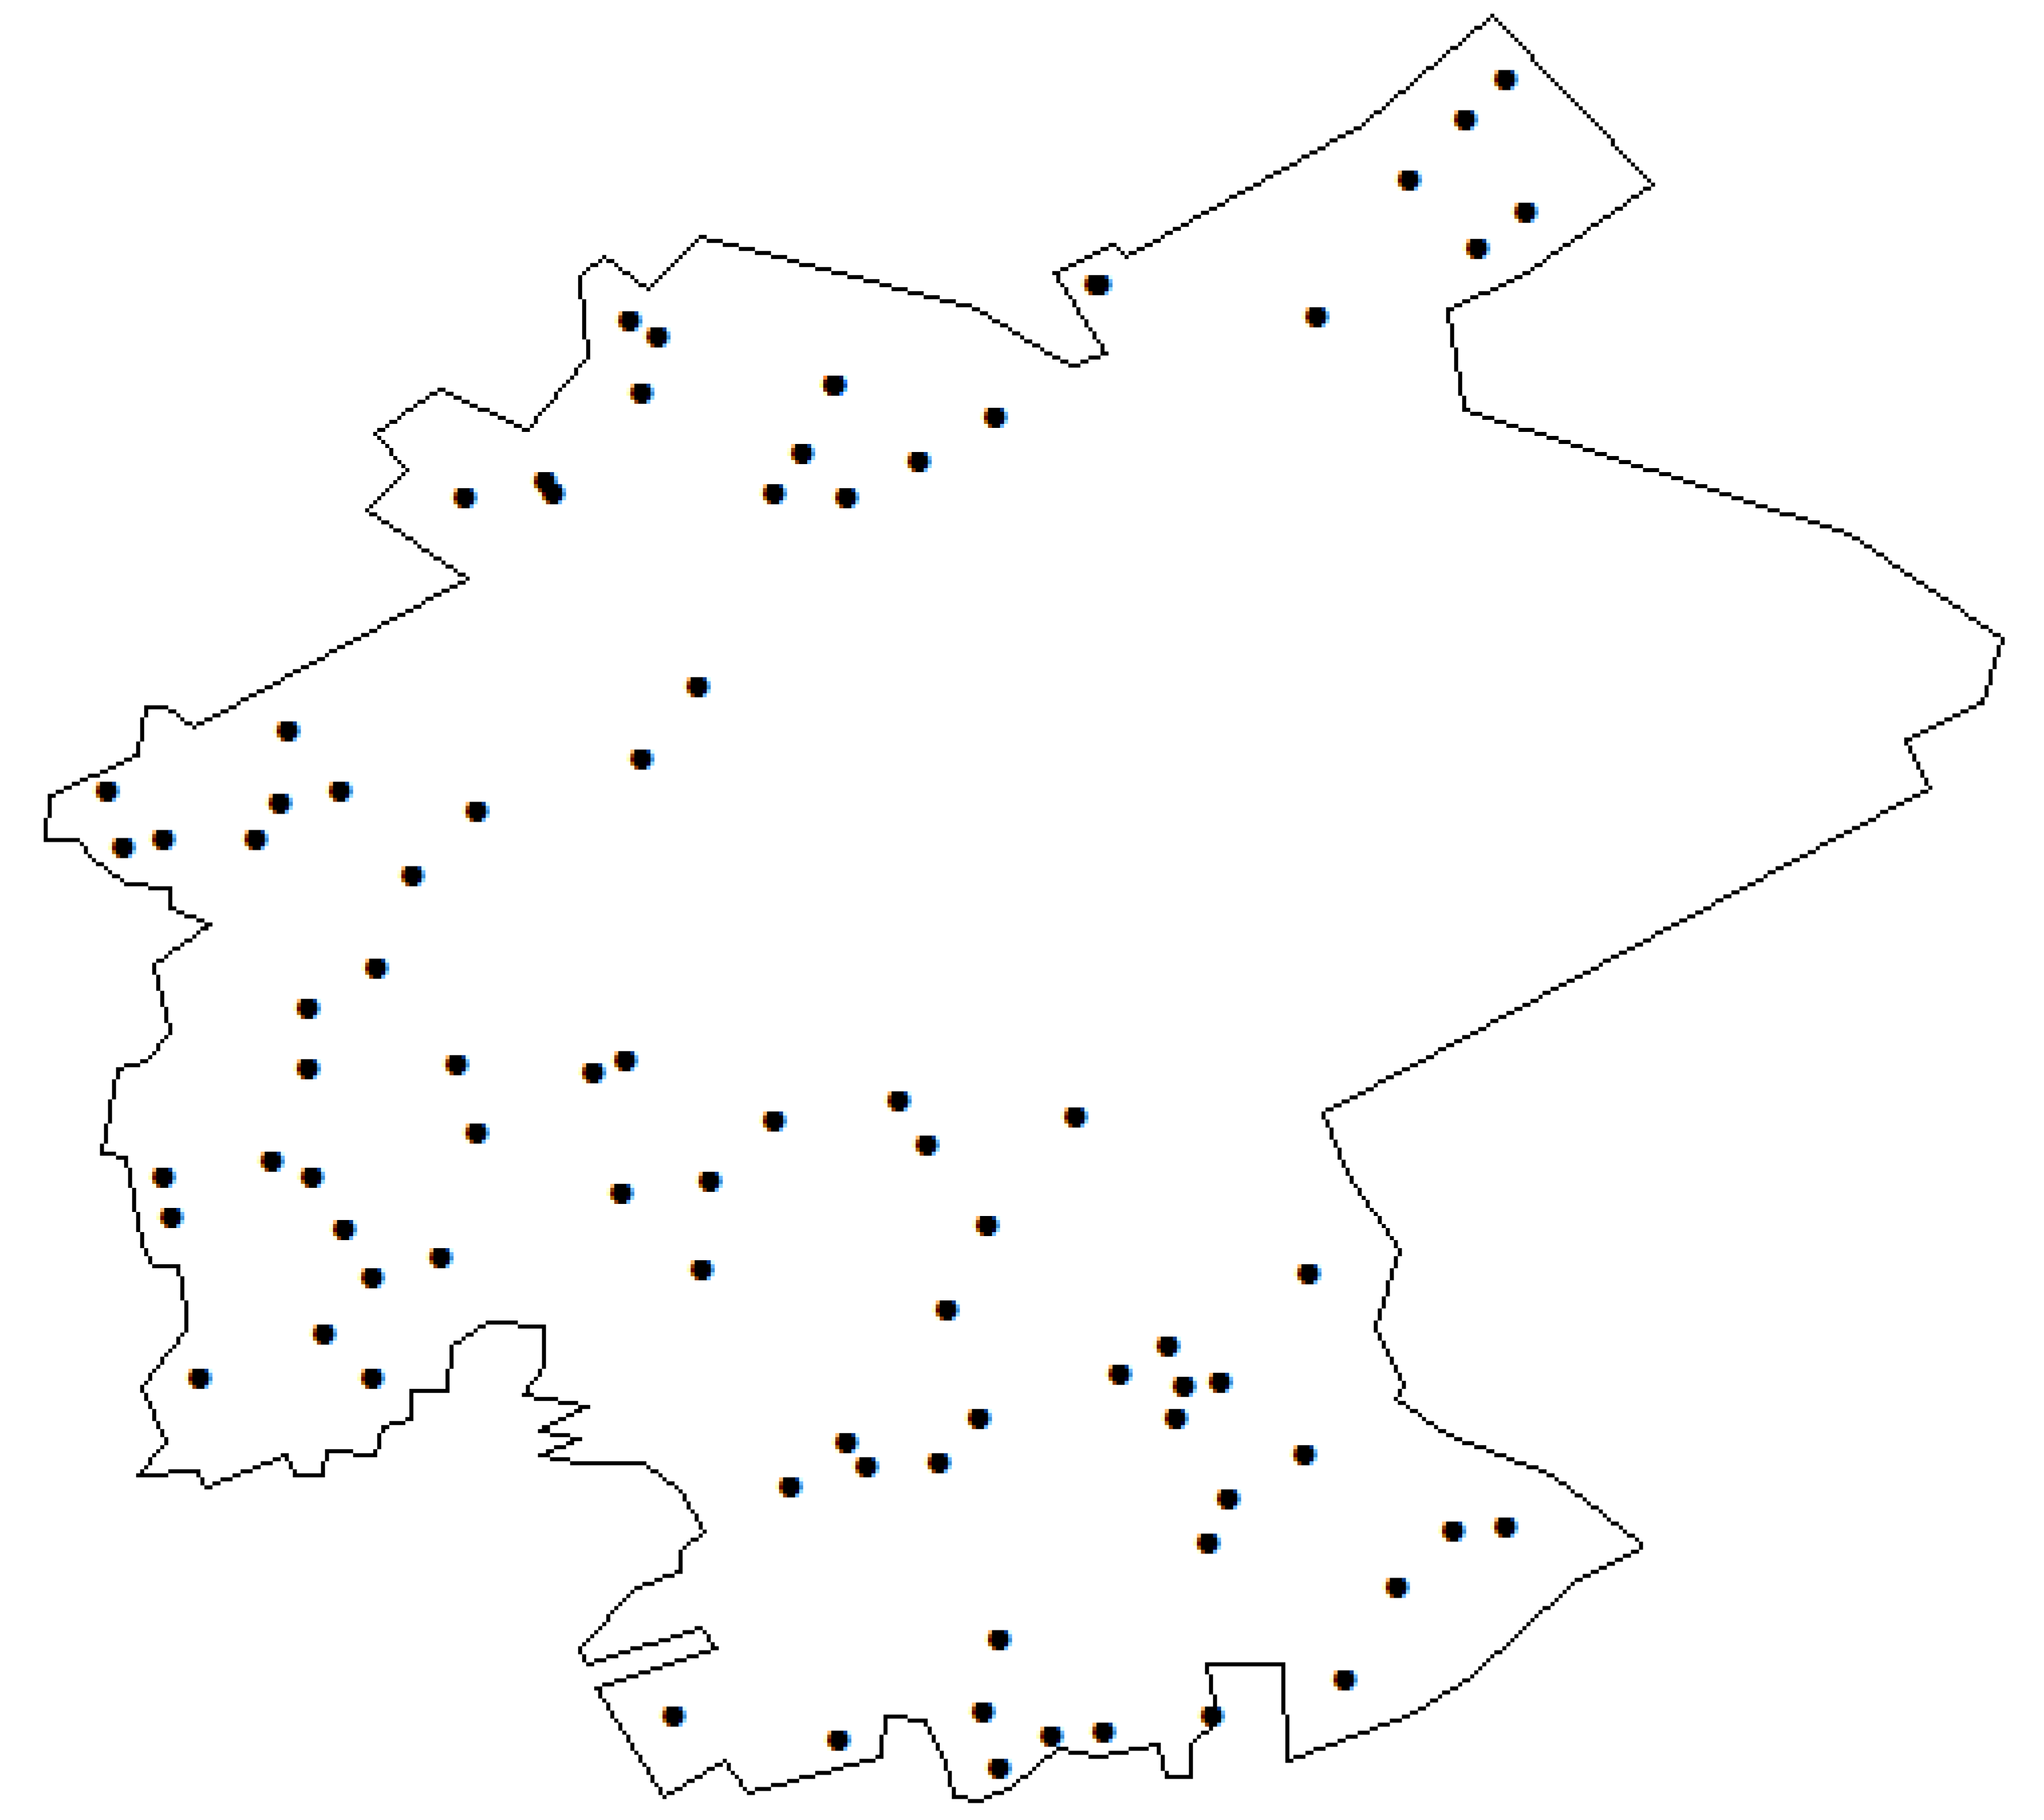
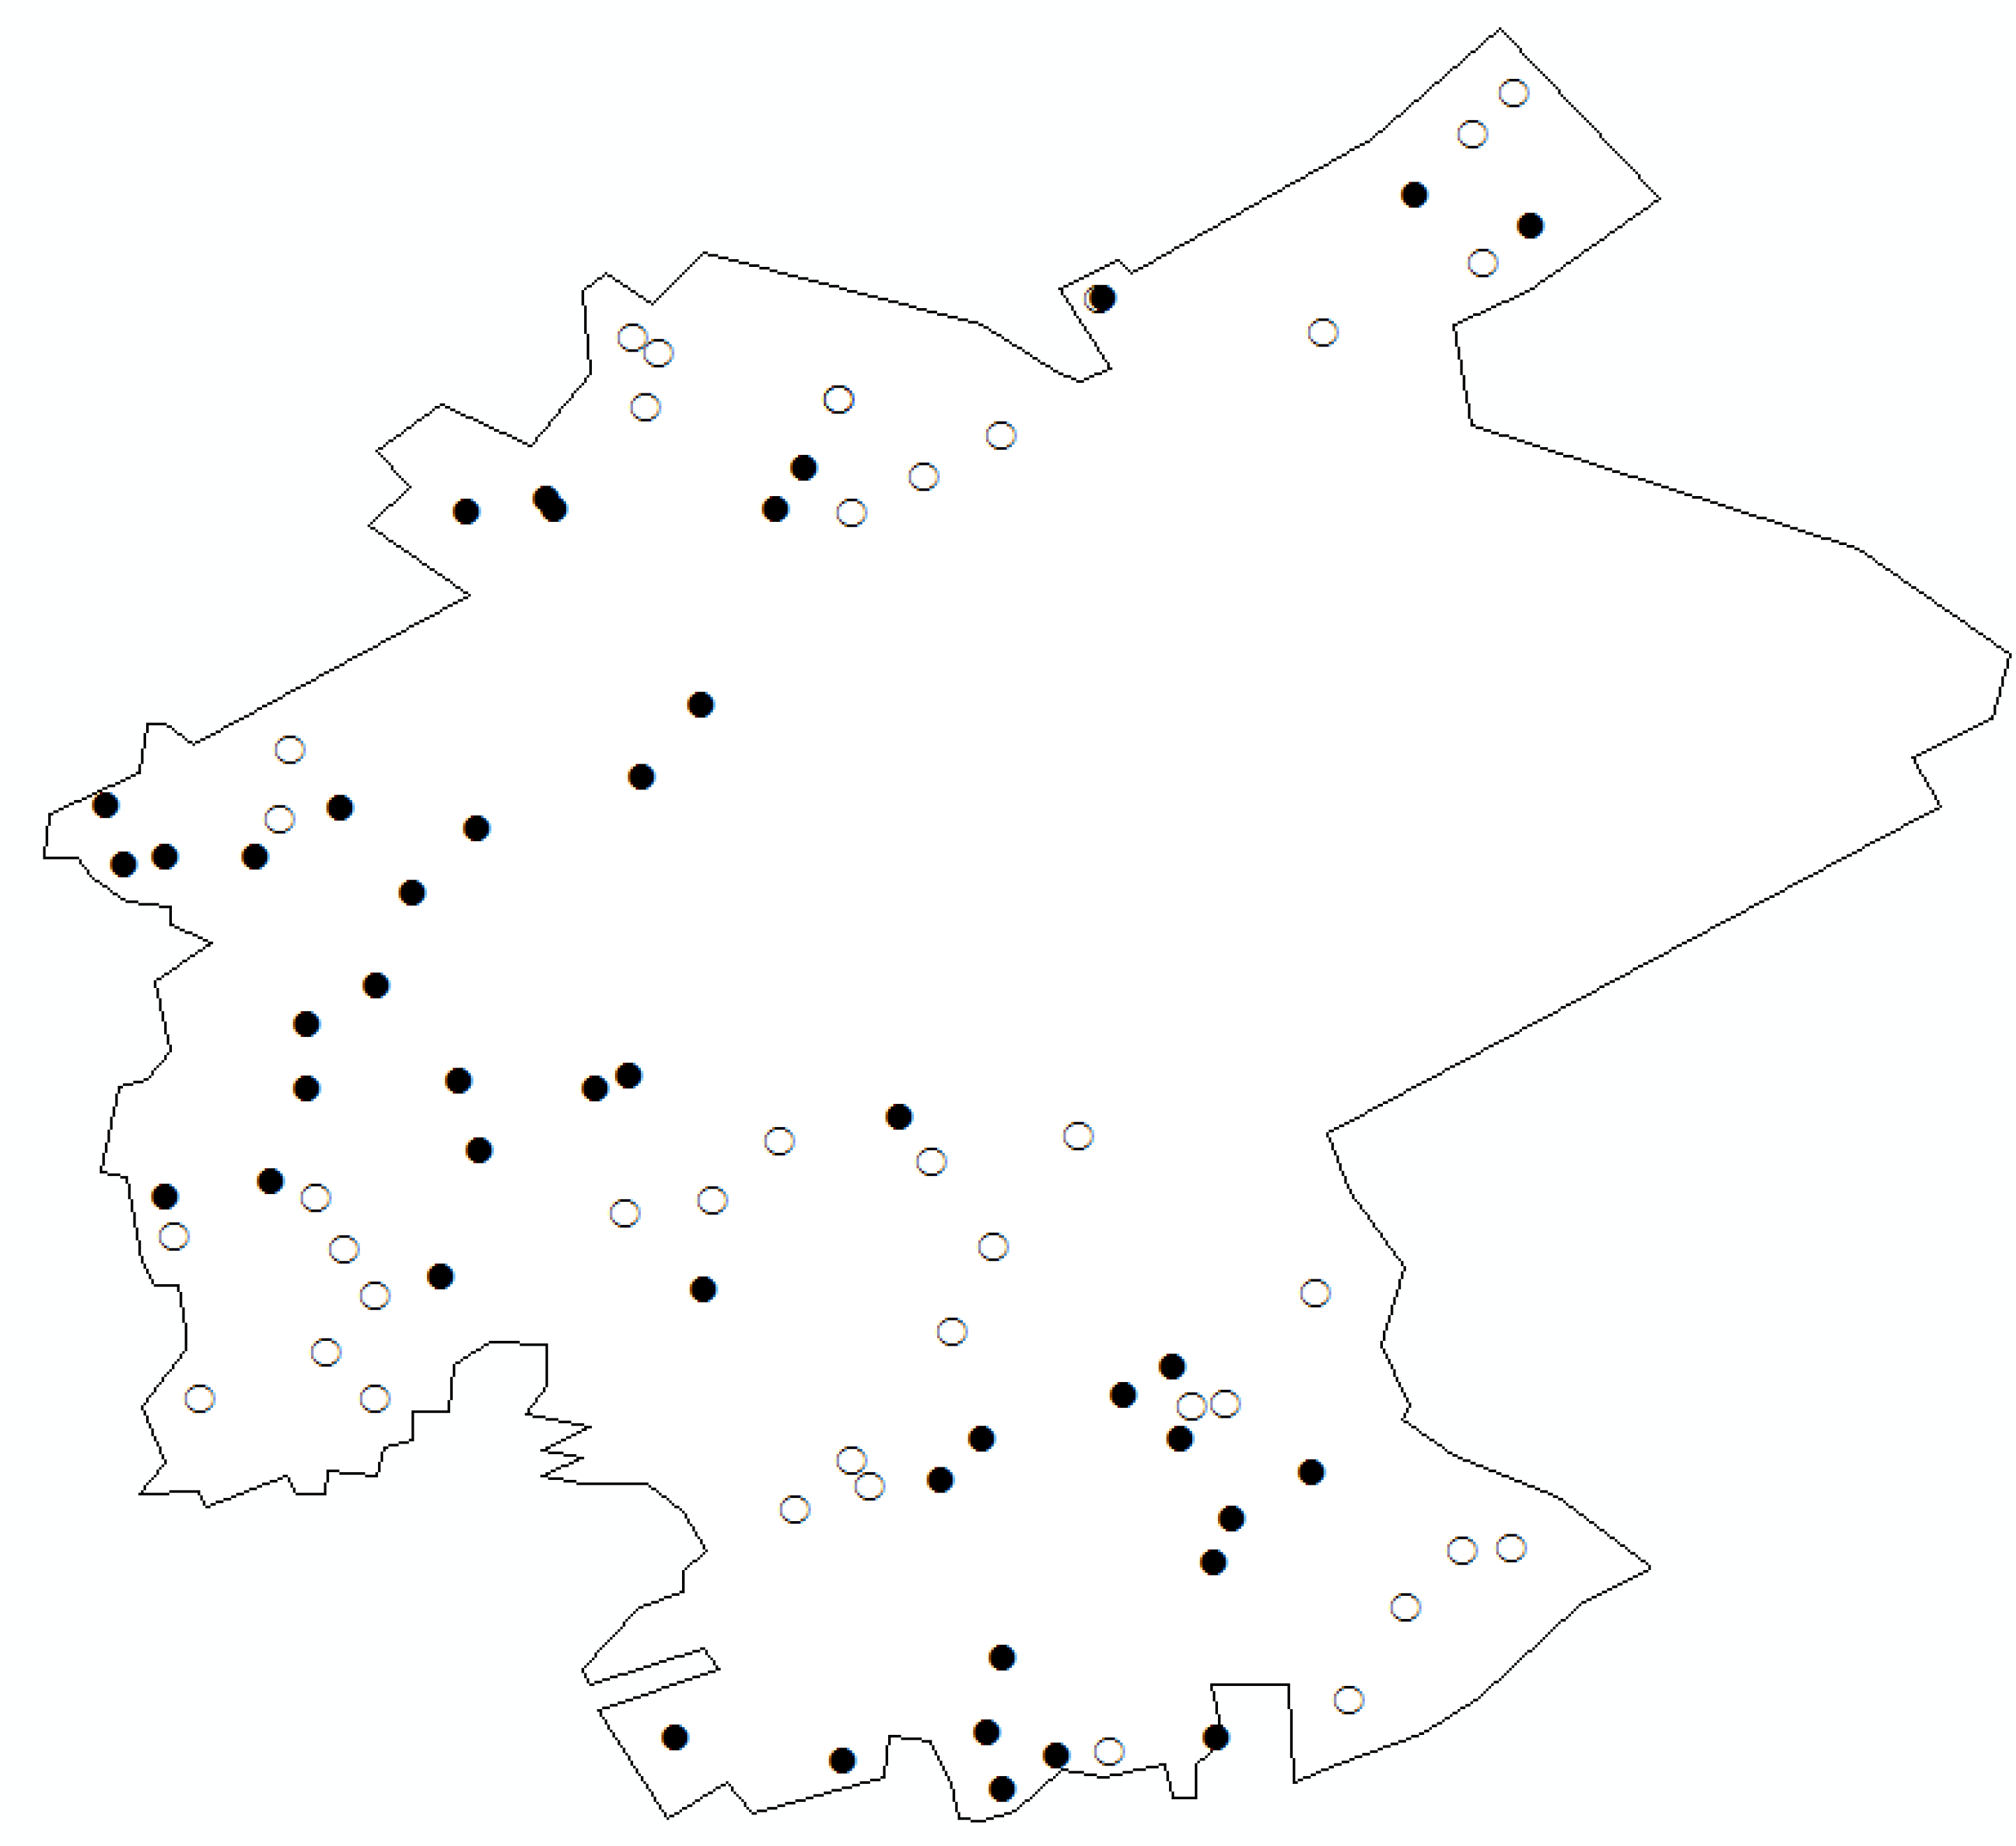
2.2. Sampling and Analysis

2.3. Assessment Method
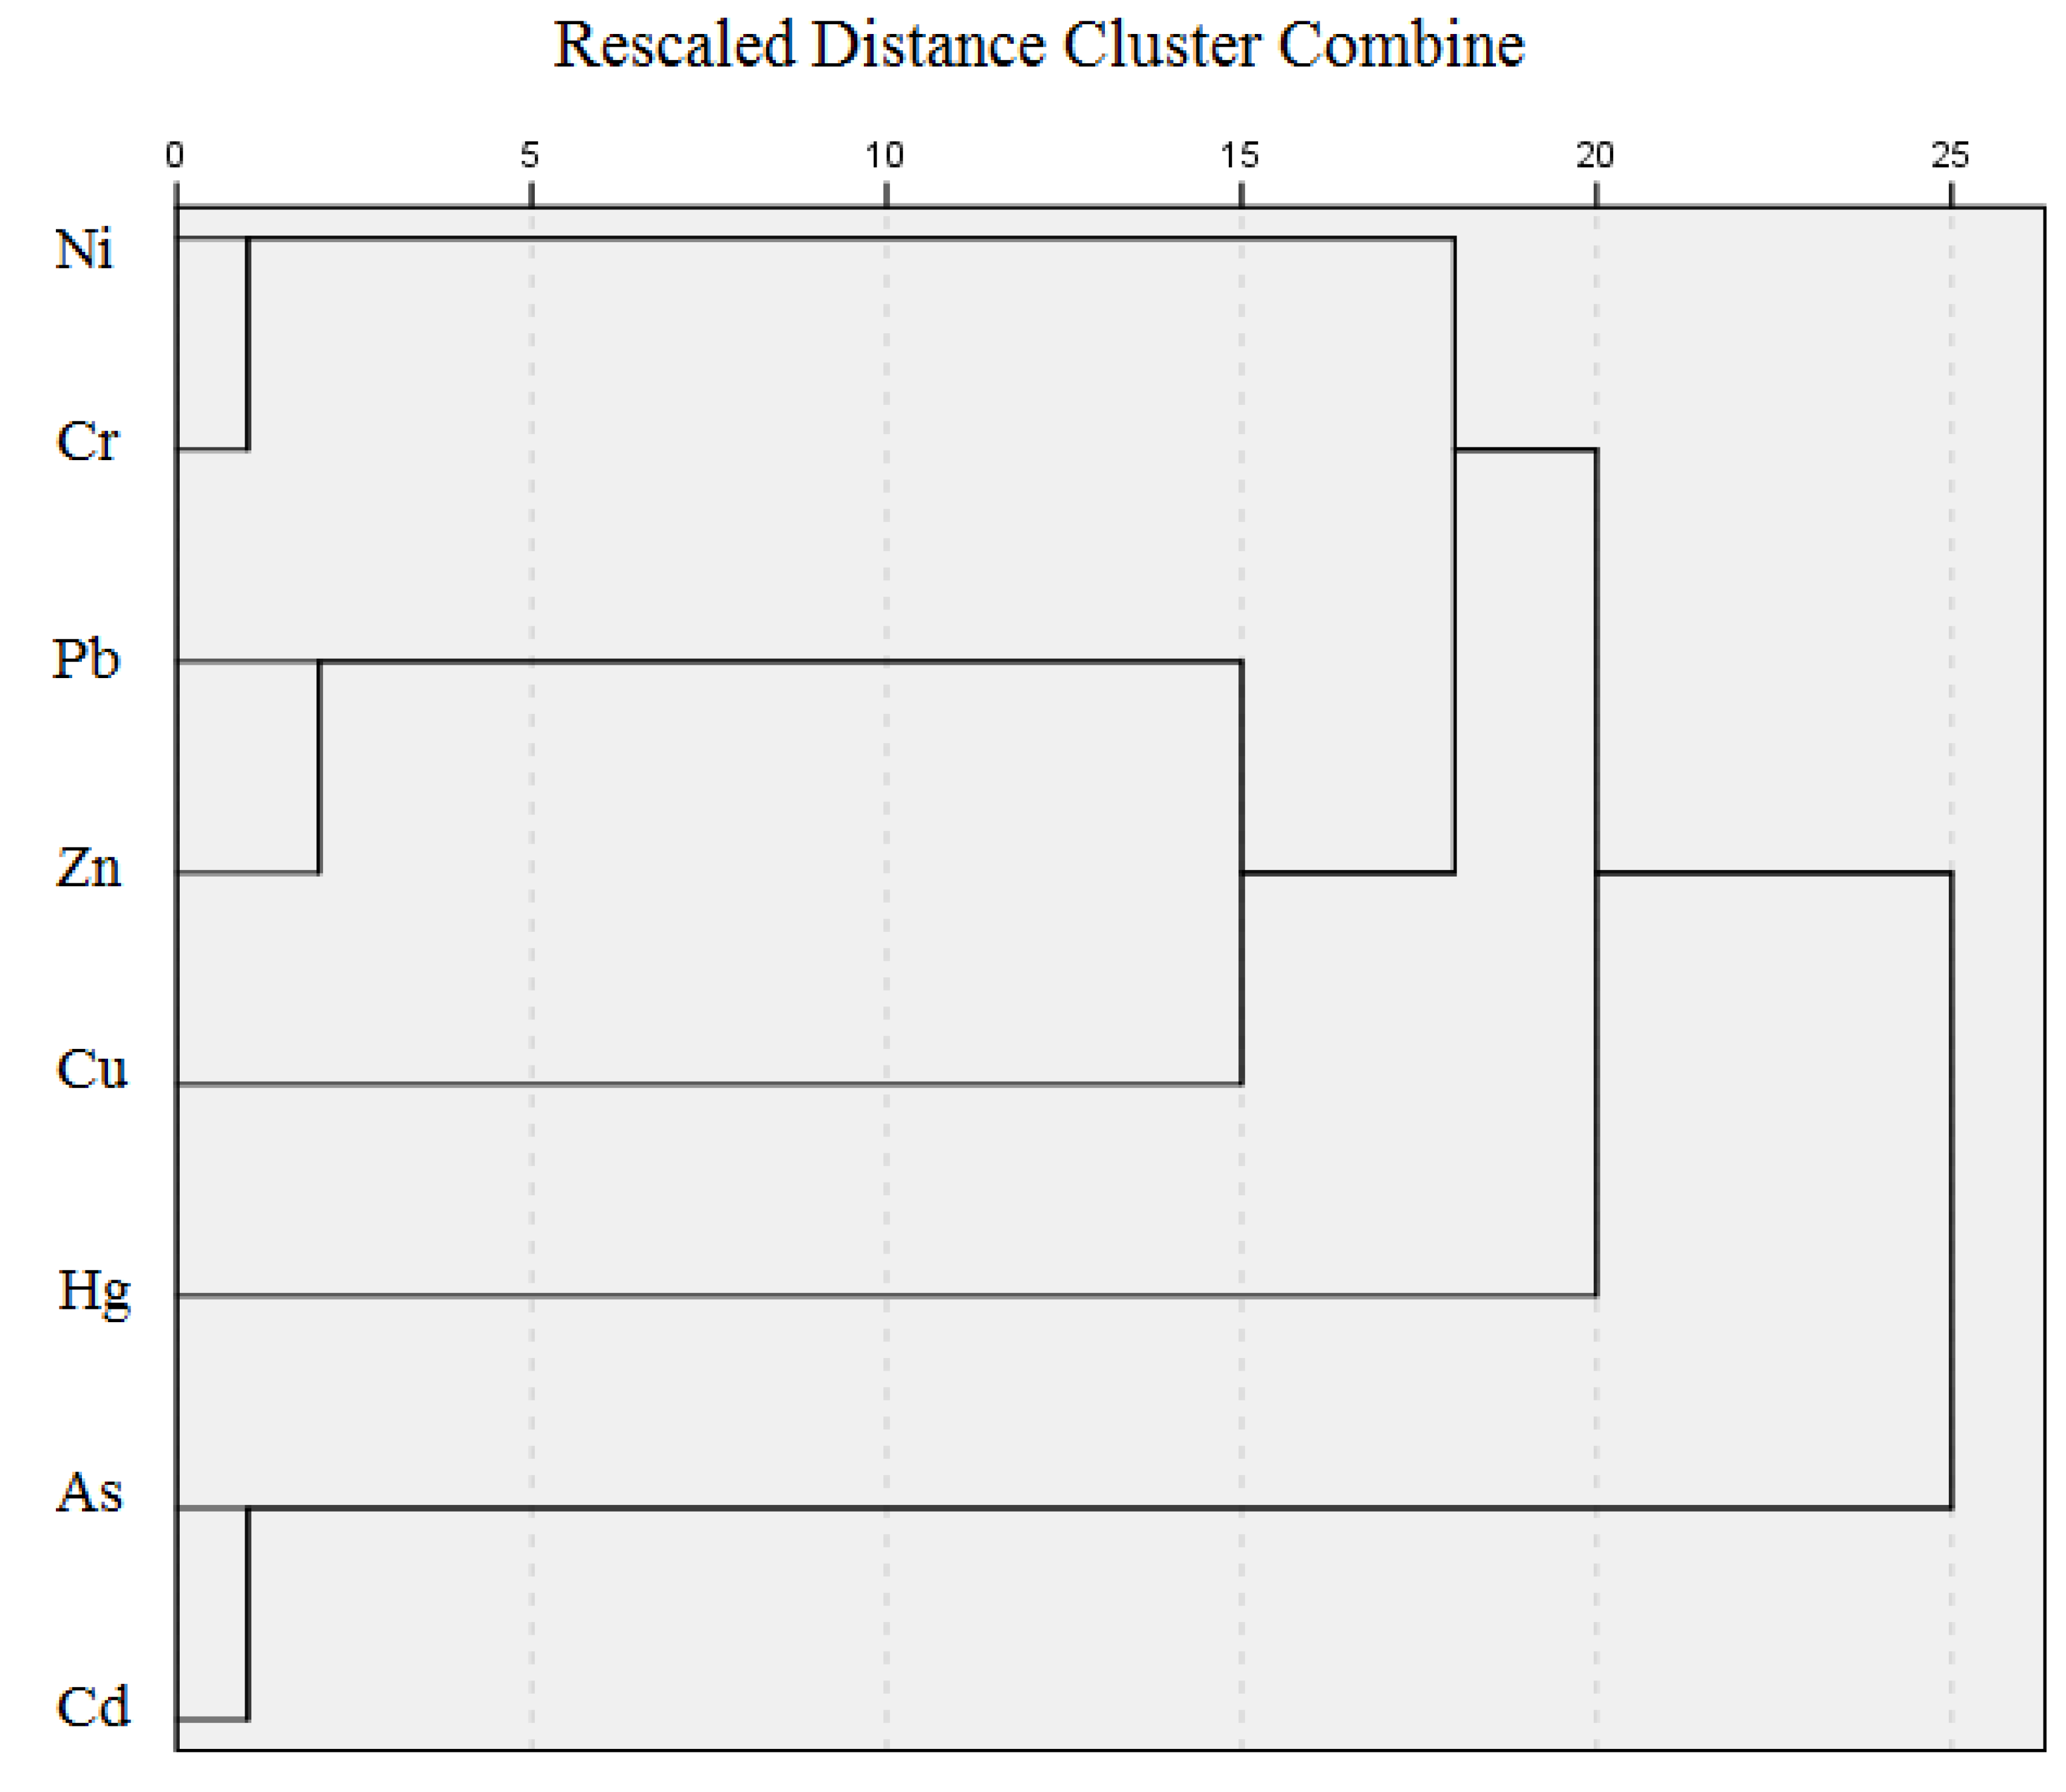
2.3.1. Cluster Analysis

2.3.2. Geo-Accumulation Index (Igeo)


| Metals | As | Cd | Cr | Cu | Pb | Ni | Zn | Hg |
|---|---|---|---|---|---|---|---|---|
| Values | 12.70 | 0.10 | 67.30 | 22.50 | 21.00 | 31.00 | 65.40 | 0.02 |
2.3.3. Improved Nemerow Index (IN)

2.3.4. Potential Ecological Risk Index

| Metals | As | Cd | Cr | Cu | Pb | Ni | Zn | Hg |
|---|---|---|---|---|---|---|---|---|
| Values | 10 | 30 | 2 | 5 | 5 | 5 | 1 | 40 |
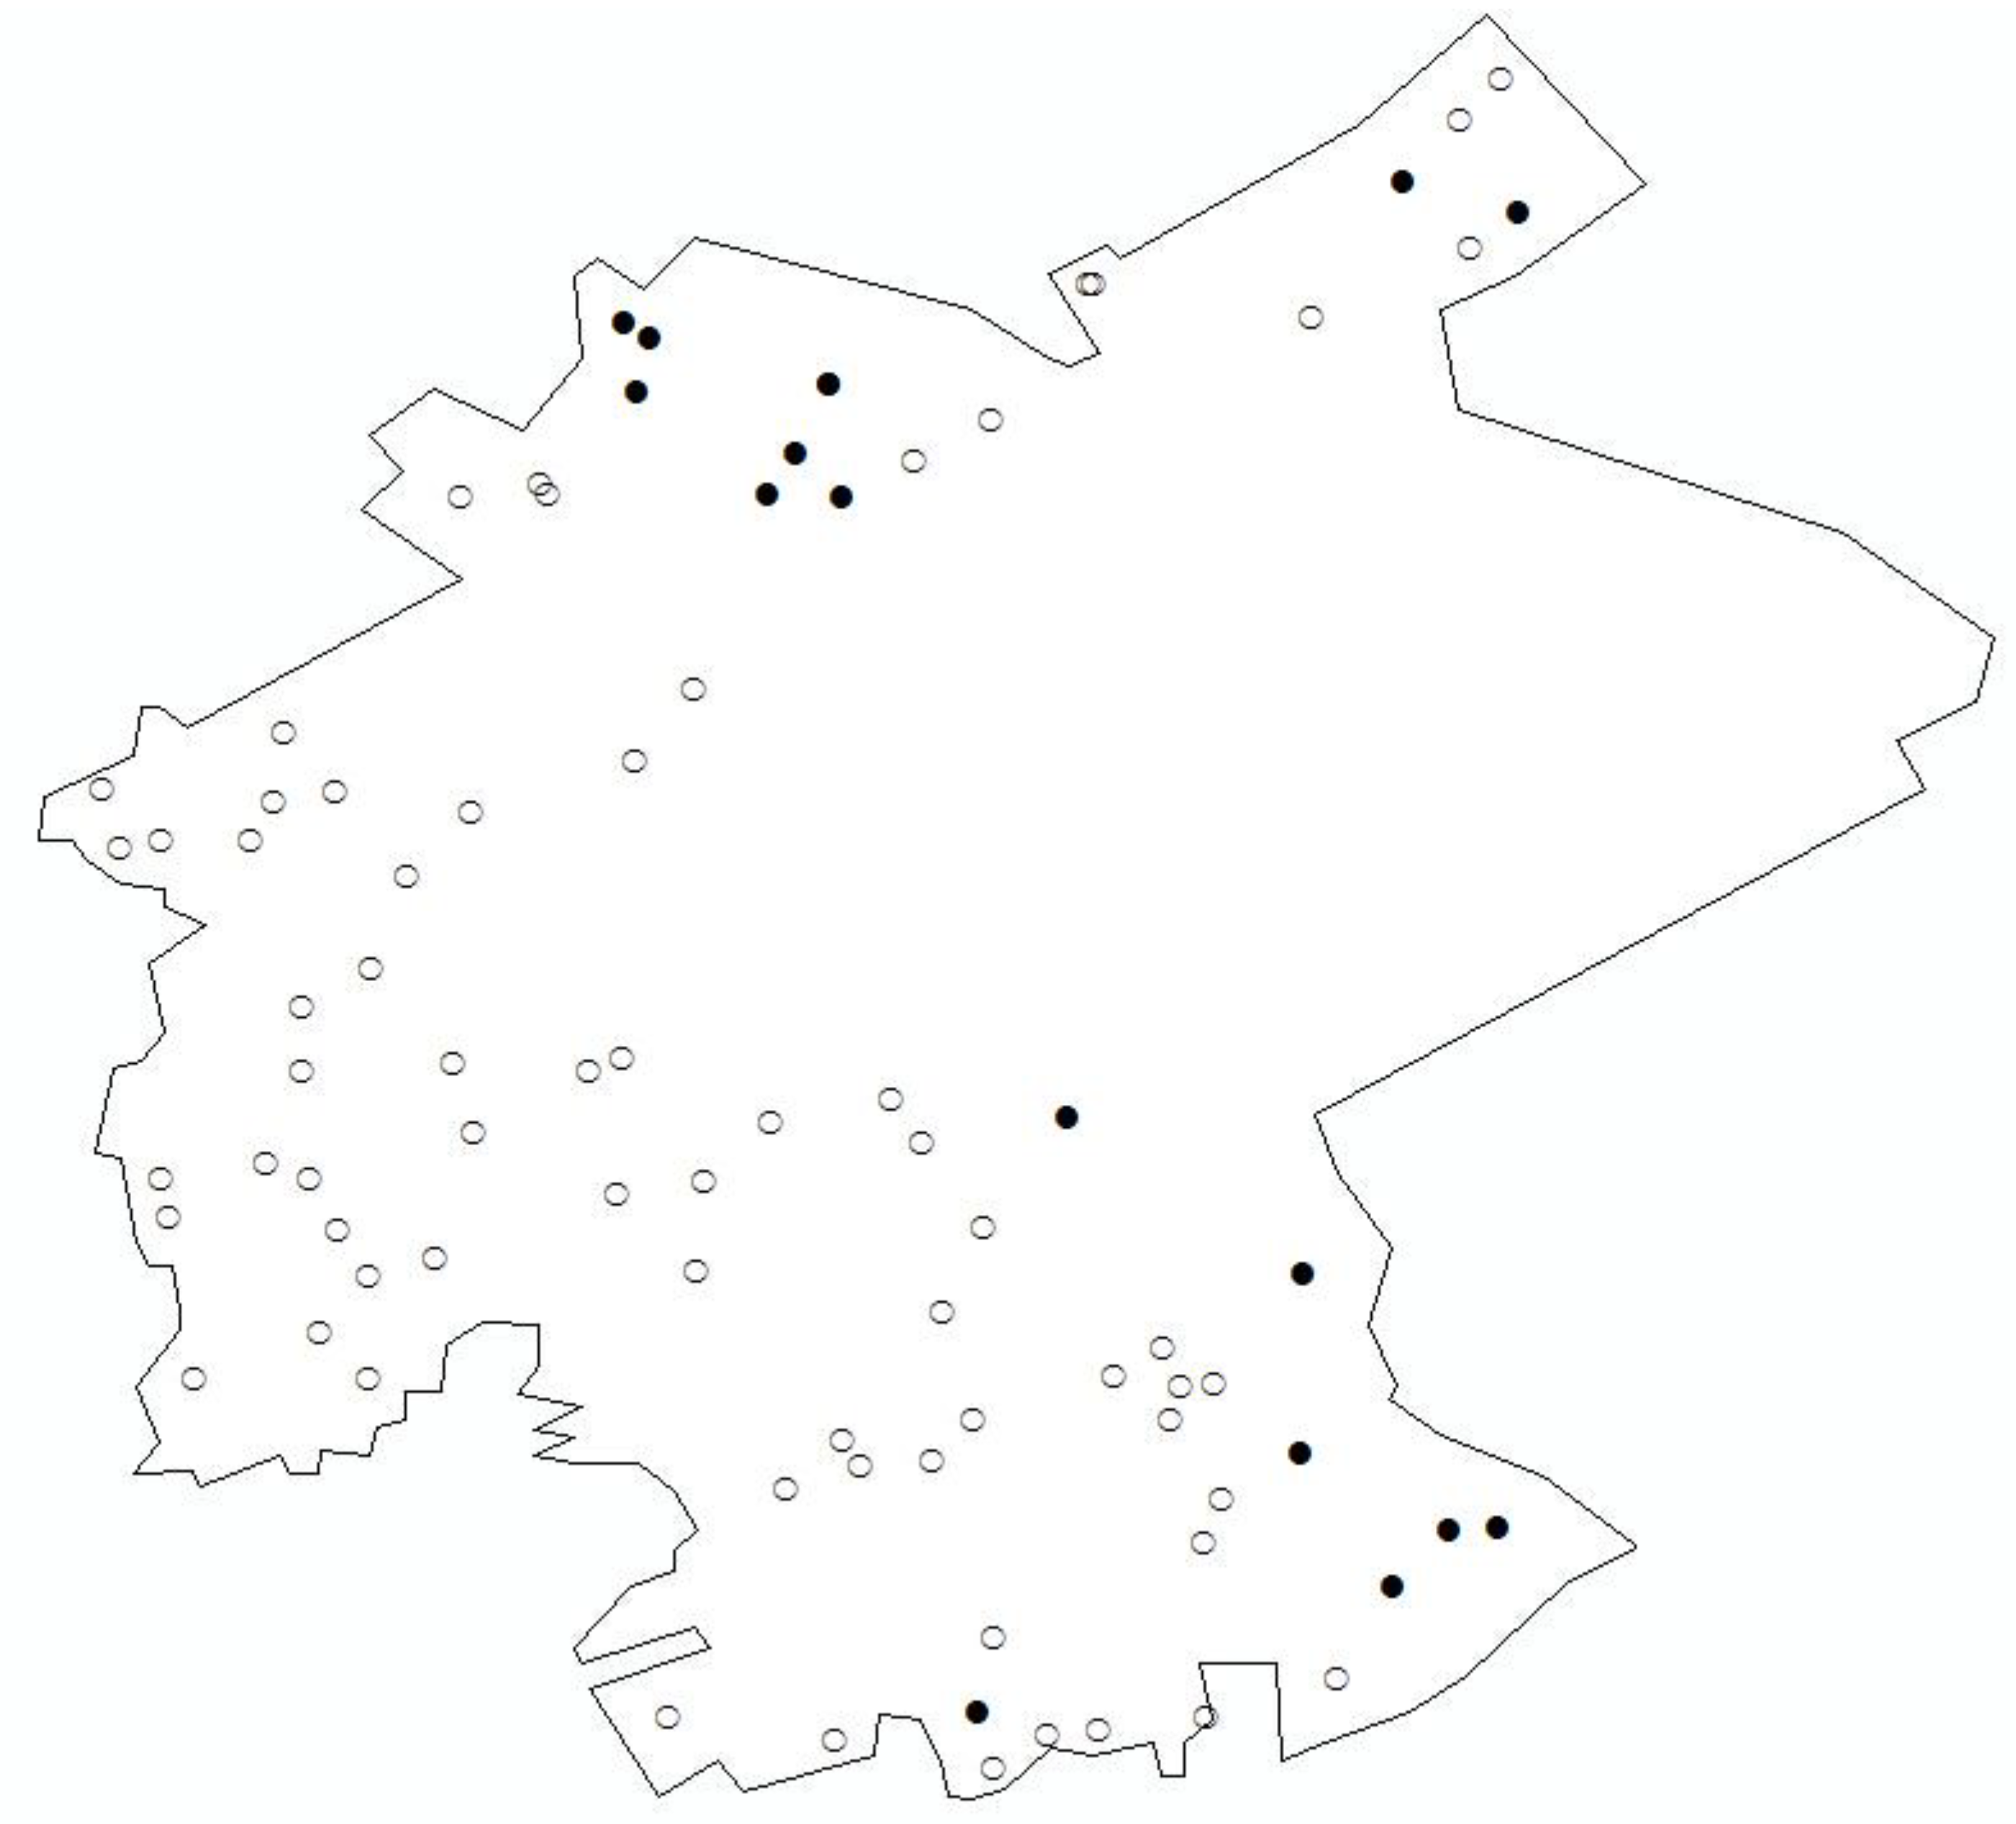
2.3.5. Spatial Analysis
3. Results and Discussion
3.1. Overview of Igeo
| Item | Hg | As | Ni | Cu | Zn | Pb | Cr | Cd |
|---|---|---|---|---|---|---|---|---|
| Maximum | 1.782 | −0.335 | −0.290 | 0.173 | 6.079 | −0.325 | 0.652 | 1.860 |
| Minimum | −4.967 | −1.792 | −1.662 | −1.402 | 4.336 | −1.635 | −0.643 | −0.862 |
| Average | −0.450 | −0.901 | −0.653 | −0.467 | 5.349 | −0.761 | 0.234 | 0.060 |
| Average contamination level | 0 | 0 | 0 | 0 | 6 | 0 | 1 | 1 |
3.2. Cluster Analysis
3.3. Analysis of Heavy Metals
3.3.1. Cadmium

3.3.2. Chromium
3.3.3. Zinc and Lead
3.3.4. Mercury
3.3.5. Arsenic, Copper, and Nickel
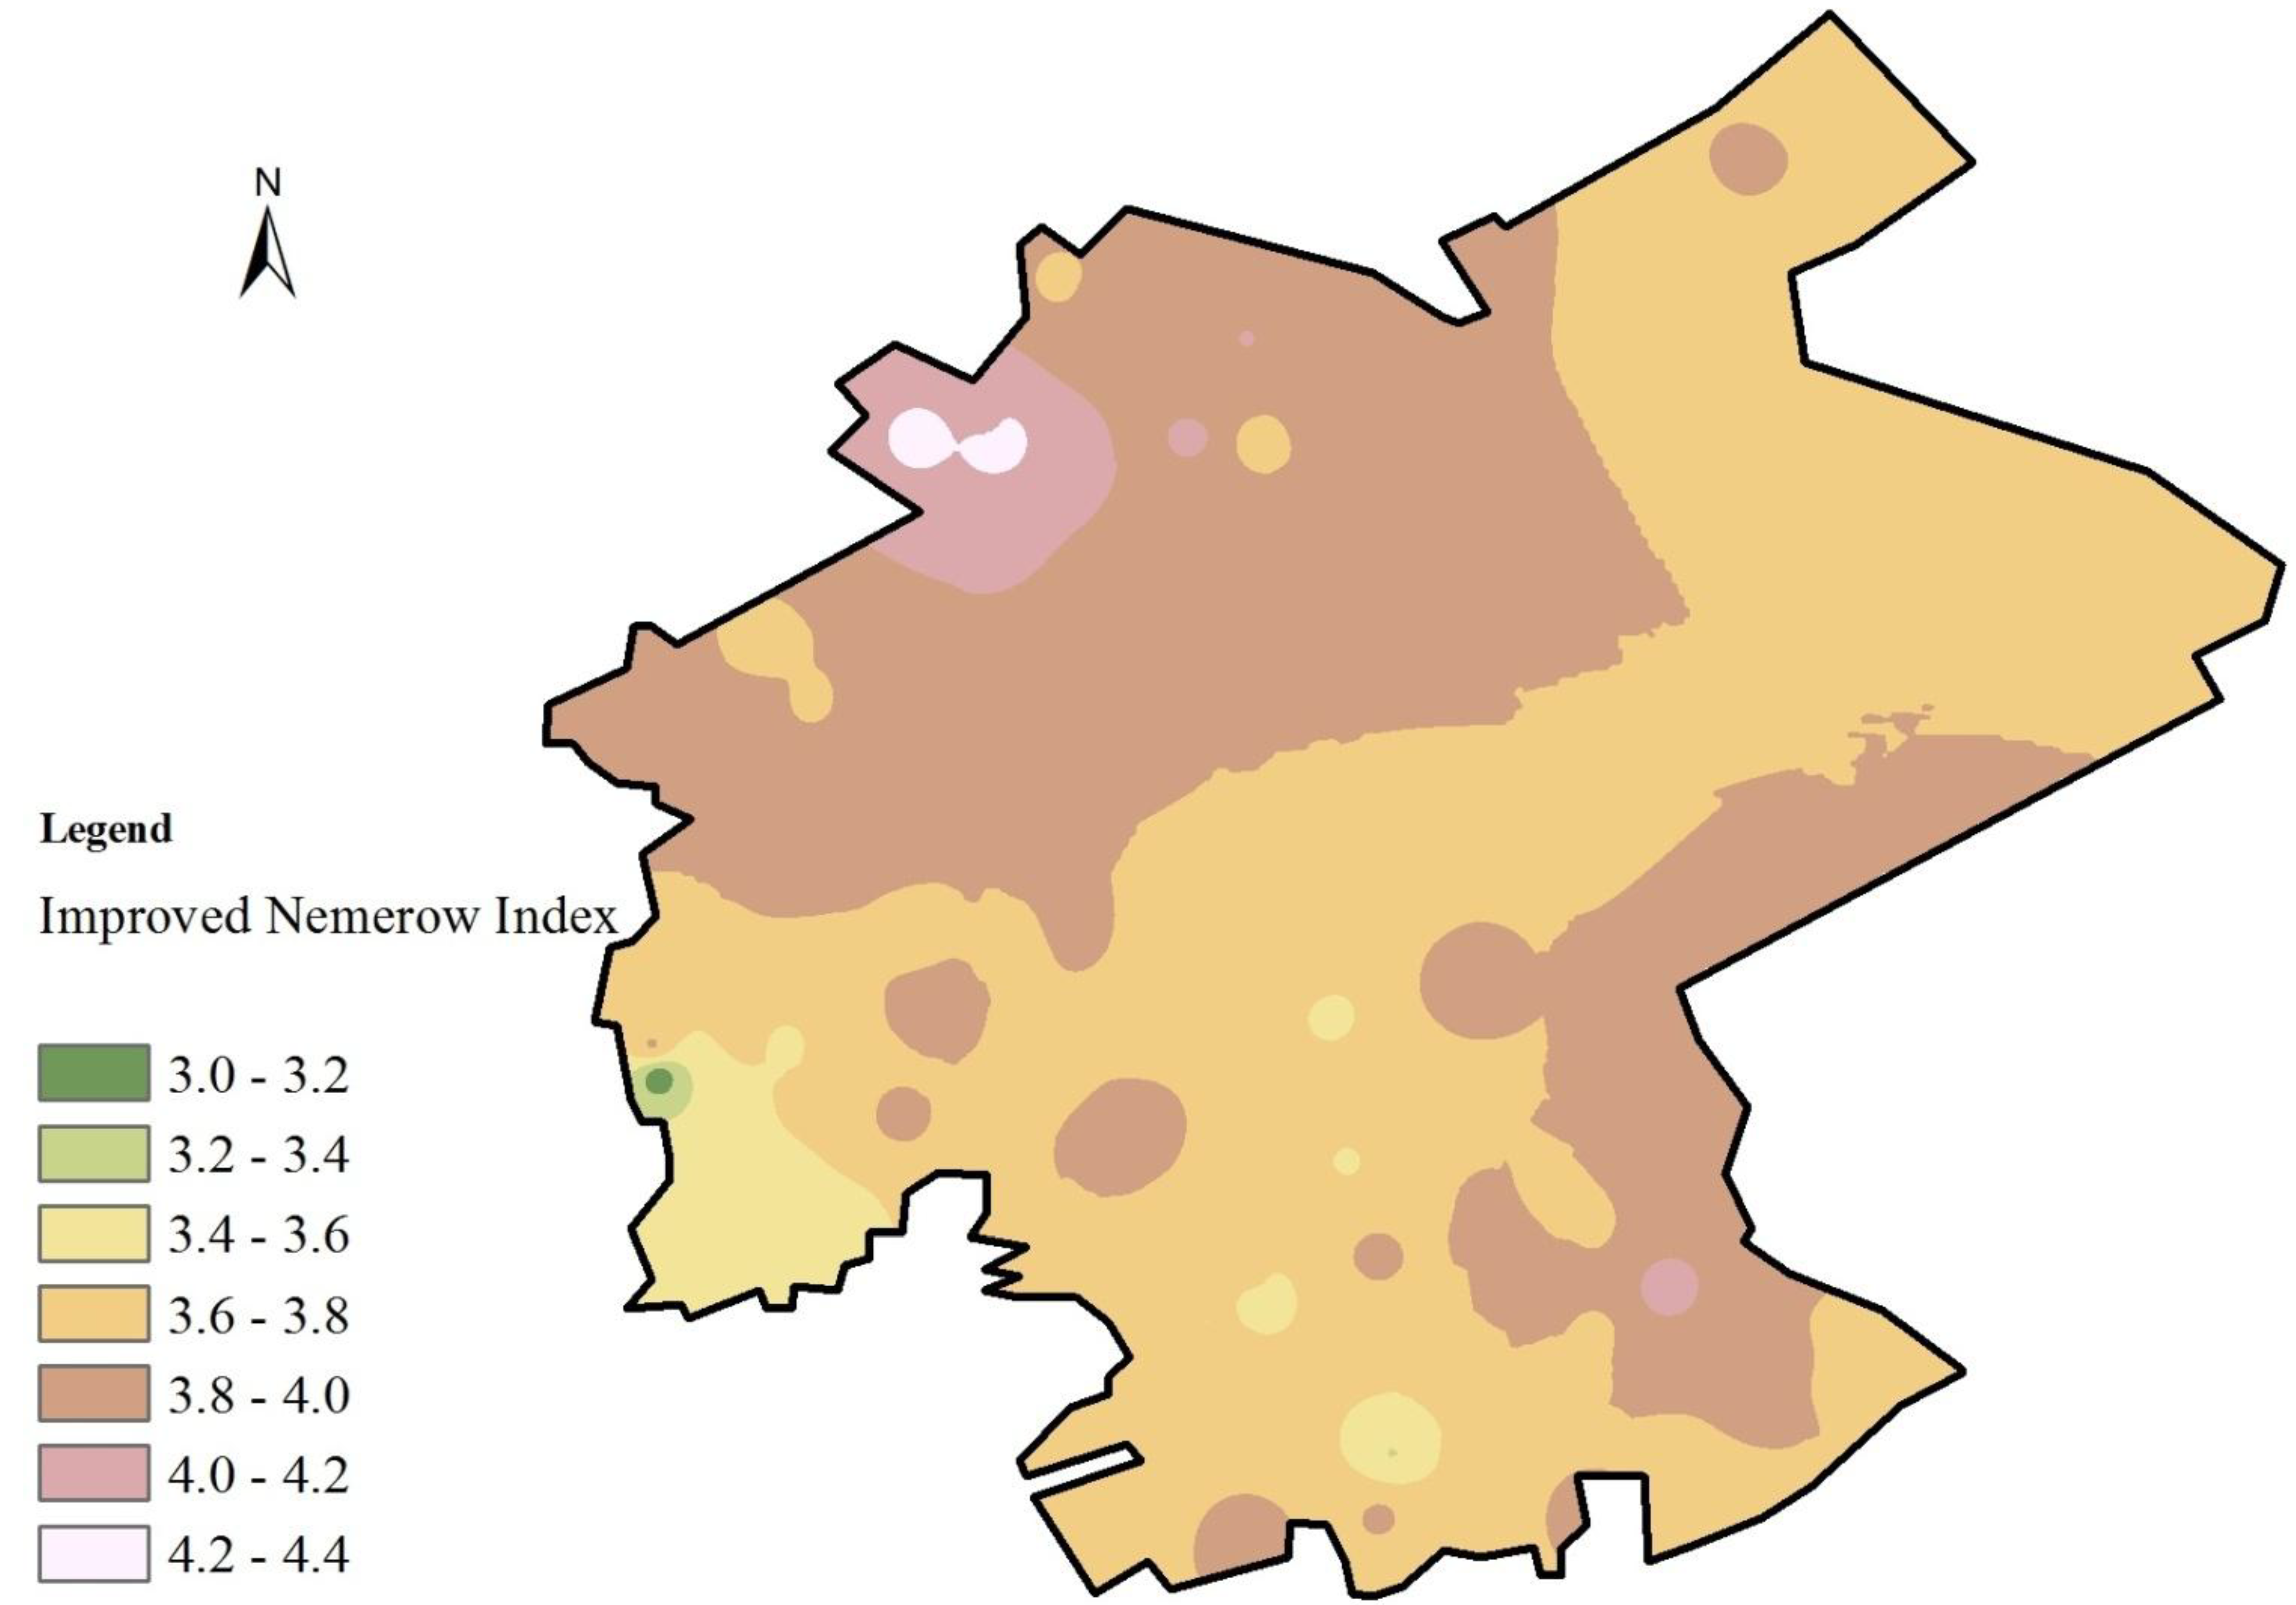
3.4. Improved Nemerow Index

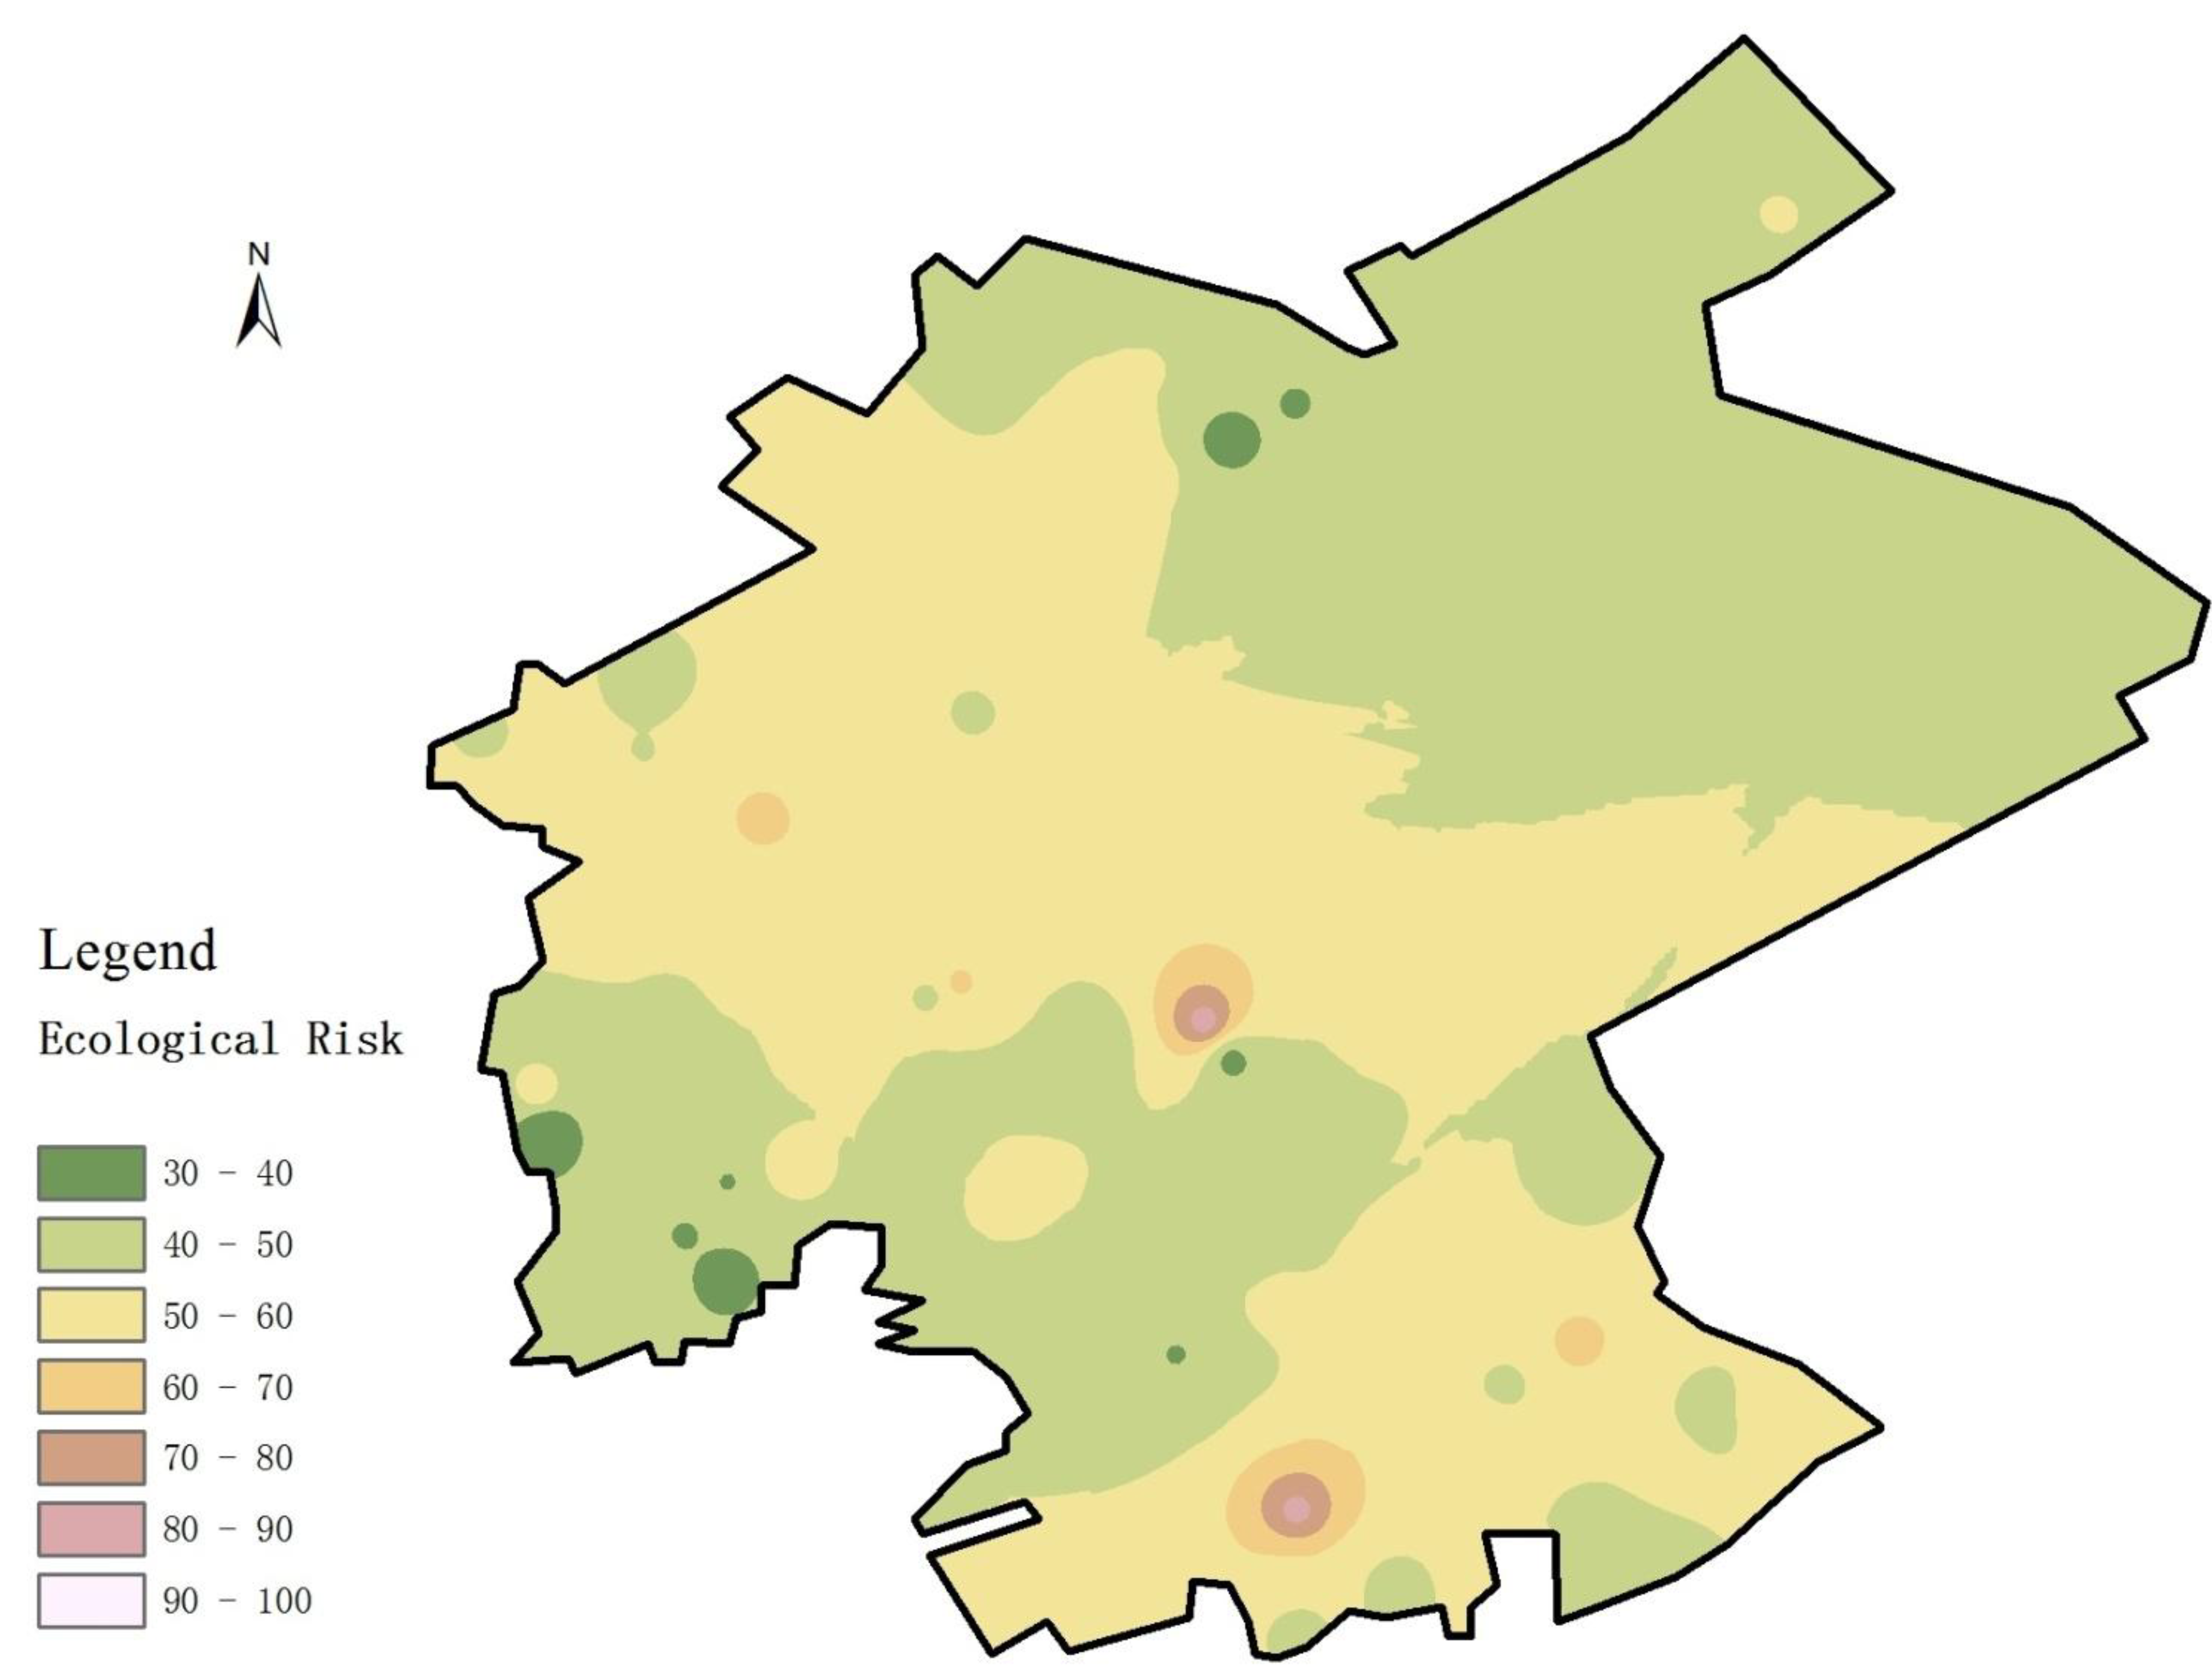
3.5. Potential Ecological Risk Analysis

4. Conclusions
Acknowledgements
Author Contributions
Conflicts of Interest
References
- Cui, B.; Wang, L.; Zhang, G.; Sun, Shi.; Geng, N.; Ru, S.; Chen, G. Status and harm of heavy metal pollution in doil and tesearch progress in remediation technology. J. Anhui. Agri. Sci. 2012, 40, 373–375. (In Chinese) [Google Scholar]
- Wei, B.; Yang, L. A review of heavy metal contaminations in urban soils, urban road dusts and agricultural soils from China. Microchem. J. 2010, 94, 99–107. [Google Scholar] [CrossRef]
- Sobolev, D.; Begonia, M. Effects of heavy metal contamination upon soil microbes: Lead-induced changes in general and denitrifying microbial communities as evidenced by molecular markers. Int. J. Environ. Res. Public. Health. 2008, 5, 450–456. [Google Scholar] [CrossRef]
- Zhou, J.; Dang, Z.; Cai, M.; Liu, C. Soil heavy metal pollution around the Dabaoshan mine, Guangdong province, China. Pedosphere. 2007, 17, 588–594. [Google Scholar] [CrossRef]
- Luo, Y. Trends in soil environmental pollution and the prevention-controlling-remediation strategies in China. Environ. Pollut. Control. 2009, 31, 27–31. (In Chinese) [Google Scholar]
- Zhao, Q.; Luo, Y.; Teng, Y. Strategic Thinking on Soil Protection in China. Available online: http://www.iuss.org/19th%20WCSS/Symposium/pdf/2254.pdf (accessed on 11 July 2014).
- Chen, L.; E, S. Current situation of soil contamination by heavy metals and research advances on the bioremediation techniques in China. Mod. Agr. Sci. 2009, 16, 139–140. (In Chinese) [Google Scholar]
- Chen, X.; Zhang, W.; Li, W.; Li, Z. Brief summerization of study on heavy-metal pollution of soil in China. Yunnan Geogr. Environ. Res. 2009, 21, 8–13. (In Chinese) [Google Scholar]
- Li, Y.; Wang, Y.; Gou, X.; Su, Y.; Wang, G. Risk assessment of heavy metals in soils and vegetables around non-ferrous metals mining and smelting sites, Baiyin, China. J. Environ. Sci. 2006, 18, 1124–1134. [Google Scholar] [CrossRef]
- Wang, X.; He, M.; Xie, J.; Xi, J.; Lu, X. Heavy metal pollution of the world largest antimony mine-affected agricultural soils in Hunan province (China). J. Soils. Sediments. 2010, 10, 827–837. [Google Scholar] [CrossRef]
- Luo, C.; Liu, C.; Wang, Y.; Liu, X.; Li, F.; Zhang, G.; Li, X. Heavy metal contamination in soils and vegetables near an e-waste processing site, south China. J. Hazard. Mater. 2011, 186, 481–490. [Google Scholar] [CrossRef]
- Zhao, H.; Xia, B.; Fan, C.; Zhao, P.; Shen, S. Human health risk from soil heavy metal contamination under different land uses near Dabaoshan mine, southern China. Sci. Total Environ. 2012, 417, 45–54. [Google Scholar]
- Fu, S.; Wei, C. Multivariate and spatial analysis of heavy metal sources and variations in a large old antimony mine, China. J. Soils. Sediments. 2013, 13, 106–116. [Google Scholar] [CrossRef]
- State Administration of Quality Supervision, Inspection and Quarantine. Safety Qualification for Agricultural Product-Environmental Requirements for Origin of Non-Environmental Pollution Vegetable; China Standard Press: Beijing, China, 2001. [Google Scholar]
- Xu, X.; Ji, C. Heavy metal pollution survey of vegetable soil in Jiangsu Province and the countermeasures. Rural Ecol. Environ. 2004, 21, 35–37. [Google Scholar]
- Zhao, N.; Lu, X.; Chao, S. Level and contamination assessment of environmentally sensitive elements in smaller than 100 μm street dust particles from Xining, China. Int. J. Environ. Res. Public. Health. 2014, 11, 2536–2549. [Google Scholar] [CrossRef]
- Shi, P.; Xiao, J.; Wang, Y.; Chen, L. Assessment of ecological and human health risks of heavy metal contamination in agriculture soils disturbed by pipeline construction. Int. J. Environ. Res. Public. Health. 2014, 11, 2504–2520. [Google Scholar]
- Liu, Y.; Tang, Q.; Bai, Z.; Zhang, X.; Zhang, B. The resarch of heavy metals pollution in soil based on the connection of geoaccumulation index and Nemero index. Chin. Agr. Sci. Bull. 2009, 25, 174–178. (In Chinese) [Google Scholar]
- Zhang, J.; Zhao, A.; Wang, Z.; Ke, H.; Chen, H. Discussion on the difference of heavy metals contamination in soil assessment with Nemerow index and geoaccumulation index—With Xiaoqinling gold belt as example. Environ. Prot. Anal. 2010, 8, 43–46. (In Chinese) [Google Scholar]
- Han, J.; Jia, L.; Tian, L.; Zang, S. Soil environmental quality assessment in coastal areas of agricultural production base in Tianjin. Tianjin. Agr. Forest. Sci. Technol. 2007, 2, 41–42. (In Chinese) [Google Scholar]
- Gao, X.; Wang, W.; Zhang, X.; Zhang, B.; Li, G.; Liu, Y. Dagang soil type and improvement measures. Mod. Rural Sci. Technol. 2012, 12, 41. (In Chinese) [Google Scholar]
- Cao, H.; Liang, T.; Wang, L.; Ding, S.; Ding, L.; Yan, X. Water and sediment content and distribution characteristics of heavy metals in intertidalite. Environ. Sci. 2006, 27, 126–131. (In Chinese) [Google Scholar]
- Anderberg, M.R. Cluster Analysis for Applications; Academic Press: New Youk, NY, USA, 1973. [Google Scholar]
- Shao, C.; Guan, Y.; Wan, Z.; Chu, C.; Ju, M. Performance analysis of CO2 emissions and energy efficiency of metal industries in China. J. Environ. Manage. 2014, 134, 30–38. [Google Scholar] [CrossRef]
- Müller, G. Index of geoaccumulation in sediments of the Rhine River. Geol. J. 1969, 2, 108–118. [Google Scholar]
- Srinivasa, G.S.; Ramakrishna, R.M.; Govil, P.K. Assessment of heavy metal contamination in soils at Jajmau (Kanpur) and Unnao industrial areas of the Ganga plain, Uttar Pradesh, India. J. Hazard. Mater. 2010, 174, 113–121. [Google Scholar] [CrossRef]
- Taylor, S.R.; Mclennan, S.M. The geochemical evolution of the continental crust. Rev. Geophys. 1995, 33, 241–265. [Google Scholar] [CrossRef]
- Tian, J; Li, Y.; Chen, D. Element background variation pattern of loess in China. Acta. Sci. Circums. 1991, 11, 253–262. (In Chinese) [Google Scholar]
- Yi, X; Gu, X; Hou, Y; Liu, X; Xie, J. Assessment on soil heavy metal pollution by geoaccumulation index in Jinghuiqu irrigation district in Shanxi Province. J. Earth. Sci. Environ. 2010, 32, 288–291. (In Chinese) [Google Scholar]
- Förstner, U.; Ahlf, W.; Calmano, W.; Kersten, M. Sediment Criteria Development; Springer: Berlin, Germany, 1990. [Google Scholar]
- Bade, R.; Oh, S.; Shin, W.S.; Hwang, I. Human health risk assessment of soils contaminated with metal(loid)s by using DGT uptake: A case study of a former Korean metal refinery site. Hum. Ecol. Risk Assessment 2013, 19, 767–777. [Google Scholar] [CrossRef]
- Dong, X.; Li, C.; Li, J.; Wang, J.; Liu, S.; Ye, B. A novel approach for soil contamination assessment from heavy metal pollution: A linkage between discharge and adsorption. J. Hazard. Mater. 2010, 175, 1022–1030. [Google Scholar] [CrossRef]
- Khan, M.N.; Wasim, A.A.; Sarwar, A.; Rasheed, M.F. Assessment of heavy metal toxicants in the roadside soil along the N-5, national highway, Pakistan. Environ. Monit. Assess. 2011, 182, 587–595. [Google Scholar] [CrossRef]
- Hakanson, L. An ecological risk index for aquatic pollution control. A sedimentological approach. Water. Res. 1980, 14, 975–1001. [Google Scholar]
- Xu, Z; Ni, S; Tuo, X; Zhang, C. Calculation of heavy metals’ toxicity coefficient in the evaluation of potential ecological risk index. Environ. Sci. Technol. 2008, 31, 112–115. (In Chinese) [Google Scholar]
- Chen, X.; Xia, X.-H.; Zhao, Y.; Zhang, P. Heavy metal concentrations in roadside soils and correlation with urban traffic in Beijing, China. J. Hazard. Mater. 2010, 181, 640–646. [Google Scholar] [CrossRef]
- Zeng, H.; Wu, J. Heavy metal pollution of lakes along the mid-lower reaches of the Yangtze river in China: Intensity, sources and spatial patterns. Int. J. Environ. Res. Public Health 2013, 10, 793–807. [Google Scholar] [CrossRef]
- Zhong, G.; Tang, Z. Environmental cadmium, lead and arsenic pollution and health impact-research progress in China. J. Environ. Health. 2006, 23, 562–565. (In Chinese) [Google Scholar]
- Tianjin Bureau of Statistics. Tianjin Statistical Yearbook; China Statistics Press: Beijing, China, 2006.
- Yin, L.; Zhao, J. Study on survey and evaluation of heavy metal pollution of surface soil in main suburbs of Xi’an city. J. Shaanxi. Normal. Univ. 2006, 34, 109–112. (In Chinese) [Google Scholar]
- Bai, L.; Zeng, X.; Li, L.; Pen, C.; Li, S. Effects of land use on heavy metal accumulation in soils and sources analysis. Agr. Sci. China. 2010, 9, 1650–1658. [Google Scholar] [CrossRef]
© 2014 by the authors; licensee MDPI, Basel, Switzerland. This article is an open access article distributed under the terms and conditions of the Creative Commons Attribution license (http://creativecommons.org/licenses/by/3.0/).
Share and Cite
Guan, Y.; Shao, C.; Ju, M. Heavy Metal Contamination Assessment and Partition for Industrial and Mining Gathering Areas. Int. J. Environ. Res. Public Health 2014, 11, 7286-7303. https://doi.org/10.3390/ijerph110707286
Guan Y, Shao C, Ju M. Heavy Metal Contamination Assessment and Partition for Industrial and Mining Gathering Areas. International Journal of Environmental Research and Public Health. 2014; 11(7):7286-7303. https://doi.org/10.3390/ijerph110707286
Chicago/Turabian StyleGuan, Yang, Chaofeng Shao, and Meiting Ju. 2014. "Heavy Metal Contamination Assessment and Partition for Industrial and Mining Gathering Areas" International Journal of Environmental Research and Public Health 11, no. 7: 7286-7303. https://doi.org/10.3390/ijerph110707286
APA StyleGuan, Y., Shao, C., & Ju, M. (2014). Heavy Metal Contamination Assessment and Partition for Industrial and Mining Gathering Areas. International Journal of Environmental Research and Public Health, 11(7), 7286-7303. https://doi.org/10.3390/ijerph110707286