Comparing the Visual Analogue Scale and the Pediatric Quality of Life Inventory for Measuring Health-Related Quality of Life in Children with Oral Clefts
Abstract
:1. Introduction
2. Methods
2.1. Data
2.2. Comparison of HRQL Instruments

On the scale below, we ask you to rate your child’s health-related quality of life on a scale of 0 to 100. A score of “0” represents the worst health state that you can imagine. A score of “100” represents perfect health. A child with perfect health would be one who has no pain or discomfort, no anxiety or depression, and no problems with usual activities that would be expected for his or her age, such as feeding him or herself, speaking, playing with other children, washing his or her hands, participating in school activities.
3. Results
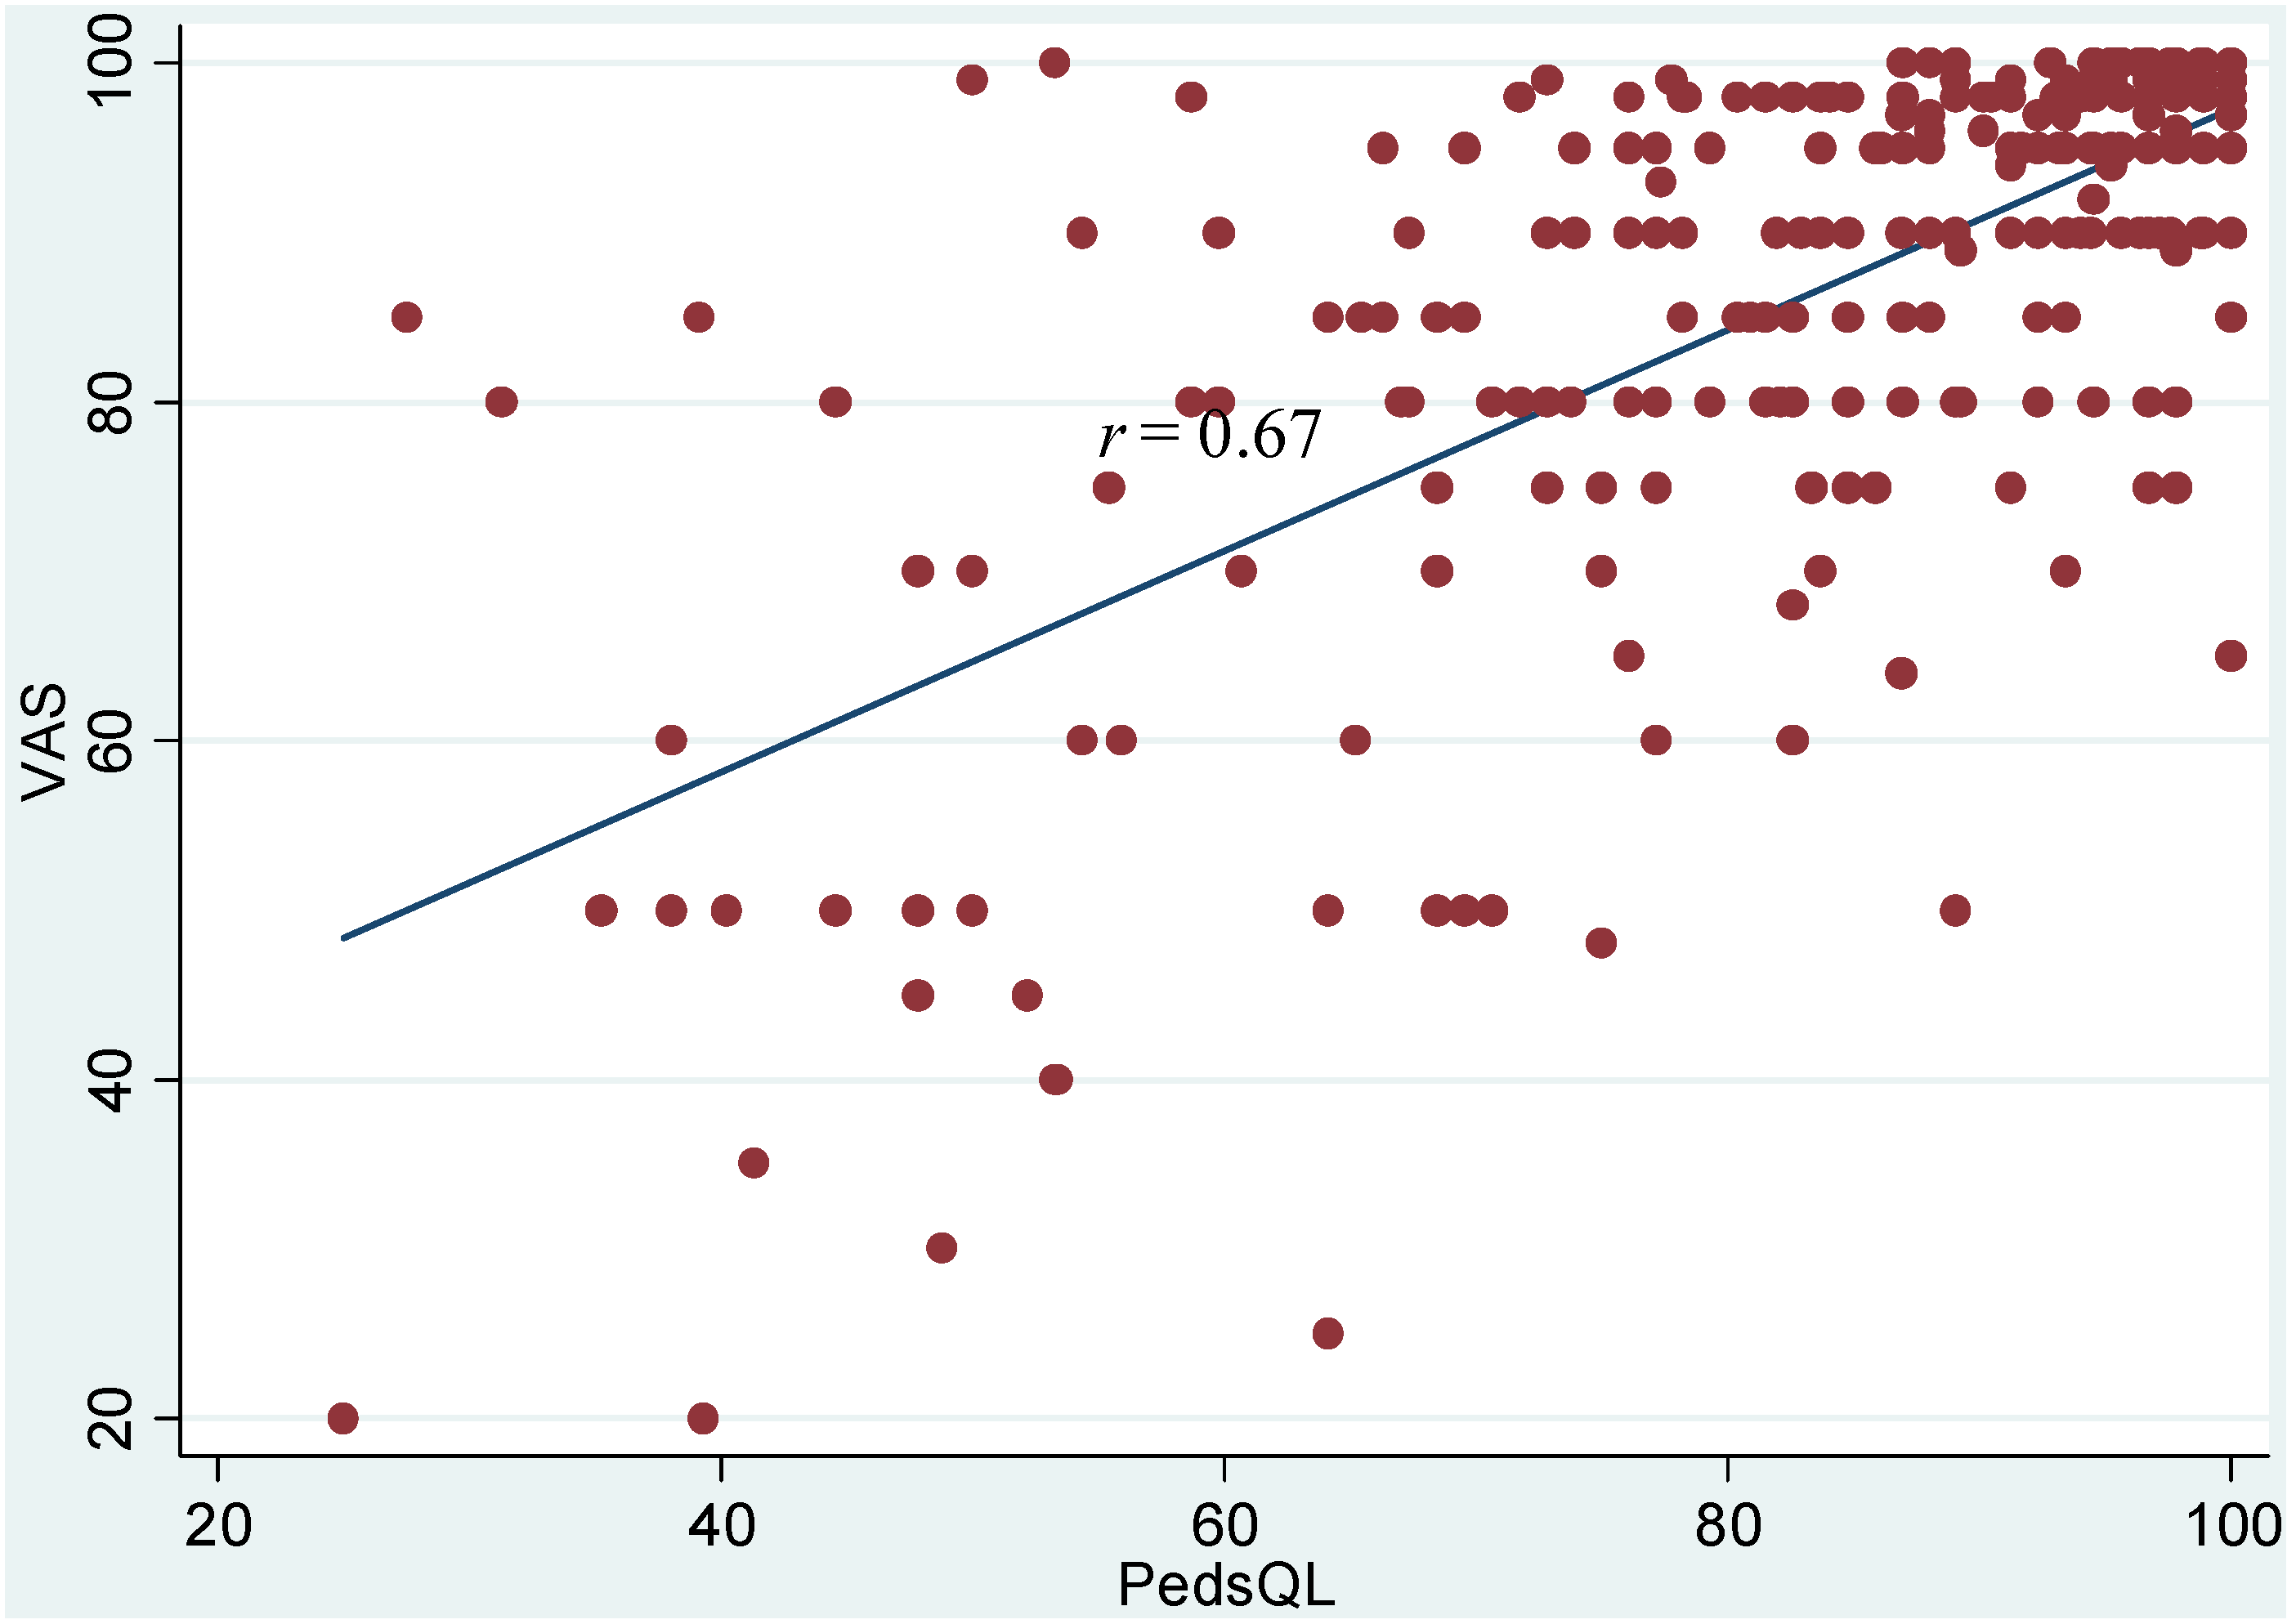
| Health Measure | Variable Name (for Reference) | N | Mean | Standard Deviation | Minimum | Maximum |
|---|---|---|---|---|---|---|
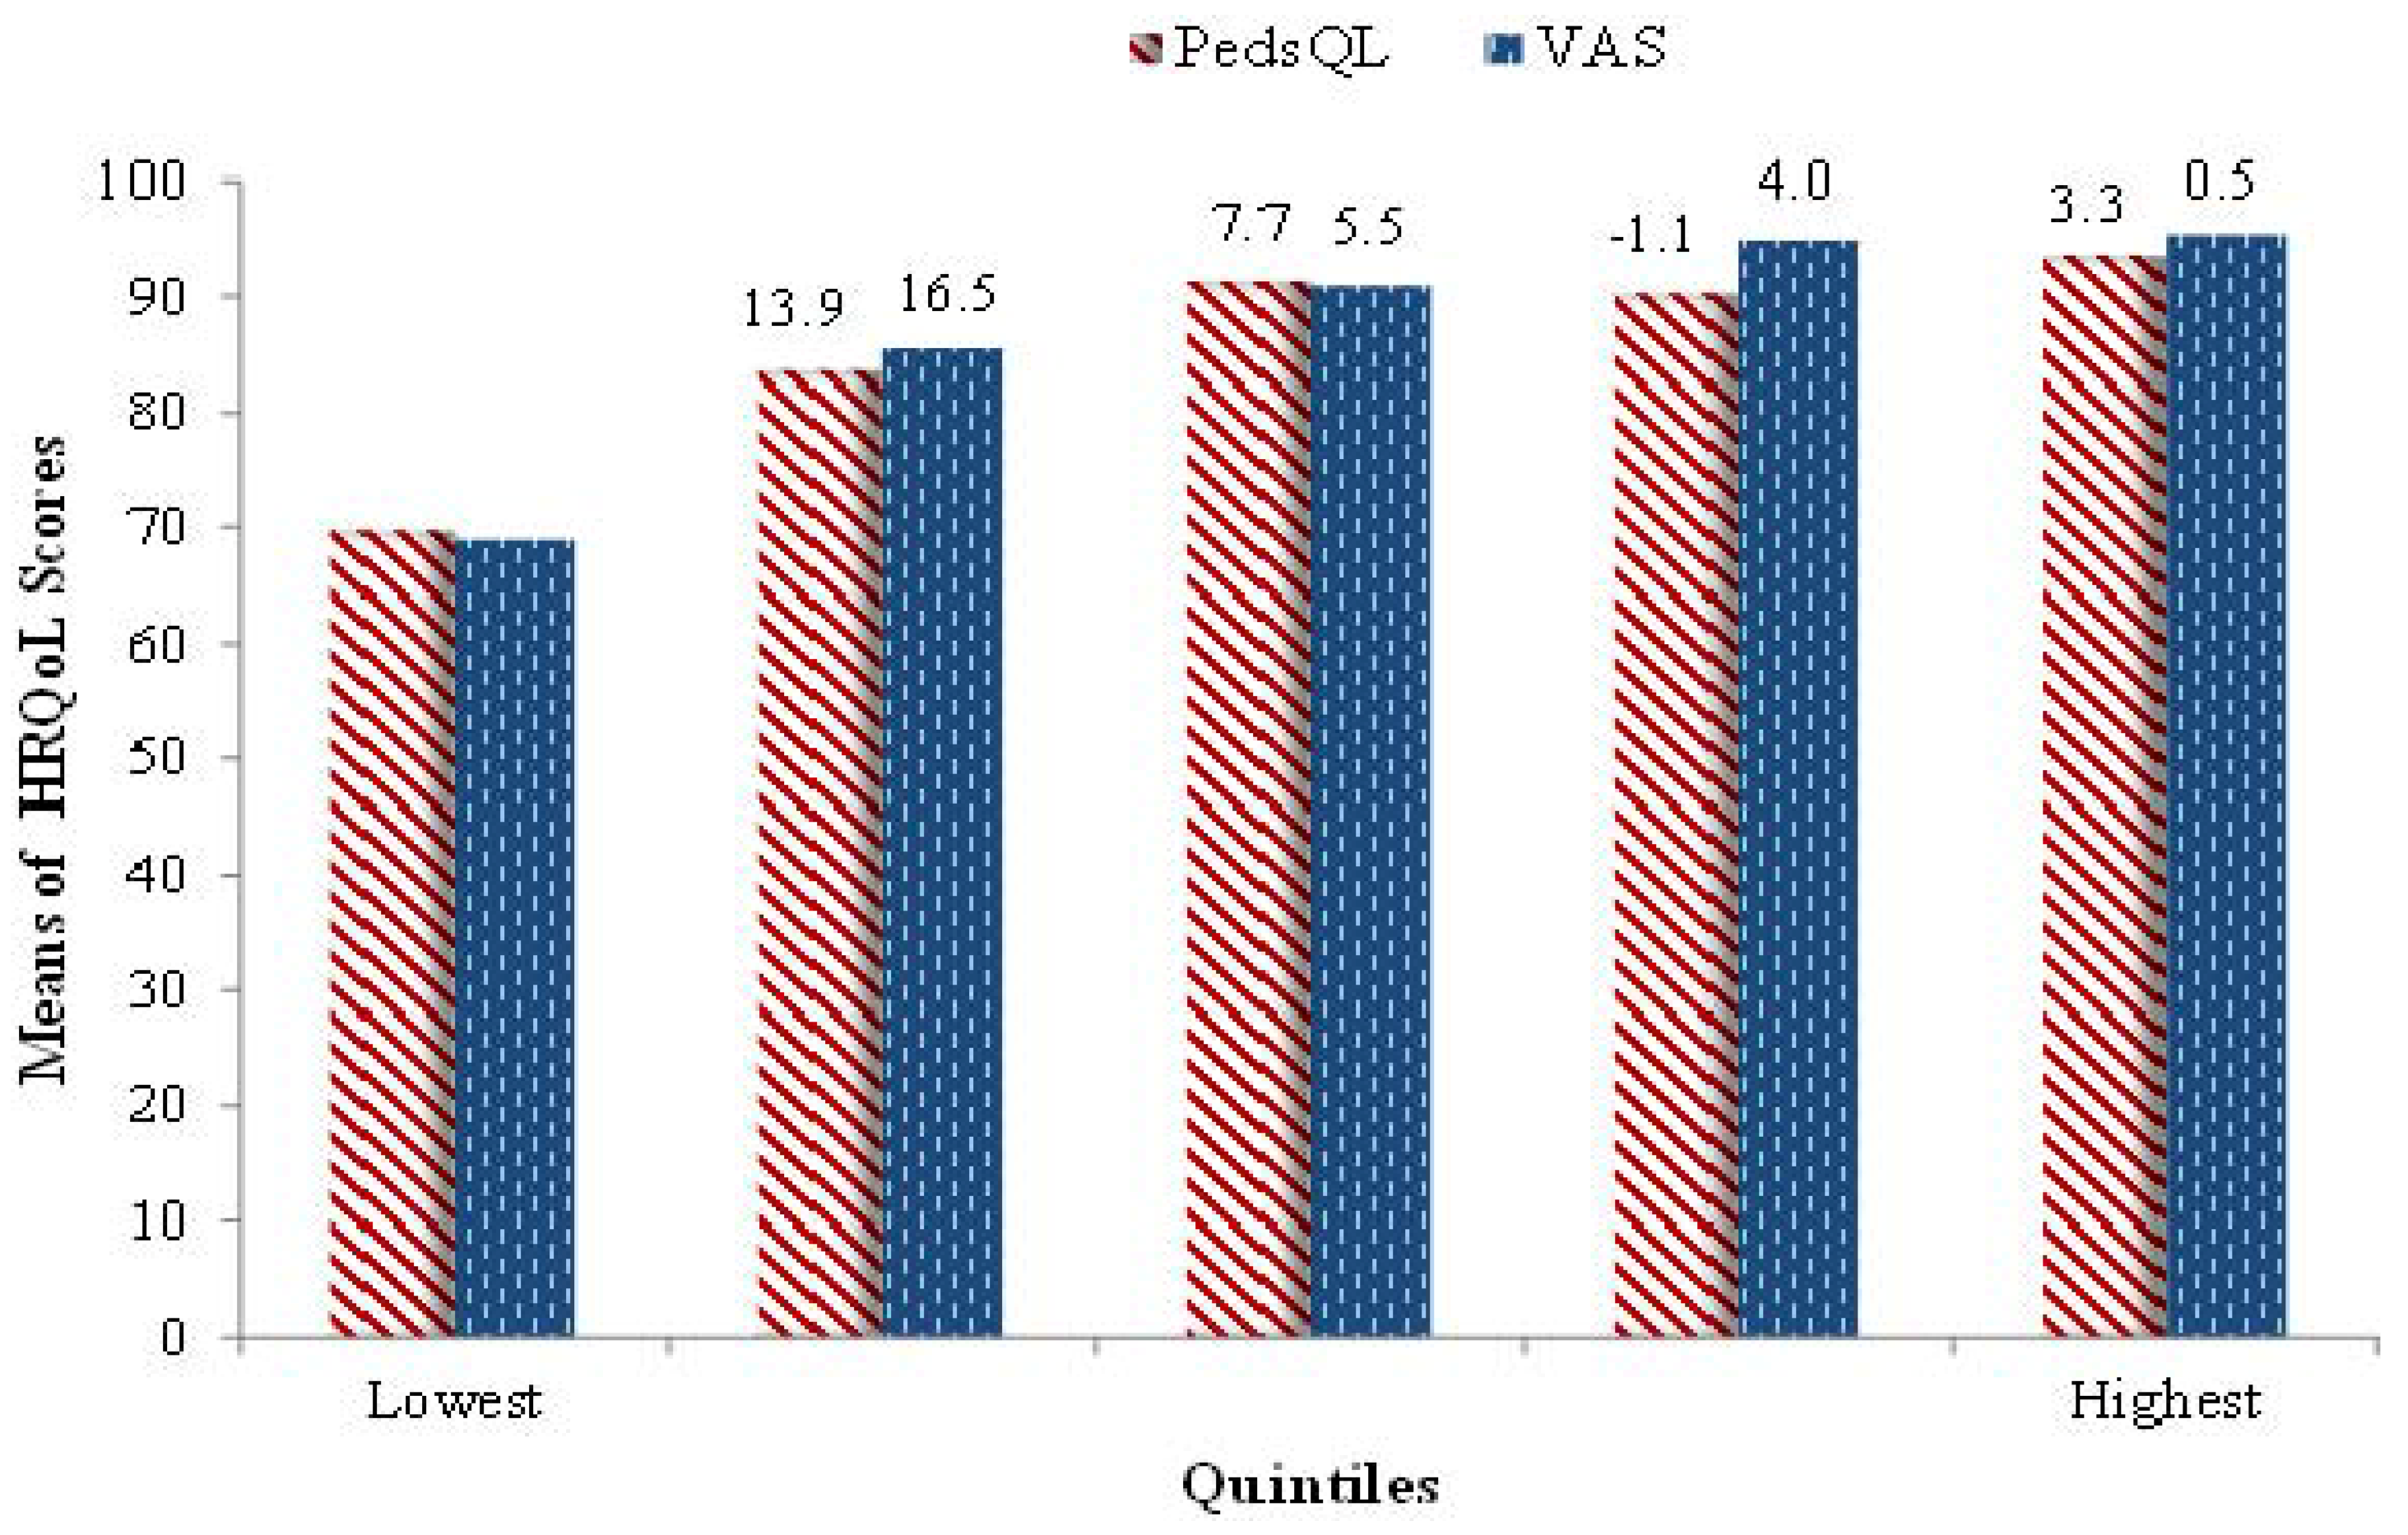
| visual analog scale | VAS | 301 | 86.6 | 15.9 | 20 | 100 |
| Pediatric Quality of Life Inventory 4.0 | PedsQL | 301 | 83.8 | 16.4 | 25 | 100 |
| In general, how would you rate your child’s overall health now? (1 = excellent, 5 = poor) | child's overall health | 300 | 1.55 | 0.80 | 1 | 5 |
| If child has any chronic health condition under one or more of 25 categories (e.g., asthma, attention, vision, hearing, heart, muscle, or other problems) then the value is = 1 otherwise, it is = 0 | chronic condition | 307 | 0.82 | 0.38 | 0 | 1 |
| How often does your child appear to get frustrated when he or she speaks because of trouble being understood? (1 = never, 4 = always) | child frustrated because of trouble being understood | 301 | 1.58 | 0.70 | 1 | 4 |
| How often does your child appear to avoid talking because of trouble being understood? (1 = never, 4 = always) | child avoids speaking | 302 | 1.21 | 0.51 | 1 | 4 |
| How often does your child appear to have difficulty being understood by the people who are with him or her every day? (1 = never, 4 = always) | difficulty being understood by those who do see child often | 303 | 1.48 | 0.64 | 1 | 4 |
| How often does your child appear to have difficulty being understood by people who don’t interact with or see him or her very much? (1 = never, 4 = always) | difficulty being understood by those who do not see child much | 302 | 1.82 | 0.86 | 1 | 4 |
| Overall, how happy would you say your child is with his or her facial appearance? (1 = very happy, 4 = not happy at all) | happy with facial appearance | 298 | 1.34 | 0.62 | 1 | 4 |
| Social anxiety (Question 15)—binary variable | social anxiety | 307 | 0.16 | 0.36 | 0 | 1 |
| Separation anxiety (Question 15)—binary variable | separation anxiety | 307 | 0.25 | 0.44 | 0 | 1 |
| PBS aggression/opposition | PBS aggression/opposition | 296 | 4.66 | 4.39 | 0 | 27 |
| PBS hyperactivity/inattention | PBS hyperactivity/inattention | 297 | 7.27 | 6.95 | 0 | 27 |
| PBS depression/anxiety | PBS depression/anxiety | 297 | 2.08 | 3.09 | 0 | 16 |
| PBS physical health | PBS physical health | 299 | 1.12 | 1.92 | 0 | 13 |


| Variable Name | Correlation with VAS | Correlation with PedsQL |
|---|---|---|
| Child’s overall health | −0.537 | −0.538 |
| chronic condition | −0.230 a | −0.304 |
| child frustrated because of trouble being understood | −0.355 | −0.348 |
| child avoids speaking | −0.388 | −0.325 |
| difficulty being understood by those who do see child often | −0.385 | −0.324 |
| difficulty being understood by those who do not see child much | −0.346 | −0.342 |
| happy with facial appearance | −0.256 | −0.200 b |
| social anxiety | −0.284 | −0.225 a |
| separation anxiety | −0.319 | −0.366 |
| PBS aggression/opposition | −0.366 | −0.423 |
| PBS hyperactivity/inattention | −0.379 | −0.469 |
| PBS depression/anxiety | −0.501 | −0.482 |
| PBS physical health | −0.420 | −0.407 |
| Regressions | β (SE) | |
|---|---|---|
| VAS | PedsQLTM | |
| Mean Regression (OLS) | ||
| CLO vs. CLP | 3.08 (2.28) | 6.14 (2.33) *** |
| CPO vs. CLP | −0.16 (2.16) | 1.88 (2.21) |
| Median Regression | ||
| CLO vs. CPO & CLP | 5.00 (1.96) ** | 7.09 (2.54) *** |
4. Discussion
5. Conclusions
Acknowledgments
Author Contributions
Conflicts of Interest
References
- Wehby, G.L.; Ohsfeldt, R.L.; Murray, J.C. Health professionals’ assessment of health-related quality of life values for oral clefting by age using a visual analogue scale method. Cleft Palate-Craniofac. J. 2006, 43, 383–391. [Google Scholar] [CrossRef]
- Wehby, G.L.; Cassell, C.H. The impact of orofacial clefts on quality of life and healthcare use and costs. Oral Dis. 2010, 16, 3–10. [Google Scholar] [CrossRef]
- Ward, J.A.; Vig, K.W.; Firestone, A.R.; Mercado, A.; da Fonseca, M.; Johnston, W. Oral health-related quality of life in children with orofacial clefts. Cleft Palate-Craniofac. J. 2013, 50, 174–181. [Google Scholar] [CrossRef]
- Wehby, G.L.; Nyarko, K.A.; Lopez-Camelo, J.S. Fetal health shocks and early inequalities in health capital accumulation. Health Econ. 2013, 23, 69–92. [Google Scholar]
- Wehby, G.L.; Pedersen, D.A.; Murray, J.C.; Christensen, K. The effects of oral clefts on hospital use throughout the lifespan. BMC Health Serv. Res. 2012, 12. [Google Scholar] [CrossRef]
- Wehby, G.L.; Tyler, M.C.; Lindgren, S.; Romitti, P.; Robbins, J.; Damiano, P. Oral clefts and behavioral health of young children. Oral Dis. 2012, 18, 74–84. [Google Scholar] [CrossRef]
- Tyler, M.C.; Wehby, G.L.; Robbins, J.M.; Damiano, P.C. Separation anxiety in children ages 4 through 9 with oral clefts. Cleft Palate-Craniofac. J. 2013, 50, 520–527. [Google Scholar] [CrossRef]
- Gold, M.; Siegel, J.; Russell, L.; Weinstein, M. Cost-Effectiveness in Health and Medicine; Oxford University Press: New York, NY, USA, 1996. [Google Scholar]
- Varni, J.W.; Seid, M.; Rode, C.A. The PedsQL: Measurement model for the pediatric quality of life inventory. Medical Care 1999, 37, 126–139. [Google Scholar] [CrossRef]
- Varni, J.W.; Burwinkle, T.M.; Seid, M.; Skarr, D. The PedsQL 4.0 as a pediatric population health measure: Feasibility, reliability, and validity. Ambul. Pediatr. 2003, 3, 329–341. [Google Scholar] [CrossRef]
- Varni, J.W.; Seid, M.; Knight, T.S.; Uzark, K.; Szer, I.S. The PedsQL (TM) 4.0 generic core scales: Sensitivity, responsiveness, and impact on clinical decision-making. J Behav Med. 2002, 25, 175–193. [Google Scholar] [CrossRef]
- Chan, K.S.; Mangione-Smith, R.; Burwinkle, T.M.; Rosen, M.; Varni, J.W. The PedsQL (TM)—Reliability and validity of the short-form generic core scales and asthma module. Med. Care 2005, 43, 256–265. [Google Scholar] [CrossRef]
- Parkin, D.; Devlin, N. Is there a case for using visual analogue scale valuations in cost-utility analysis? Health Econ. 2006, 15, 653–664. [Google Scholar] [CrossRef]
- Froberg, D.G.; Kane, R.L. Methodology for measuring health-state preferences—II: Scaling methods. J. Clin. Epidemiol. 1989, 42, 459–471. [Google Scholar] [CrossRef]
- Gift, A.G. Visual analogue scales: Measurement of subjective phenomena. Nurs. Res. 1989, 38, 286–288. [Google Scholar]
- McGrath, P.A.; Seifert, C.E.; Speechley, K.N.; Booth, J.C.; Stitt, L.; Gibson, M.C. A new analogue scale for assessing children’s pain: an initial validation study. Pain 1996, 64, 435–443. [Google Scholar]
- Torrance, G.W.; Feeny, D.; Furlong, W. Visual analog scales: Do they have a role in the measurement of preferences for health states? Med. Decis. Mak. 2001, 21, 329–334. [Google Scholar] [CrossRef]
- Dillman, D.A. Mail and Internet Surveys: The Tailored Design Method, 2nd ed.; Wiley: Hoboken, NJ, USA, 2007. [Google Scholar]
- Birmaher, B.; Brent, D.A.; Chiappetta, L.; Bridge, J.; Monga, S.; Baugher, M. Psychometric properties of the screen for child anxiety related emotional disorders (SCARED): A replication study. J. Am. Acad. Child Adolesc. Psychiatry 1999, 38, 1230–1236. [Google Scholar] [CrossRef]
- Broder, H.L.; Norman, R.G.; Sischo, L.; Wilson-Genderson, M. Evaluation of the similarities and differences in response patterns to the pediatric quality of life inventory and the child oral health impact scores among youth with cleft. Qual. Life Res. 2013, 23, 339–347. [Google Scholar]
- Du, R.Y.; McGrath, C.; Yiu, C.K.Y.; King, N.M. Health- and oral health-related quality of life among preschool children with cerebral palsy. Qual. Life Res. 2010, 19, 1367–1371. [Google Scholar]
- Brunner, H.I.; Klein-Gitelman, M.S.; Miller, M.J.; Trombley, M.; Baldwin, N.; Kress, A.; Johnson, A.L.; Barron, A.C.; Griffin, T.A.; Passo, M.H.; Lovell, D.J. Health of children with chronic arthritis: Relationship of different measures and the quality of parent proxy reporting. Arthritis Rheum. 2004, 51, 763–773. [Google Scholar] [CrossRef]
© 2014 by the authors; licensee MDPI, Basel, Switzerland. This article is an open access article distributed under the terms and conditions of the Creative Commons Attribution license (http://creativecommons.org/licenses/by/3.0/).
Share and Cite
Wehby, G.L.; Naderi, H.; Robbins, J.M.; Ansley, T.N.; Damiano, P.C. Comparing the Visual Analogue Scale and the Pediatric Quality of Life Inventory for Measuring Health-Related Quality of Life in Children with Oral Clefts. Int. J. Environ. Res. Public Health 2014, 11, 4280-4291. https://doi.org/10.3390/ijerph110404280
Wehby GL, Naderi H, Robbins JM, Ansley TN, Damiano PC. Comparing the Visual Analogue Scale and the Pediatric Quality of Life Inventory for Measuring Health-Related Quality of Life in Children with Oral Clefts. International Journal of Environmental Research and Public Health. 2014; 11(4):4280-4291. https://doi.org/10.3390/ijerph110404280
Chicago/Turabian StyleWehby, George L., Hodad Naderi, James M. Robbins, Timothy N. Ansley, and Peter C. Damiano. 2014. "Comparing the Visual Analogue Scale and the Pediatric Quality of Life Inventory for Measuring Health-Related Quality of Life in Children with Oral Clefts" International Journal of Environmental Research and Public Health 11, no. 4: 4280-4291. https://doi.org/10.3390/ijerph110404280
APA StyleWehby, G. L., Naderi, H., Robbins, J. M., Ansley, T. N., & Damiano, P. C. (2014). Comparing the Visual Analogue Scale and the Pediatric Quality of Life Inventory for Measuring Health-Related Quality of Life in Children with Oral Clefts. International Journal of Environmental Research and Public Health, 11(4), 4280-4291. https://doi.org/10.3390/ijerph110404280


