Global Trade, Local Impacts: Lessons from California on Health Impacts and Environmental Justice Concerns for Residents Living near Freight Rail Yards

Abstract
:
1. Introduction
“We recommend doing everything possible to avoid locating sensitive receptors within the highest risk zones at ports and rail yards… Avoid siting new sensitive land uses within 1,000 feet of a major service and maintenance rail yard. Within one mile of a rail yard, consider possible siting limitations and mitigation approaches”.[19]
“... the fair treatment and meaningful involvement of all people regardless of race, color, national origin, or income with respect to the development, implementation, and enforcement of environmental laws, regulations, and policies.”[28]
- Describe the number of California residents who live in the zones of highest diesel cancer risk near existing rail yards in the state and determine if there are racial/ethnic and income disparities among them;
- Determine through a review of the news media and trade journals whether new or expanding rail yards are taking into consideration the proximity of schools and homes to the newly proposed sites, as well as the potential for disproportionate impacts; and
- Offer insights into what makes an intermodal rail yard unique in terms of industrial facilities and what types of considerations are needed to help ensure that rail yard siting or expansion takes community, public health and environmental justice concerns into account.
2. Background Information from the California Air Resources Board Health Risk Assessments
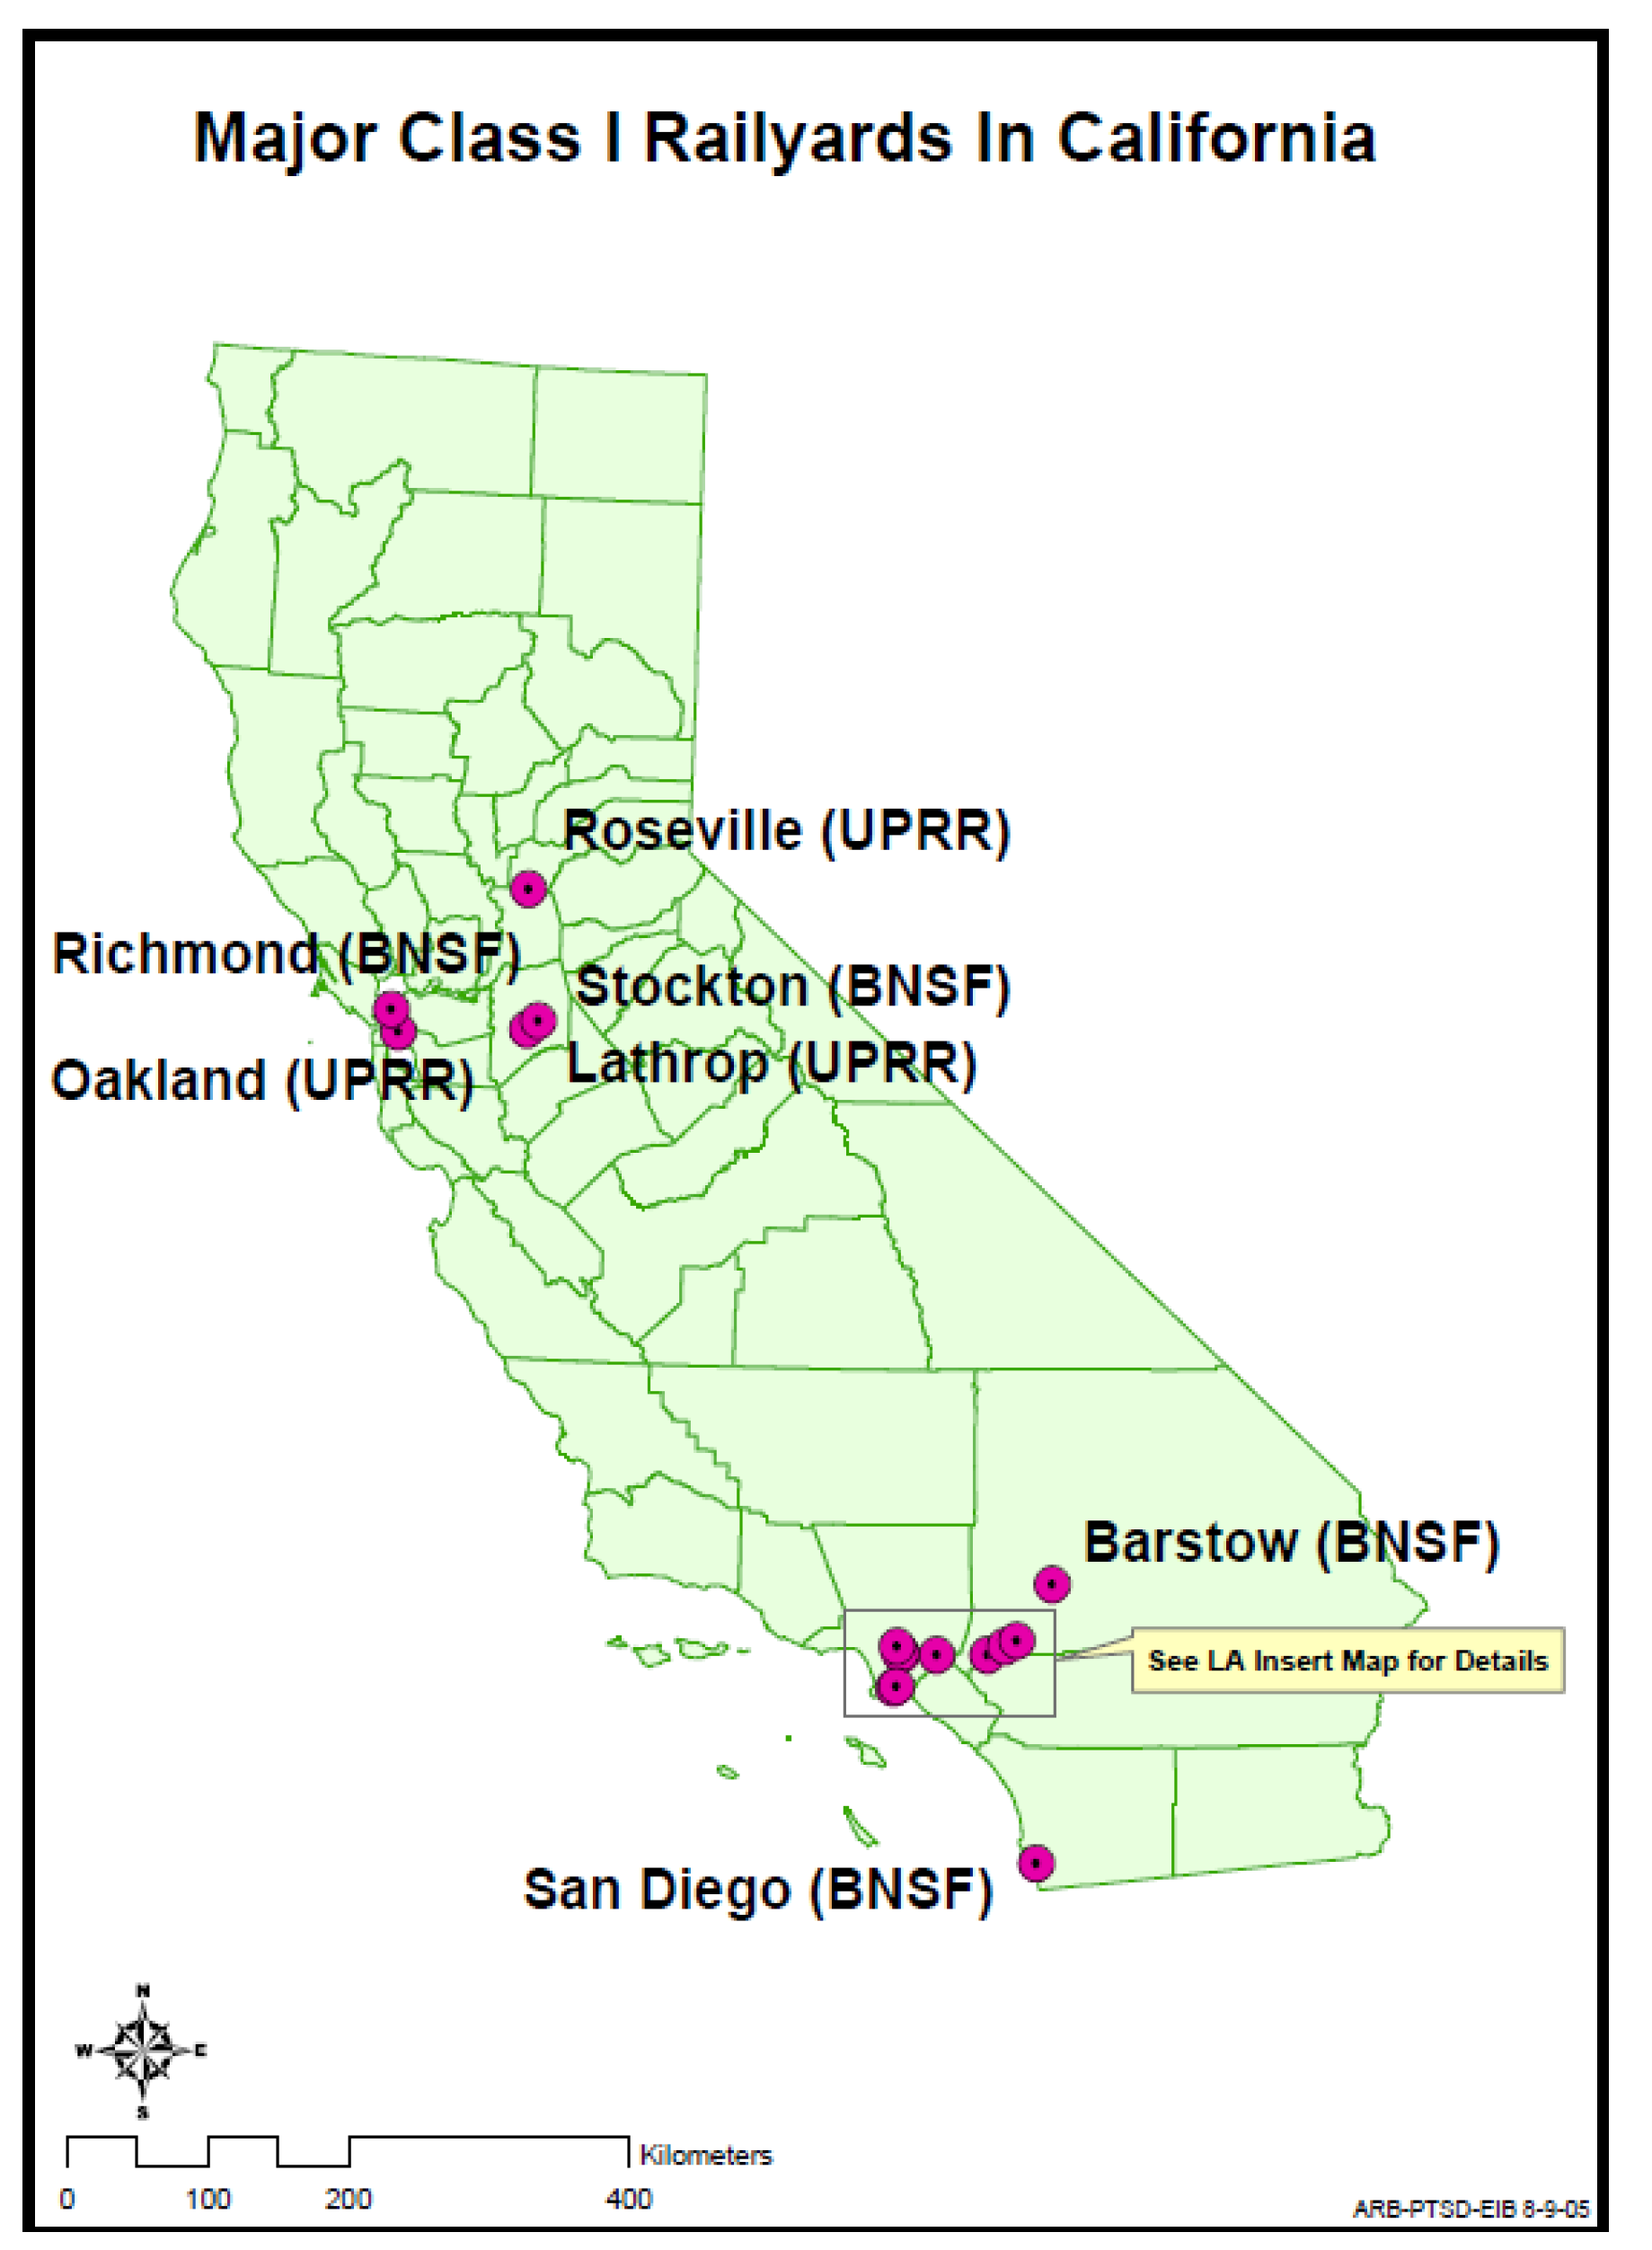
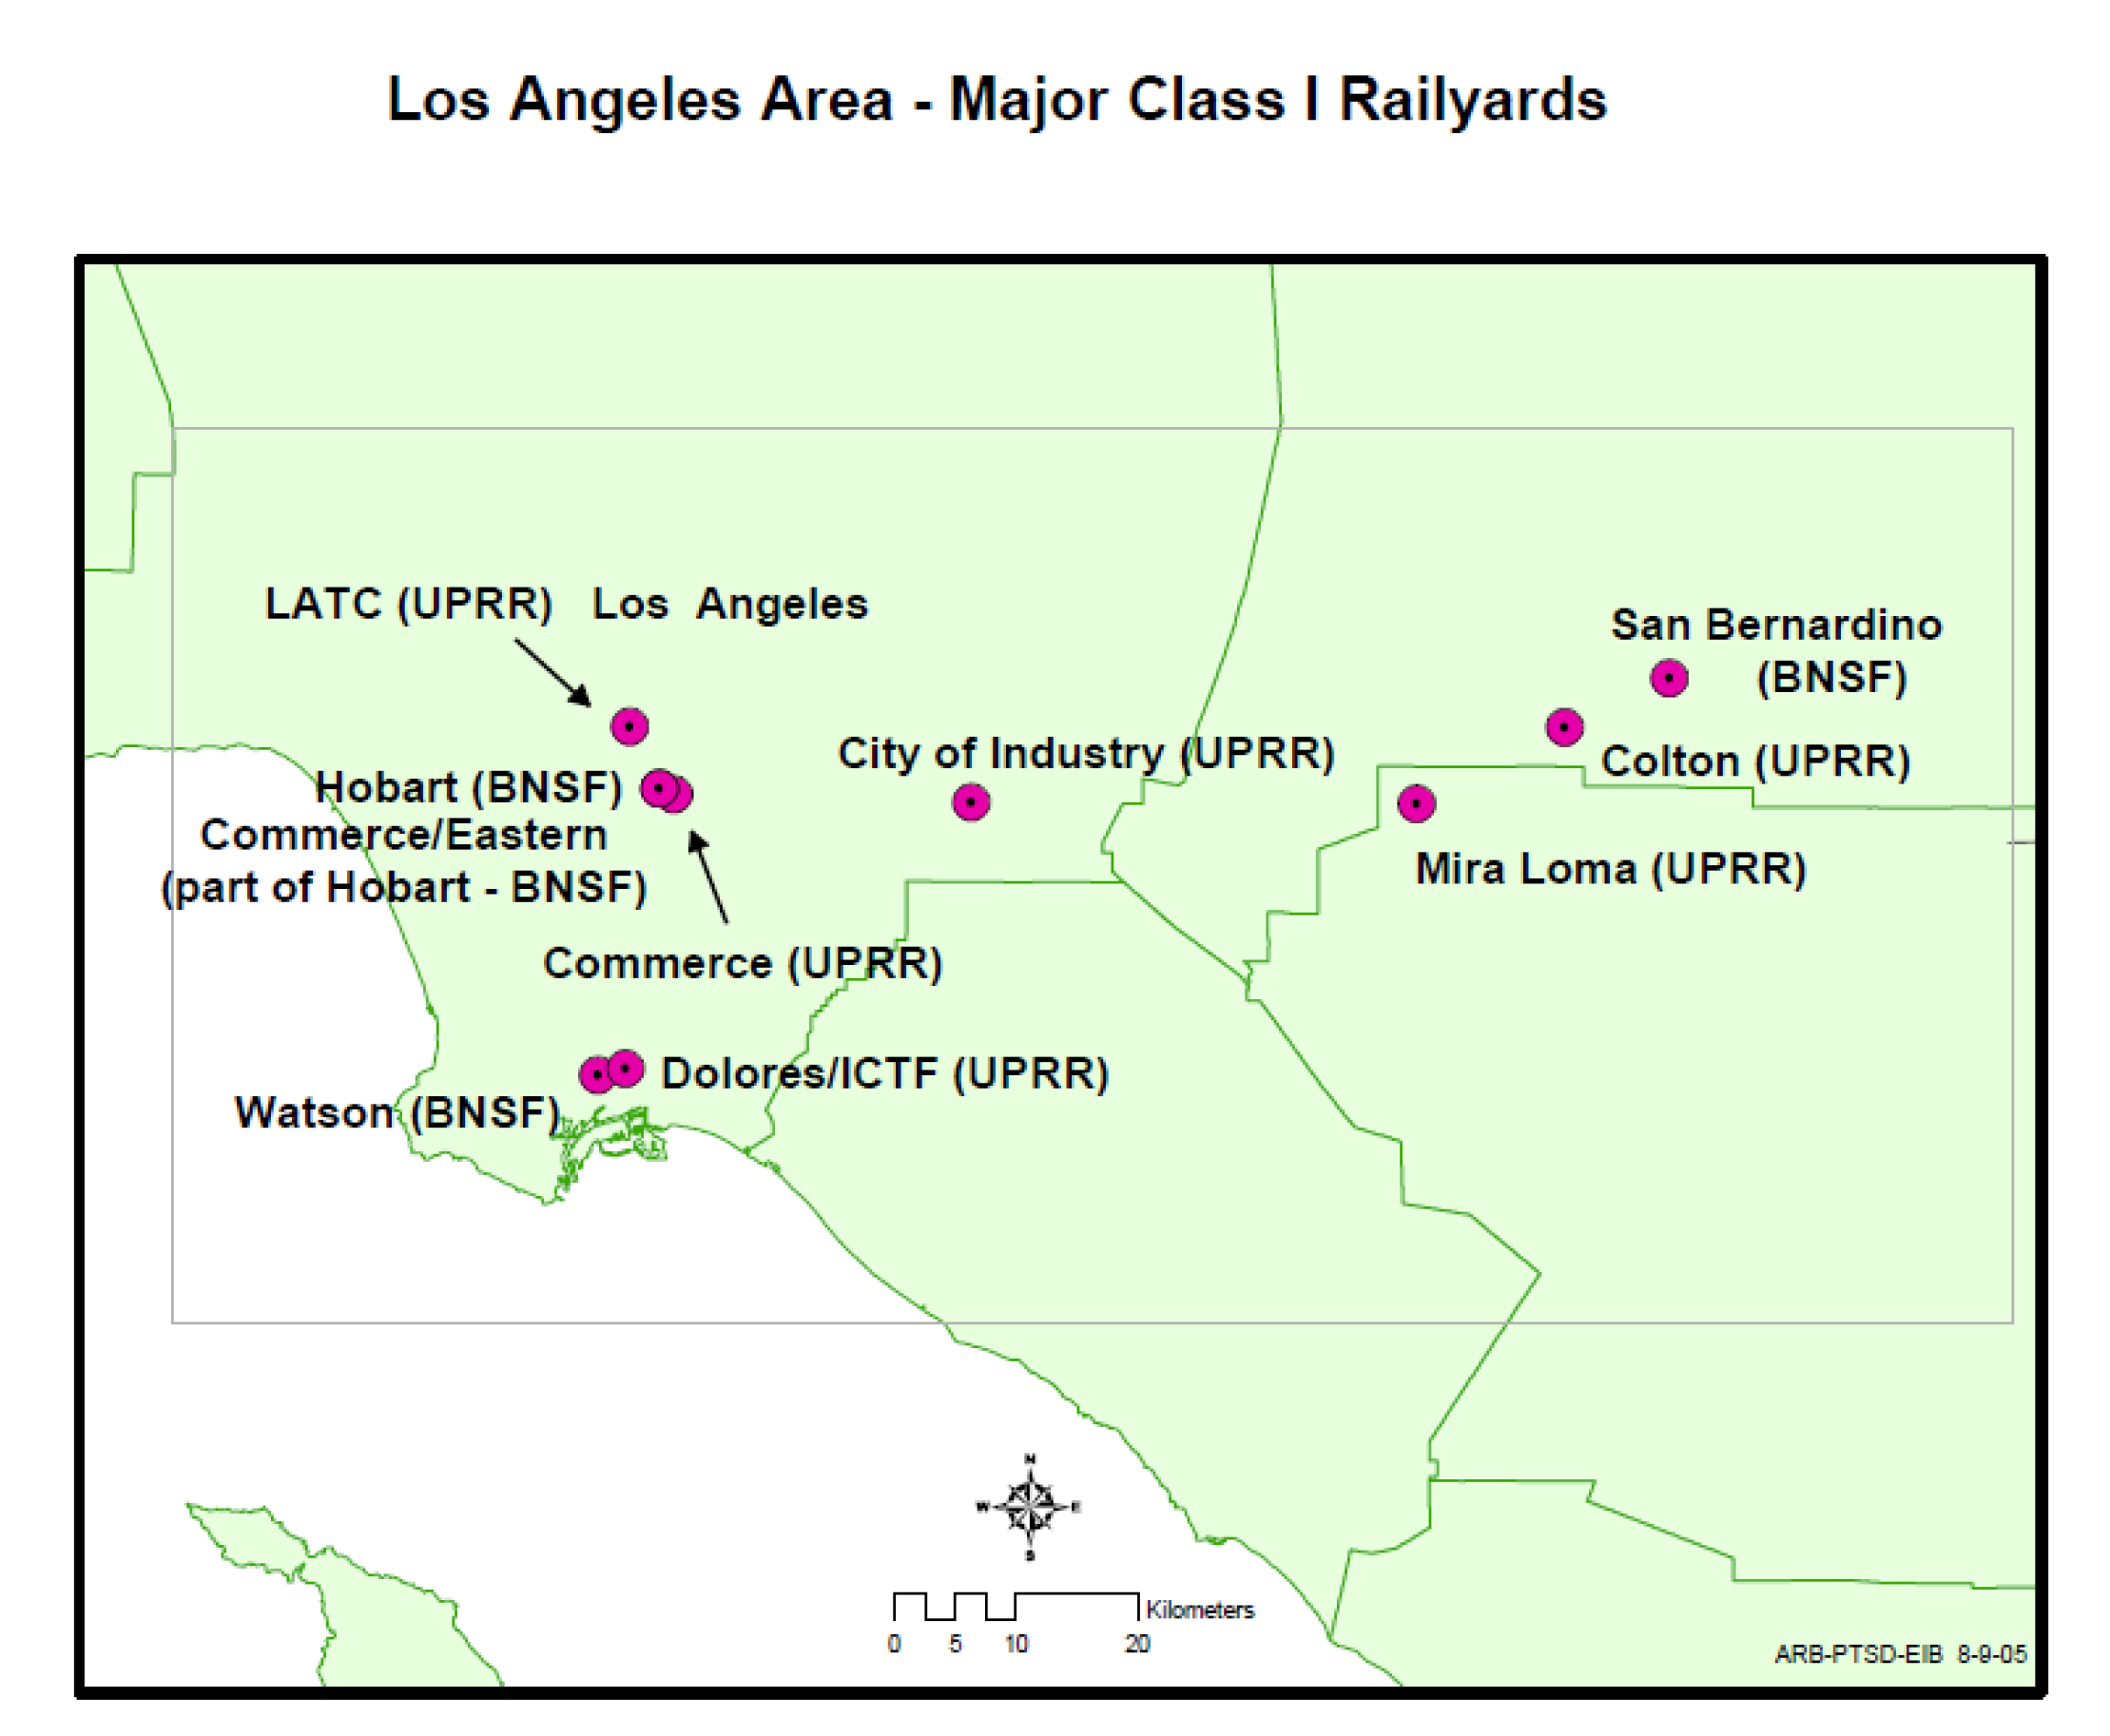
2.1. Diesel Emissions at 18 California Rail Yards
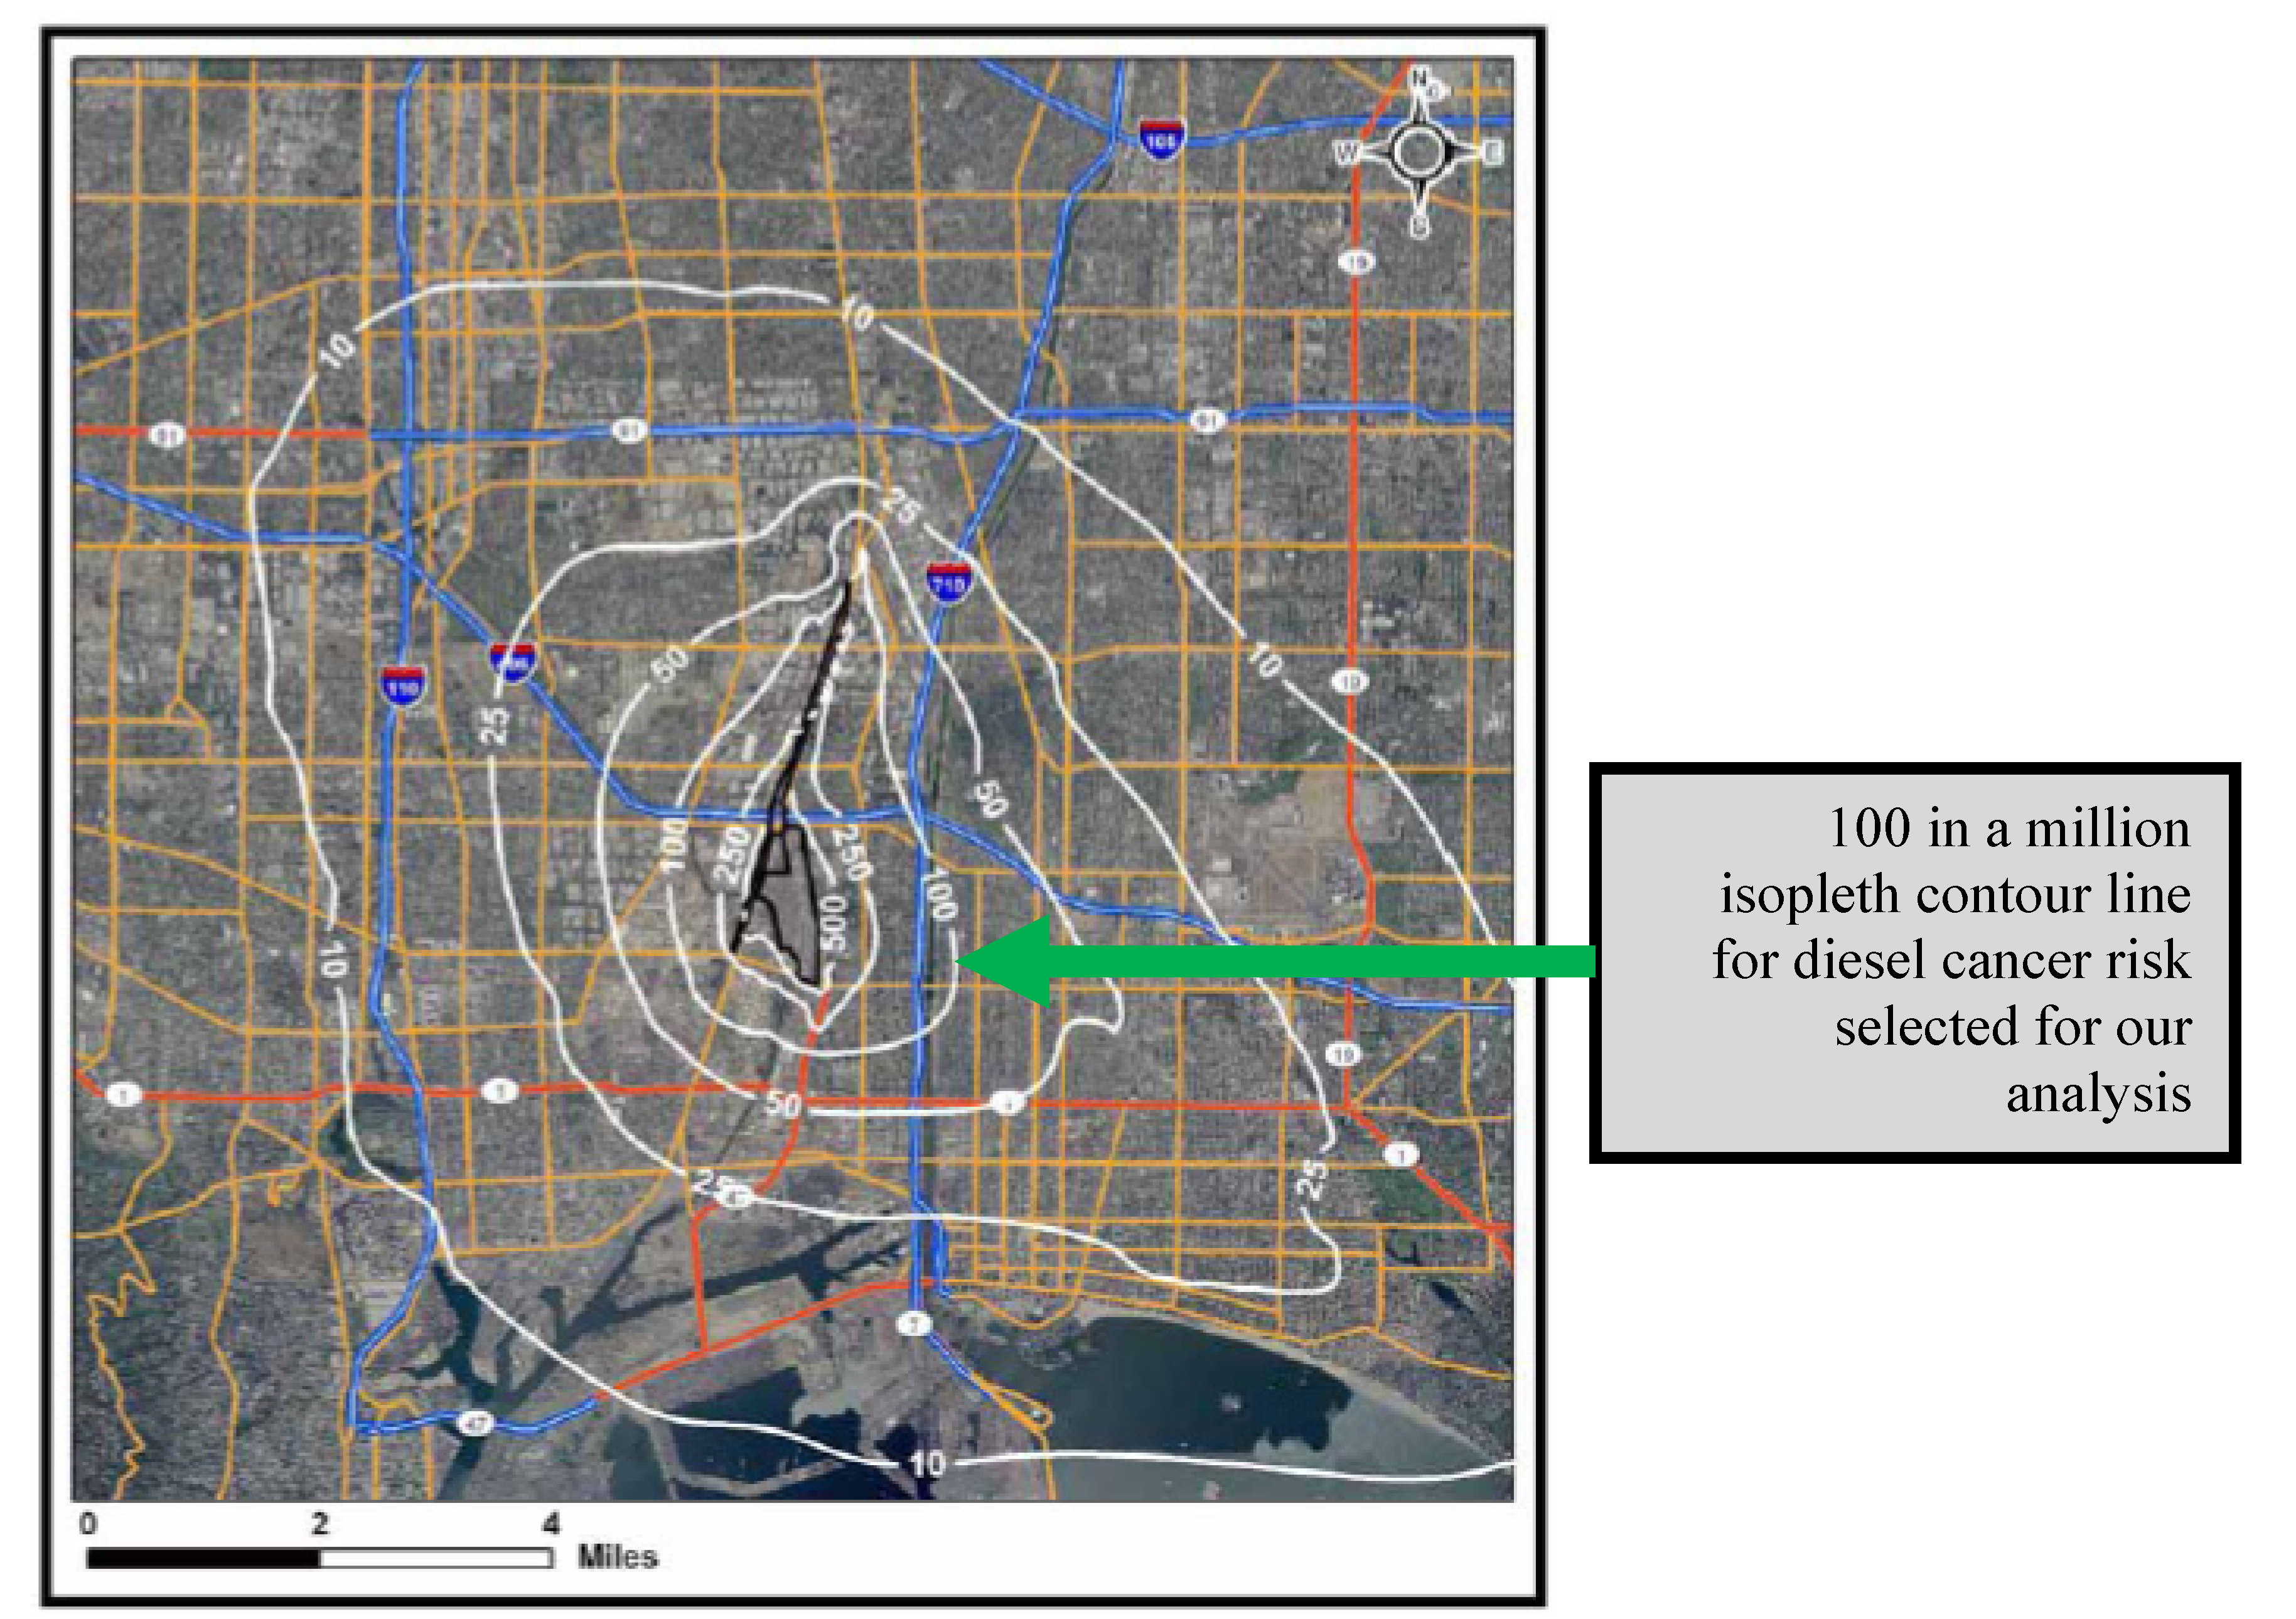
2.2. CARB’s Development of Isopleths (Contour Lines or Zones) for Diesel Cancer Risk around the Rail Yards


| Rail Yard | Locomotives | Cargo Handling Equipment | On- Road Trucks | Other (Off-Road Equipment, Transport Refrigeration Units, Stationary Sources, etc.) | Total (Tons) |
|---|---|---|---|---|---|
| Commerce: 4 yardscombined | 13.6 | 9.4 | 13.2 | 5.5 | 41.8 |
| BNSF Barstow a | 27.1 | 0.03 | 0.04 | 0.75 | 27.9 |
| UP Roseville | 25.1 | N/A | N/A | N/A | 25.1 |
| BNSF Hobart b | 5.9 | 4.2 | 10.1 | 3.7 | 23.9 |
| UP ICTF/Dolores | 9.8 | 4.4 | 7.5 | 2.0 | 23.7 |
| BNSF San Bernardino | 10.6 | 3.7 | 4.4 | 3.4 | 22.0 |
| UP Colton | 16.3 | N/A | 0.2 | 0.05 | 16.5 |
| UP Commerce b | 4.9 | 4.8 | 2.0 | 0.4 | 12.1 |
| UP Oakland | 3.9 | 2.0 | 1.9 | 3.4 | 11.2 |
| UP City of Industry | 5.9 | 2.8 | 2.0 | 0.3 | 10.9 |
| UP LATC | 3.2 | 2.7 | 1.0 | 0.5 | 7.3 |
| UP Stockton | 6.5 | N/A | 0.2 | 0.2 | 6.9 |
| UP Mira Loma | 4.4 | N/A | 0.2 | 0.2 | 4.9 |
| BNSF Richmond | 3.3 | 0.3 | 0.5 | 0.6 | 4.7 |
| BNSF Stockton | 3.6 | N/A | N/A | 0.02 | 3.6 |
| BNSF Commerce Eastern b | 0.6 | 0.4 | 1.1 | 1.0 | 3.1 |
| BNSF Sheila b | 2.2 | N/A | N/A | 0.4 | 2.7 |
| BNSF Watson | 1.9 | N/A | <0.01 | 0.04 | 1.9 |
| BNSF San Diego | 1.6 | N/A | 0.007 | 0.04 | 1.7 |
2.3. Exposed Populations (and Their Estimated Cancer Risks) near the Four Highest Priority Rail Yards in California
2.4. Proximity of Homes and Schools to the Top Four Highest Priority Rail Yards in California
- UP Commerce Rail Yard: Within two miles of this yard, there are 27 sensitive receptors, including 19 schools, four child care centers and four hospitals. Four of these sensitive receptors are within the 100 in a million cancer risk range. Homes are adjacent to the rail yard fence, and an elementary school is located less than two blocks away [45].
- BNSF Hobart Yard, Commerce: CARB looked at sensitive receptors within a two-mile distance of the yard and found 28, including eight schools, 12 child care centers and eight hospitals. Within the 100 in a million cancer risk range, there were 19 sensitive receptors identified [46].
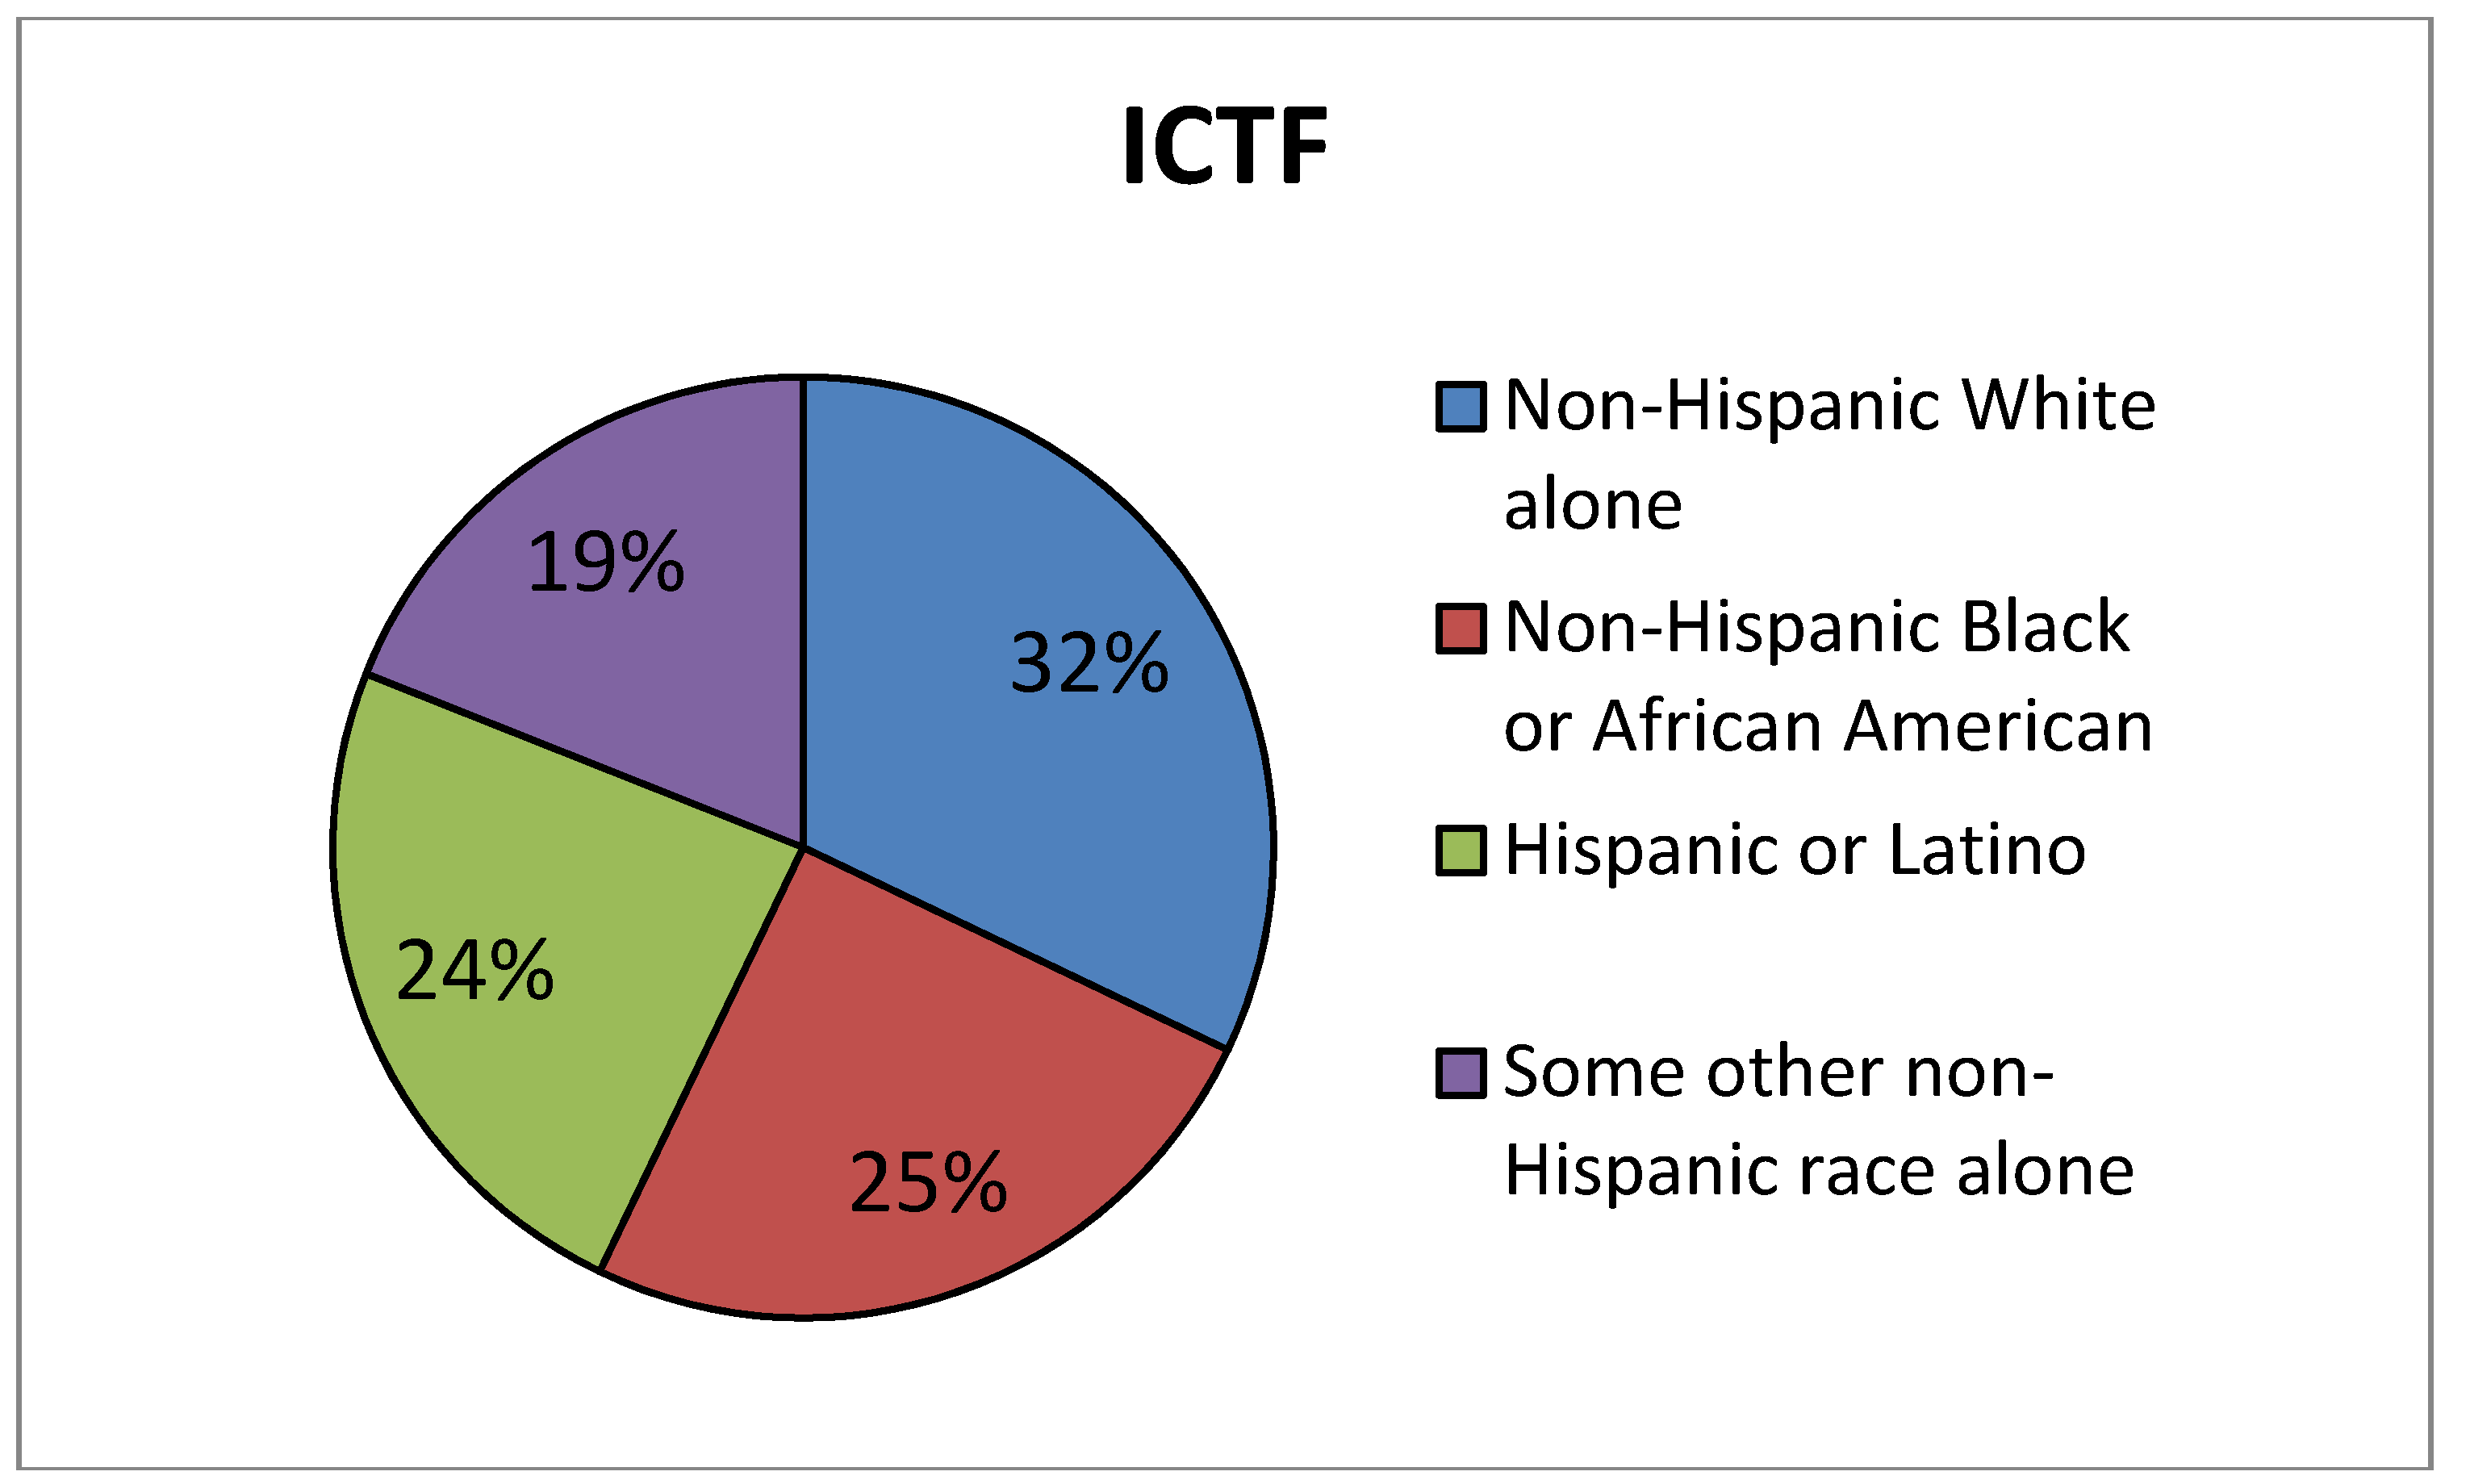
- UP ICTF, Wilmington: The UP ICTF is just 400 feet away from a middle school and homes that are located in west Long Beach, CA. There are seven sensitive receptors in the 100 in a million cancer risk range and 20 sensitive receptors all located within one mile of the rail yard [43].
- BNSF San Bernardino: Homes are located directly across the street from this yard. Within a one-mile distance of the yard, there are 41 sensitive receptors, including seven hospitals/medical centers, 19 childcare centers and 15 schools. When considering a 100 in a million cancer risk range, there are 19 sensitive receptors [39].
| Rail Yard | Estimated Population Exposed to Cancer Risk of Greater than 100 Chances in a Million | Estimated Population Exposed to Cancer Risk of Greater than 500 Chances in a Million |
|---|---|---|
| 4 yards in Commerce combined | 82,000 | 5,200 |
| BNSF, San Bernardino | 39,580 | 3,780 |
| UP ICTF, Wilmington | 33,540 | 1,200 |
| BNSF Hobart, Commerce | 48,200 | 100 |
| UP, Commerce | 12,000 | 100 |
3. Study Methods
4. Study Site
5. Results
5.1. Which Came First, Siting of the Rail Yards or the Lower-Income Minority Populations Living in the Area? A Brief Case Study


5.2. Construction of New Intermodal Facilities in the U.S. and Health/Environmental Concerns Raised by Residents
- A proposed BNSF intermodal facility in Wilmington, CA (part of the City of Los Angeles) that would be located within 1,000 feet of schools, a daycare center and a housing complex and that would bring in thousands of trucks a day to the yard, which is four miles from the local ports; emissions and truck traffic would again impact the lower-income minority community of west Long Beach. The project, called the Southern California International Gateway (BNSF SCIG) was proposed in 2005 and had several iterations of an environmental impact report (EIR) between then and its final EIR in 2013 [50]. The location of this proposed rail yard is immediately south of the UP ICTF. Community residents and others raised public health and environmental justice concerns about building another rail yard in the same vicinity as the ICTF and in close proximity to homes and schools [51,52], urging that the rail yard be sited on-dock at the industrial ports rather than adjacent to a residential community. The Long Beach Unified School District [53] and others, including public health experts, also raised concerns about both of the proposed rail yards and their proximity to schools. Although BNSF Railway argues that the new rail yard would reduce regional pollution [54], an environmental report issued by the Port of Los Angeles on the project, under the California Environmental Quality Act (CEQA) stated that the impacts of localized air pollution from the rail yard:“... would fall disproportionately on minority and low-income populations because the census block groups adjacent to the point of impact (the eastern edge of the Project site) constitute minority populations, and ... all or parts of [the adjacent] census tracts ... constitute low-income populations.”[55]
- A Norfolk Southern (NS) rail yard newly constructed in Alabama that is immediately adjacent to an elementary school [59];
- A NS rail yard that is expanding by buying homes near its yard in a Chicago community called Englewood, home to mostly African-Americans [60];
- A CSX rail yard proposed in Baltimore, Maryland, that is estimated to bring 30–40 future trucks a day through a residential community [61]; and


6. Discussion and Conclusions
7. Recommendations
- Research. Conduct more epidemiologic research on the health and community impacts of rail yard facilities on nearby communities, additional exposure assessment studies, and evaluation of zero emission technologies for locomotives, trucks and rail yard equipment.
- Best practices. Encourage the U.S. EPA to develop a best practices database for how to reduce air pollution at rail yards, including the availability of alternative technologies such as electric trucks and electric cranes, as recommended in the NEJAC Working Group report [66].
- Siting and land use.
- Whenever feasible, site rail yards servicing marine ports “on-dock” (that is, right at the marine terminals) in order to make the yards as efficient as possible and minimize the use of diesel-fueled drayage trucks.
- Require minimum distances between rail yards and schools/homes and other sensitive receptors when choosing sites for new or expanded rail yards, taking into account CARB and other land use guidelines [19].
- Environmental justice considerations.
- Require that newly proposed rail yard facilities comply with Environmental Justice (EJ) Executive Orders and the EJ requirements of the U.S. Department of Transportation, U.S. Environmental Protection Agency and any state EJ directives, as relevant [70].
- Discontinue to site rail yards in lower income, minority communities in favor of more suitable locations, including on-dock rail and purely industrial locations, in order to protect public health and uphold environmental justice principles.
- Environmental reviews.
- Require full Environmental Impact Statements under federal law or full reviews under state law, rather than simple Environmental Assessments when evaluating the impacts of major intermodal rail facilities.
- Consider conducting Health Impact Assessments of any new rail yard facilities that are within one mile of homes and schools.
- Require that all environmental reviews include a comparative demographic analysis (including race/ethnicity/income/educational attainment levels) of the neighborhoods within one mile of a proposed rail yard and the city/county as a whole and that the results of this analysis be included in the environmental statement or report.
- Require that any environmental reviews of rail yard proposals include accurate forecasts for future truck and locomotive volumes; accurate assessments of projected emissions from trucks, locomotives and yard equipment; accurate assumptions in modeling of the near-roadway air pollution exposures; and an evaluation of alternative technologies; and that new projects adhere to what was promised in the environmental review reports.
- Regulatory agencies.
- Require that regulatory agencies with responsibility for air pollution from rail yard facilities (including locomotives and other equipment) have mandatory mechanisms in place to reduce public health risks when analyses or HRAs show elevated cancer or other health risks from exposure to diesel exhaust or other pollutants.
- Update EPA’s assessment of diesel exhaust exposure’s health effects to reflect IARC’s designation of diesel exhaust as a “human carcinogen”.
Abbreviations
| BNSF | BNSF Railway Company, formerly Burlington Northern Santa Fe Railway |
| CA | California |
| CARB | California Air Resources Board |
| CSX | CSX Corporation |
| DPM | diesel particulate matter |
| EJ | environmental justice |
| HRA | Health Risk Assessment |
| IARC | International Agency for Research on Cancer |
| ICTF | intermodal container transfer facility |
| UP | Union Pacific Railroad |
| U.S. | United States |
Supplementary Files
Acknowledgments
Conflicts of Interest
References and Notes
- Some examples include: Union Pacific: Santa Teresa, New Mexico; Wilmington, California. BNSF: Memphis, Tennessee; Edgerton, Kansas; Wilmington, California. CSX: Baltimore, Maryland; North Baltimore, Ohio. Norfolk Southern: McCalla, Alabama; New Market, Tennessee; Charlotte, North Carolina; Greencastle, Pennsylvania; Prichard, West Virginia; Memphis, Tennessee. Norfolk Southern: Englewood (Chicago), Illinois; Norfolk Southern and Pan Am Railway: Upstate NY
- Hricko, A. Progress and pollution: Port cities prepare for the panama canal expansion. Environ. Health Perspect. 2012, 120, A470–A473. [Google Scholar]
- Matsuoka, M.; Hricko, A.; Gottlieb, R.; DeLara, J. Global Trade Impacts: Addressing the Health, Social and Environmental Consequences of Moving International Freight through Our Communities. 2011. Available online: http://scholar.oxy.edu/uep_faculty/411 (accessed on 15 November 2013).
- Wyss, J.; Charles, J.; Whitefield, M. Latin American ports ready for Panama Canal expansion. Miami Herald. 23 November 2012. Available online: http://www.miamiherald.com/2012/11/23/3110087/latin-american-ports-ready-for.html (accessed on 15 November 2013).
- Garshick, E.; Schenker, M.B.; Muñoz, A.; Segal, M.; Smith, T.J.; Woskie, S.R.; Hammond, S.K.; Speizer, F.E. A case-control study of lung cancer and diesel exhaust exposure in railroad workers. Am. Rev. Respir. Dis. 1987, 135, 1242–1248. [Google Scholar]
- Diesel Exhaust and Cancer. U.S. Environmental Protection Agency, Region Website. Available online: http://www.epa.gov/region1/eco/diesel/health_effects.html (accessed on 15 November 2013).
- IARC: Diesel Engine Exhaust Carcinogenic; World Health Organization: International Agency for Research on Cancer (IARC). 2012. Available online: http://www.iarc.fr/en/media-centre/pr/2012/pdfs/pr213_E.pdf (accessed on 15 November 2013).
- Vermuelen, R.; Silverman, DT.; Garshick, E.; Vlaanderen, J.; Portengen, L.; Steenland, K. Exposure-response estimates for diesel engine exhaust and lung cancer mortality based on data from three occupational cohorts. Environ Health Perspect. 2014, 122, 172–177. [Google Scholar]
- Galvis, B.; Bergin, M.; Russell, A. Fuel-based fine particulate and black carbon emission factors from a railyard area in Atlanta. J. Air Waste Manag. Assoc. 2013, 63, 648–58. [Google Scholar] [CrossRef]
- Cahill, T.A.; Cahill, T.M.; Barnes, D.E.; Spada, N.J.; Miller, R. Inorganic and organic aerosols downwind of California’s roseville railyard. Aerosol Sci. Technol. 2011, 45, 1049–1059. [Google Scholar] [CrossRef]
- Gauderman, W.J.; Vora, H.; McConnell, R.; Berhane, K.; Gilliland, F.; Thomas, D.; Lurmann, F.; Avol, E.; Kunzli, N.; Jerrett, M.; et al. Effect of exposure to traffic on lung development from 10 to 18 years of age: A cohort study. Lancet 2007, 369, 571–577. [Google Scholar] [CrossRef]
- McConnell, R.; Berhane, K.; Yao, L.; Jerrett, M.; Lurmann, F; Gilliland, F.; Künzli, N.; Gauderman, J.; Avol, E.; Thomas, D.; et al. Traffic, susceptibility, and childhood asthma. Environ. Health Perspect. 2006, 114, 766–772. [Google Scholar] [CrossRef]
- Gauderman, W.J.; Avol, E.; Lurmann, F.; Kuenzli, N.; Gilliland, F.; Peters, J.; McConnell, R. Childhood asthma and exposure to traffic and nitrogen dioxide. Epidemiology 2005, 16, 737–743. [Google Scholar] [CrossRef]
- McConnell, R.; Islam, T.; Shankardass, K.; Jerrett, M.; Lurmann, F.; Gilliland, F; Gauderman, J.; Avol, E.; Künzli, N.; Yao, L.; et al. Childhood incident asthma and traffic-related air pollution at home and school. Environ. Health Perspect. 2010, 118, 1021–1026. [Google Scholar] [CrossRef]
- Green, R.S.; Malig, B.; Windham, G.; Fenster, L.; Ostro, B.; Swan, S. Residential exposure to traffic and spontaneous abortion. Environ. Health Perspect. 2009, 117, 1939–1944. [Google Scholar] [CrossRef]
- Wu, J.; Ren, C.; Delfino, R.J.; Chung, J.; Wilhelm, M.; Ritz, B. Association between local traffic- generated air pollution and preeclampsia and preterm delivery in the South Coast air basin of California. Environ. Health Perspect. 2009, 117, 1773–1779. [Google Scholar] [CrossRef]
- Ranft, U.; Schikowski, T.; Sugiri, D.; Krutmann, J.; Krämer, U. Long-term exposure to traffic-related particulate matter impairs cognitive function in the elderly. Environ. Res. 2009, 109, 1004–1011. [Google Scholar] [CrossRef]
- Peters, A.; von Klot, S.; Mittleman, M.A.; Meisinger, C.; Hörmann, A.; Kuch, B.; Wichmann, H.E. Triggering of acute myocardial infarction by different means of transportation. Eur. J. Prev. Cardiol. 2013, 20, 750–758. [Google Scholar] [CrossRef]
- Air Quality and Land Use Handbook: A Community Health Perspective; California Environmental Protection Agency, 2005. Available online: http://www.arb.ca.gov/ch/handbook.pdf (accessed on 15 November 2013).
- The Modesta Avila Coalition. 2005. Available online: http://www.arb.ca.gov/gmp/p2comments/set2/modesta_avila_coalition.pdf (accessed on 15 November 2013).
- Statewide Rail Agreement. California Air Resources Board. Signed 2005. Available online: http://www.arb.ca.gov/railyard/ryagreement/ryagreement.htm (accessed on 15 November 2013).
- Railyard Health Risk Assessments and Mitigation Measures; California Air Resources Board. Completed 2006–2008. Available online: http://www.arb.ca.gov/railyard/hra/hra.htm (accessed on 15 November 2013).
- Trade, Health, Environment: Making the Case for Change. THE Impact Project, 2009. Available online: http://hydra.usc.edu/scehsc/web/index.html (accessed on 15 November 2013). Note: The Community Outreach and Engagement Program (COEP) of the Southern California Environmental Health Science Center, based at Keck School of Medicine of University of Southern CA, is one of two academic partners in this community/academic collaborative. Author Andrea Hricko directs the COEP. Author Angelo Logan, director of East Yard Communities for Environmental Justice, is a community partner in the collaborative. All of THE Impact Project partners have publicly participated in responding to requests for verbal and written comments on the public health impacts that might result from various proposed rail yard projects by the Ports of Los Angeles, Long Beach and an entity called the Joint Powers Authority .
- Garcia, A.P.; Wallerstein, N.; Hricko, A.; Marquez, J.N.; Logan, A.; Nasser, E.G.; Minkler, M. THE (Trade, Health, Environment) Impact Project: A community-based participatory research environmental justice case study. Environ. Justice 2013, 6, 17–26. [Google Scholar] [CrossRef]
- Minkler, M.; Garcia, A.P.; Rubin, V.; Wallerstein, N. Community-Based Participatory Research: A Strategy for Building Healthy Communities and Promoting Health through Policy Change; PolicyLink, 2012. Available online: http://www.policylink.org/atf/cf/%7B97C6D565-BB43-406D-A6D5-ECA3BBF35AF0%7D/CBPR.pdf (accessed on 15 November 2013).
- Sorba, M.J. California Group Protests BNSF Rail Yard Pollution. 20 April 2010. Available online: http://www.ble-t.org/pr/news/headline.asp?id=29990 (accessed on 15 November 2013).
- The Need for Locomotive and Rail Yard Regulations; East Yard Communities for Environmental Justice, 2009. Available online: http://eycej.org/wp-content/uploads/2012/09/FS_LocomotiveRY.pdf (accessed on 15 November 2013).
- Environmental Justice Website. U.S. Environmental Protection Agency. Available online: http://www.epa.gov/environmentaljustice(accessed (accessed on 15 November 2013).
- Wing, S.; Cole, D.; Grant, G. Environmental injustice in North Carolina’s hog industry. Environ. Health Perspect. 2000, 108, 225–231. [Google Scholar] [CrossRef]
- Miranda, M.L.; Edwards, S.E.; Keating, M.H.; Paul, C.J. Making theenvironmental justicegrade: The relative burden of airpollution exposure in the United States. Int. J. Environ. Res. Public Health 2011, 8, 1755–1771. [Google Scholar]
- Wilson, S.M.; Fraser-Rahim, H.; Williams, E.; Zhang, H.; Rice, L.; Svendsen, E.; Abara, W. Assessment of the distribution of toxic release inventory facilities in metropolitan Charleston: Anenvironmental justicecase study. Am. J. Public Health 2012, 102, 1974–80. [Google Scholar] [CrossRef]
- Morello-Frosch, R.; Pastor, K., Jr.; Porras, C.; Sadd, J. Environmental justice and regional inequality in southern California: Implications for future research. Environ. Health Perspect. 2002, 110, 149–154. [Google Scholar] [CrossRef]
- Balazs, C.L.; Morello-Frosch, R.; Hubbard, A.E.; Ray, I. Environmental justice implications of arsenic contamination in California’s San Joaquin Valley: A cross-sectional, cluster-design examining exposure and compliance in community drinking water systems. Environ. Health 2012, 11, 84. [Google Scholar] [CrossRef]
- Romley, J.A.; Cohen, D.; Ringel, J.; Sturm, R. Alcoholandenvironmental justice: The density of liquor stores and bars in urban neighborhoods in the United States. J. Stud. Alcohol Drugs 2007, 68, 48–55. [Google Scholar]
- Age, Income, and Racial/Ethnic Composition of Populations Exposed to DPM in the Vicinity of Rail Yards and Terminals, U.S. Environmental Protection Agency, 2003. Available online: http://hydra.usc.edu/scehsc/web/resources/Map/Railyards/EPA-HQ-OAR-2003-0190-0752.8.pdf (accessed on 15 November 2013).
- California Air Resources Board. Rail Emission Reduction Program. Available online: http://www.arb.ca.gov/railyard/railyard.htm (accessed on 15 November 2013).
- ARB Health Risk Assessment Guidance for Rail Yard and Intermodal Facilities; California Air Resources Board, 2006. Available online: http://www.arb.ca.gov/railyard/hra/1107hra_guideline.pdf (accessed on 15 November 2013).
- Air Dispersion Modeling in Risk Assessment: Overview. Technical Support Document for Exposure Assessment and Stochastic Analysis. Chapter 2. Available online: http://www.oehha.ca.gov/air/hot_spots/pdf/2012tsd/Chapter2_2012.pdf (accessed on 10 September 2012).
- Health Risk Assessment for the BNSF Railway San Bernardino Railyard, Table II-1; California Air Resources Board, 2008. Available online: http://www.arb.ca.gov/railyard/hra/bnsf_sb_final.pdf (accessed on 15 November 2013).
- Health Risk Assessment for the Four Commerce Railyards; California Air Resources Board, 2007. Available online: http://www.arb.ca.gov/railyard/hra/4com_hra.pdf (accessed on 25 July 2013).
- California Air Resources Board. Update on the Implementation of the 2005 ARB/Railroad Statewide Agreement. 2006. Available online: http://www.arb.ca.gov/railyard/ryagreement/072006rpt.pdf (accessed on 2 December 2013).
- California Air Resources Board. Sustainable Freight Transport Initiative. 2014. Available online: http://www.arb.ca.gov/gmp/sfti/sfti.htm (accessed on 1 February 2014).
- Health Risk Assessment for the UP Intermodal Container Transfer Facility (ICTF) and Dolores Railyards (Wilmington); California Air Resources Board, 2008. Available online: http://www.arb.ca.gov/railyard/hra/up_ictf_hra.pdf (accessed on 15 November 2013).
- Commitments to Further Reduce Diesel PM Emissions at Four High Priority Railyards; California Air Resources Board, 2010. Available online: http://www.arb.ca.gov/railyard/commitments/commitments.htm (accessed on 15 November 2013).
- Health Risk Assessment for the Union Pacific Railroad Commerce Railyard; California Air Resources Board, 2007. Available online: http://www.arb.ca.gov/railyard/hra/up_com_hra.pdf (accessed on 15 November 2013).
- Health Risk Assessment for BNSF Hobart Yard (Commerce); California Air Resources Board, 2008. (accessed on 15 November 2013).
- Ethington, P.J.; Koistra, A.; DeYoung, E. Los Angeles County Union Census Tract Data Series, 1940–1990. University of Southern California User’s Guide, 2000. Available online: http://www.usc.edu/dept/LAS/history/historylab/LAPUHK/Maps/Animated_Census/Data_Set/V101_USERS_GUIDE_2.htm (accessed on 15 November 2013).
- Draft and Final Environmental Impact Reports for the ICTF. Los Angeles Harbor Department and Long Beach Harbor Department. 1982-1986. Available online: http://www.ictf-jpa.org/document_library.php (accessed on 15 November 2013).
- The Intermodal Container Transfer Facility (ICTF) Joint Powers Authority (JPA) website. Available online: http://www.ictf-jpa.org/ (accessed on 15 November 2013).
- Final Environmental Impact Report, BNSF Southern California International Gateway. Available online: http://www.portoflosangeles.org/EIR/SCIG/FEIR/feir_scig.asp (accessed on 15 November 2013).
- Schoch, D. Proposed Rail Yard Angers Residents of Nearby Long Beach Community. Foes Say Diesel-Spewing Trucks Carrying Cargo to the Site Would Worsen Air Pollution. Railway Promises a “Green” Facility. Los Angeles Times. 6 October 2005. Available online: http://articles.latimes.com/2005/oct/06/local/me-rail6 (accessed on 15 November 2013).
- Wyenn, M. Natural Resources Defense Council Switchboard Staff Blog. Community Members Speak out against BNSF’s Proposed Los Angeles-area SCIG Rail Yard. 19 October 2012. Available online: http://switchboard.nrdc.org/blogs/mwyenn/community_members_speak_out_ag.html (accessed on 15 November 2013).
- Matsumoto, C.M. Public Comment Letter to the Joint Powers Authority of the Union Pacific ICTF; Long Beach Unified School District (LBUSD), 2009. Available online: http://www.ictf-jpa.org/publiccomment/Letters/LBUSD-022309.pdf (accessed on 15 November 2013). Note: The LBUSD is alsoa plaintiff in a lawsuit against the Port of Los Angeles and City of Los Angeles on the BNSF SCIG .
- BNSF Connects. A Website Devoted to the BNSF SCIG. Available online: http://www.bnsfconnects.com/content/home (accessed on 15 November 2013).
- Recirculated Draft Environmental Impact Report on the BNSF Southern California International Gateway. Chapters 3, 4 and 6. September 2012. Available online: http://www.portoflosangeles.org/EIR/SCIG/RDEIR/rdeir_scig.asp (accessed on 15 November 2013).
- Weikel, D. Controversial Port Rail Yard Wins Approval of L.A. City Council. Governing. 9 May 2013. Available online: http://www.governing.com/news/local/mct-new-railyard-wins-approval-of-la-city-council.html (accessed on 15 November 2013).
- Pacific Maritime Online. Three More Groups Sue over SCIG Project. Available online: http://www.pmmonlinenews.com/2013/06/three-more-groups-sue-over-scig-project.html (accessed on 15 November 2013).
- Peterson, M. Environmentalists, City of Long Beach, Air Regulators All File CEQA Challenges to Proposed Rail Transfer Yard. KPCC-FM. 8 June 2013. Available online: http://www.scpr.org/blogs/environment/2013/06/08/13931/environmentalists-city-of-long-beach-air-regulator (accessed on 15 November 2013). Note: East Yard Communities for Environmental Justice, Directed by Angelo Logan, is One of the Plaintiffs in the Case.
- Norfolk Southern Railway Company. Birmingham Regional Intermodal Facility, Undated. Available online: http://www.thefutureneedsus.com/images/uploads/BHamFactSheet_Proof_1.pdf (accessed on 13 November 2013).
- Brozdowski, J. Containing an Expansion. South Side Weekly. 9 October 2013. Available online: http://southsideweekly.com/containing-an-expansion/ (accessed on 15 November 2013).
- Shen, F. Small Community in the Path of Rail Project with Big Political Momentum. Available online: http://www.baltimorebrew.com/2013/09/20/small-community-in-the-path-of-rail-project-with-big-political-momentum/ (accessed on 15 November 2013).
- Jefferson County Tomorrow Retains Hurley Law Firm. Jefferson County Post. 27 May 2013. Available online: http://jeffersoncountypost.com/?p=9653 (accessed on 15 November 2013).
- McGoldrick, J. No freight intermodal. Available online: http://www.streetcorner.com.au/news/showPost.cfm?bid=20614&mycomm=WCwww.nointermodal.com (accessed on 15 November 2013).
- ICF International. Estimation of diesel particulate matter concentration isopleths for marine harbor areas and rail yards: Appendix H, Memorandum to EPA under Work Assignment Number 03, Contract Number EPC06094, September 2007. Memo available in Docket EPA-HQ-OAR-20030190.
- Age, Income, and Racial/Ethnic Composition of Populations Exposed to DPM in the Vicinity of Rail Yards and Terminals; U.S. Environmental Protection Agency. EPA-HQ-OAR-2003-0190-0752.8. 2003. Available online: http://hydra.usc.edu/scehsc/web/resources/Map/Railyards/EPA-HQ-OAR-2003-0190-0752.8.pdf (accessed on 15 November 2013).
- Reducing Air Emissions Associated With Goods Movement: Working Towards Environmental Justice (PDF), November 2009; EPA Response to Recommendations of the Goods Movement Work Group of the National Environmental Justice Advisory Council, July 2010. Available online: http://www.epa.gov/compliance/ej/nejac/recommendations.html (accessed on 15 November 2013). Note: Authors Andrea Hricko and Angelo Logan were U.S. EPA appointees to this Goods Movement Work Group .
- EPA Needs to Improve Its Efforts to Reduce Air Emissions at U.S. Ports. 23 March 2009. Available online: http://www.epa.gov/oig/reports/2009/20090323-09-P-0125.pdf (accessed on 15 November 2013).
- Cole, B.L.; Fielding, J.E. Health impact assessment: A tool to help policy makers understand health beyond health care. Annu. Rev. Public Health 2007, 28, 393–412. [Google Scholar] [CrossRef]
- National Center for Healthy Housing. Baltimore-Washington Rail Intermodal Facility Health Impact Assessment. 2013. Available online: http://www.nchh.org/Policy/HealthImpactAssessment/BaltimoreWashingtonRailIntermodalFacilityHIA.aspx (accessed on 15 November 2013).
- EPA Insight Policy Paper: Executive Order #12898 on Environmental Justice. Citing “Executive Order on Federal Actions to Address Environmental Justice in Minority Populations and Low-Income Populations”—February 11, 1994 by President Clinton. Available online: http://www.epa.gov/fedfac/documents/executive_order_12898.htm (accessed on 15 November 2013).
- Vivar, J.; Vallianotos, M. The Impact Project Policy Brief Series. January 2012. Available online: http://hydra.usc.edu/scehsc/pdfs/Rail%20issue%20brief.%20January%202012.pdf (accessed on 15 November 2013).
© 2014 by the authors; licensee MDPI, Basel, Switzerland. This article is an open access article distributed under the terms and conditions of the Creative Commons Attribution license (http://creativecommons.org/licenses/by/3.0/).
Share and Cite
Hricko, A.; Rowland, G.; Eckel, S.; Logan, A.; Taher, M.; Wilson, J. Global Trade, Local Impacts: Lessons from California on Health Impacts and Environmental Justice Concerns for Residents Living near Freight Rail Yards. Int. J. Environ. Res. Public Health 2014, 11, 1914-1941. https://doi.org/10.3390/ijerph110201914
Hricko A, Rowland G, Eckel S, Logan A, Taher M, Wilson J. Global Trade, Local Impacts: Lessons from California on Health Impacts and Environmental Justice Concerns for Residents Living near Freight Rail Yards. International Journal of Environmental Research and Public Health. 2014; 11(2):1914-1941. https://doi.org/10.3390/ijerph110201914
Chicago/Turabian StyleHricko, Andrea, Glovioell Rowland, Sandrah Eckel, Angelo Logan, Maryam Taher, and John Wilson. 2014. "Global Trade, Local Impacts: Lessons from California on Health Impacts and Environmental Justice Concerns for Residents Living near Freight Rail Yards" International Journal of Environmental Research and Public Health 11, no. 2: 1914-1941. https://doi.org/10.3390/ijerph110201914
APA StyleHricko, A., Rowland, G., Eckel, S., Logan, A., Taher, M., & Wilson, J. (2014). Global Trade, Local Impacts: Lessons from California on Health Impacts and Environmental Justice Concerns for Residents Living near Freight Rail Yards. International Journal of Environmental Research and Public Health, 11(2), 1914-1941. https://doi.org/10.3390/ijerph110201914