Perceived Adverse Health Effects of Heat and Their Determinants in Deprived Neighbourhoods: A Cross-Sectional Survey of Nine Cities in Canada

Abstract
:
1. Introduction
2. Experimental Section
2.1. Population Studied and Sample
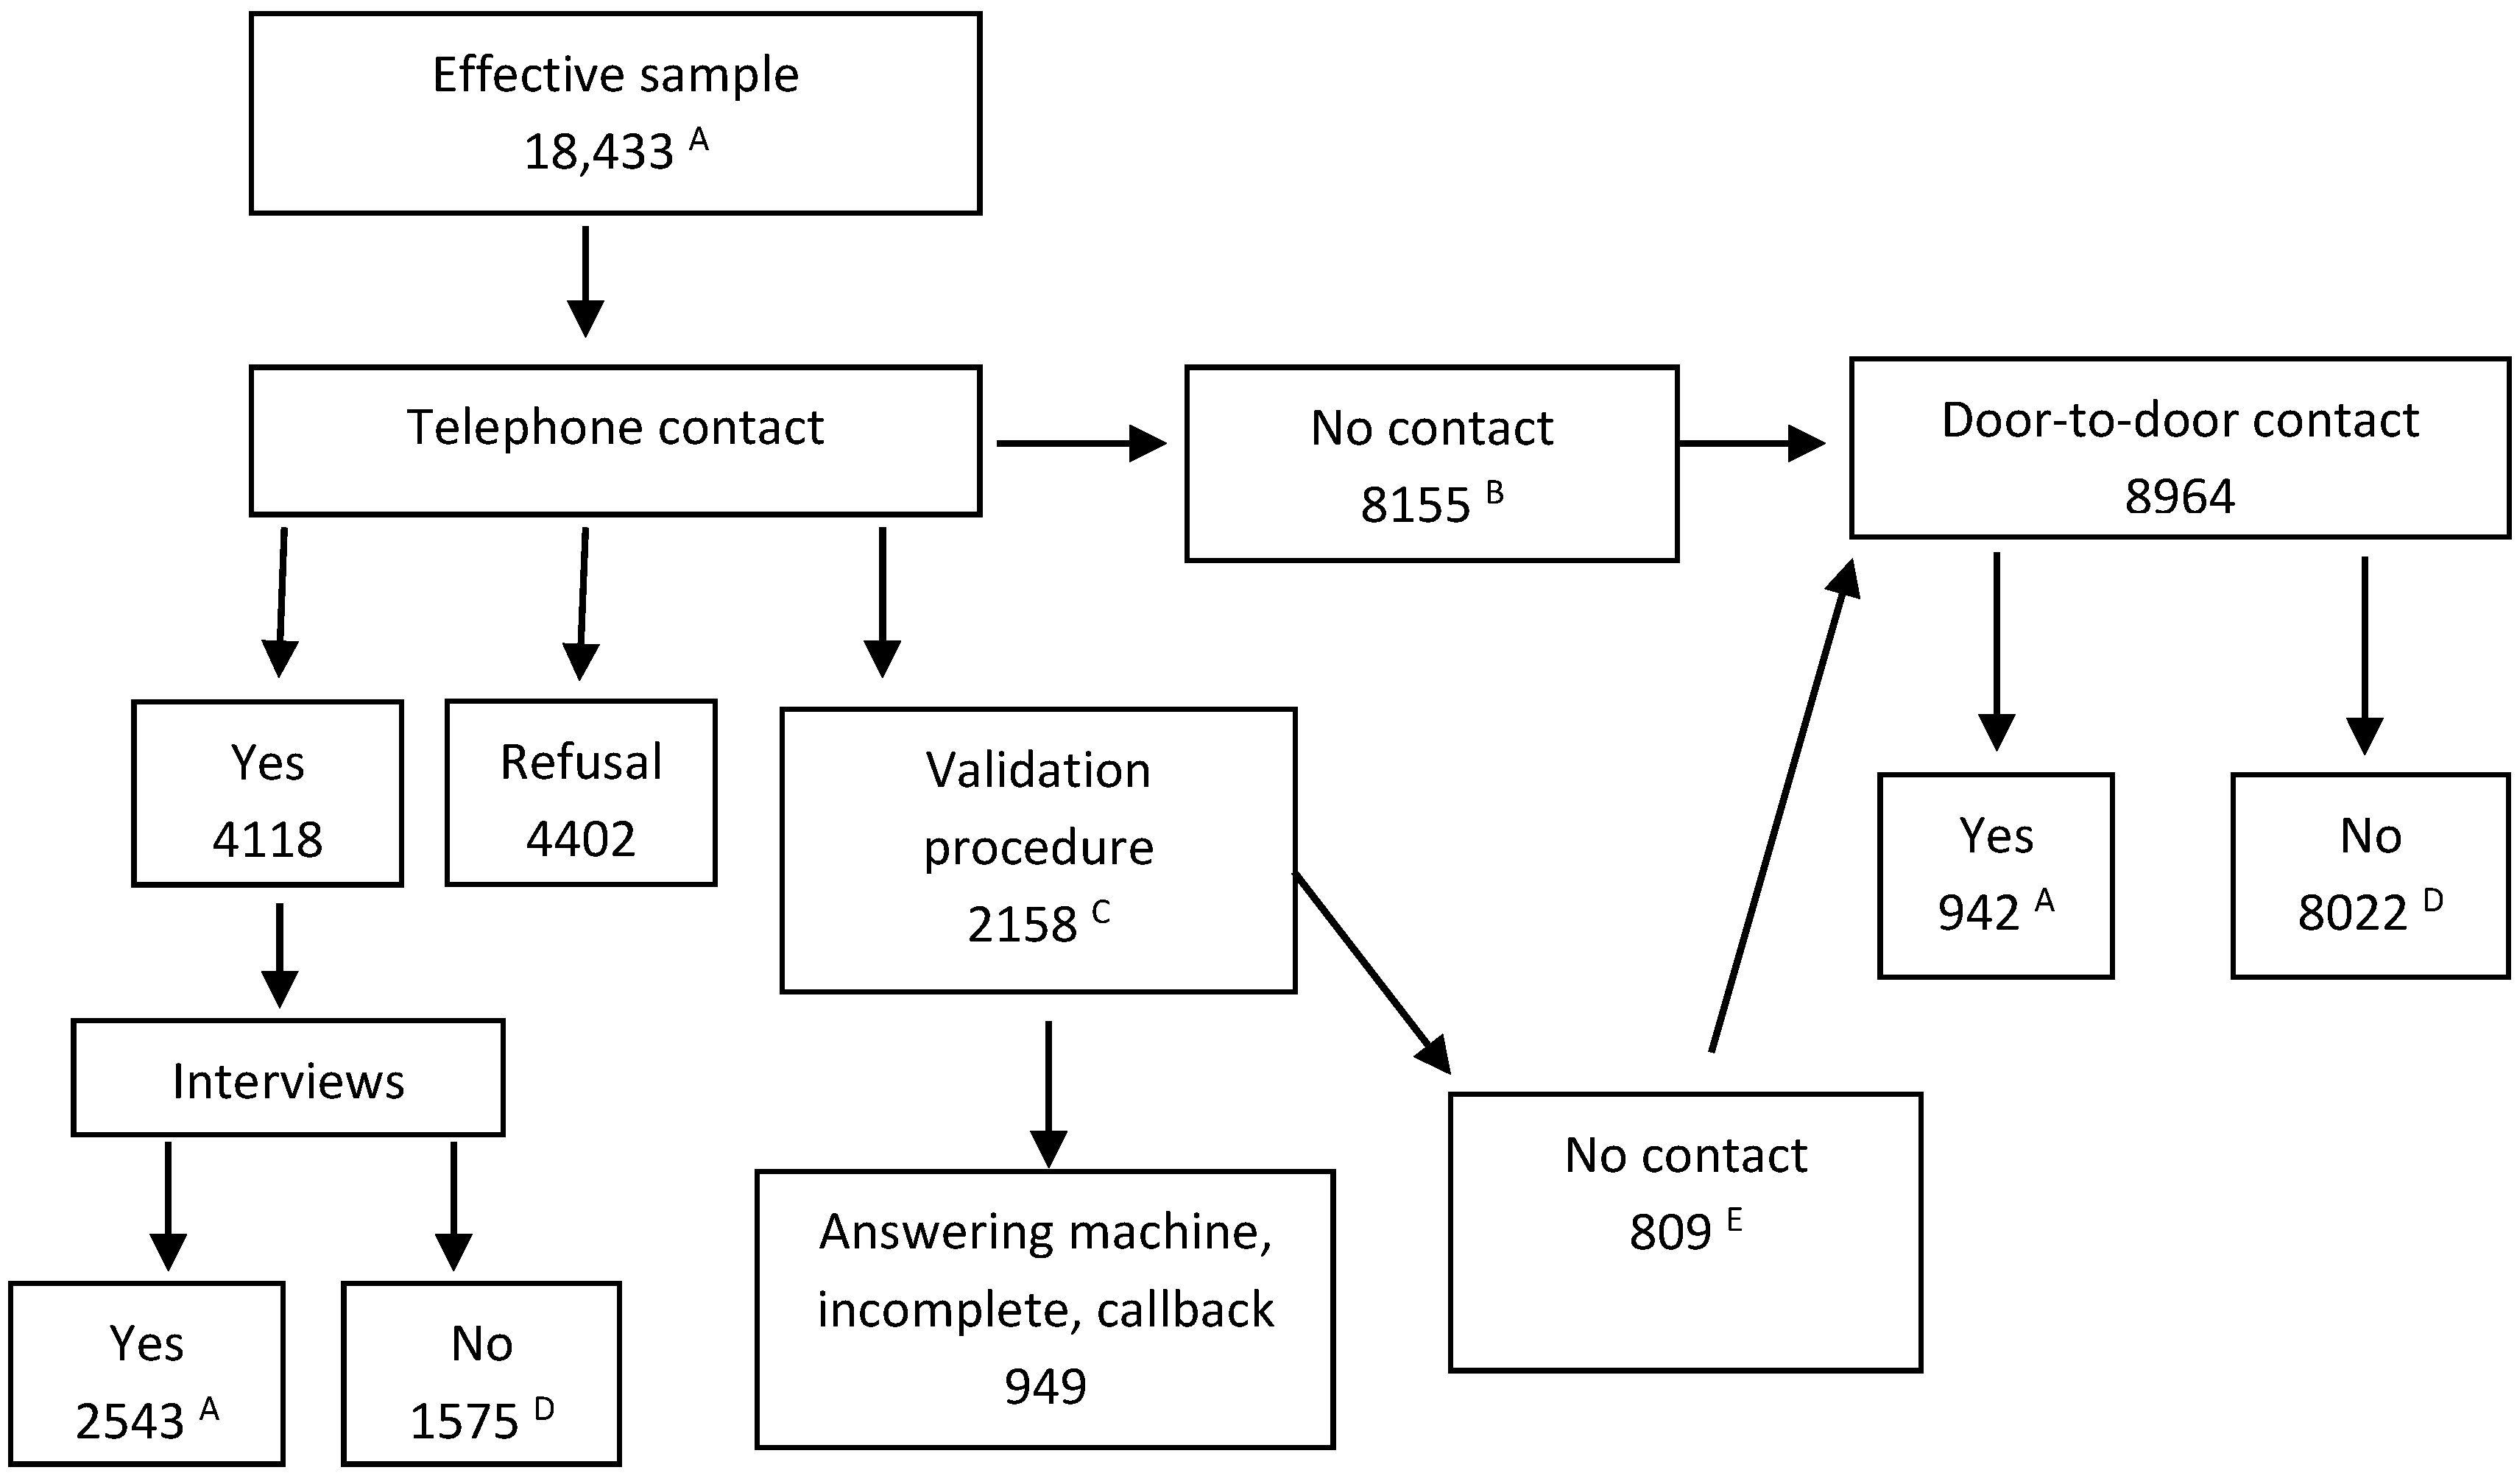
2.2. Participant Recruitment
2.3. Dependent Variable
2.4. Independent Variables
2.5. Data Collection
2.6. Statistical Analyses
3. Results and Discussion
3.1. Bivariate Analyses
3.1.1. Sociodemographic and Sociocultural Characteristics

| Variables | % A (CI) B | P C (CI) B | OR D (CI) B | Pr > Chi-2 |
|---|---|---|---|---|
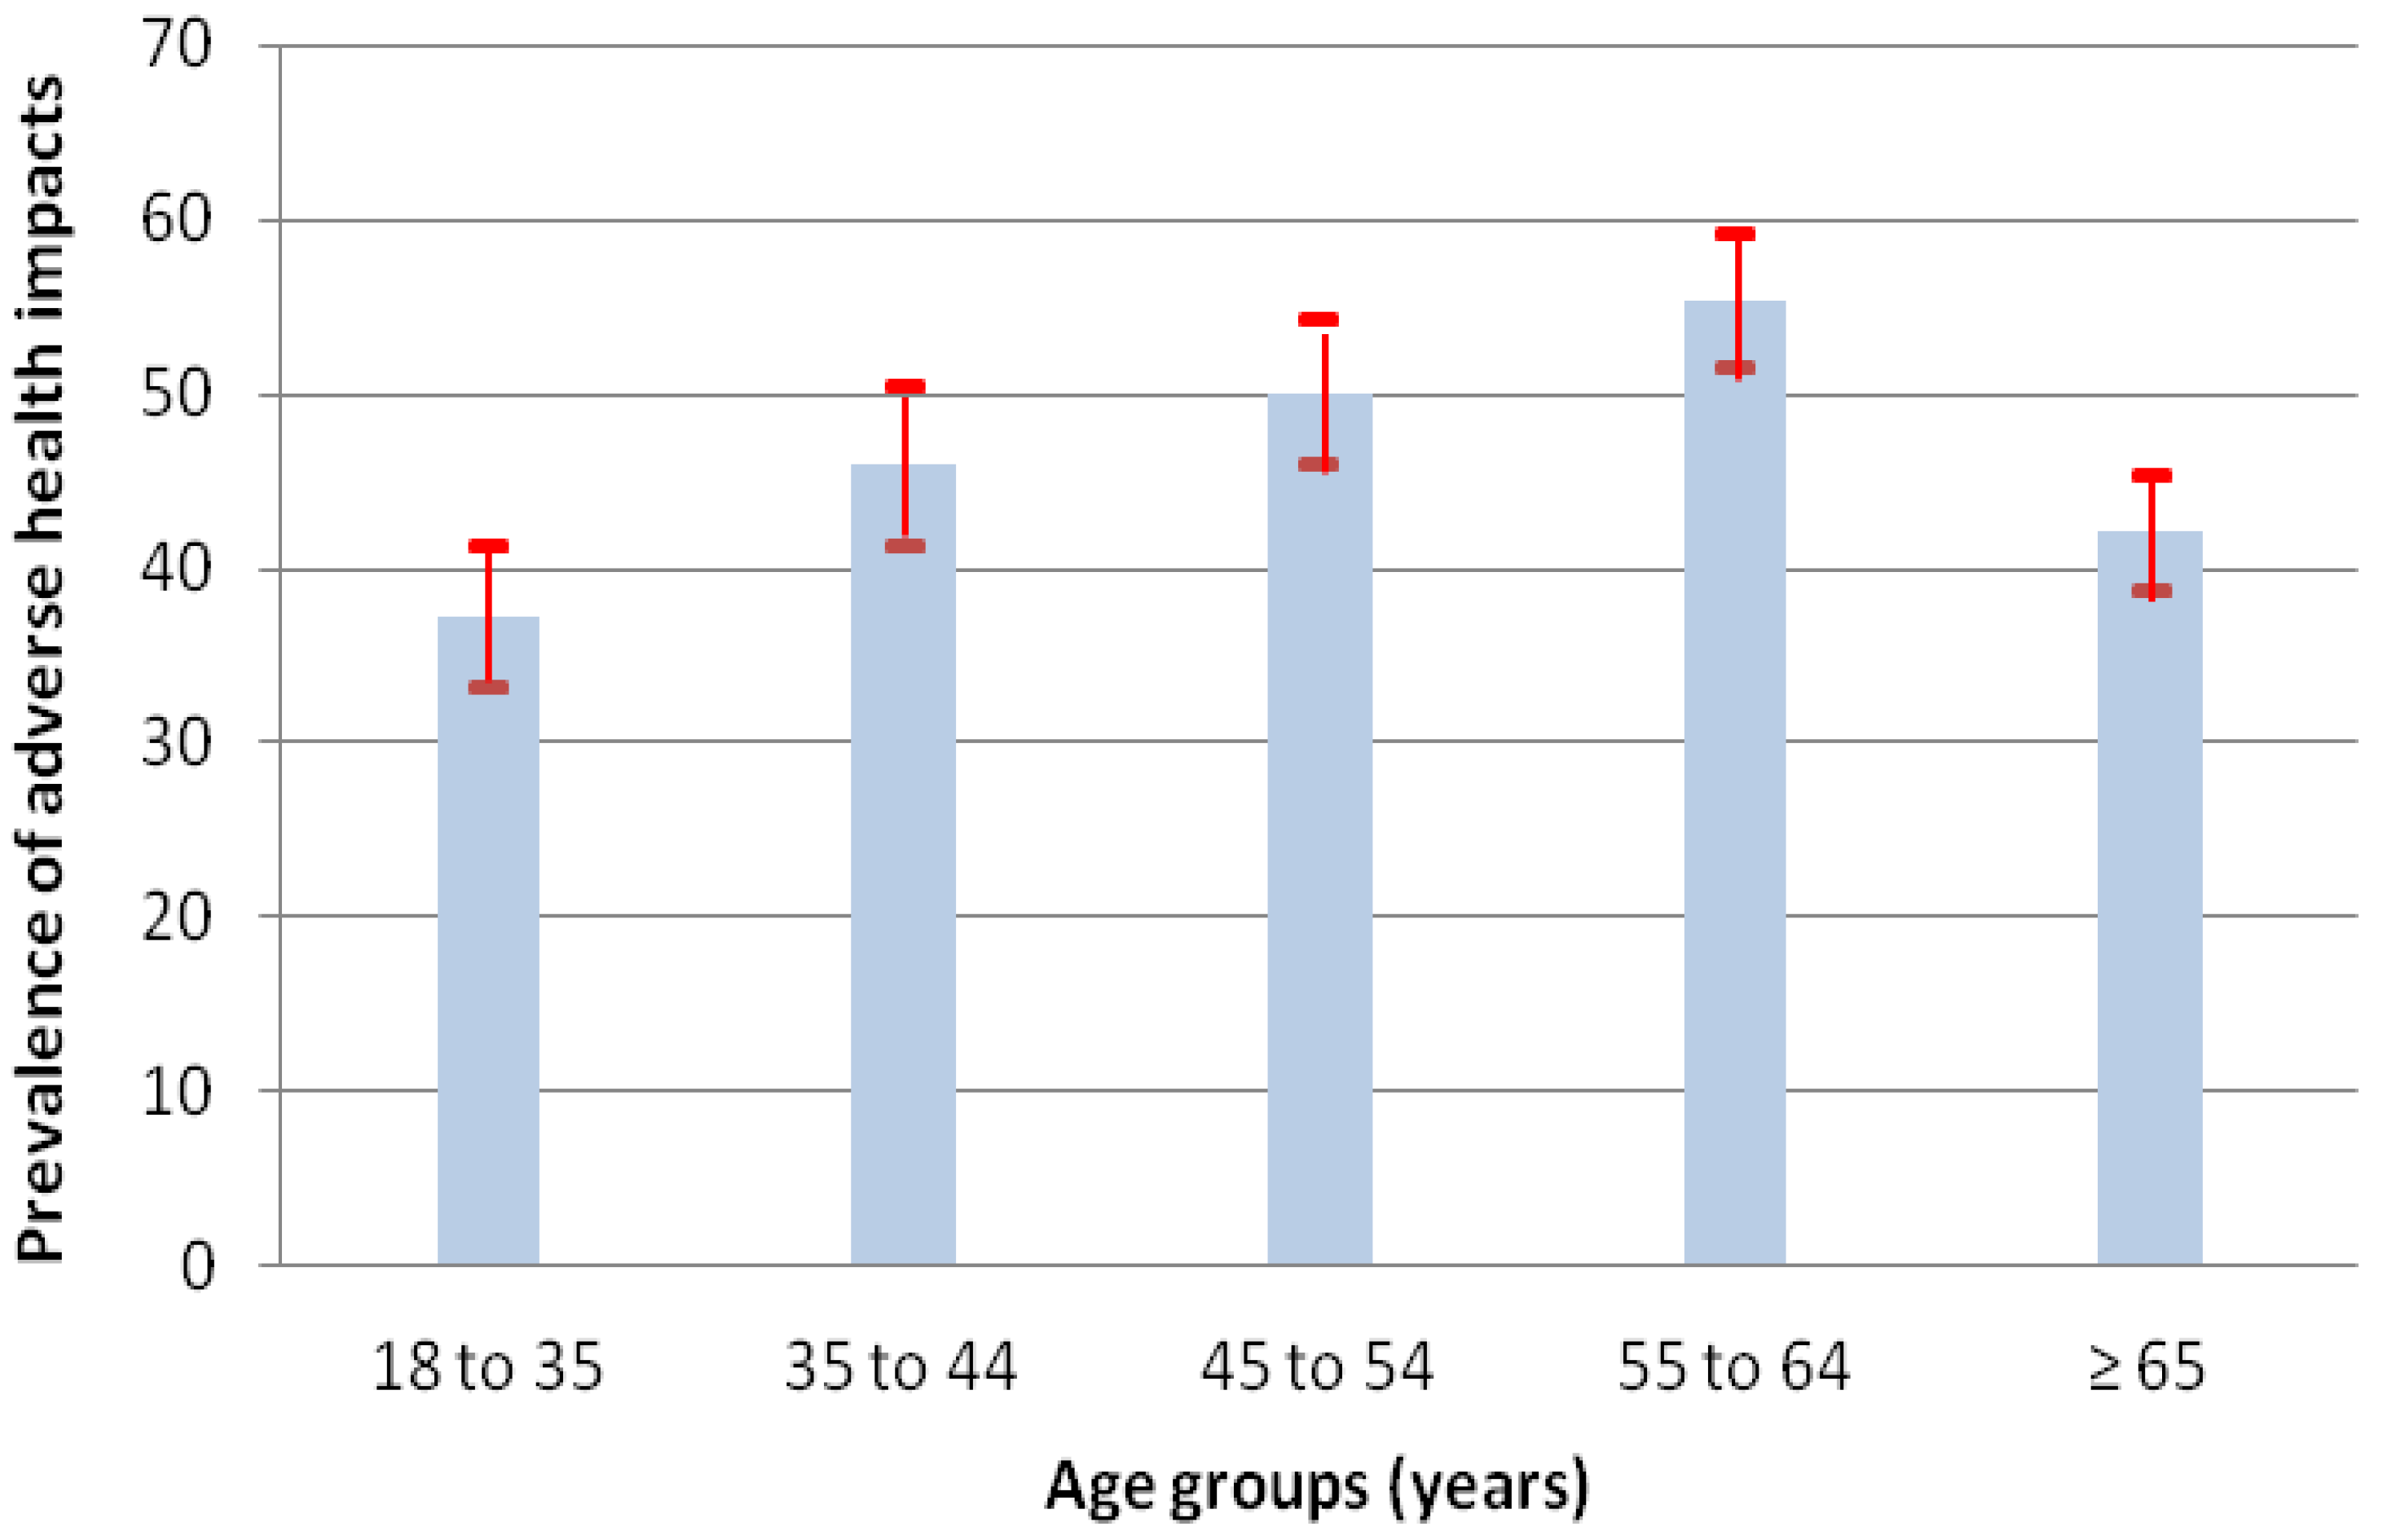
| Age E | <0.0001 | |||
| ●18 to 35 years | 17.6 (16.2–19.0) | 37.2 (33.1–41.3) | 0.8 (0.7–1.0) | |
| ●35 to 44 years | 13.4 (12.2–14.6) | 45.9 (41.3–50.5) | 1.2 (0.9–1.5) | |
| ●45 to 54 years | 18.5 (17.1–19.9) | 50.1 (45.9–54.3) | 1.4 (1.1–1.7) | |
| ●55 to 64 years | 21.3 (19.8–22.7) | 55.3 (51.5–59.1) | 1.7 (1.4–2.1) | |
| ●≥65 years | 29.3 (27.7–30.9) | 42.1 (38.8–45.4) | 1.0 | |
| Sex F | <0.0001 | |||
| ●Female | 54.2 (52.5–56.1) | 51.9 (49.7–54.1) | 1.7 (1.5–2.0) | |
| ●Male | 45.8 (44.0–47.6) | 39.1 (36.3–41.9) | 1.0 | |
| Lives alone G | 0.0200 | |||
| ●Yes | 45.6 (43.9–47.4) | 48.0 (45.6–50.4) | 1.2 (1.0–1.4) | |
| ●No | 54.4 (52.6–56.1) | 43.7 (41.1–46.3) | 1.0 | |
| Types of households | 0.0008 | |||
| Non-family households | ||||
| ●1 person (lives alone) | 54.4 (52.6–56.2) | 48.0 (45.6–50.4) | 1.4 (1.1–1.7) | |
| ●≥2 people | 6.6 (5.7–7.6) | 38.1 (31.0–45.1) | 0.9 (0.6–1.3) | |
| Family households | ||||
| ●Couple with children | 14.3 (13.0–15.5) | 42.9 (37.4–48.3) | 1.1 (0.8–1.5) | |
| ●Single-parent family | 14.1 (12.9–15.2) | 50.9 (46.4–55.4) | 1.6 (1.2–2.0) | |
| ●Couple without children | 10.6 (9.5–11.7) | 39.9 (35.1–44.6) | 1.0 | |
| Place of birth | 0.0035 | |||
| ●Elsewhere than in Canada | 20.4 (19.1–21.8) | 40.9 (37.0–44.7) | 0.8 (0.6–0.9) | |
| ●Canada | 79.6 (78.2–81.0) | 47.4 (45.4–49.4) | 1.0 | |
| Length of residence H | 0.0059 | |||
| ●Arrived in <10 years | 6.7 (5.9–7.6) | 37.6 (31.2–43.9) | 0.7 (0.5–0.9) | |
| ●Arrived ≥10 years | 13.6 (12.4–14.8) | 42.4 (37.6–47. 2) | 0.8 (0.7–1.0) | |
| ●Born in Canada | 79.6 (78.2–81.0) | 47.4 (45.4–49.4) | 1.0 | |
| Languages of conversation | 0.0017 | |||
| ●1 of the 2 official languages | 39.0 (37.3–40.7) | 48.5 (45.6–51.4) | 1.4 (1.2–1.7) | |
| ●2 official languages | 36.9 (35.2–38.7) | 47.1 (44.1–50.1) | 1.3 (1.1–1.6) | |
| ●≥1 official language and ≥1 non-official language | 24.0 (22.6–25.5) | 40.5 (37.1–44.0) | 1.0 |
3.1.2. Socioeconomic Characteristics
3.1.3. Lifestyle
| Variables | % A (IC) B | P C (CI) B | OR D (CI) B | Pr > Chi-2 |
|---|---|---|---|---|
| Level of education | <0.0001 | |||
| ●At most, secondary studies | 54.9 (53.2–56.7) | 49.4 (47.0–51.8) | 1.5 (1.2–1.8) | |
| ●Post-secondary studies, but not university | 21.7 (20.3–23.2) | 45.3 (41.5–49.1) | 1.3 (1.0–1.6) | |
| ●University studies (partial or complete) | 23.3 (21.8–24.8) | 39.8 (36.2–43.4) | 1.0 | |
| Household income (after taxes, all sources, 12 months) | 0.0006 | |||
| ●<$15,000 | 42.8 (41.0–44.6) | 48.4 (46.2–50.5) | 1.4 (0.9–2.4) | |
| ●$15,000 to <$30,000 | 30.1 (28.4–31.7) | 40.7 (37.3–44.1) | 1.0 (0.7–1.5) | |
| ●≥$30,000 | 27.1 (25.5–28.8) | 40.6 (31.2–50.0) | 1.0 | |
| Respondent’s main situation E | <0.0001 | |||
| ●Long-term medical leave F | 16.1 (14.8–17.4) | 72.2 (68.2–76.2) | 4.9 (3.9–6.3) | |
| ●Unemployed situation, but subject to change | 13.6 (12.4–14.9) | 42.7 (37.9–47.6) | 1.4 (1.1–1.8) | |
| ●Preretirement or retirement | 33.7 (32.1–35.4) | 43.0 (39.9–46.0) | 1.4 (1.2–1.7) | |
| ●Other situations (e.g., maternity leave, natural caregiver) | 8.9 (7.9–9.8) | 50.9 (45.2–56.5) | 2.0 (1.5–2.6) | |
| ●Paid employment or self-employed | 27.7 (26.1–29.3) | 34.5 (31.3–37.6) | 1.0 | |
| Economic situation of the household in relation to the other households in the neighbourhood | <0.0001 | |||
| ●Much worse or slightly worse | 17.9 (16.5–19.3) | 59.4 (55.2–63.7) | 2.3 (1.9–2.9) | |
| ●Similar | 51.8 (49.9–53.6) | 46.5 (43.9–49.1) | 1.4 (1.2–1.7) | |
| ●Better or much better | 30.4 (28.7–32.1) | 38.6 (35.3–41.9) | 1.0 | |
| Low-rental housing resident G | <0.0001 | |||
| ●Yes | 46.6 (44.8–48.4) | 54.1 (51.5–56.7) | 1.8 (1.6–2.2) | |
| ●No | 53.4 (51.6–55.2) | 39.0 (36.7–41.4) | 1.0 | |
| Air conditioning at home | 0.0246 | |||
| ●Yes H | 49.5 (47.7–51.2) | 50.9 (48.4–53.4) | 1.4 (1.1–1.8) | |
| ●No | 50.5 (48.8–52.3) | 41.3 (38.9–43.8) | 1.0 |
| Variables | % A (CI) B | P C (CI) B | OR D (CI) B | Pr > Chi-2 |
|---|---|---|---|---|
| Body mass index E | <0.0001 | |||
| ●Obesity | 37.4 (35.6–39.1) | 49.4 (46.5–50.3) | 1.4 (1.2–1.7) | |
| ●Overweight | 26.7 (25.1–28.3) | 46.8 (43.3–50.3) | 1.3 (1.0–1.5) | |
| ●Thin or normal build | 36.0 (34.3–37.7) | 41.2 (38.2–44.1) | 1.0 | |
| Frequency of physical activities (3 months) F | 0.0003 | |||
| ●No, never | 32.1 (30.4–33.7) | 51.1 (48.0–54.2) | 1.4 (1.2–1.7) | |
| ●Yes, <1 time/day | 35.1 (33.4–36.8) | 45.0 (42.0–48.0) | 1.1 (0.9–1.4) | |
| ●Yes, ≥1 time/day | 32.9 (31.2–34.6) | 42.2 (39.1–45.4) | 1.0 | |
| Duration per practice (3 months) | <0.0001 | |||
| ●0 minutes | 32.1 (30.4–33.7) | 51.1 (48.0–54.2) | 1.7 (1.4–2.1) | |
| ●1–30 min | 17.6 (16.3–19.0) | 52.7 (48.6–56.9) | 1.8 (1.5–2.3) | |
| ●31 - 60 min | 24.5 (22.9–26.0) | 43.0 (39.5–46.6) | 1.3 (1.0–1.5) | |
| ●>60 min | 25.9 (24.3–27.5) | 38.1 (34.6–41.6) | 1.0 | |
| Frequency of alcohol consumption, last 12 months | <0.0001 | |||
| ●No, never | 34.7 (33.0–36.4) | 51.6 (48.6–54.6) | 1.7 (1.4–2.0) | |
| ●Yes, <1 time/month | 15.8 (14.5–17.0) | 50.1 (45.8–54.5) | 1.6 (1.3–2.0) | |
| ●Yes, ≥1 time/month, but not every week | 17.2 (15.8–18.5) | 45.1 (40.8–49.3) | 1.3 (1.0–1.6) | |
| ●Yes, ≥1 time/week | 32.4 (30.7–34.1) | 38.7 (35.5–41.8) | 1.0 | |
| Smokers in the dwelling daily or almost daily | 0.0083 | |||
| ●Yes | 37.4 (35.7–39.2) | 49.1 (46.2–52.1) | 1.2 (1.1–1.4) | |
| ●No | 62.6 (60.8–64.3) | 44.2 (41.9–46.4) | 1.0 | |
| Main mode of transport to get around locally, last 12 months | 0.0004 | |||
| ●Public transport | 57.7 (56.0–59.4) | 48.9 (39.6–45.1) | 1.3 (1.1–1.5) | |
| ●Automobile | 42.3 (40.6–44.0) | 42.3 (49.0–54.5) | 1.0 |
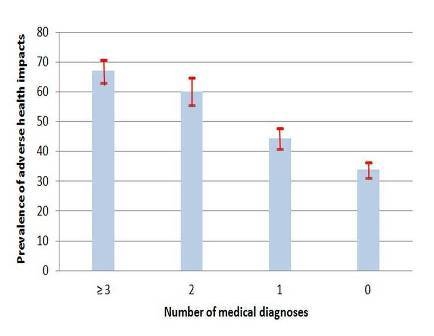
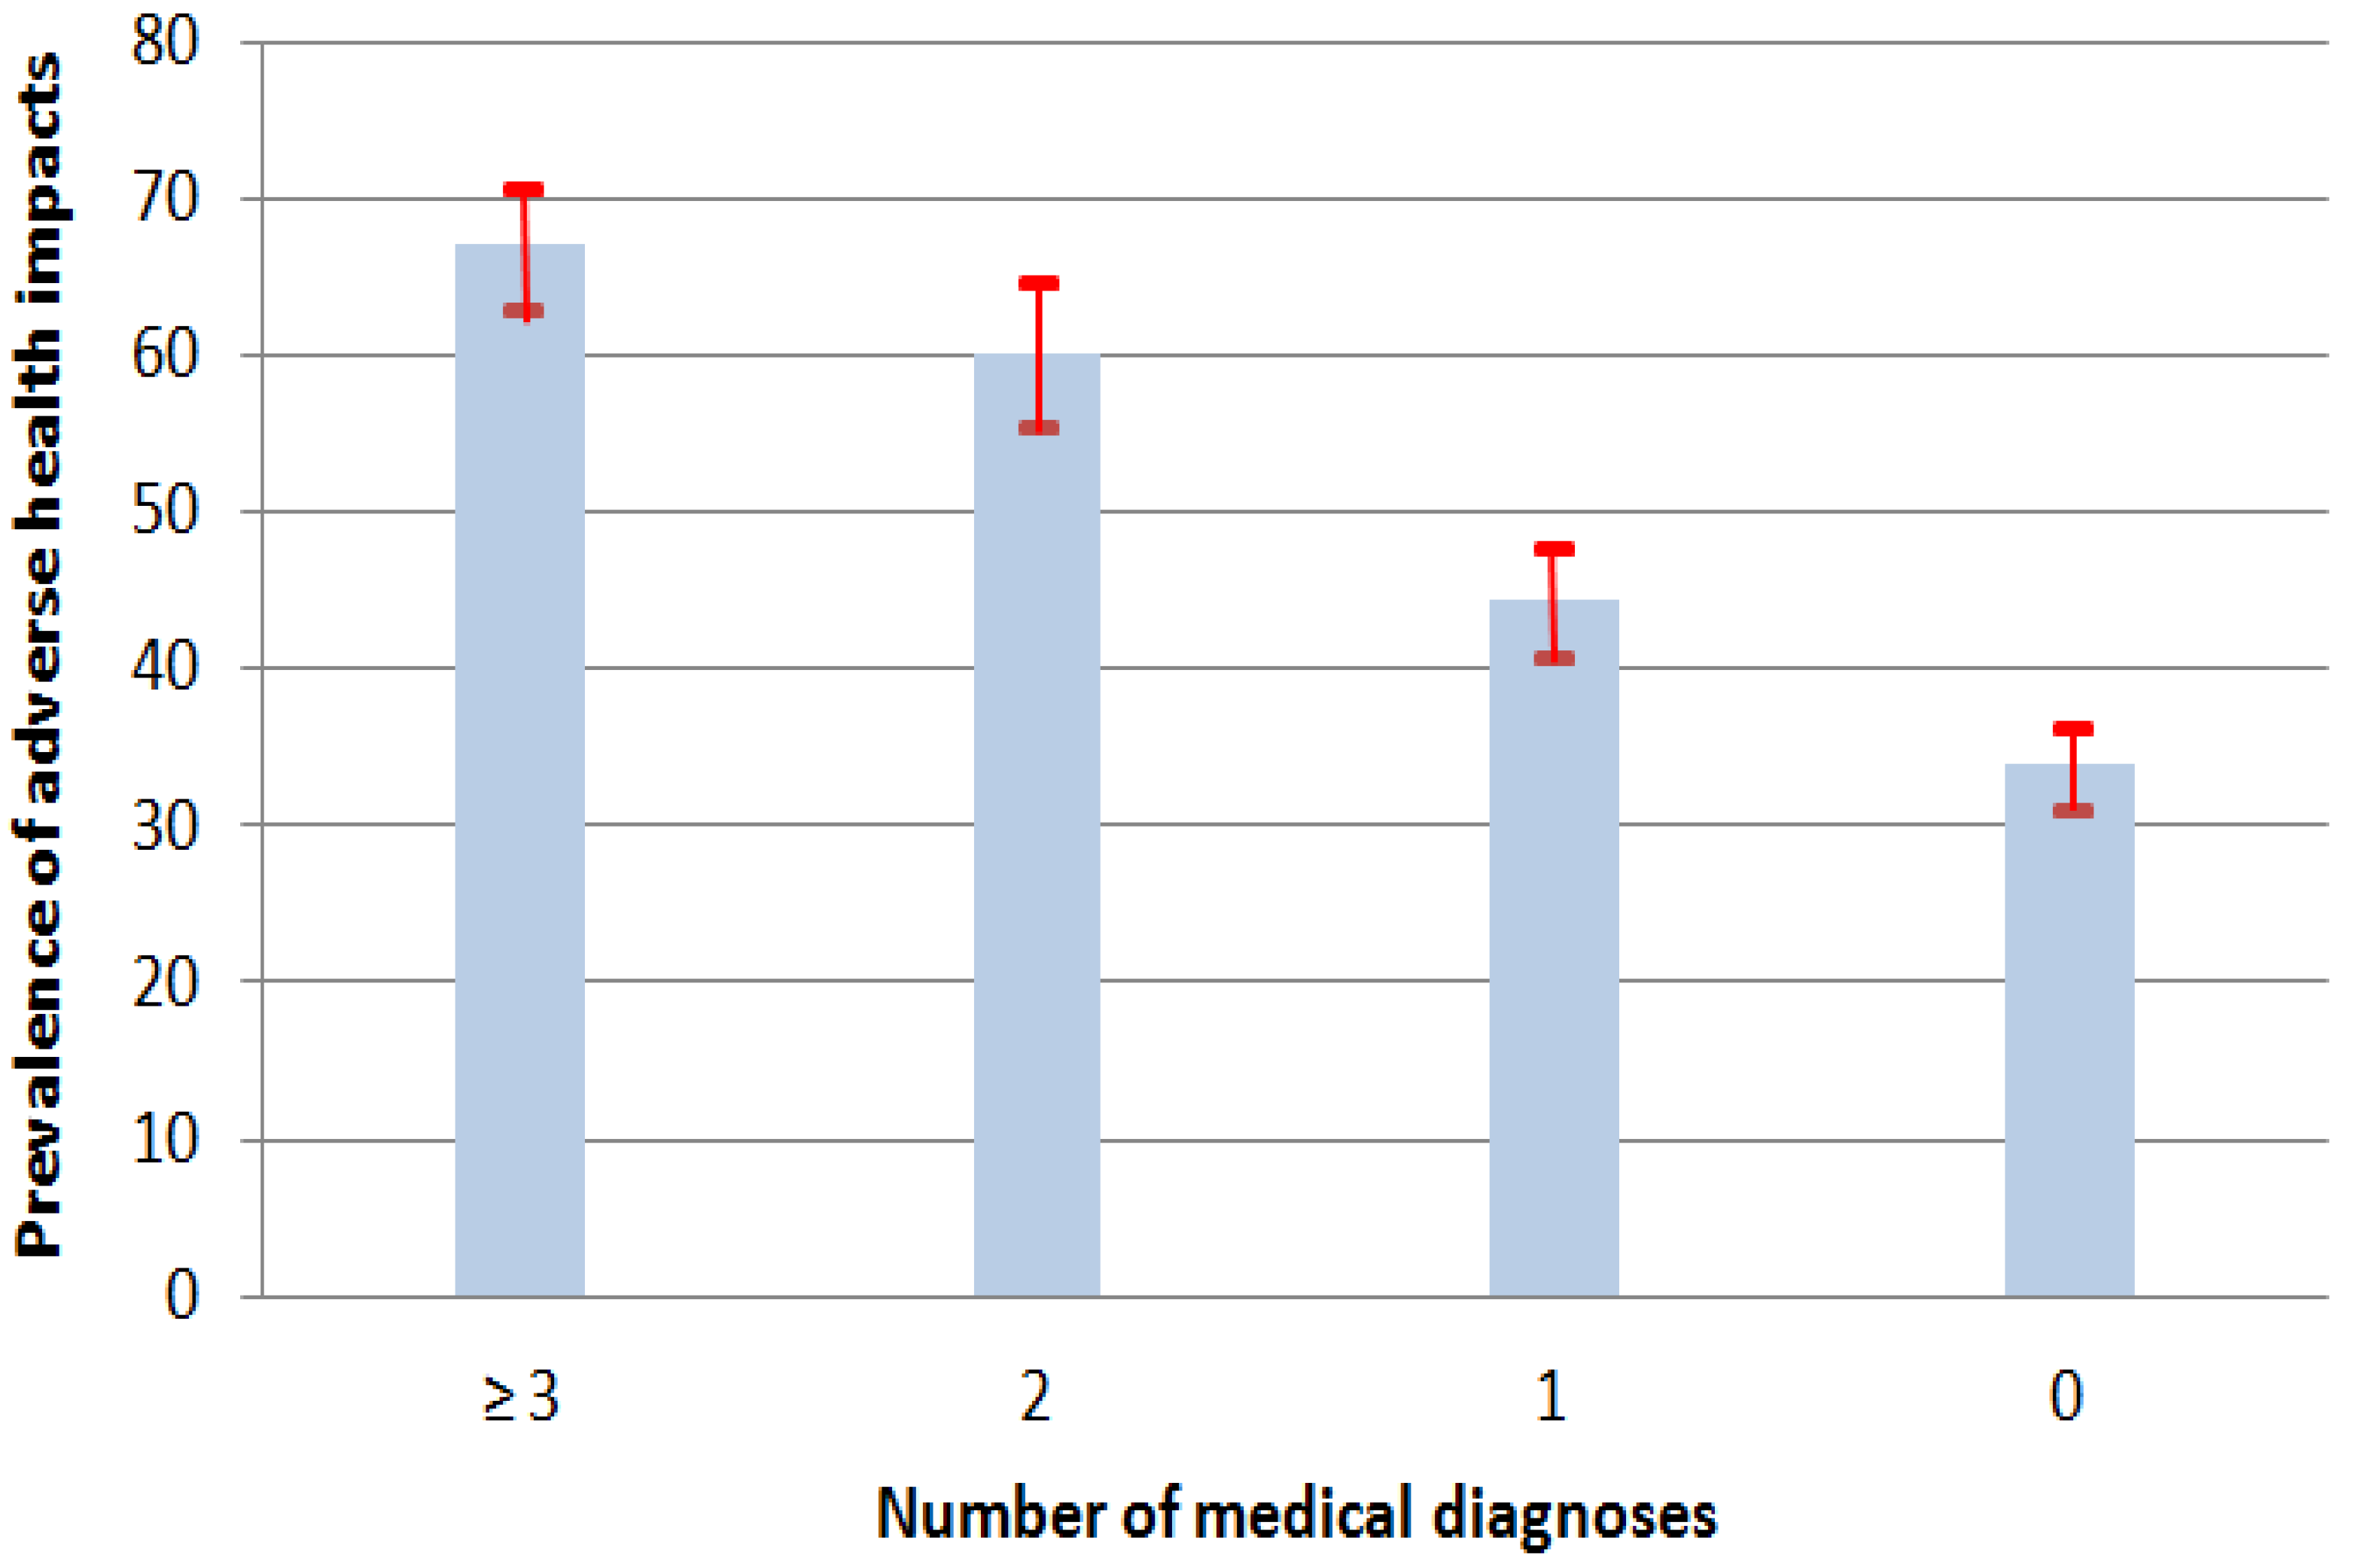
3.1.4. Diagnoses of Chronic Diseases
| Variables | % A (CI) B | P C (CI) B | OR D (CI) B | Pr > Chi-2 |
|---|---|---|---|---|
| Diagnoses all causes E | <0.0001 | |||
| ●Yes, ≥3 diagnoses | 18.4 (17.1−19.7) | 67.0 (63.1−70.8) | 4.0 (3.2−4.9) | |
| ●Yes, 2 diagnoses | 13.3 (12.2−14.5) | 60.1 (55.5−64.7) | 2.9 (2.4−3.7) | |
| ●Yes, 1 diagnosis | 24.6 (23.0−26.1) | 44.3 (40.8−47.9) | 1.6 (1.3−1.9) | |
| ●No, no diagnosis | 43.7 (42.0−45.5) | 33.9 (31.3−36.5) | 1.0 | |
| Diagnoses of the cardiovascular system | <0.0001 | |||
| ●Yes, ≥2 diagnoses | 11.6 (10.4−12.7) | 61.4 (56.3−66.5) | 2.3 (1.8−2.9) | |
| ●Yes, 1 diagnosis | 19.2 (17.8−20.6) | 53.4 (49.4−57.5) | 1.6 (1.4−2.0) | |
| ●No, no diagnosis | 69.3 (67.7−70.9) | 41.4 (39.3−43.5) | 1.0 | |
| Hypertension | <0.0001 | |||
| ●Yes | 18.9 (17.4−20.4) | 56.2 (51.9−60.6) | 1.8 (1.5−2.2) | |
| ●No | 81.1 (79.6−82.6) | 41.4 (39.3−43.5) | 1.0 | |
| Hypercholesterolemia | <0.0001 | |||
| ●Yes | 14.1 (12.7−15.4) | 56.7 (51.5−61.9) | 1.9 (1.5−2.3) | |
| ●No | 85.9 (84.6−87.3) | 41.4 (39.3−43.5) | 1.0 | |
| Diagnoses of the respiratory system | <0.0001 | |||
| ●Yes, ≥2 diagnoses | 6.2 (5.4−7.1) | 77.5 (71.8−83.2) | 5.0 (3.6−7.0) | |
| ●Yes, 1 diagnosis | 16.0 (14.8−17.3) | 59.6 (55.4−63.9) | 2.2 (1.8−2.6) | |
| ●No, no diagnosis | 77.7 (76.3−79.2) | 40.7 (38.7−42.7) | 1.0 | |
| Asthma | <0.0001 | |||
| ●Yes | 14.4 (13.2−15.7) | 68.6 (64.2−73.0) | 3.2 (2.6−4.0) | |
| ●No | 85.6 (84.3−86.8) | 40.7 (38.7−42.7) | 1.0 | |
| Chronic bronchitis | <0.0001 | |||
| ●Yes | 9.1 (8.0−10.1) | 70.4 (65.0−75.9) | 3.5 (2.6−4.6) | |
| ●No | 90.9 (89.9−92.0) | 40.7 (38.7−42.7) | 1.0 | |
| Diagnoses of the central nervous system F | <0.0001 | |||
| ●Yes, ≥1 diagnosis | 5.4 (4.6−6.2) | 78.8 (72.5−85.1) | 4.9 (3.4−7.2) | |
| ●No, no diagnosis | 94.6 (93.8−95.4) | 43.0 (41.1−44.9) | 1.0 | |
| Mental disorders | <0.0001 | |||
| ●Yes | 3.6 (2.9−4.2) | 79.8 (71.9−87.7) | 5.3 (3.2−8.6) | |
| ●No | 96.5 (95.8−97.1) | 43.0 (41.1−44.9) | 1.0 | |
| Other nervous disorders | <0.0001 | |||
| ●Yes | 1.7 (1.3−2.2) | 82.2 (72.1−92.2) | 6.1 (3.1−12.2) | |
| ●No | 98.3 (97.8−98.7) | 43.0 (41.1−44.9) | 1.0 | |
| Diagnoses of systems other than those above | <0.0001 | |||
| ●Yes, ≥2 diagnoses | 7.8 (6.8−8.7) | 68.5 (62.7−74.3) | 3.3 (2.5−4.4) | |
| ●Yes, 1 diagnosis | 25.8 (24.2−27.3) | 54.1 (50.7−57.7) | 1.8 (1.5−2.1) | |
| ●No, no diagnosis | 66.5 (64.8−68.2) | 39.6 (37.4−41.7) | 1.0 | |
| Diabetes | <0.0001 | |||
| ●Yes | 15.1 (13.6−16.6) | 57.3 (52.0−62.5) | 2.1 (1.6−2.6) | |
| ●No | 84.9 (83.4−86.4) | 39.6 (37.4−41.7) | 1.0 | |
| Arthritis | <0.0001 | |||
| ●Yes | 9.0 (7.8−10.1) | 61.0 (54.5−67.6) | 2.4 (1.8−3.2) | |
| ●No | 91.1 (89.9−92.2) | 39.6 (37.4−41.7) | 1.0 |
3.1.5. Disabilities, Reduced Mobility and Perceptions Related to State of Health
| Variables | % A (CI) B | P C (CI) B | OR D (CI) B | Pr > Chi-2 |
|---|---|---|---|---|
| ≥1 functional disability E | <0.0001 | |||
| ●Yes | 28.9 (27.3–30.5) | 60.1 (56.9–63.3) | 2.2 (1.9–2.6) | |
| ●No | 71.1 (69.5–72.7) | 40.4 (38.3–42.5) | 1.0 | |
| ≥1 physical or mental disability F | <0.0001 | |||
| ●Yes | 30.7 (29.1–32.3) | 63.6 (60.6–66.6) | 2.8 (2.4–3.3) | |
| ●No | 69.3 (67.7–70.9) | 38.2 (36.1–40.3) | 1.0 | |
| Needing help getting around in the neighbourhood | <0.0001 | |||
| ●Yes | 16.4 (15.2–17.7) | 59.5 (55.4–63.7) | 1.9 (1.6–2.3) | |
| ●No | 85.6 (82.3–84.8) | 43.3 (41.4–45.3) | 1.0 | |
| Perception of general state of health G | <0.0001 | |||
| ●Fair or poor | 27.0 (25.4–28.6) | 67.9 (64.6–71.1) | 4.7 (3.9–5.6) | |
| ●Good | 30.9 (29.3–32.6) | 47.3 (44.0–50.5) | 2.0 (1.7–2.4) | |
| ●Very good or excellent | 42.1 (40.3–43.9) | 31.2 (28.7–33.7) | 1.0 | |
| Mostly stressful days H | <0.0001 | |||
| ●Yes, rather or extremely stressful | 24.8 (23.3–26.3) | 57.8 (54.4–61.2) | 2.3 (1.8–2.9) | |
| ●Yes, but not very or only slightly | 57.6 (55.9–59.4) | 43.6 (41.2–45.9) | 1.3 (1.1–1.6) | |
| ●No, not at all | 17.5 (16.2–18.9) | 37.6 (33.3–41.8) | 1.0 |
3.1.6. Social Support and Social Contacts
| Variables | % A (CI) B | P C (CI) B | OR D (CI) B | Pr > Chi-2 |
|---|---|---|---|---|
| Help received if bedridden | 0.0596 | |||
| ●Never | 13.5 (12.4–14.8) | 51.9 (47.0–56.7) | 1.6 (1.1–2.3) | |
| ●Sometimes | 12.3 (11.2–13.5) | 52.2 (47.1–57.2) | 1.1 (0.8–1.6) | |
| ●Often or always | 74.1 (72.6–75.7) | 44.0 (41.9–46.1) | 1.0 | |
| Help received to go to the doctor | 0.0538 | |||
| ●Never | 13.0 (11.8–14.2) | 53.6 (48.6–58.5) | 1.6 (1.1–2.3) | |
| ●Sometimes | 10.5 (9.4–11.6) | 51.2 (45.7–56.8) | 0.9 (0.6–1.4) | |
| ●Often or always | 76.5 (75.0–78.0) | 44.0 (42.0–46.1) | 1.0 | |
| Help received to prepare meals when disabled | 0.0243 | |||
| ●Never | 16.7 (15.4–18.1) | 54.7 (50.2–59.1) | 1.5 (1.1–2.2) | |
| ●Sometimes | 12.5 (11.3–13.6) | 49.7 (44.7–54.6) | 0.8 (0.6–1.2) | |
| ●Often or always | 70.8 (69.2–72.4) | 43.2 (41.1–45.4) | 1.0 | |
| Help received to perform household tasks when disabled | 0.0520 | |||
| ●Never | 17.3 (15.9–18.7) | 50.7 (45.4–56.0) | 1.5 (1.1–2.2) | |
| ●Sometimes | 12.2 (11.0–13.3) | 48.5 (45.8–51.2) | 0.9 (0.6–1.3) | |
| ●Often or always | 70.6 (68.9–72.2) | 43.2 (40.4–46.0) | 1.0 | |
| Number of helpers who supported the respondent, last 12 months, and living < 80 km from the dwelling E | 0.0079 | |||
| ●No helpers | 12.2 (11.0–13.4) | 47.0 (43.1–50.8) | 1.4 (1.1–1.7) | |
| ●1 or 2 helpers | 46.1 (44.3–47.9) | 46.1 (43.1–47.9) | 1.2 (1.1–1.5) | |
| ●≥3 helpers | 41.7 (40.0–43.5) | 45.9 (43.1–48.7) | 1.0 | |
| Face-to-face contacts with the family | 0.3267 | |||
| ●No contact | 11.7 (10.6–12.8) | 49.4 (44.3–54.6) | 1.2 (0.9–1.5) | |
| ●A few times per month, but not every week | 49.5 (47.7–51.3) | 45.7 (43.1–48.2) | 1.0 (0.9–1.2) | |
| ●A few times per week | 38.8 (37.1–40.6) | 45.0 (42.1–47.8) | 1.0 | |
| Face-to-face contacts with friends | 0.0399 | |||
| ●No contact | 7.0 (6.1–6.9 | 52.9 (46.0–59.7) | 1.2 (0.9–1.5) | |
| ●A few times per month, but not every week | 35.4 (33.7–37.1) | 47.5 (44.6–50.5) | 1.0 (0.9–1.2) | |
| ●A few times per week | 57.6 (55.9–59.4) | 44.5 (42.1–46.8) | 1.0 | |
| Face-to-face contacts with neighbours | 0.4974 | |||
| ●No contact | 14.6 (13.3–15.8) | 46.1 (41.5–50.7) | 1.0 (0.8–1.2) | |
| ●A few times per month, but not every week | 50.6 (48.9–52.4) | 44.7 (41.7–47.7) | 0.9 (0.8–1.1) | |
| ●A few times per week | 34.8 (33.1–36.5) | 47.1 (44.6–49.6) | 1.0 | |
| Member of a non-profit organization or association | 0.9453 | |||
| ●Yes | 24.5 (23.0–26.1) | 46.2 (42.6–49.7) | 1.0 (0.9–1.2) | |
| ●No | 75.5 (74.0–77.0) | 46.0 (44.0–48.1) | 1.0 |
3.1.7. Health, Home Care and Services
| Variables | % A (CI) B | P C (CI) B | OR D (CI) B | Pr > Chi-2 |
|---|---|---|---|---|
| Treating physician’s office as primary place of consultation, in general | 0.0443 | |||
| ●Yes | 65.4 (63.7–67.1) | 47.5 (45.4–49.7) | 1.2 (1.0–1.4) | |
| ●No | 34.6 (32.9–36.3) | 43.7 (40.6–46.7) | 1.0 | |
| Stay ≥1 night in a hospital, a nursing home, a convalescent home, last 12 months | <0.0001 | |||
| ●Yes | 16.3 (15.0–17.6) | 59.4 (55.1–63.7) | 1.9 (1.6–2.3) | |
| ●No | 83.7 (82.4–85.0) | 43.4 (41.5–45.3) | 1.0 | |
| ≥1 health professional consulted, last 12 months (without stays) | <0.0001 | |||
| ●Yes | 67.0 (65.4–68.6) | 48.8 (46.7–51.0) | 1.4 (1.2–1.6) | |
| ●No | 33.0 (31.4–34.6) | 40.4 (37.3–43.4) | 1.0 | |
| Home care or services paid completely or in part by the government | <0.0001 | |||
| ●Yes | 9.4 (8.4–10.3) | 57.1 (51.7–62.7) | 1.6 (1.3–2.1) | |
| ●No | 90.7 (89.7–91.6) | 44.9 (43.0–46.7) | 1.0 |
3.2. Multivariate Analyses
| Independent variables | OR A (CI) B,C | ||
|---|---|---|---|
| All D | < 65 years | ≥ 65 years | |
| ≥65 years (vs.<65 years) | 0.6 (0.5–0.8) * | --- | --- |
| Women (vs. men) | 1.6 (1.3–1.9) * | 1.7 (1.4–2.1) * | 1.4 (1.0–1.9) |
| Income <$15,000 (vs. ≥$15,000) | 1.4 (1.1–1.6) † | 1.3 (1.1–1.6) ƪ | 1.5 (1.1–2.1) ‡ |
| Long-term medical leave (vs. no) | 2.0 (1.5–2.6) ƪ | 2.0 (1.5–2.7) * | --- |
| Air conditioning at home (any type) | 1.5 (1.3–1.8) * | 1.6 (1.3–1.9) * | 1.4 (1.0–1.9) ƪ |
| Diagnoses of chronic diseases (vs. none) | |||
| ●1 diagnosis | 1.4 (1.2–1.8) ‡ | --- | --- |
| ●2 diagnoses | 2.2 (1.7–2.9) ‡ | --- | --- |
| ●≥3 diagnoses | 2.8 (2.2–3.6) * | --- | --- |
| Fair or poor state of health (vs. good, very good or excellent) | 2.1 (1.7–2.6) * | --- | --- |
| ≥2 diagnoses (Dx) of chronic diseases and perceived state of health (vs. <2 Dx and state perceived as good, very good or excellent) | |||
| ●≥2 Dx | --- | 1.9 (1.4–2.6) * | 1.9 (1.3–2.8) † |
| ●State of health perceived as fair or poor | --- | 2.2 (1.5–3.1) * | 1.6 (1.0–2.7) |
| ●≥2 Dx and state of health perceived as fair or poor | --- | 5.6 (3.9;8.0) * | 4.2 (2.9;6.2) * |
| Most days rather or extremely stressful (vs. slightly, not very, or not at all) | 1.6 (1.3–2.0) * | 1.5 (1.3–1.9) * | 1.9 (1.2–2.9) ‡ |
3.3. Discussion
3.4. Limitations of the Study
- non-family households (census = 56.1%; study = 61%);
- non-family households of only one person (87.6% and 90%);
- non-family households of at least two people (11.8% and 10%);
- single-parent families among the family households (34.4% and 36.2%);
- couples with or without children among the family households (65.4% and 63.8%);
- couples with children among the family households (46.8% and 42.4%);
- couples without children among the family households (53.5% and 57.6%);
- people born elsewhere than in Canada (20.9% and 20%);
- immigrants speaking neither French nor English (2.0% and 0, because speaking one of the two official languages was a selection criterion in the study);
- dwellings requiring major repairs (11.1% and 14.2%);
- single-family homes (individual, semi-detached, row housing) (5.7% and 6.1%).
4. Conclusions
Acknowledgments
Author Contributions
Conflicts of Interest
References
- Intergovernmental Panel on Climate Change. Summary for Policymakers. In Climate Change 2013: The Physical Science Basis. Contribution of Working Group 1 to the Fifth Assessment Report of the Intergovernmental Panel on Climate Change; Stocker, T.F., Qin, D., Plattner, G.-K., Tignor, M., Allen, S.K., Boschung, J., Nauels, A., Xia, Y., Bex, V., Midgley, P.M., Eds.; Cambridge University Press: New York, USA, 2013. [Google Scholar]
- Hansen, J.; Sato, M.; Ruedy, R. Perception of climate change. PNAS 2012, 109, E2415–E2423. [Google Scholar] [CrossRef]
- Ye, X.; Wolff, R.; Yu, W.; Vaneckova, P.; Pan, X.; Tong, S. Ambient temperature and morbidity: A review of epidemiological evidence. Environ. Health Perspect. 2012, 120, 19–28. [Google Scholar] [CrossRef] [PubMed]
- Intergovernmental Panel on Climate Change. Summary for Policymakers. In Climate Change 2014: Impacts, Adaptation, and Vulnerability. Part A: Global and Sectoral Aspects. Contribution of Working Group II to the Fifth Assessment Report of the Intergovernmental Panel on Climate Change; Field, C.B., Barros, V.R., Dokken, D.J., Mach, K.J., Mastrandrea, M.D., Bilir, T.E., Chatterjee, M., Ebi, K.L., Estrada, Y.O., Genova, R.C., et al., Eds.; Cambridge University Press: New York, USA, 2014; pp. 1–32. [Google Scholar]
- Jamrozik, E.; Hyde, Z.; Alfonso, H.; Flicker, L.; Almeida, O.; Yeap, B.; Norman, P.; Hankey, G.; Jamrozik, K. Validity of self-reported versus hospital-coded diagnosis of stroke: A cross-sectional and longitudinal study. Cerebrovasc. Dis. 2014, 37, 256–262. [Google Scholar] [CrossRef] [PubMed]
- Fahimi, M.; Link, M.; Mokdad, A.; Schwartz, D.A.; Levy, P. Tracking chronic disease and risk behavior prevalence as survey participation declines: Statistics from the behavioral risk factor surveillance system and other national surveys. Prev. Chronic Dis. 2008, 5, A80:1–A80:16. [Google Scholar]
- Starr, G.J.; Dal Grande, E.; Taylor, A.W.; Wilson, D.H. Reliability of self-reported behavioural health risk factors in a south Australian telephone survey. Aust. N. Z. J. Public Health 1999, 23, 528–530. [Google Scholar] [CrossRef] [PubMed]
- Pierannunzi, C.; Hu, S.S.; Balluz, L. A systematic review of publications assessing reliability and validity of the behavioral risk factor surveillance system (BRFSS), 2004–2011. BMC Med. Res. Methodol. 2013, 13, 49. [Google Scholar] [CrossRef] [PubMed]
- Gobbens, R.J.; van Assen, M.A. The prediction of quality of life by physical, psychological and social components of frailty in community-dwelling older people. Qual. Life Res. 2014, 23, 2289–2300. [Google Scholar] [CrossRef] [PubMed]
- Statistics Canada. Perceived Health. Available online: www.statcan.gc.ca/pub/82-229-x/2009001/status/phx-eng.htm (accessed on 6 December 2013).
- Benyamini, Y.; Leventhal, E.A.; Leventhal, H. Gender differences in processing information for making self-assessments of health. Psychosom. Med. 2000, 62, 354–364. [Google Scholar] [CrossRef] [PubMed]
- Bowling, A. Just one question: If one question works, why ask several? J. Epidemiol. Community Health 2005, 59, 342–345. [Google Scholar] [CrossRef]
- Smith, P.; Frank, J. When aspirations and achievements don’t meet. A longitudinal examination of the differential effect of education and occupational attainment on declines in self-rated health among canadian labour force participants. Int. J. Epidemiol. 2005, 34, 827–834. [Google Scholar]
- Fleishman, J.A.; Zuvekas, S.H. Global self-rated mental health: Associations with other mental health measures and with role functioning. Med. Care 2007, 45, 602–609. [Google Scholar] [CrossRef] [PubMed]
- Ramage-Morin, P.L. Successful aging in health care institutions. Health Rep. 2006, 16, 47–56. [Google Scholar] [PubMed]
- Shields, M. Community belonging and self-perceived health. Health Rep. 2008, 19, 51–60. [Google Scholar] [PubMed]
- Shields, M.; Shooshtari, S. Determinants of self-perceived health. Health Rep. 2001, 13, 35–52. [Google Scholar] [PubMed]
- Daniau, C.; Dor, F.; Eilstein, D.; Lefranc, A.; Empereur-Bissonnet, P.; Dab, W. [Study of self-reported health of people living near point sources of environmental pollution: A review. Second part: Analysis of results and perspectives]. Revue d'épidemiologie et de santé publique 2013, 61, 388–398. [Google Scholar] [PubMed]
- Glanz, K.; Gies, P.; O’Riordan, D.L.; Elliott, T.; Nehl, E.; McCarty, F.; Davis, E. Validity of self-reported solar UVR exposure compared with objectively measured UVR exposure. Cancer Epidemiol. Biomark. Prev. 2010, 19, 3005–3012. [Google Scholar] [CrossRef]
- Doyon, B.; Bélanger, D.; Gosselin, P. The potential impact of climate change on annual and seasonal mortality for three cities in Québec, Canada. Int. J. Health Geogr. 2008, 7, 23. [Google Scholar] [CrossRef] [PubMed]
- Bustinza, R.; Lebel, G.; Gosselin, P.; Bélanger, D.; Chebana, F. Health impacts of the july 2010 heat wave in Québec, Canada. BMC Public Health 2013, 13–56. [Google Scholar]
- Basu, R.; Samet, J.M. Relation between elevated ambient temperature and mortality: A review of the epidemiologic evidence. Epidemiol. Rev. 2002, 24, 190–202. [Google Scholar] [CrossRef] [PubMed]
- Robine, J.-M.; Cheung, S.L.K.; Le Roy, S.; Van Oyen, H.; Griffiths, C.; Michel, J.-P.; Herrmann, F.R. Death toll exceeded 70,000 in Europe during the summer of 2003. Comptes Rendus Biol. 2008, 331, 171–178. [Google Scholar] [CrossRef]
- Kravchenko, J.; Abernethy, A.P.; Fawzy, M.; Lyerly, H.K. Minimization of heatwave morbidity and mortality. Am. J. Prev. Med. 2013, 44, 274–282. [Google Scholar] [CrossRef] [PubMed]
- Lundgren, L.; Jonsson, A. Assessment of Social Vulnerability: A Literature Review of Vulnerability Related to Climate Change and Natural hazards. In CSPR Briefing No.9; Center for Climate Science and Policy Research: Norrköpping, Sweden, 2012. [Google Scholar]
- Canadian Council on Social Development. Poverty by Geography Urban: Urban Poverty in Canada. 2000. Available online: www.ccsd.ca/images/research/UPP/PDF/UPP-PovertyByGeography.pdf (accessed on 16 December 2013).
- Conference Board of Canada. Canadian Income Inequality: Is Canada Becoming More Unequal? Available online: www.conferenceboard.ca/hcp/hot-topics/caninequality.aspx (accessed on 16 December 2013).
- Statistics Canada. Dissemination Area (DA) 2011. Available online: www12.statcan.gc.ca/census-recensement/2011/ref/dict/geo021-eng.cfm (accessed on 16 December 2013).
- Luber, G.; McGeehin, M. Climate change and extreme heat events. Am. J. Prev. Med. 2008, 35, 429–435. [Google Scholar] [CrossRef] [PubMed]
- Oke, T.R. Boundary Layer Climates, 2nd ed.; Routledge: London, UK, 1987; p. 474. [Google Scholar]
- Voogt, J.A. Urban Heat Island. In Encyclopedia of Global Environmental Change—Causes and Consequences of Global Environmental Change; Douglas, I., Ed.; Wiley: New York, USA, 2002; Vol. 3, pp. 660–666. [Google Scholar]
- Société d’habitation du Québec. Les caractéristiques des ménages québécois et l’habitation. Available online: www.habitation.gouv.qc.ca/statistiques/regroupements/caracteristiques_des_menages/les_caracteristiques_des_menages_quebecois_et_lhabitation.html (accessed on 16 December 2013).
- Gauthier, J.; Morais, J.A.; Mallet, L. Impact des vagues de chaleur en gériatrie et risques associés aux médicaments. Pharmactuel 2005, 38, 123–133. [Google Scholar]
- Toutant, S.; Gosselin, P.; Bélanger, D.; Bustinza, R.; Rivest, S. An open source web application for the surveillance and prevention of the impacts on public health of extreme meteorological events: The SUPREME system. Int. J. Health Geog. 2011, 10, 39–49. [Google Scholar] [CrossRef]
- Gouvernement du Québec. L’organisation municipale et régionale au québec en 2013; Ministère des Affaires municipales, des Régions et de l’Occupation du Territoire, Gouvernement du Québec: Québec, Canada, 2013. Available online: www.mamrot.gouv.qc.ca/pub/organisation_municipale/organisation_territoriale/organisation_municipale.pdf (accessed on 16 December 2013).
- Vallée, J.; Souris, M.; Fournet, F.; Bochaton, A.; Mobillion, V.; Peyronnie, K.; Salem, G. Sampling in health geography: Reconciling geographical objectives and probabilistic methods. An example of a health survey in Vientiane (Lao PDR). Emerg. Themes Epidemiol. 2007, 4, 6. [Google Scholar] [CrossRef]
- Pampalon, R.; Raymond, G. A deprivation index for health and welfare planning in Quebec. Chronic Dis. Can. 2000, 21, 104–113. [Google Scholar] [PubMed]
- Bélanger, D.; Abdous, B.; Hamel, D.; Valois, P.; Gosselin, P.; Toutant, S.; Morin, P. Étude des vulnérabilités à la chaleur accablante : Problèmes méthodologiques et pratiques rencontrés; INRS-Eau, Terre et Environnement: Québec, Canada, 2013. Available online: http://espace.inrs.ca/1658/ (accessed on 16 December 2013).
- Statistics Canada. Canadian Community Health Survey (CCHS) Annual Component 2010 Questionnaire. Available online: http://www23.statcan.gc.ca/imdb-bmdi/pub/instrument/3226_Q1_V7-eng.pdf (accessed on 10 september 2014).
- Kovats, R.S.; Hajat, S. Heat stress and public health: A critical review. Annu. Review Public Health 2008, 29, 41–55. [Google Scholar] [CrossRef]
- Statistics Canada. Canadian Community Health Survey: 2007 Questionnaire. Available online: http://www23.statcan.gc.ca/imdb-bmdi/pub/instrument/3226_Q1_V4-eng.pdf (accessed on 16 December 2013).
- Thissen, D.; Steinberg, L.; Wainer, H. Use of Item Response Theory in the Study of Group Differences in Trace Lines. In Test validity; Wainer, H., Braun, H.I., Eds.; Lawrence Erlbaum: Hillsdale, MI, USA, 1988; pp. 147–169. [Google Scholar]
- Ministère de la Santé et des Services Sociaux du Québec. Pour guider l’action - Portrait de santé du Québec et de ses régions. 2011. Available online: http://publications.msss.gouv.qc.ca/acrobat/f/documentation/2011/11-228-01F.pdf. (accessed on 16 december 2013).
- Liang, K.Y.; Zeger, S. Longitudinal data analysis using generalized linear models. Biometrika 1986, 73, 13–22. [Google Scholar] [CrossRef]
- Weisskopf, M.G.; Anderson, H.A.; Foldy, S.; Hanrahan, L.P.; Blair, K.; Török, T.J.; Rumm, P.D. Heat wave morbidity and mortality, Milwaukee, WIS, 1999 vs. 1995: An improved response? Am. J. Public Health 2002, 92, 830–833. [Google Scholar]
- Chen, E.; Miller, G.E. Socioeconomic status and health: Mediating and moderating factors. Annu. Review Clin. Psychol. 2013, 9, 723–749. [Google Scholar] [CrossRef]
- Scantamburlo, G.; Scheen, A. Rôle du stress psychosocial dans les maladies complexes. Revue Médicale de Liège 2012, 67, 234–242. [Google Scholar] [PubMed]
- Neylon, A.; Canniffe, C.; Anand, S.; Kreatsoulas, C.; Blake, G.J.; Sugrue, D.; McGorrian, C. A global perspective on psychosocial risk factors for cardiovascular disease. Prog. Cardiovasc. Dis. 2013, 55, 574–581. [Google Scholar] [CrossRef] [PubMed]
- McEwen, B.S. Brain on stress: How the social environment gets under the skin. PNAS 2012, 109 (Suppl. 2), 17180–17185. [Google Scholar] [CrossRef]
- Kenny, G.P.; Yardley, J.; Brown, C.; Sigal, R.J.; Jay, O. Heat stress in older individuals and patients with common chronic diseases. Can. Med. Assoc. J. 2010, 182, 1053–1060. [Google Scholar] [CrossRef]
- Zhan, C.; Sangl, J.; Bierman, A.S.; Miller, M.R.; Friedman, B.; Wickizer, S.W.; Meyer, G.S. Potentially inappropriate medication use in the community-dwelling elderly: Findings from the 1996 medical expenditure panel survey. JAMA 2001, 286, 2823–2829. [Google Scholar] [CrossRef] [PubMed]
- Broemeling, A.-M.; Watson, D.E.; Prebtani, F. Population patterns of chronic health conditions, co-morbidity and healthcare use in Canada: Implications for policy and practice. Healthcare Quart. 2007, 11, 70–76. [Google Scholar] [CrossRef]
- Gagnon, D.; Kenny, G.P. Does sex have an independent effect on thermoeffector responses during exercise in the heat? J. Physiol. 2012, 590, 5963–5973. [Google Scholar] [CrossRef]
- Charkoudian, N. Skin blood flow in adult human thermoregulation: How it works, when it does not, and why. Mayo Clin. Proc. 2003, 78, 603–612. [Google Scholar] [CrossRef] [PubMed]
- Fillingim, R.B. Sex, gender, and pain: Women and men really are different. Curr. Review Pain 2000, 4, 24–30. [Google Scholar] [CrossRef]
- Jacobs, H.S. The male menopause: Does it exist? Against : Problems of senescence in men are not analogous to female menopause. West. J. Med. 2000, 173, 78–79. [Google Scholar] [CrossRef] [PubMed]
- Hajat, S.; O’Connor, M.; Kosatsky, T. Health effects of hot weather: From awareness of risk factors to effective health protection. Lancet 2010, 375, 856–863. [Google Scholar] [CrossRef] [PubMed]
- Alberini, A.; Gans, W.; Alhassan, M. Individual and public-program adaptation: Coping with heat waves in five cities in Canada. Int. J. Environ. Res. Public Health 2011, 8, 4679–4701. [Google Scholar] [CrossRef] [PubMed]
- Anderson, M.; Carmichael, C.; Murray, V.; Dengel, A.; Swainson, M. Defining indoor heat thresholds for health in the UK. Perspect. Public Health 2013, 133, 158–164. [Google Scholar] [CrossRef] [PubMed]
- Kinney, P.L.; O’Neill, M.S.; Bell, M.L.; Schwartz, J. Approaches for estimating effects of climate change on heat-related deaths: Challenges and opportunities. Environ. Sci. Policy 2008, 11, 87–96. [Google Scholar] [CrossRef]
- Statistics Canada. CANSIM—Table 14.8, Household Equipment, 1998 to 2008. Available online: www.statcan.gc.ca/pub/11-402-x/2010000/chap/fam/tbl/tbl08-eng.htm (accessed on 6 December 2013).
- Huang, C.; Barnett, A.G.; Xu, Z.; Chu, C.; Wang, X.; Turner, L.R.; Tong, S. Managing the health effects of temperature in response to climate change: Challenges ahead. Environ. Health Perspect. 2013, 121, 415–419. [Google Scholar] [PubMed]
- Farbotko, C.; Waitt, G. Residential air-conditioning and climate change: Voices of the vulnerable. Health Promot. J. Aust. 2011, 22, S13–S16. [Google Scholar]
- Phipps, S. The Impact of Poverty on Health : A Scan of Research Literature; Canadian Institute for Health Information: Ottawa, Canada, 2003. Available online: https://secure.cihi.ca/free_products/CPHIImpactonPoverty_e.pdf (accessed on 6 December 2013).
- Tochihara, Y.; Kumamoto, T.; Lee, J.-Y.; Hashiguchi, N. Age-related differences in cutaneous warm sensation thresholds of human males in thermoneutral and cool environments. J. Therm. Biol. 2011, 36, 105–111. [Google Scholar] [CrossRef]
- Heft, M.W.; Robinson, M.E. Age differences in orofacial sensory thresholds. J. Dent. Res. 2010, 89, 1102–1105. [Google Scholar] [CrossRef] [PubMed]
- Reid, C.E.; O’Neill, M.S.; Gronlund, C.J.; Brines, S.J.; Brown, D.G.; Diez-Roux, A.V.; Schwartz, J. Mapping community determinants of heat vulnerability. Environ. Health Perspect. 2009, 117, 1730–1736. [Google Scholar] [PubMed]
- Morin, P.; Leloup, X.; Baillergeau, E.; Caillouette, J. Habiter en HLM : Impacts sur la santé et le bien-être des ménages familiaux. Available online: www.frqsc.gouv.qc.ca/upload/capsules_recherche/fichiers/capsule_54.pdf (accessed on 6 August 2012).
© 2014 by the authors; licensee MDPI, Basel, Switzerland. This article is an open access article distributed under the terms and conditions of the Creative Commons Attribution license (http://creativecommons.org/licenses/by/4.0/).
Share and Cite
Bélanger, D.; Gosselin, P.; Valois, P.; Abdous, B. Perceived Adverse Health Effects of Heat and Their Determinants in Deprived Neighbourhoods: A Cross-Sectional Survey of Nine Cities in Canada. Int. J. Environ. Res. Public Health 2014, 11, 11028-11053. https://doi.org/10.3390/ijerph111111028
Bélanger D, Gosselin P, Valois P, Abdous B. Perceived Adverse Health Effects of Heat and Their Determinants in Deprived Neighbourhoods: A Cross-Sectional Survey of Nine Cities in Canada. International Journal of Environmental Research and Public Health. 2014; 11(11):11028-11053. https://doi.org/10.3390/ijerph111111028
Chicago/Turabian StyleBélanger, Diane, Pierre Gosselin, Pierre Valois, and Belkacem Abdous. 2014. "Perceived Adverse Health Effects of Heat and Their Determinants in Deprived Neighbourhoods: A Cross-Sectional Survey of Nine Cities in Canada" International Journal of Environmental Research and Public Health 11, no. 11: 11028-11053. https://doi.org/10.3390/ijerph111111028
APA StyleBélanger, D., Gosselin, P., Valois, P., & Abdous, B. (2014). Perceived Adverse Health Effects of Heat and Their Determinants in Deprived Neighbourhoods: A Cross-Sectional Survey of Nine Cities in Canada. International Journal of Environmental Research and Public Health, 11(11), 11028-11053. https://doi.org/10.3390/ijerph111111028