Traffic-Related Trace Element Accumulation in Roadside Soils and Wild Grasses in the Qinghai-Tibet Plateau, China


Abstract
:1. Introduction
2. Materials and Methods
2.1. Study Area
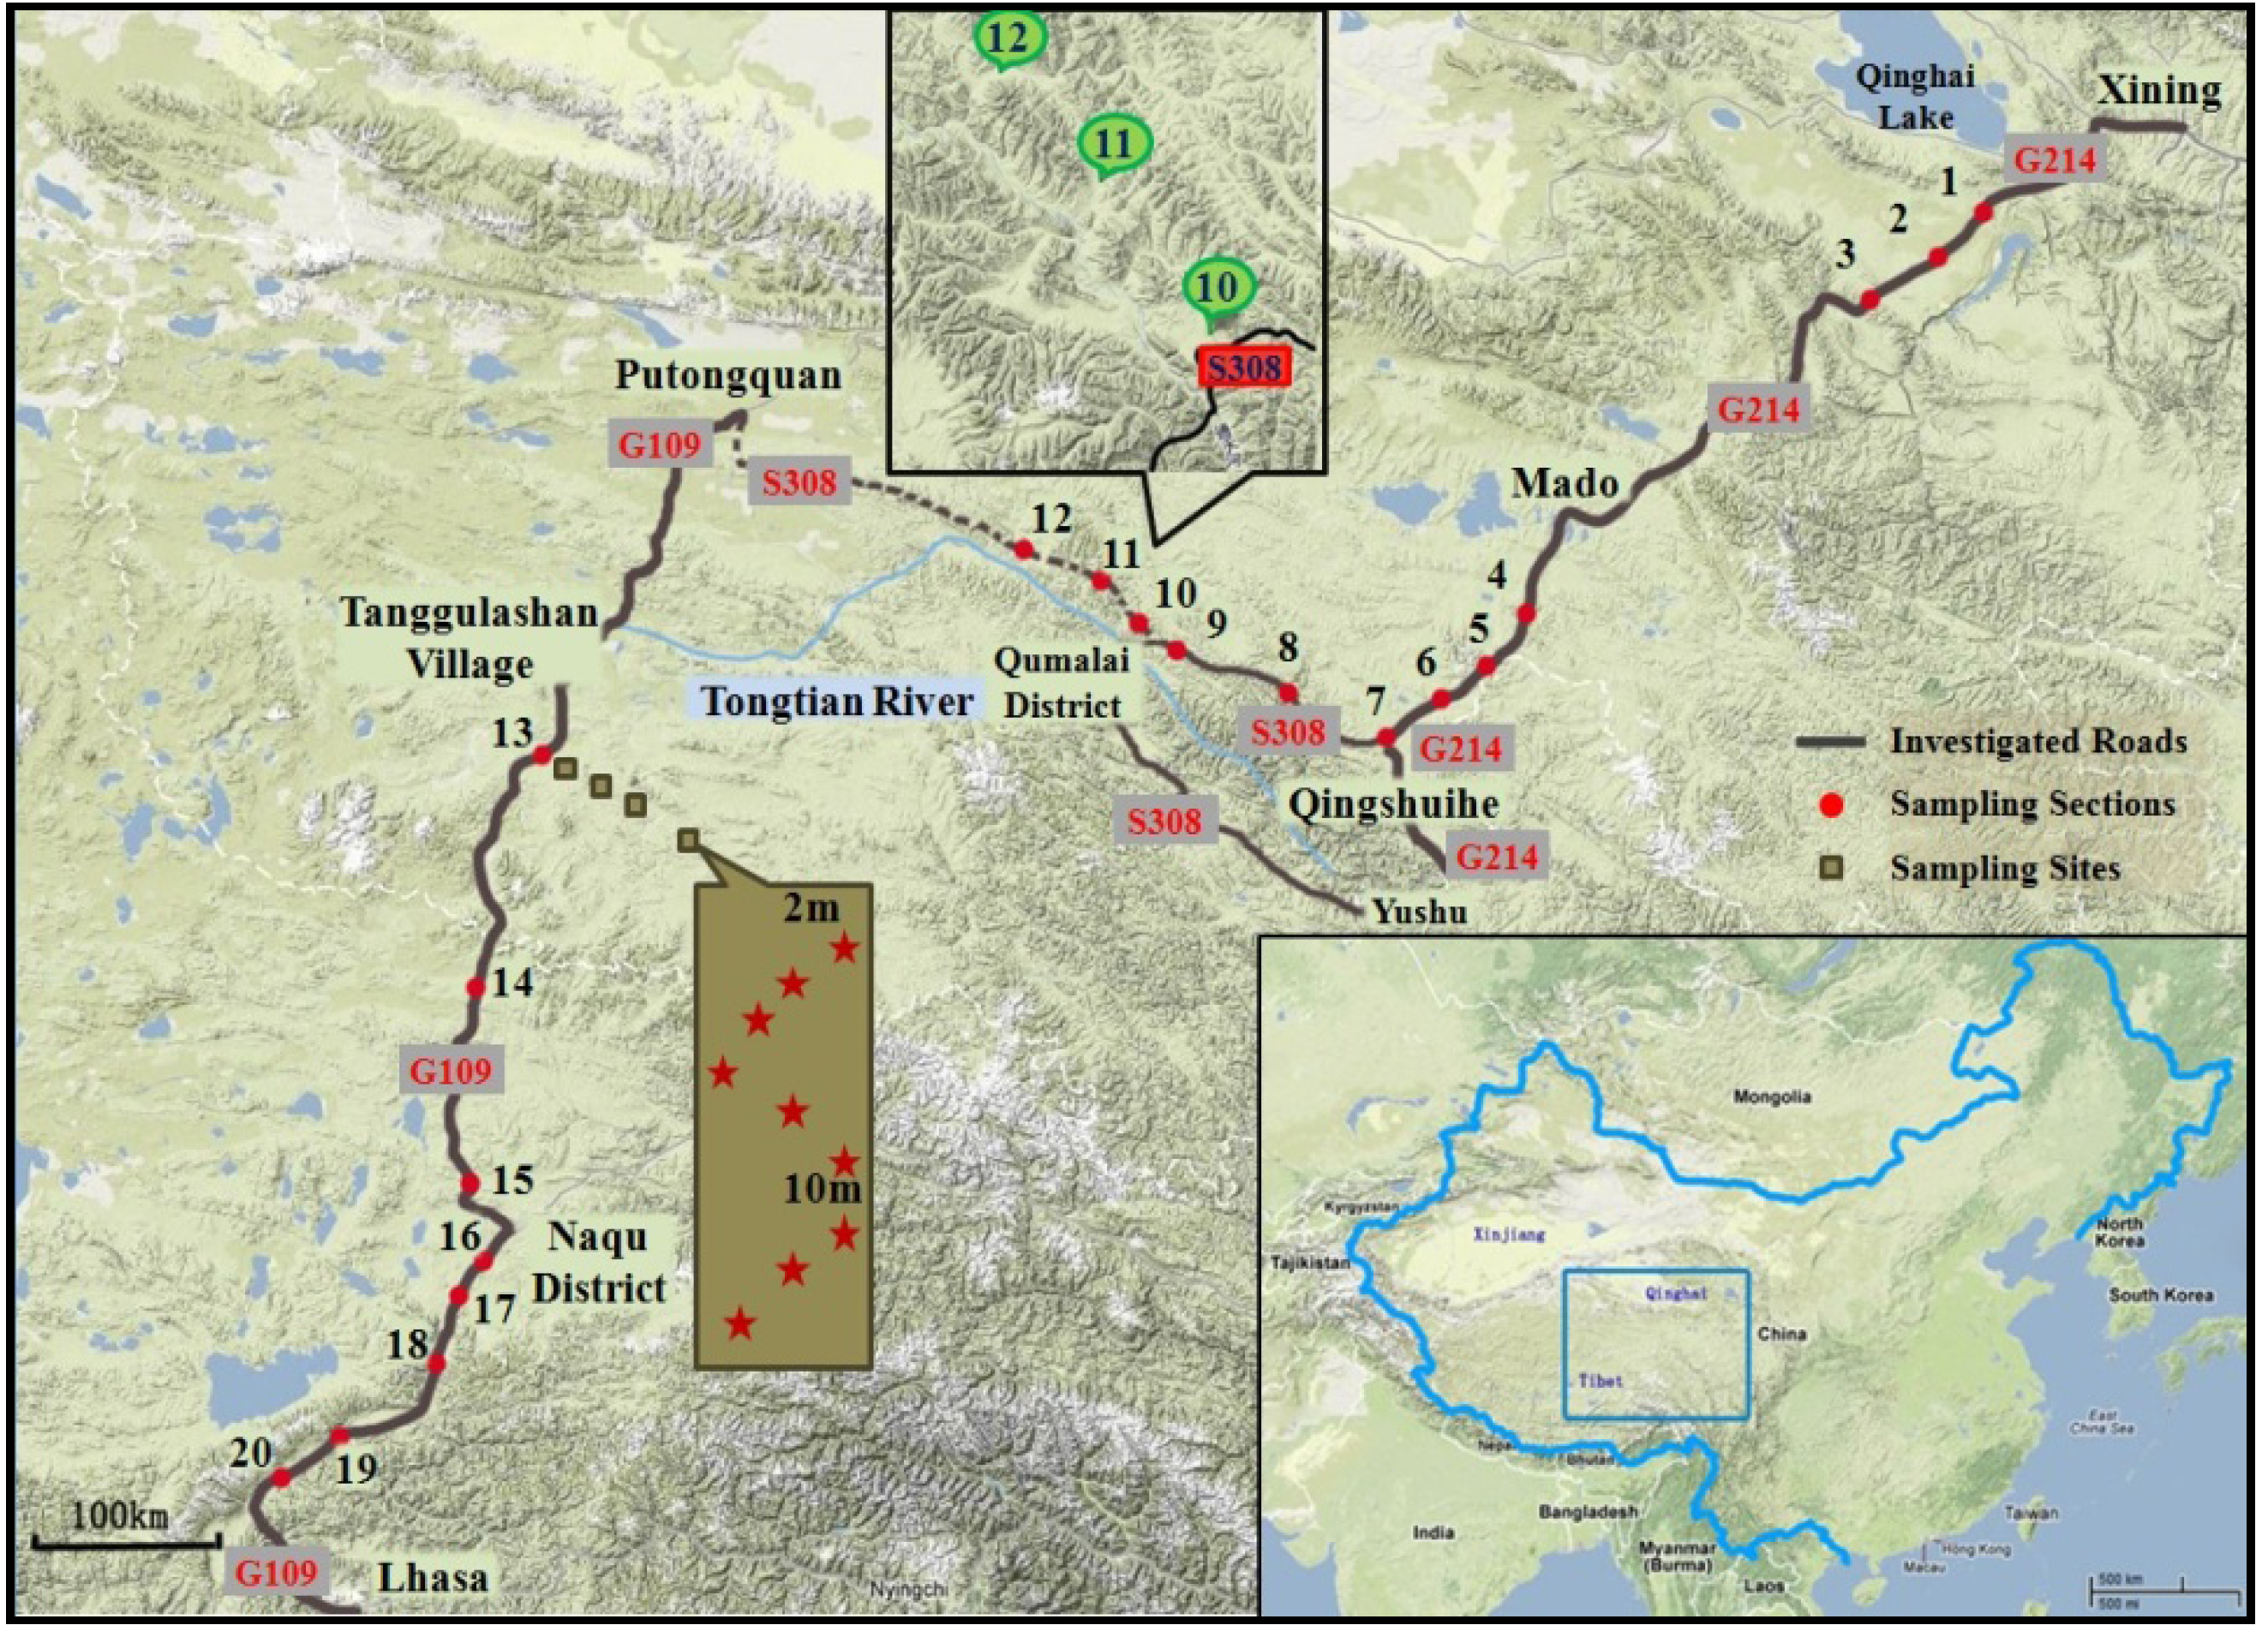

| Road | G109 | S308 | G214 | |
|---|---|---|---|---|
| No. of the road sections | 1–7 | 8–9 | 10–12 | 13–20 |
| Traffic Volume | Medium | Medium | Low | High |
| Altitude (m a.s.l.) | 3,771–4,500 | 4,000–4,500 | 4,500–5,000 | |
2.2. Soil Sampling and Processing
| Independent Variable | N | Variable Definition | Discrete Level |
|---|---|---|---|
| DIST | 20 | The distance from the sampling location perpendicular to the road edge | Level 1: 0 m |
| 20 | Level 2: 10 m | ||
| 20 | Level 3: 30 m | ||
| 20 | Level 4: 50 m | ||
| 20 | Level 5: 100 m | ||
| LAND COVER | 45 | Land cover different types of land cover | Level 1: Meadow soil |
| 30 | Level 2: High sandy meadow soil | ||
| 25 | Level 3: Low sandy meadow soil | ||
| VOLUME | 40 | Three levels of traffic volume | Level 1: HIGH—traffic volume above 200 vehicles per hour; |
| 15 | Level 2: LOW—traffic volume below 50 vehicles per hour; | ||
| 45 | Level 3: MEDIUM—— traffic volumebetween 50 and 200 vehicles per hour. |
2.3. Grass Sampling and Processing
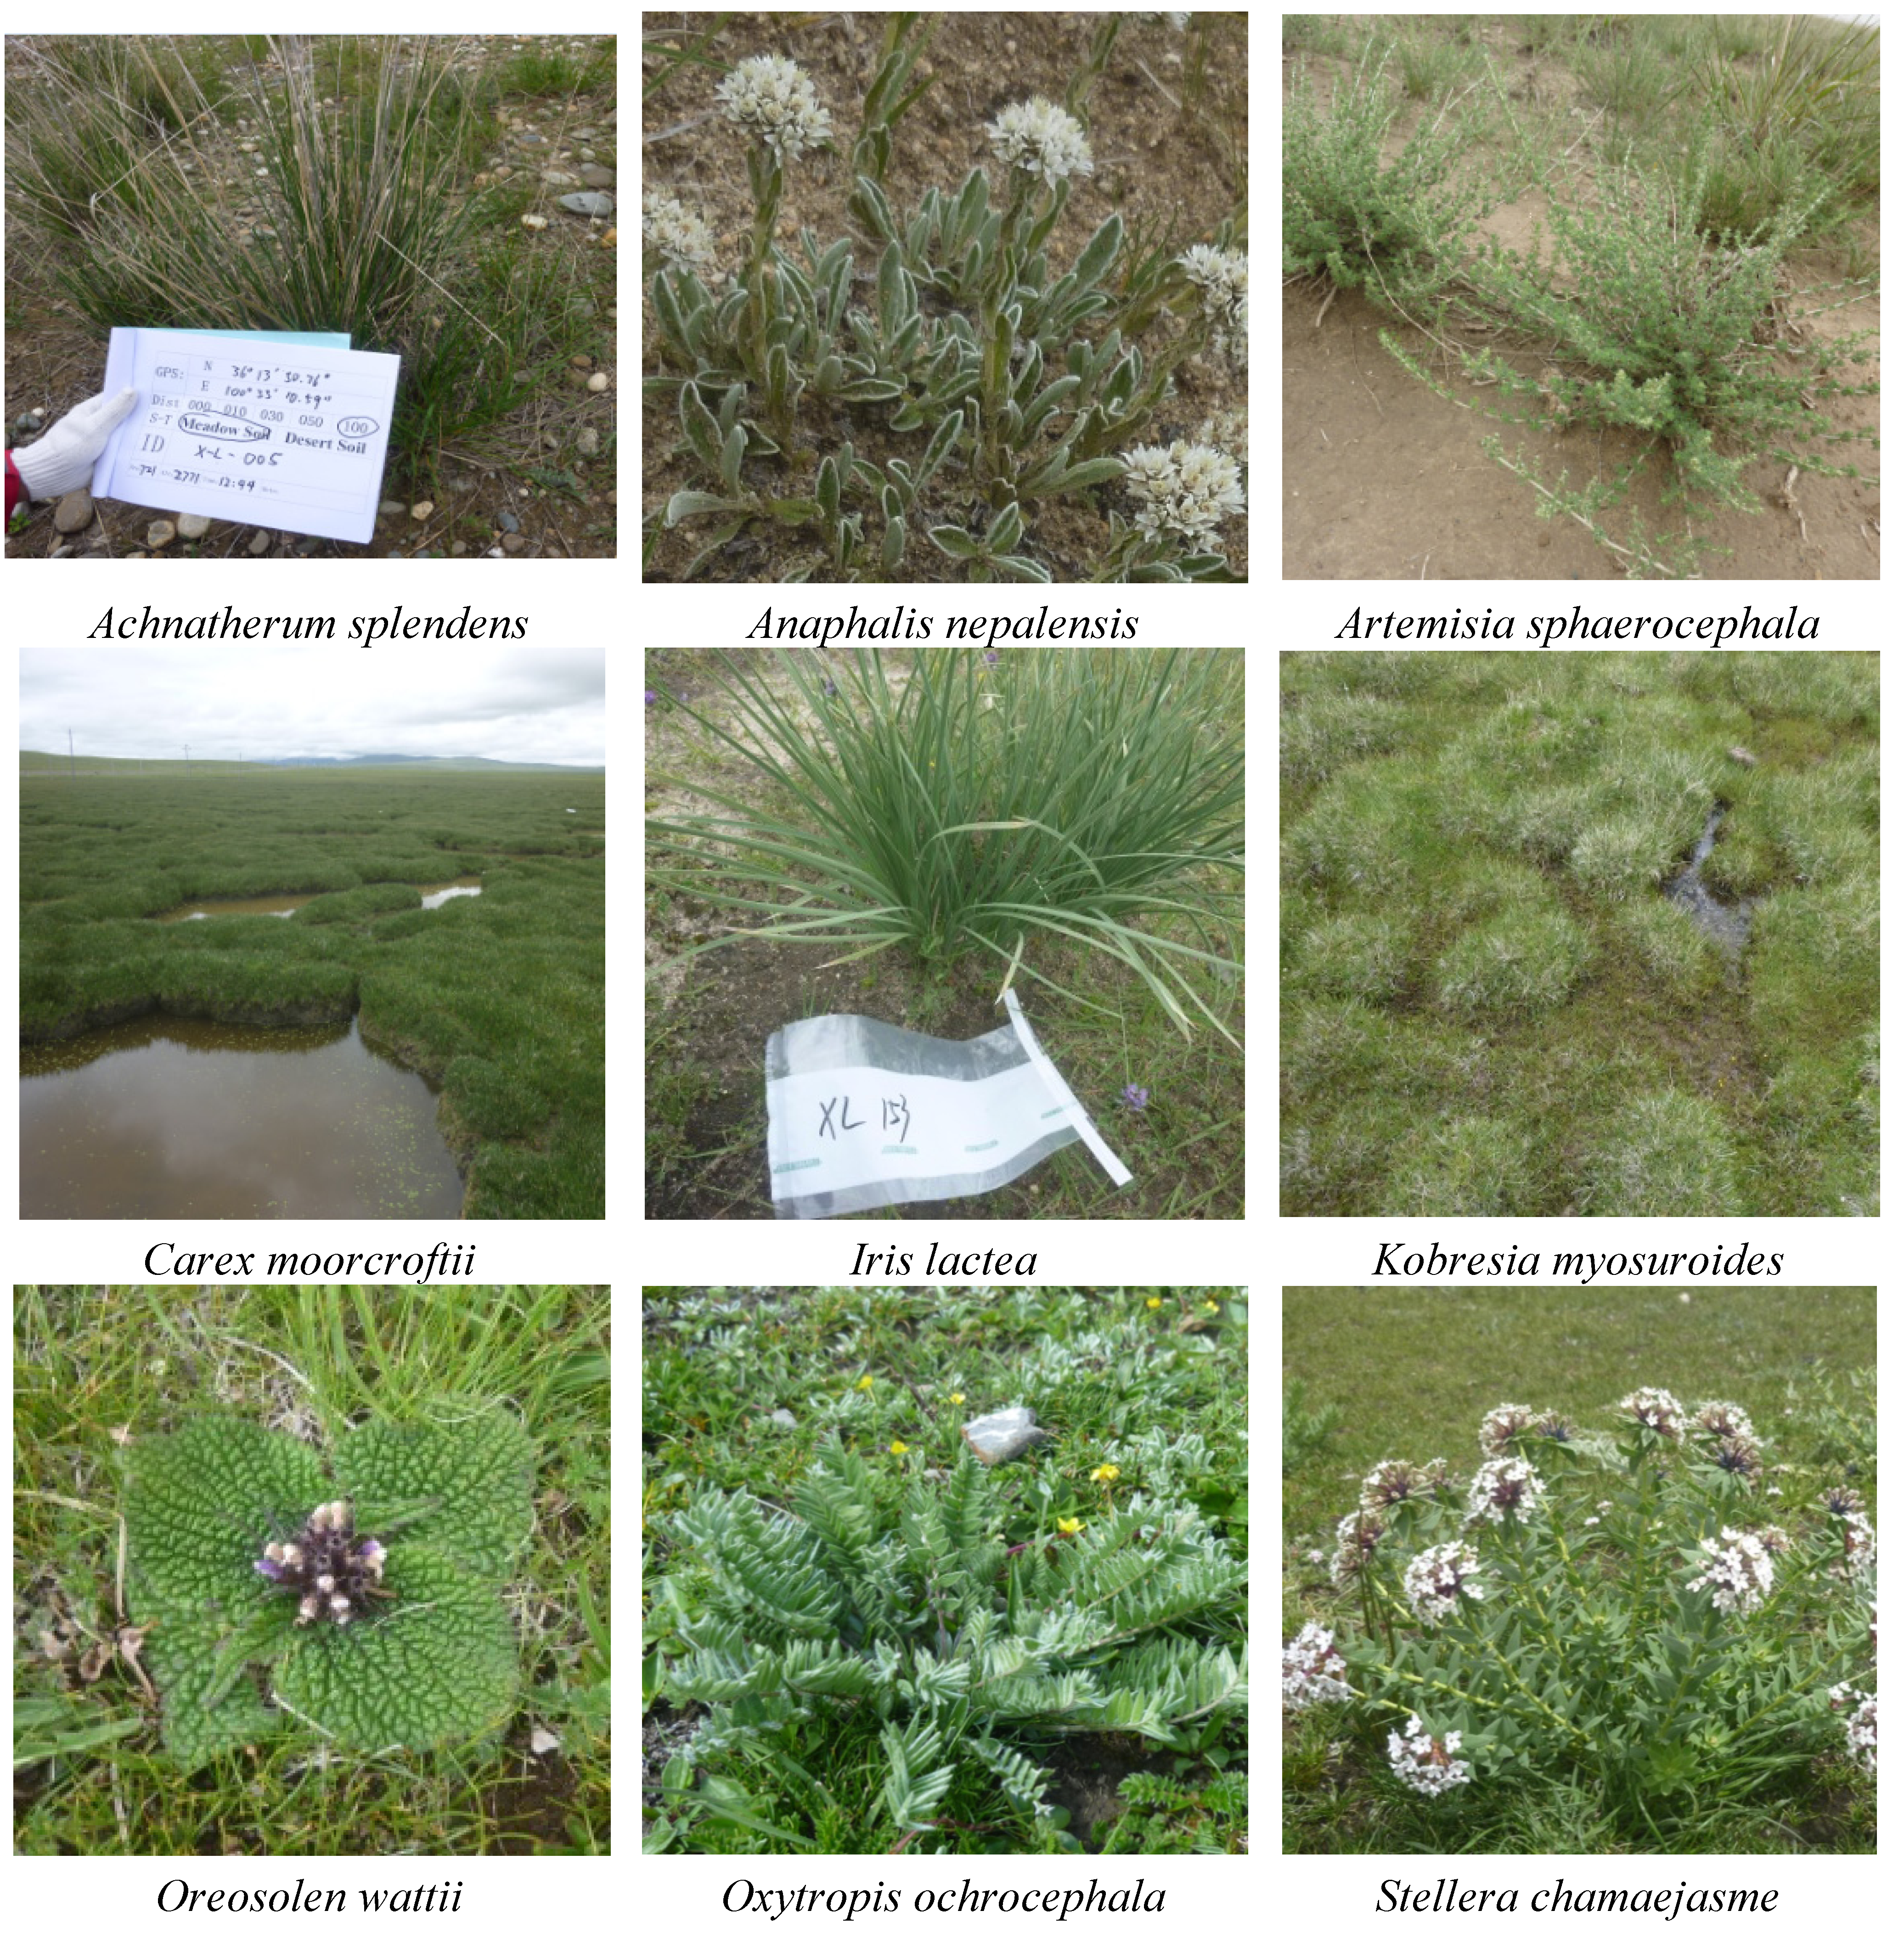
| Name of the Grasses | Achnatherum splendens | Anaphalis nepalensis | Artemisia sphaerocephala | Carex moorcroftii | Iris lactea | Kobresia myosuroides | Oreosolen wattii | Oxytropis ochrocephala | Stellera chamaejasme | |
|---|---|---|---|---|---|---|---|---|---|---|
| Family | Gramineae | Compositae | Compositae | Cyperaceae | Iridaceae | Cyperaceae | Scrophulariaceae | Fabaceae | Thymelaeaceae | |
| Genus | Achnatherum | Anaphalis | Artemisia | Carex | Iris | Kobresia | Oreosolen | Oxytropis | Stellera | |
| DIST | 0 m | 1 | 4 | 1 | 3 | 1 | 4 | 1 | 4 | 1 |
| 10 m | 1 | 4 | 1 | 3 | 1 | 4 | 1 | 4 | 1 | |
| 30 m | 1 | 4 | 1 | 3 | 1 | 4 | 1 | 4 | 1 | |
| 50 m | 1 | 4 | 1 | 3 | 1 | 4 | 1 | 4 | 1 | |
| 100 m | 1 | 4 | 1 | 3 | 1 | 4 | 1 | 4 | 1 | |
| LAND COVER | Level 1 | 0 | 5 | 0 | 15 | 0 | 15 | 5 | 5 | 0 |
| Level 2 | 5 | 10 | 0 | 0 | 0 | 5 | 0 | 5 | 5 | |
| Level 3 | 0 | 5 | 5 | 0 | 5 | 0 | 0 | 10 | 0 | |
| VOLUME | HIGH | 0 | 15 | 0 | 5 | 5 | 5 | 5 | 0 | 5 |
| LOW | 0 | 5 | 0 | 0 | 0 | 5 | 0 | 5 | 0 | |
| MEDIUM | 5 | 0 | 5 | 10 | 0 | 10 | 0 | 15 | 0 | |
| TOTAL | 5 | 20 | 5 | 15 | 5 | 20 | 5 | 20 | 5 | |
2.4. Data Analysis Methods

3. Results and Discussion
3.1. Trace Element Concentrations in Roadside Soil and Corresponding Grasses
| Cu-S | Zn-S | Cd-S | Pb-S | Cr-S | Co-S | Ni-S | As-S | |||||||||||
|---|---|---|---|---|---|---|---|---|---|---|---|---|---|---|---|---|---|---|
| Mean | S.D. | Mean | S.D. | Mean | S.D. | Mean | S.D. | Mean | S.D. | Mean | S.D. | Mean | S.D. | Mean | S.D. | |||
| DIST | 0 m | 26.80 | 5.02 | 114.57 | 32.41 | 0.43 | 0.40 | 41.83 | 31.64 | 37.48 | 11.01 | 10.96 | 2.01 | 37.09 | 24.38 | 21.99 | 4.91 | |
| 10 m | 22.74 | 4.04 | 104.68 | 26.22 | 0.28 | 0.13 | 28.85 | 12.97 | 37.37 | 10.14 | 10.30 | 1.88 | 31.66 | 8.40 | 22.03 | 6.36 | ||
| 30 m | 22.48 | 4.14 | 98.86 | 16.72 | 0.26 | 0.12 | 25.76 | 9.21 | 37.59 | 9.14 | 10.29 | 1.73 | 32.11 | 7.20 | 21.89 | 6.36 | ||
| 50 m | 20.90 | 4.35 | 93.01 | 16.04 | 0.22 | 0.09 | 24.64 | 9.14 | 34.81 | 6.07 | 9.89 | 1.77 | 30.49 | 5.83 | 20.79 | 5.93 | ||
| 100 m | 21.28 | 4.69 | 91.68 | 14.25 | 0.22 | 0.08 | 22.67 | 7.56 | 36.84 | 7.81 | 9.74 | 1.86 | 30.85 | 5.19 | 20.43 | 5.71 | ||
| LAND COVER | Level 1 | 21.35 | 4.43 | 93.49 | 12.06 | 0.24 | 0.07 | 23.98 | 9.37 | 37.89 | 11.56 | 9.86 | 1.86 | 32.46 | 9.07 | 19.01 | 6.00 | |
| Level 2 | 24.47 | 4.85 | 113.05 | 31.57 | 0.36 | 0.33 | 39.48 | 25.38 | 37.49 | 6.09 | 10.38 | 1.10 | 30.98 | 4.71 | 24.42 | 4.52 | ||
| Level 3 | 23.57 | 4.98 | 98.29 | 22.13 | 0.26 | 0.18 | 24.46 | 12.42 | 34.09 | 5.00 | 10.74 | 2.44 | 34.16 | 21.36 | 22.17 | 5.03 | ||
| VOLUME | HIGH | 21.65 | 5.30 | 110.49 | 31.30 | 0.35 | 0.32 | 40.76 | 23.09 | 39.75 | 11.60 | 9.83 | 1.92 | 32.71 | 10.25 | 23.13 | 7.16 | |
| MEDIUM | 24.04 | 4.29 | 94.17 | 12.70 | 0.24 | 0.06 | 20.66 | 3.79 | 35.81 | 6.10 | 10.58 | 1.94 | 30.06 | 4.02 | 20.00 | 4.61 | ||
| LOW | 22.41 | 4.68 | 93.28 | 12.65 | 0.23 | 0.04 | 21.00 | 3.02 | 32.03 | 3.75 | 10.29 | 1.25 | 38.86 | 26.28 | 21.13 | 3.67 | ||
| Total | 22.84 | 4.86 | 100.56 | 23.38 | 0.28 | 0.21 | 28.75 | 17.75 | 36.82 | 8.88 | 10.24 | 1.86 | 32.44 | 12.45 | 21.43 | 5.80 | ||
| Background Value | Qinghai | 22.2 | 80.3 | 0.14 | 20.9 | 70.1 | 10.1 | 29.6 | 14.0 | |||||||||
| Tibet | 21.9 | 74.0 | 0.08 | 29.1 | 76.6 | 11.8 | 32.1 | 19.7 | ||||||||||
| Mean | 22.1 | 77.2 | 0.11 | 25.0 | 73.4 | 11.0 | 30.9 | 16.9 | ||||||||||
| Cu-G | Zn-G | Cd-G | Pb-G | Cr-G | Co-G | Ni-G | As-G | ||||||||||
|---|---|---|---|---|---|---|---|---|---|---|---|---|---|---|---|---|---|
| Mean | S.D. | Mean | S.D. | Mean | S.D. | Mean | S.D. | Mean | S.D. | Mean | S.D. | Mean | S.D. | Mean | S.D. | ||
| DIST | 0 m | 9.38 | 5.41 | 33.89 | 14.29 | 0.10 | 0.15 | 3.49 | 5.88 | 15.61 | 16.07 | 0.64 | 1.05 | 4.41 | 4.94 | 1.64 | 2.57 |
| 10 m | 10.29 | 5.32 | 32.98 | 15.06 | 0.06 | 0.09 | 2.65 | 4.86 | 15.67 | 19.07 | 0.76 | 1.34 | 4.77 | 5.69 | 1.77 | 2.68 | |
| 30 m | 10.29 | 5.63 | 31.16 | 12.45 | 0.05 | 0.06 | 1.90 | 3.24 | 14.98 | 14.01 | 0.55 | 0.72 | 4.08 | 3.52 | 1.30 | 1.41 | |
| 50 m | 9.24 | 3.76 | 28.10 | 10.48 | 0.04 | 0.04 | 1.25 | 1.93 | 13.46 | 13.01 | 0.45 | 0.69 | 3.46 | 2.82 | 1.04 | 1.23 | |
| 100 m | 10.04 | 7.26 | 31.22 | 15.15 | 0.04 | 0.05 | 1.01 | 1.50 | 11.09 | 7.54 | 0.36 | 0.56 | 3.45 | 2.80 | 0.90 | 1.04 | |
| LAND COVER | Level 1 | 8.33 | 3.62 | 33.76 | 11.66 | 0.03 | 0.05 | 1.23 | 3.03 | 10.87 | 10.95 | 0.40 | 0.98 | 3.66 | 4.51 | 1.15 | 2.28 |
| Level 2 | 11.59 | 7.41 | 33.31 | 16.87 | 0.09 | 0.13 | 4.18 | 5.51 | 22.43 | 19.56 | 0.88 | 0.99 | 5.12 | 4.38 | 1.93 | 1.81 | |
| Level 3 | 10.49 | 5.05 | 25.14 | 9.99 | 0.06 | 0.08 | 0.99 | 1.02 | 10.18 | 5.87 | 0.42 | 0.52 | 3.40 | 2.40 | 0.94 | 0.92 | |
| VOLUME | HIGH | 10.86 | 6.89 | 36.69 | 16.89 | 0.09 | 0.11 | 4.01 | 5.53 | 19.75 | 20.51 | 0.85 | 1.26 | 5.23 | 5.84 | 1.96 | 2.74 |
| MEDIUM | 9.16 | 4.46 | 30.07 | 9.68 | 0.03 | 0.07 | 0.63 | 0.91 | 9.55 | 5.37 | 0.31 | 0.45 | 3.18 | 1.77 | 0.83 | 0.74 | |
| LOW | 9.22 | 3.72 | 21.73 | 3.02 | 0.02 | 0.00 | 1.15 | 1.03 | 13.12 | 4.11 | 0.48 | 0.57 | 3.41 | 2.33 | 1.15 | 1.06 | |
| PLANT TYPE | Ac.S. | 5.17 | 1.55 | 14.48 | 3.72 | 0.00 | 0.00 | 0.11 | 0.16 | 7.38 | 3.29 | 0.01 | 0.02 | 1.15 | 0.38 | 0.43 | 0.25 |
| A.N. | 15.26 | 7.18 | 39.29 | 17.36 | 0.13 | 0.14 | 6.90 | 6.44 | 34.31 | 19.38 | 1.64 | 1.39 | 8.93 | 6.25 | 3.59 | 3.10 | |
| Ar.S. | 18.94 | 2.84 | 27.85 | 4.72 | 0.16 | 0.13 | 2.14 | 0.51 | 14.91 | 2.52 | 1.00 | 0.24 | 4.11 | 0.60 | 1.75 | 0.35 | |
| C.M. | 7.98 | 2.36 | 39.03 | 14.77 | 0.00 | 0.01 | 0.29 | 0.34 | 9.71 | 7.17 | 0.08 | 0.14 | 2.55 | 0.94 | 0.45 | 0.30 | |
| I.L. | 4.59 | 0.40 | 11.16 | 1.89 | 0.04 | 0.02 | 0.14 | 0.32 | 2.85 | 1.52 | 0.00 | 0.00 | 0.17 | 0.15 | 0.19 | 0.22 | |
| K.M. | 7.48 | 2.27 | 27.30 | 8.44 | 0.04 | 0.06 | 1.13 | 1.90 | 11.21 | 6.09 | 0.23 | 0.26 | 2.49 | 1.27 | 0.75 | 0.52 | |
| O.W. | 5.15 | 0.75 | 30.26 | 7.00 | 0.04 | 0.03 | 0.89 | 0.55 | 4.83 | 1.36 | 0.03 | 0.04 | 1.54 | 0.27 | 0.18 | 0.19 | |
| O.O. | 10.19 | 3.45 | 29.86 | 6.20 | 0.03 | 0.02 | 1.12 | 1.24 | 9.60 | 5.69 | 0.54 | 0.63 | 4.89 | 2.02 | 1.24 | 1.18 | |
| S.C. | 7.45 | 1.41 | 42.75 | 3.96 | 0.03 | 0.01 | 0.45 | 0.63 | 3.69 | 0.90 | 0.10 | 0.08 | 0.80 | 0.19 | 0.38 | 0.12 | |
| Total | 9.85 | 5.49 | 31.47 | 13.48 | 0.05 | 0.09 | 2.06 | 3.89 | 14.16 | 14.26 | 0.55 | 0.91 | 4.03 | 4.07 | 1.33 | 1.91 | |
3.2. MANOVA of Trace Element Concentrations and Independent Factors
| Source | DIST | LAND COVER | VOLUME | ||||||
|---|---|---|---|---|---|---|---|---|---|
| df | F | Sig. | df | F | Sig. | df | F | Sig. | |
| Cu-S | 4 | 6.955 | 0.000 ** | 2 | 10.338 | 0.000 ** | 2 | 8.147 | 0.001 ** |
| Zn-S | 4 | 4.396 | 0.003 ** | 2 | 5.100 | 0.008 ** | 2 | 4.496 | 0.014 * |
| Cd-S | 4 | 4.119 | 0.004 ** | 2 | 2.267 | 0.109 | 2 | 2.309 | 0.105 |
| Pb-S | 4 | 6.958 | 0.000 ** | 2 | 4.720 | 0.011 * | 2 | 18.649 | 0.000 ** |
| Cr-S | 4 | 0.357 | 0.838 | 2 | 0.969 | 0.383 | 2 | 4.167 | 0.019 * |
| Co-S | 4 | 1.393 | 0.243 | 2 | 2.528 | 0.085 | 2 | 2.334 | 0.103 |
| Ni-S | 4 | 0.959 | 0.434 | 2 | 1.014 | 0.367 | 2 | 3.481 | 0.035 * |
| As-S | 4 | 0.393 | 0.814 | 2 | 7.146 | 0.001 ** | 2 | 1.381 | 0.257 |
| Source | DIST | LAND COVER | VOLUME | PLANT TYPE | ||||||||
|---|---|---|---|---|---|---|---|---|---|---|---|---|
| df | F | Sig. | df | F | Sig. | df | F | Sig. | df | F | Sig. | |
| Cu-G | 4 | 0.365 | 0.833 | 2 | 2.925 | 0.059 | 2 | 2.103 | 0.129 | 8 | 13.962 | 0.000 ** |
| Zn-G | 4 | 0.989 | 0.418 | 2 | 0.532 | 0.590 | 2 | 11.157 | 0.000 ** | 8 | 7.475 | 0.000 ** |
| Cd-G | 4 | 3.206 | 0.017 * | 2 | 3.723 | 0.028 * | 2 | 4.611 | 0.013 * | 8 | 6.836 | 0.000 ** |
| Pb-G | 4 | 3.097 | 0.020 * | 2 | 5.437 | 0.006 ** | 2 | 5.147 | 0.008 ** | 8 | 9.731 | 0.000 ** |
| Cr-G | 4 | 1.039 | 0.392 | 2 | 11.863 | 0.000 ** | 2 | 3.411 | 0.038 * | 8 | 17.516 | 0.000 ** |
| Co-G | 4 | 1.166 | 0.332 | 2 | 5.173 | 0.008 ** | 2 | 2.149 | 0.123 | 8 | 10.958 | 0.000 ** |
| Ni-G | 4 | 0.871 | 0.485 | 2 | 3.105 | 0.050 * | 2 | 5.998 | 0.004 ** | 8 | 13.878 | 0.000 ** |
| As-G | 4 | 1.397 | 0.242 | 2 | 5.136 | 0.008 ** | 2 | 2.572 | 0.082 | 8 | 9.685 | 0.000 ** |
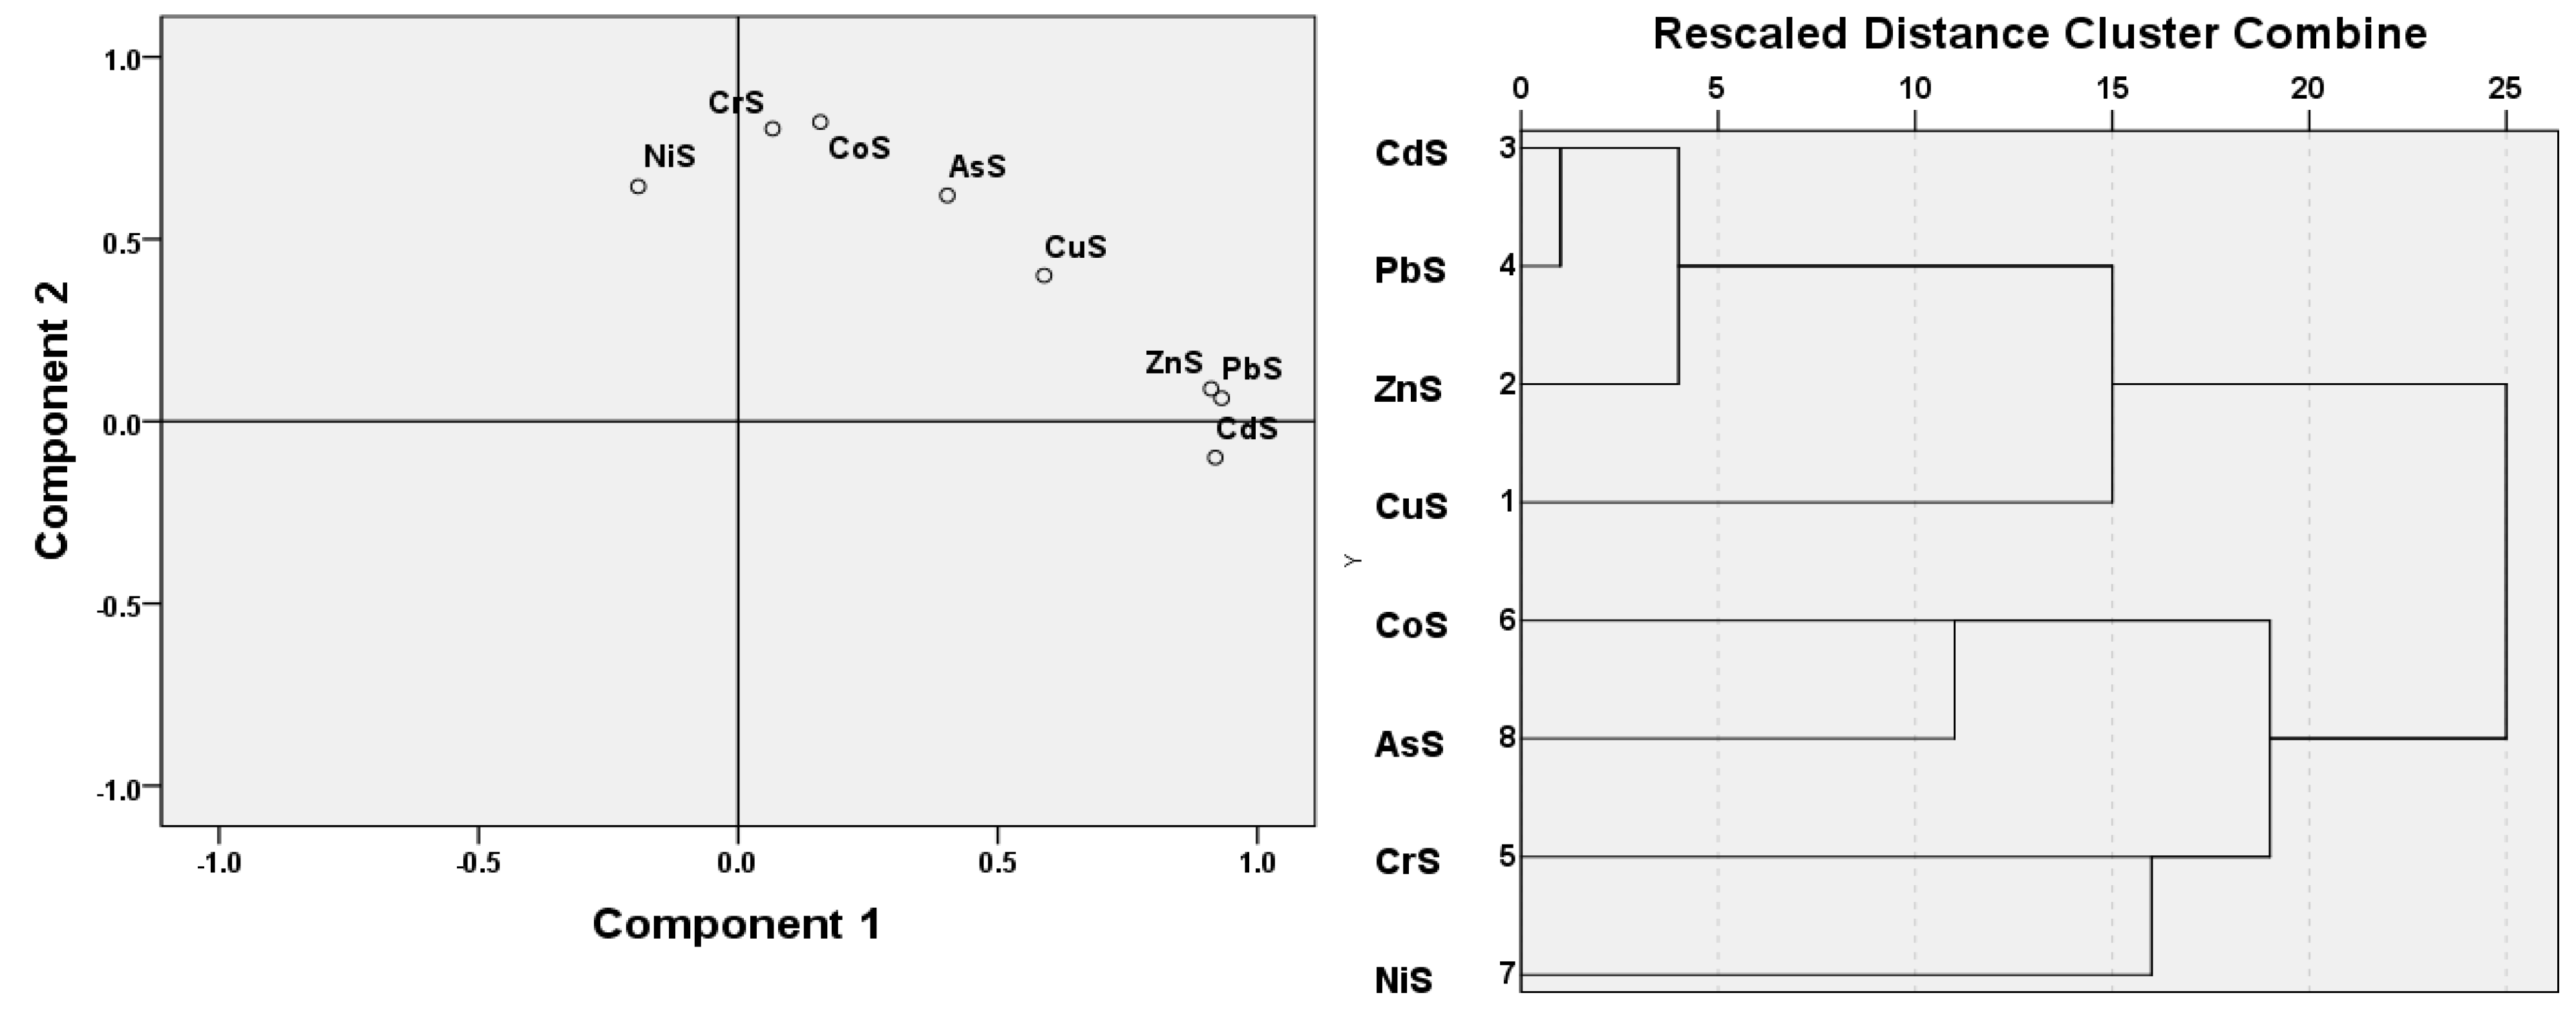
3.3. Interrelationship Analysis of Trace Elements
| Pearson Correlation | Cu-S | Zn-S | Cd-S | Pb-S | Cr-S | Co-S | Ni-S | As-S |
|---|---|---|---|---|---|---|---|---|
| Cu-S | 1.000 | 0.531 ** | 0.423 ** | 0.392 ** | 0.294 ** | 0.568 ** | 0.059 | 0.393 ** |
| Zn-S | 0.531 ** | 1.000 | 0.742 ** | 0.828 ** | 0.166 | 0.275 ** | 0.003 | 0.431 ** |
| Cd-S | 0.423 ** | 0.742 ** | 1.000 | 0.873 ** | 0.001 | 0.129 | -0.071 | 0.344 ** |
| Pb-S | 0.392 ** | 0.828 ** | 0.873 ** | 1.000 | 0.202 * | 0.193 | 0.027 | 0.409 ** |
| Cr-S | 0.294 ** | 0.166 | 0.001 | 0.202 * | 1.000 | 0.434 ** | 0.490 ** | 0.288 ** |
| Co-S | 0.568 ** | 0.275 ** | 0.129 | 0.193 | 0.434 ** | 1.000 | 0.323 ** | 0.626 ** |
| Ni-S | 0.059 | 0.003 | 0.071 | 0.027 | 0.490 ** | 0.323 ** | 1.000 | 0.210 * |
| As-S | 0.393 ** | 0.431 ** | 0.344 ** | 0.409 ** | 0.288 ** | 0.626 ** | 0.210 * | 1.000 |
| Pearson Correlation | Cu-G | Zn-G | Cd-G | Pb-G | Cr-G | Co-G | Ni-G | As-G |
|---|---|---|---|---|---|---|---|---|
| Cu-G | 1.000 | 0.528 ** | 0.656 ** | 0.627 ** | 0.622 ** | 0.590 ** | 0.618 ** | 0.540 ** |
| Zn-G | 0.528 ** | 1.000 | 0.490 ** | 0.529 ** | 0.409 ** | 0.443 ** | 0.515 ** | 0.426 ** |
| Cd-G | 0.656 ** | 0.490 ** | 1.000 | 0.777 ** | 0.643 ** | 0.566 ** | 0.565 ** | 0.543 ** |
| Pb-G | 0.627 ** | 0.529 ** | 0.777 ** | 1.000 | 0.873 ** | 0.829 ** | 0.837 ** | 0.828 ** |
| Cr-G | 0.622 ** | 0.409 ** | 0.643 ** | 0.873 ** | 1.000 | 0.850 ** | 0.841 ** | 0.817 ** |
| Co-G | 0.590 ** | 0.443 ** | 0.566 ** | 0.829 ** | 0.850 ** | 1.000 | 0.948 ** | 0.979 ** |
| Ni-G | 0.618 ** | 0.515 ** | 0.565 ** | 0.837 ** | 0.841 ** | 0.948 ** | 1.000 | 0.948 ** |
| As-G | 0.540 ** | 0.426 ** | 0.543 ** | 0.828 ** | 0.817 ** | 0.979 ** | 0.948 ** | 1.000 |

3.4. Transfer Factor of Trace element from Soil to Grasses
| Cu-TF | Zn-TF | Cd-TF | Pb-TF | Cr-TF | Co-TF | Ni-TF | As-TF | ||||||||||
|---|---|---|---|---|---|---|---|---|---|---|---|---|---|---|---|---|---|
| Mean | SD | Mean | SD | Mean | SD | Mean | SD | Mean | SD | Mean | SD | Mean | SD | Mean | SD | ||
| DIST | 0 m | 0.36 | 0.19 | 0.31 | 0.14 | 0.29 | 0.47 | 0.07 | 0.09 | 0.41 | 0.39 | 0.06 | 0.08 | 0.13 | 0.10 | 0.07 | 0.08 |
| 10 m | 0.46 | 0.24 | 0.32 | 0.13 | 0.19 | 0.26 | 0.07 | 0.10 | 0.40 | 0.44 | 0.07 | 0.11 | 0.14 | 0.14 | 0.08 | 0.10 | |
| 30 m | 0.46 | 0.25 | 0.32 | 0.12 | 0.22 | 0.31 | 0.07 | 0.10 | 0.40 | 0.39 | 0.05 | 0.07 | 0.12 | 0.10 | 0.06 | 0.06 | |
| 50 m | 0.45 | 0.19 | 0.31 | 0.13 | 0.19 | 0.24 | 0.05 | 0.07 | 0.39 | 0.40 | 0.04 | 0.08 | 0.11 | 0.11 | 0.05 | 0.06 | |
| 100 m | 0.49 | 0.38 | 0.35 | 0.17 | 0.18 | 0.25 | 0.04 | 0.06 | 0.30 | 0.20 | 0.03 | 0.05 | 0.11 | 0.08 | 0.04 | 0.05 | |
| LAND COVER | Level 1 | 0.41 | 0.19 | 0.36 | 0.12 | 0.12 | 0.19 | 0.04 | 0.07 | 0.26 | 0.17 | 0.03 | 0.07 | 0.10 | 0.07 | 0.05 | 0.07 |
| Level 2 | 0.50 | 0.38 | 0.31 | 0.16 | 0.31 | 0.39 | 0.10 | 0.12 | 0.62 | 0.55 | 0.09 | 0.10 | 0.17 | 0.15 | 0.09 | 0.08 | |
| Level 3 | 0.44 | 0.17 | 0.26 | 0.11 | 0.26 | 0.34 | 0.05 | 0.05 | 0.30 | 0.18 | 0.04 | 0.05 | 0.10 | 0.07 | 0.05 | 0.04 | |
| VOLUME | HIGH | 0.52 | 0.33 | 0.35 | 0.17 | 0.32 | 0.35 | 0.09 | 0.12 | 0.49 | 0.53 | 0.08 | 0.11 | 0.15 | 0.15 | 0.08 | 0.10 |
| LOW | 0.43 | 0.18 | 0.24 | 0.03 | 0.09 | 0.03 | 0.05 | 0.05 | 0.42 | 0.16 | 0.05 | 0.05 | 0.10 | 0.07 | 0.05 | 0.05 | |
| MEDIUM | 0.39 | 0.18 | 0.32 | 0.11 | 0.16 | 0.31 | 0.03 | 0.04 | 0.27 | 0.14 | 0.03 | 0.04 | 0.10 | 0.05 | 0.04 | 0.04 | |
| PLANT TYPE | Achnatherum splendens | 0.19 | 0.07 | 0.15 | 0.06 | 0.01 | 0.01 | 0.00 | 0.01 | 0.22 | 0.12 | 0.00 | 0.00 | 0.04 | 0.01 | 0.02 | 0.01 |
| Anaphalis nepalensis | 0.74 | 0.35 | 0.39 | 0.14 | 0.53 | 0.39 | 0.17 | 0.12 | 0.85 | 0.54 | 0.15 | 0.11 | 0.24 | 0.16 | 0.15 | 0.10 | |
| Artemisia sphaerocephala | 0.66 | 0.11 | 0.34 | 0.06 | 0.70 | 0.58 | 0.11 | 0.03 | 0.39 | 0.06 | 0.09 | 0.02 | 0.14 | 0.02 | 0.10 | 0.02 | |
| Carex moorcroftii | 0.37 | 0.14 | 0.41 | 0.13 | 0.02 | 0.04 | 0.01 | 0.01 | 0.26 | 0.19 | 0.01 | 0.01 | 0.09 | 0.03 | 0.03 | 0.02 | |
| Iris lactea | 0.22 | 0.05 | 0.10 | 0.01 | 0.14 | 0.10 | 0.00 | 0.00 | 0.10 | 0.06 | 0.00 | 0.00 | 0.01 | 0.01 | 0.01 | 0.01 | |
| Kobresia myosuroides | 0.33 | 0.11 | 0.27 | 0.12 | 0.12 | 0.22 | 0.02 | 0.03 | 0.32 | 0.16 | 0.02 | 0.02 | 0.08 | 0.04 | 0.04 | 0.03 | |
| Oreosolen wattii | 0.33 | 0.08 | 0.39 | 0.17 | 0.12 | 0.03 | 0.03 | 0.01 | 0.15 | 0.04 | 0.00 | 0.00 | 0.05 | 0.01 | 0.01 | 0.01 | |
| Oxytropis ochrocephala | 0.45 | 0.19 | 0.31 | 0.06 | 0.13 | 0.11 | 0.05 | 0.06 | 0.29 | 0.18 | 0.05 | 0.06 | 0.15 | 0.06 | 0.06 | 0.05 | |
| Stellera chamaejasme | 0.31 | 0.04 | 0.41 | 0.04 | 0.13 | 0.03 | 0.01 | 0.01 | 0.09 | 0.03 | 0.01 | 0.01 | 0.02 | 0.00 | 0.01 | 0.01 | |
| Total | 0.44 | 0.26 | 0.32 | 0.14 | 0.21 | 0.31 | 0.06 | 0.09 | 0.38 | 0.37 | 0.05 | 0.08 | 0.12 | 0.11 | 0.06 | 0.07 | |
4. Conclusions
Acknowledgments
Conflicts of Interest
References
- Wiseman, C.L.S.; Zereini, F.; Püttmann, W. Traffic-related trace element fate and uptake by plants cultivated in roadside soils in Toronto, Canada. Sci. Total Environ. 2013, 442, 86–95. [Google Scholar] [CrossRef]
- Markert, B.; Wuenschmann, S.; Fraenzle, S.; Figueiredo, A.M.G.; Ribeiro, A.P.; Wang, M. Bioindication of atmospheric trace metals—With special references to megacities. Environ. Pollut. 2011, 159, 1991–1995. [Google Scholar] [CrossRef]
- Khan, S.; Khan, M.; Rehman, S. Lead and cadmium contamination of different roadside soils and plants in Peshawar City, Pakistan. Pedosphere 2011, 21, 351–357. [Google Scholar] [CrossRef]
- Yassoglou, N.; Kosmas, C.; Asimakopoulos, J.; Kallianou, C. Heavy metal contamination of roadside soils in the Greater Athens area. Environ. Pollut. 1987, 47, 293–304. [Google Scholar] [CrossRef]
- Liu, H.; Chen, L.-P.; Ai, Y.-W.; Yang, X.; Yu, Y.-H.; Zuo, Y.-B.; Fu, G.-Y. Heavy metal contamination in soil alongside mountain railway in Sichuan, China. Environ. Monit. Assess. 2009, 152, 25–33. [Google Scholar] [CrossRef]
- Chen, X.; Xia, X.; Zhao, Y.; Zhang, P. Heavy metal concentrations in roadside soils and correlation with urban traffic in Beijing, China. J. Hazard. Mater. 2010, 181, 640–646. [Google Scholar] [CrossRef]
- Wilcke, W.; Muller, S.; Kanchanakool, N.; Zech, W. Urban soil contamination in Bangkok: Heavy metal and aluminium partitioning in topsoils. Geoderma 1998, 86, 211–228. [Google Scholar] [CrossRef]
- Yan, X.; Gao, D.; Zhang, F.; Zeng, C.; Xiang, W.; Zhang, M. Relationships between heavy metal concentrations in roadside topsoil and distance to road edge based on field observations in the Qinghai-Tibet Plateau, China. Int. J. Environ. Res. Public health 2013, 10, 762–775. [Google Scholar] [CrossRef]
- Chen, Y. Chemical Analysis of Soil Heavy Metal Pollution to Plant; Science Press: Beijing, China, 2008. [Google Scholar]
- Jeffrey, D.W. Soil-Plant Relationships. An Ecological Approach; Croom Helm: Kent, UK, 1987. [Google Scholar]
- Baker, A.J.M.; Brooks, R. Terrestrial higher plants which hyperaccumulate metallic elements. A review of their distribution, ecology and phytochemistry. Biorecovery 1989, 1, 81–126. [Google Scholar]
- Salt, D.E.; Blaylock, M.; Kumar, N.P.B.A.; Dushenkov, V.; Ensley, B.D.; Chet, I.; Raskin, I. Phytoremediation: A novel strategy for the removal of toxic metals from the environment using plants. Nat. Biotechnol. 1995, 13, 468–474. [Google Scholar] [CrossRef]
- Baker, A.J.M.; McGrath, S.P.; Reeves, R.D.; Smith, J.A.C. Metal hyperaccumulator plants: A review of the ecology and physiology of a biological resource for phytoremediation of metal-polluted soils. Phytoremediat. Contam. Soil Water 2000, 2000, 85–107. [Google Scholar]
- Kang, S.; Zhang, Q. Scientific survey and monitoring of atmospheric pollution over the Tibetan Plateau. (in Chinese). Chin. J. Nat. 2010, 32, 13–18. [Google Scholar]
- Yao, T.; Thompson, L.G.; Mosbrugger, V.; Zhang, F.; Ma, Y.; Luo, T.; Xu, B.; Yang, X.; Joswiak, D.R.; Wang, W.; et al. Third pole environment (TPE). Environ. Dev. 2012, 3, 52–64. [Google Scholar] [CrossRef]
- Yan, X.; Zhang, F.; Gao, D.; Zeng, C.; Xiang, W.; Zhang, M. Accumulations of heavy metals in roadside soils close to Zhaling, Eling and Nam Co Lakes in the Tibetan Plateau. Int. J. Environ. Res. Public Health 2013, 10, 2384–2400. [Google Scholar]
- Chojnacka, K.; Chojnacki, A.; Gorecka, H.; Gorecki, H. Bioavailability of heavy metals from polluted soils to plants. Sci. Total Environ. 2005, 337, 175–182. [Google Scholar]
- Zhang, F.; Yan, X.; Zeng, C.; Zhang, M.; Shrestha, S.; Devkota, L.P.; Yao, T. Influence of traffic activity on heavy metal concentrations of roadside farmland soil in mountainous areas. Int. J. Environ. Res. Public Health 2012, 9, 1715–1731. [Google Scholar] [CrossRef]
- Department of Environment Protection of China. Background Values of Trace Elements in Soils of China; Background Values of Trace Elements in Soils of China: Beijing, China, 1990. [Google Scholar]
- Zhang, H.; Wang, Z.; Zhang, Y.; Hu, Z. The effects of the Qinghai–Tibet railway on heavy metals enrichment in soils. Sci. Total Environ. 2012, 439, 240–248. [Google Scholar] [CrossRef]
- Zaharescu, D.G.; Hooda, P.S.; Soler, A.P.; Fernandez, J.; Burghelea, C.I. Trace metals and their source in the catchment of the high altitude Lake Respomuso, Central Pyrenees. Sci. Total Environ. 2009, 407, 3546–3553. [Google Scholar] [CrossRef]
- Yan, X.; Zhang, F.; Zeng, C.; Zhang, M.; Devkota, L.P.; Yao, T. Relationship between heavy metal concentrations in soils and grasses of roadside farmland in Nepal. Int. J. Environ. Res. Public Health 2012, 9, 3209–3226. [Google Scholar]
- Ho, Y.B.; Tai, K.M. Elevated levels of lead and other metals in roadside soil and grass and their use to monitor aerial metal depositions in Hong Kong. Environ. Pollut. 1988, 49, 37–51. [Google Scholar] [CrossRef]
- Shi, G.; Chen, Z,; Xu, S.; Zhang, J.; Wang, L.; Bi, C.; Teng, J. Potentially toxic metal contamination of urban soils and roadside dust in Shanghai, China. Environ. Pollut. 2008, 156, 251–260. [Google Scholar] [CrossRef]
- Nabulo, G.; Oryem-Origa, H.; Diamond, M. Assessment of lead, cadmium, and zinc contamination of roadside soils, surface films, and vegetables in Kampala City, Uganda. Environ. Res. 2006, 101, 42–52. [Google Scholar] [CrossRef]
- Viard, B.; Pihan, F.; Promeyrat, S.; Pihan, J.-C. Integrated assessment of heavy metal (Pb, Zn, Cd) highway pollution: Bioaccumulation in soil, Graminaceae and land snails. Chemosphere 2004, 55, 1349–1359. [Google Scholar] [CrossRef]
- Puschenreiter, M.; Horak, O. Influence of different soil parameters on the transfer factor soil to plant of Cd, Cu and Zn for wheat and rye. Bodenkultur 2000, 51, 3–10. [Google Scholar]
- Panday, A.K.; Prinn, R.G. Diurnal cycle of air pollution in the Kathmandu Valley, Nepal: Observations. J. Geophys. Res. 2009, 114. [Google Scholar] [CrossRef]
- Legret, M.; Pagotto, C. Evaluation of pollutant loadings in the runoff waters from a major rural highway. Sci. Total Environ. 1999, 235, 143–150. [Google Scholar] [CrossRef]
© 2013 by the authors; licensee MDPI, Basel, Switzerland. This article is an open access article distributed under the terms and conditions of the Creative Commons Attribution license (http://creativecommons.org/licenses/by/3.0/).
Share and Cite
Wang, G.; Yan, X.; Zhang, F.; Zeng, C.; Gao, D. Traffic-Related Trace Element Accumulation in Roadside Soils and Wild Grasses in the Qinghai-Tibet Plateau, China. Int. J. Environ. Res. Public Health 2014, 11, 456-472. https://doi.org/10.3390/ijerph110100456
Wang G, Yan X, Zhang F, Zeng C, Gao D. Traffic-Related Trace Element Accumulation in Roadside Soils and Wild Grasses in the Qinghai-Tibet Plateau, China. International Journal of Environmental Research and Public Health. 2014; 11(1):456-472. https://doi.org/10.3390/ijerph110100456
Chicago/Turabian StyleWang, Guanxing, Xuedong Yan, Fan Zhang, Chen Zeng, and Dan Gao. 2014. "Traffic-Related Trace Element Accumulation in Roadside Soils and Wild Grasses in the Qinghai-Tibet Plateau, China" International Journal of Environmental Research and Public Health 11, no. 1: 456-472. https://doi.org/10.3390/ijerph110100456
APA StyleWang, G., Yan, X., Zhang, F., Zeng, C., & Gao, D. (2014). Traffic-Related Trace Element Accumulation in Roadside Soils and Wild Grasses in the Qinghai-Tibet Plateau, China. International Journal of Environmental Research and Public Health, 11(1), 456-472. https://doi.org/10.3390/ijerph110100456