Genetic k-Means Clustering Approach for Mapping Human Vulnerability to Chemical Hazards in the Industrialized City: A Case Study of Shanghai, China

Abstract
:1. Introduction
2. Materials and Methods
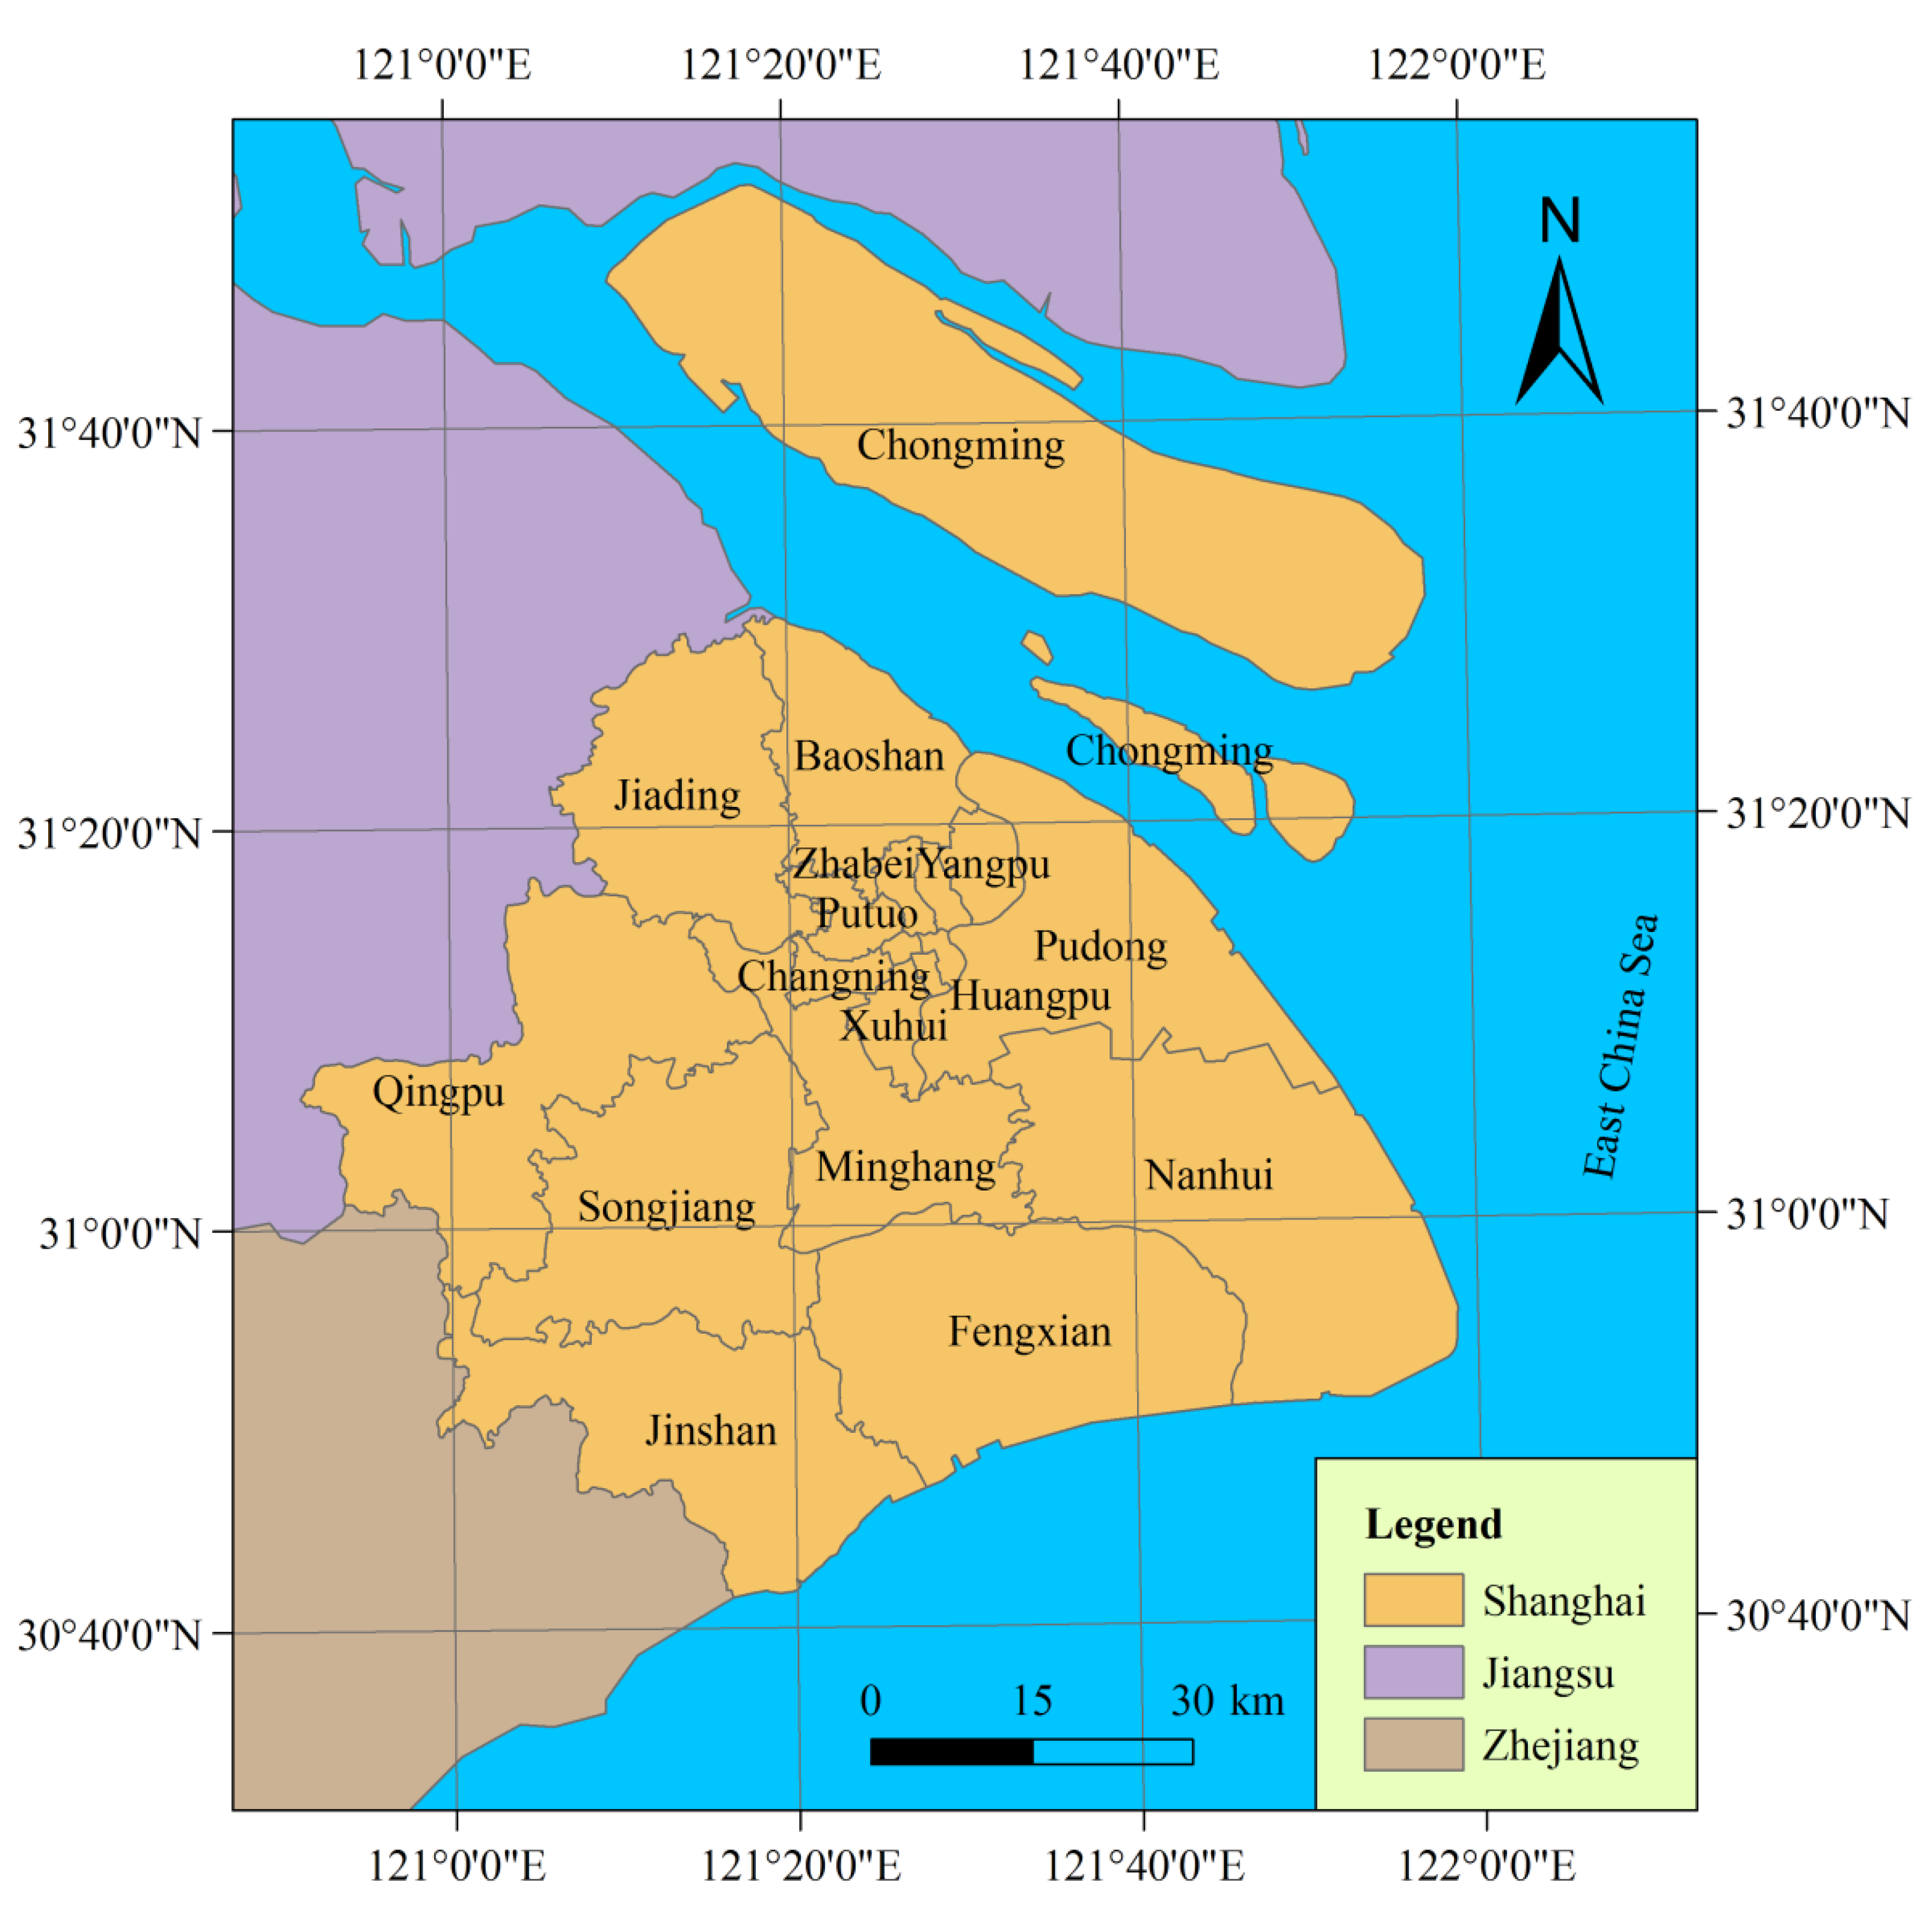
2.1. Study Area
2.2. Quantitative Dimension of Vulnerability
2.2.1. Exposure


2.2.2. Sensitivity
2.2.3. Coping Capacity
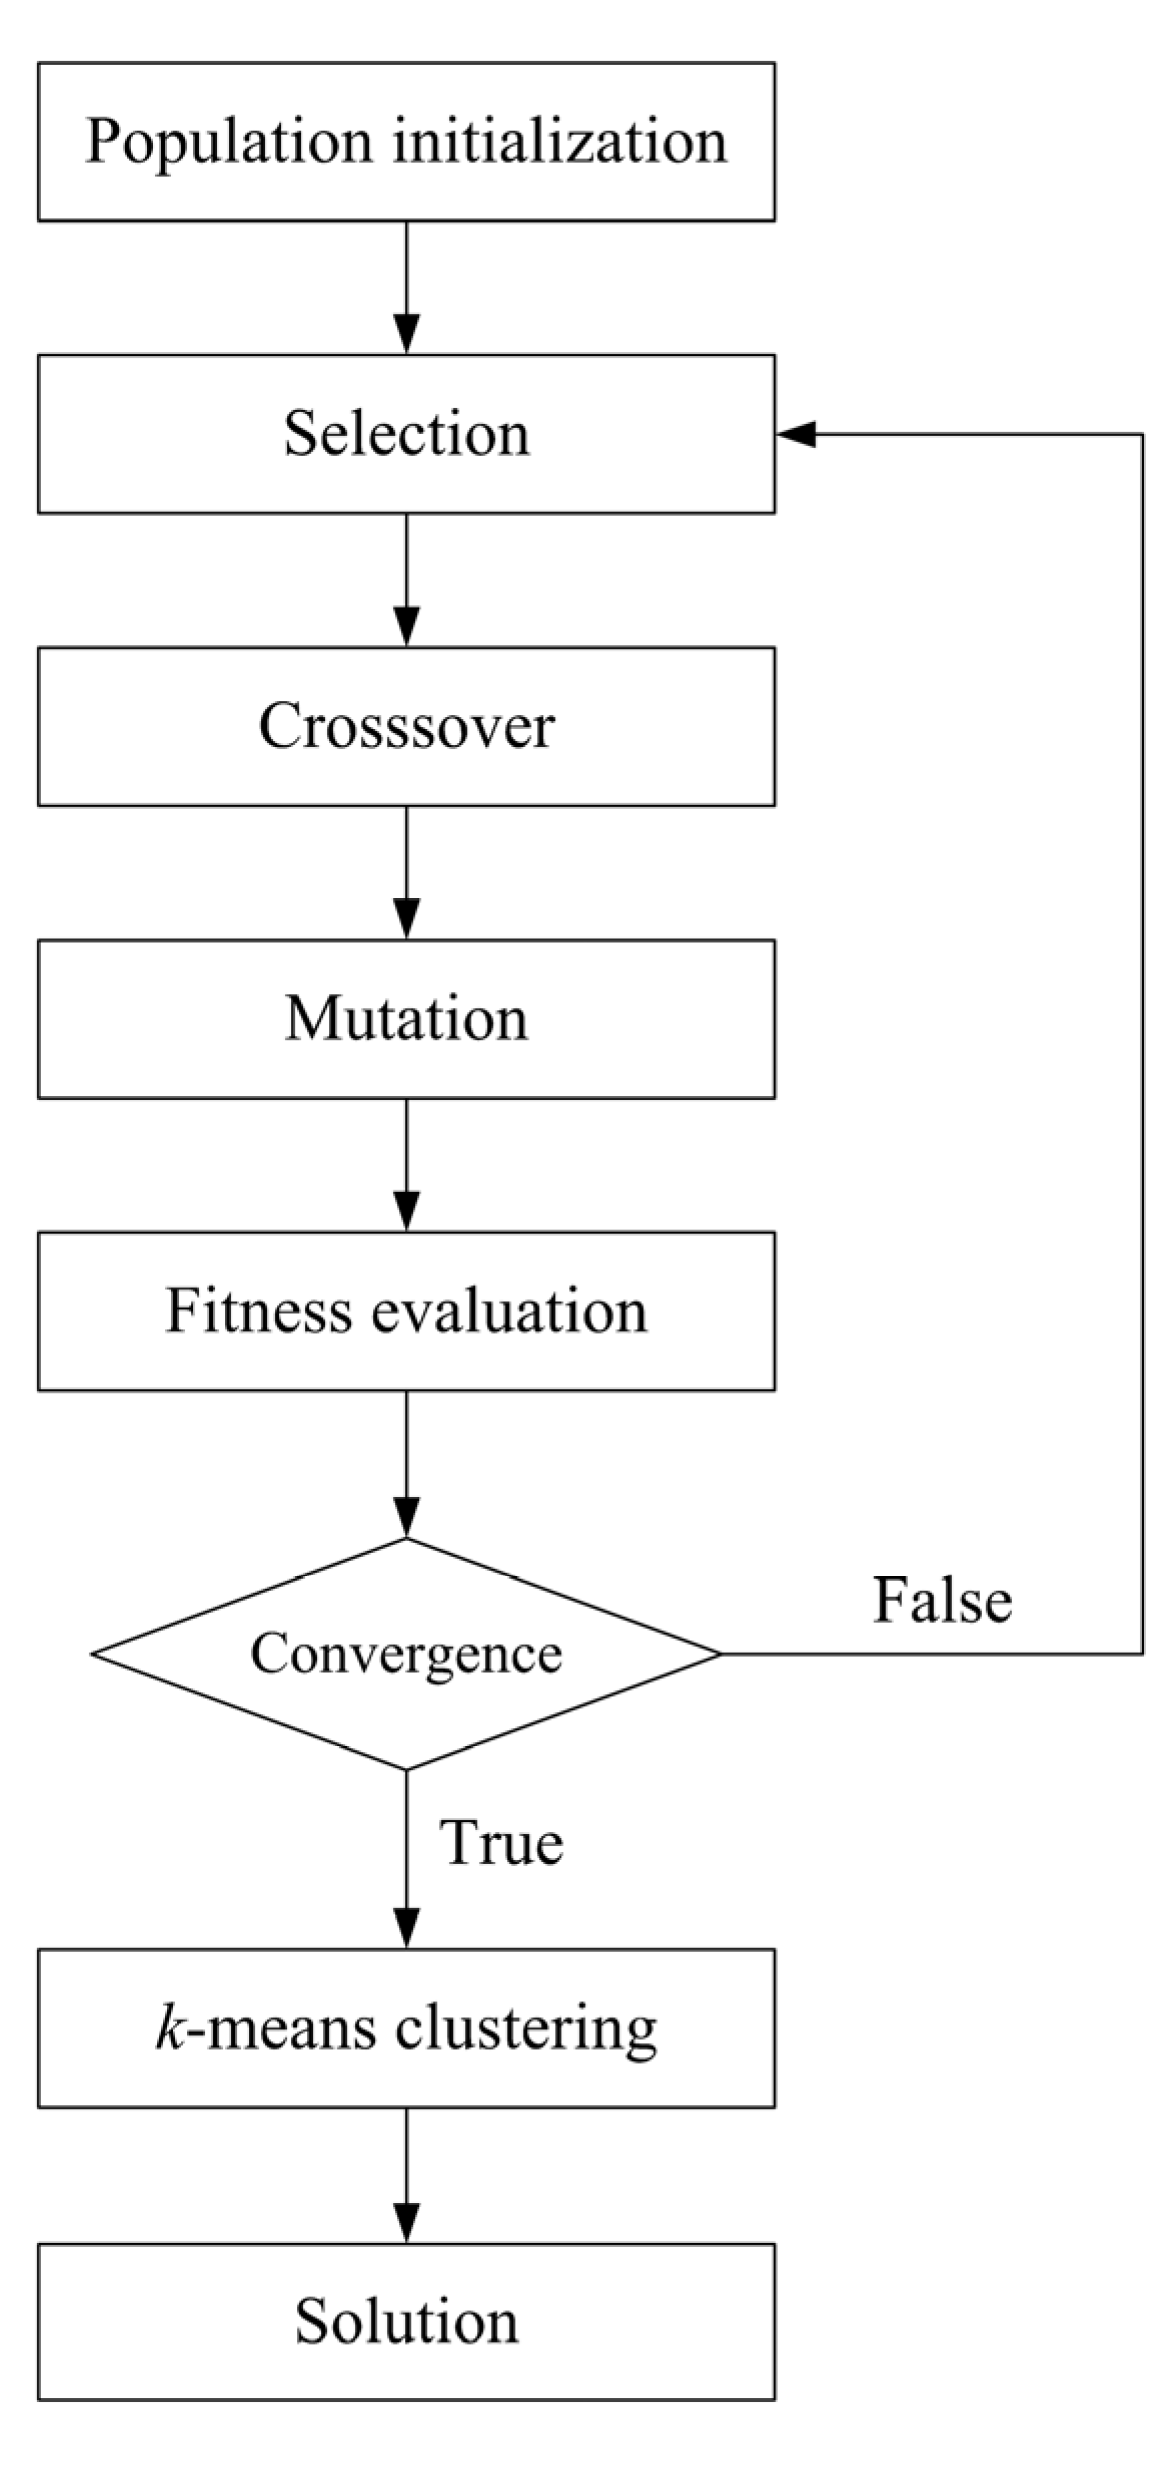
2.3. Genetic k-Means Clustering and Vulnerability Mapping


2.4. Kruskal-Wallis One-Way ANOVA
2.5. Information Entropy Analysis and Vulnerability Evaluation


3. Results and Discussion
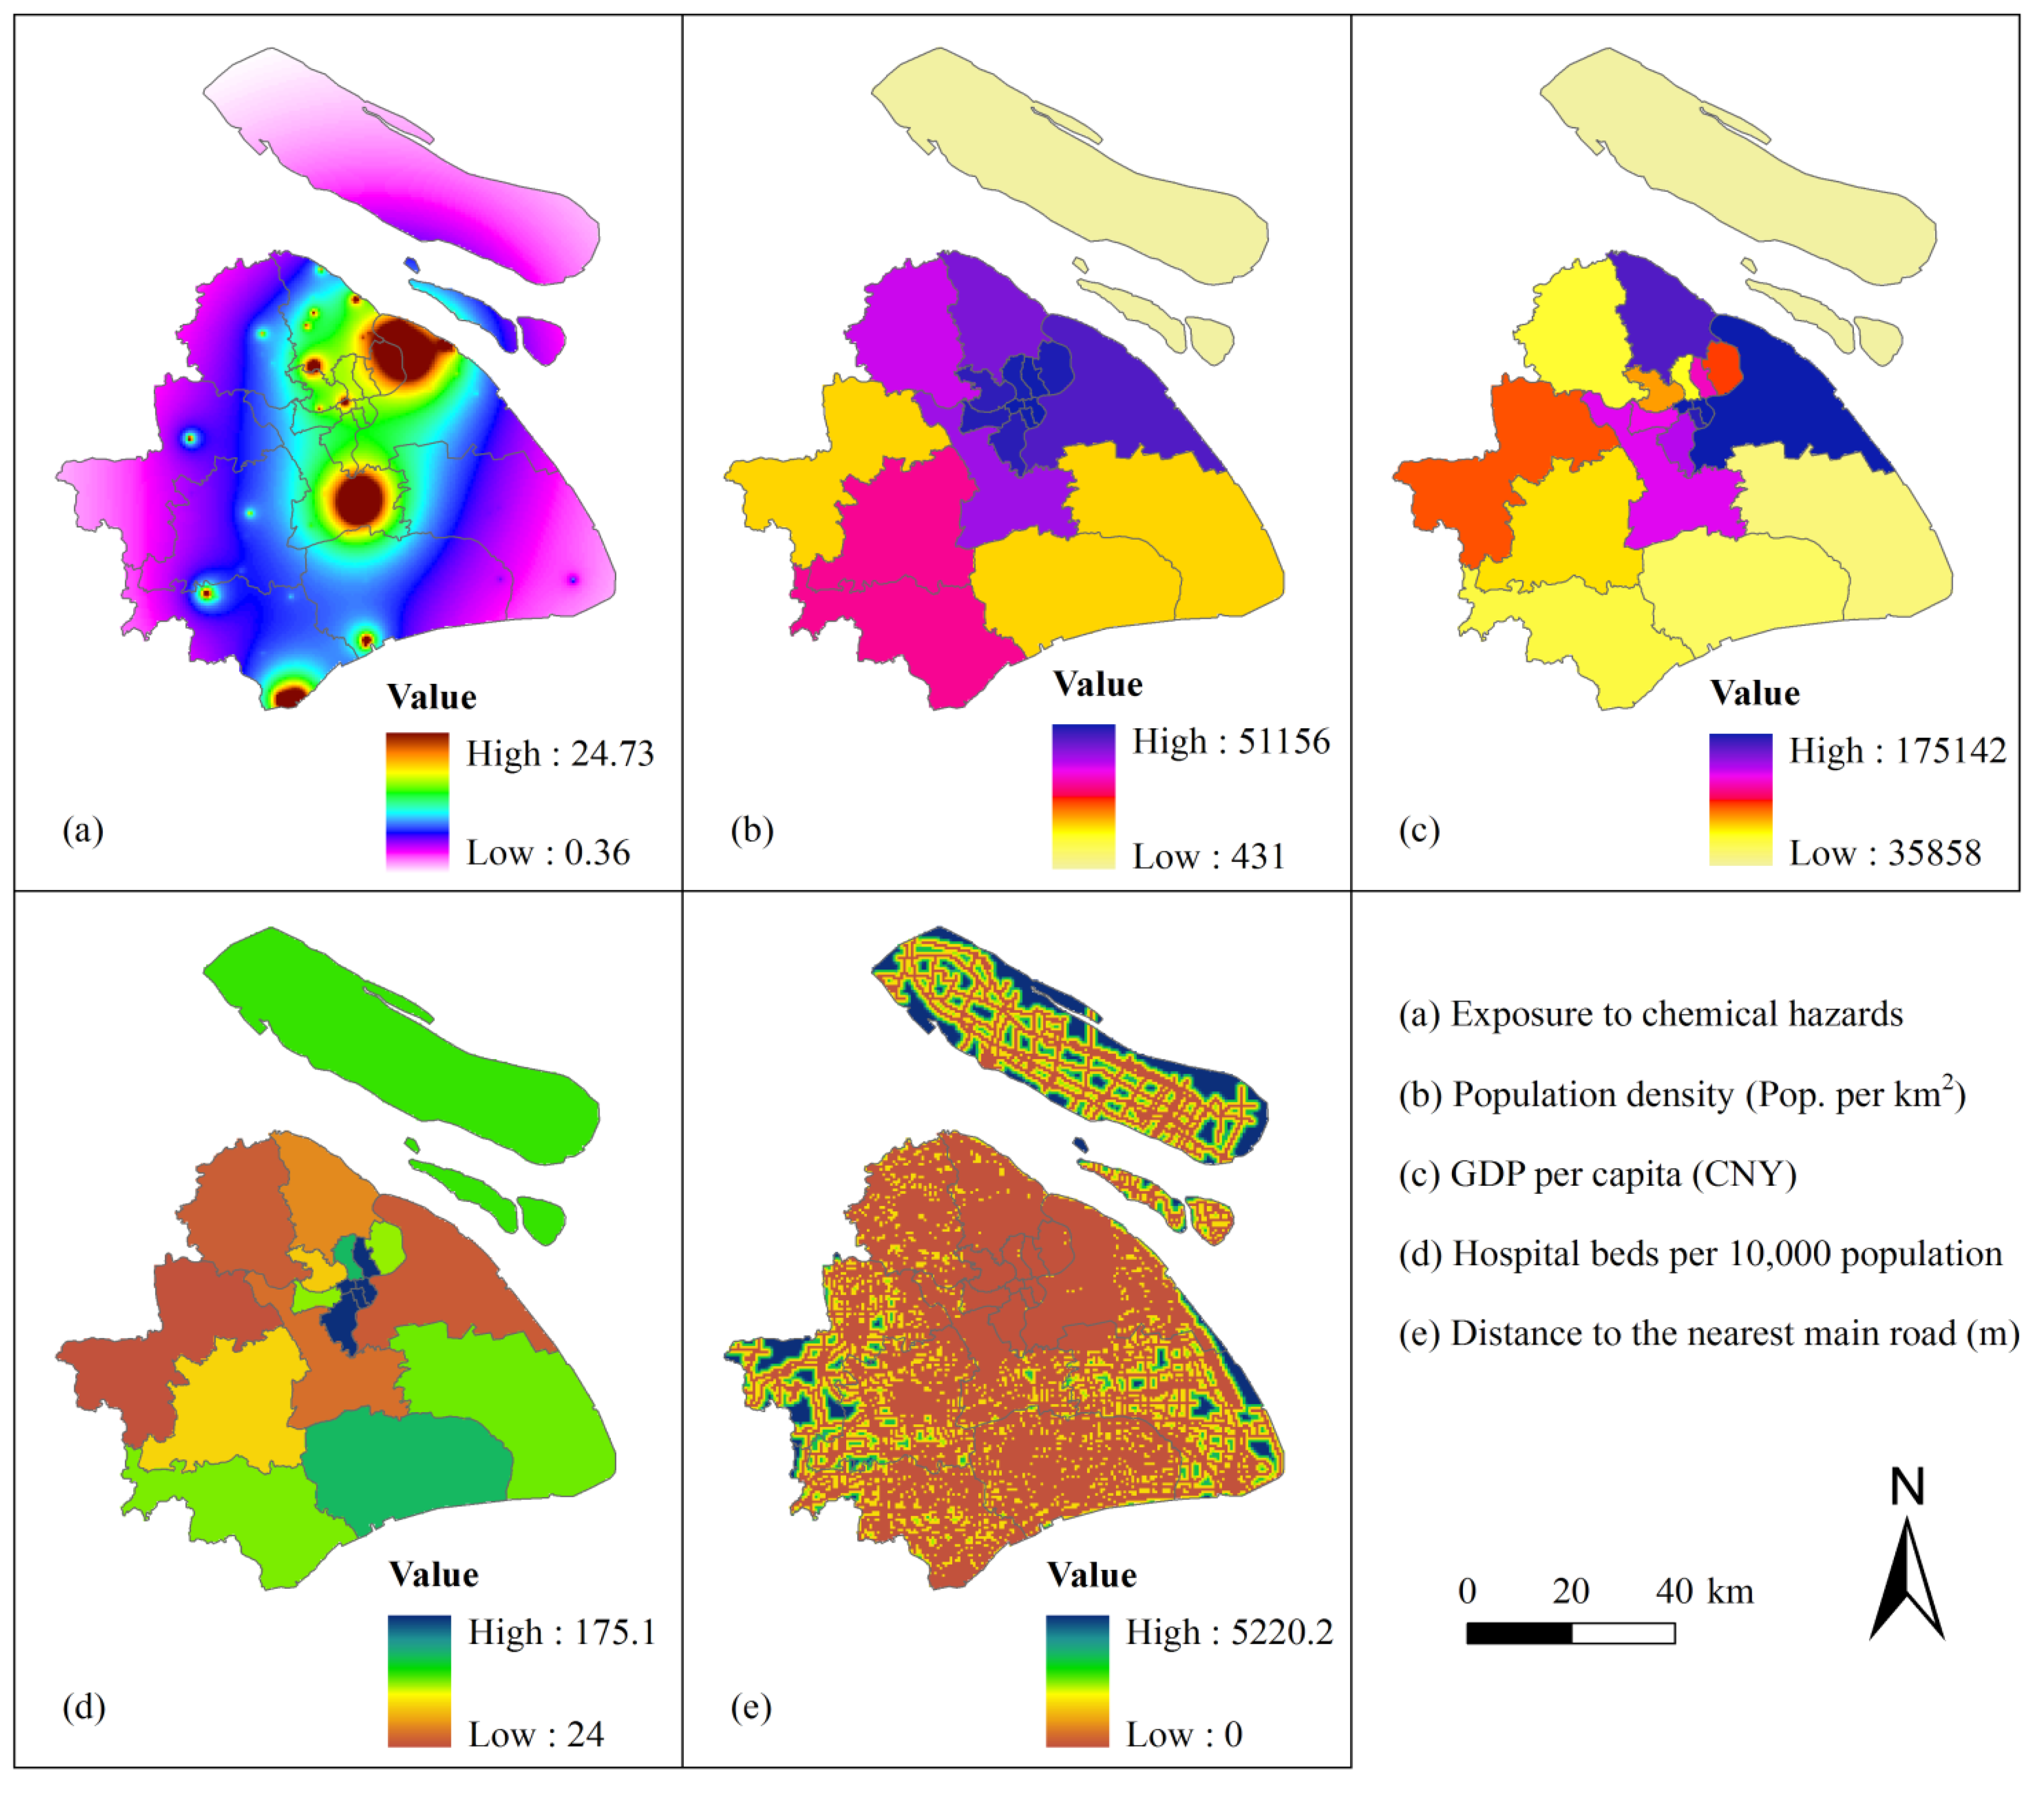
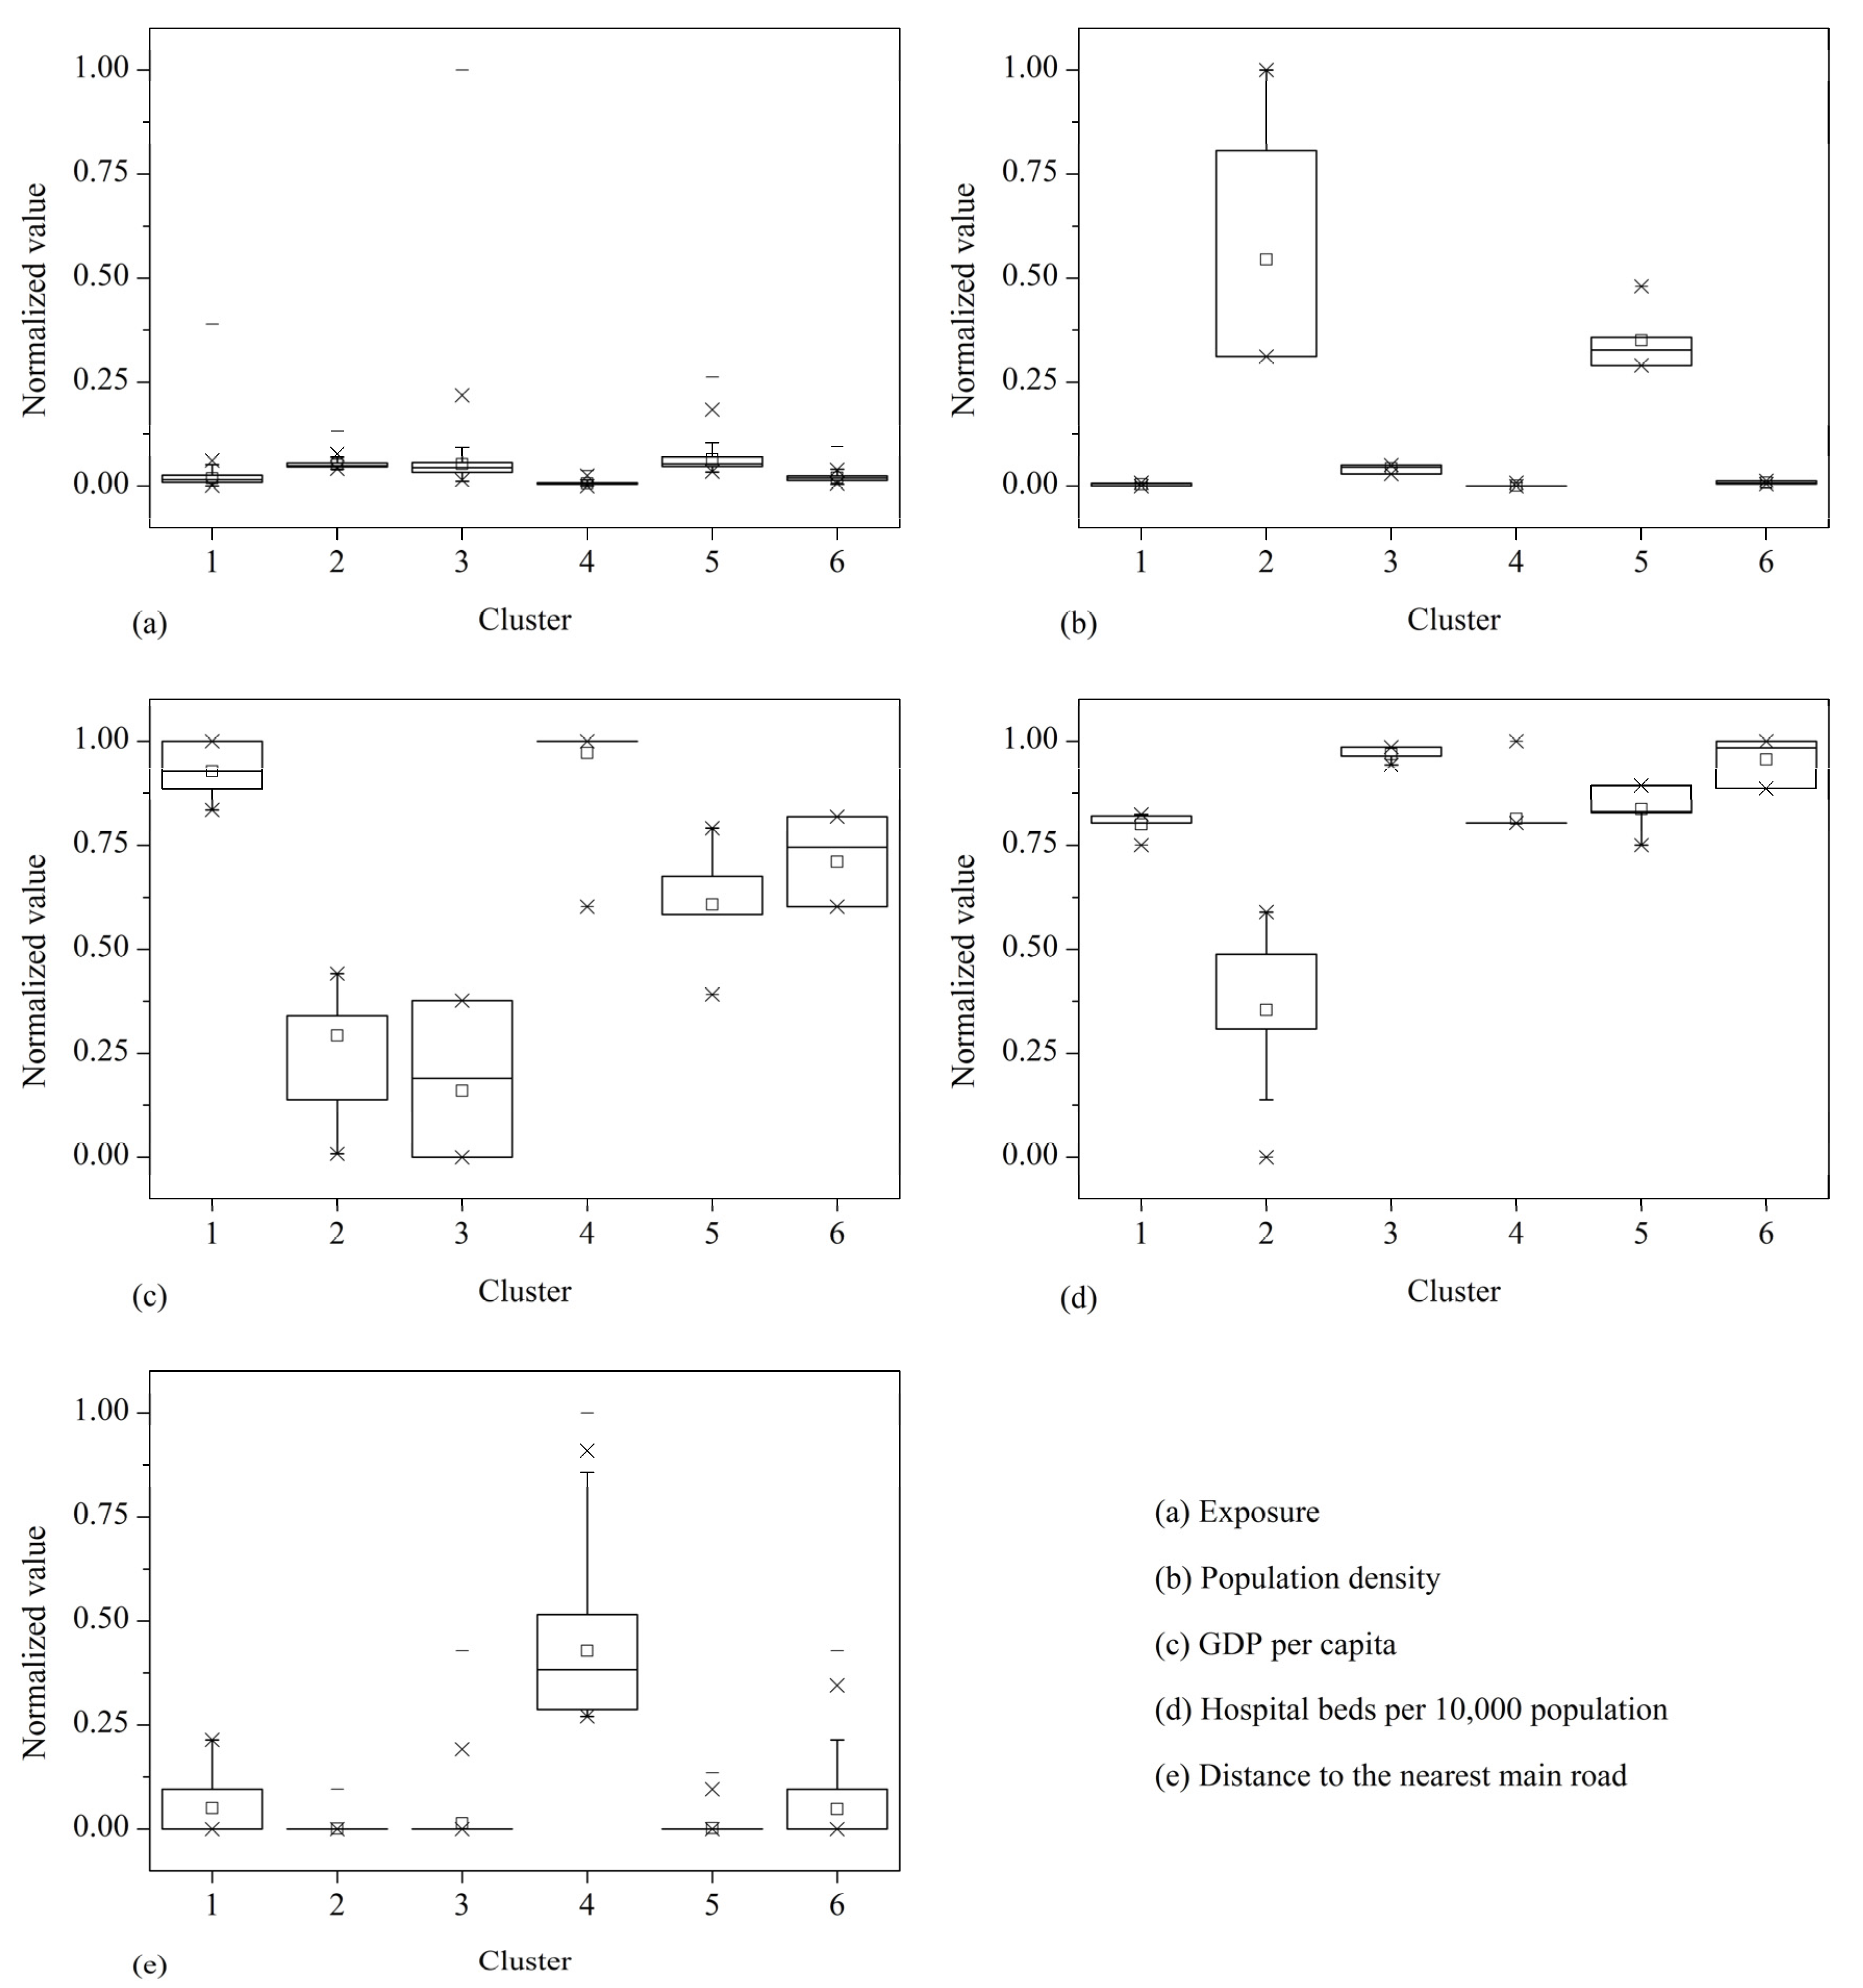
3.1. Spatial Distribution of the Vulnerability Indicators
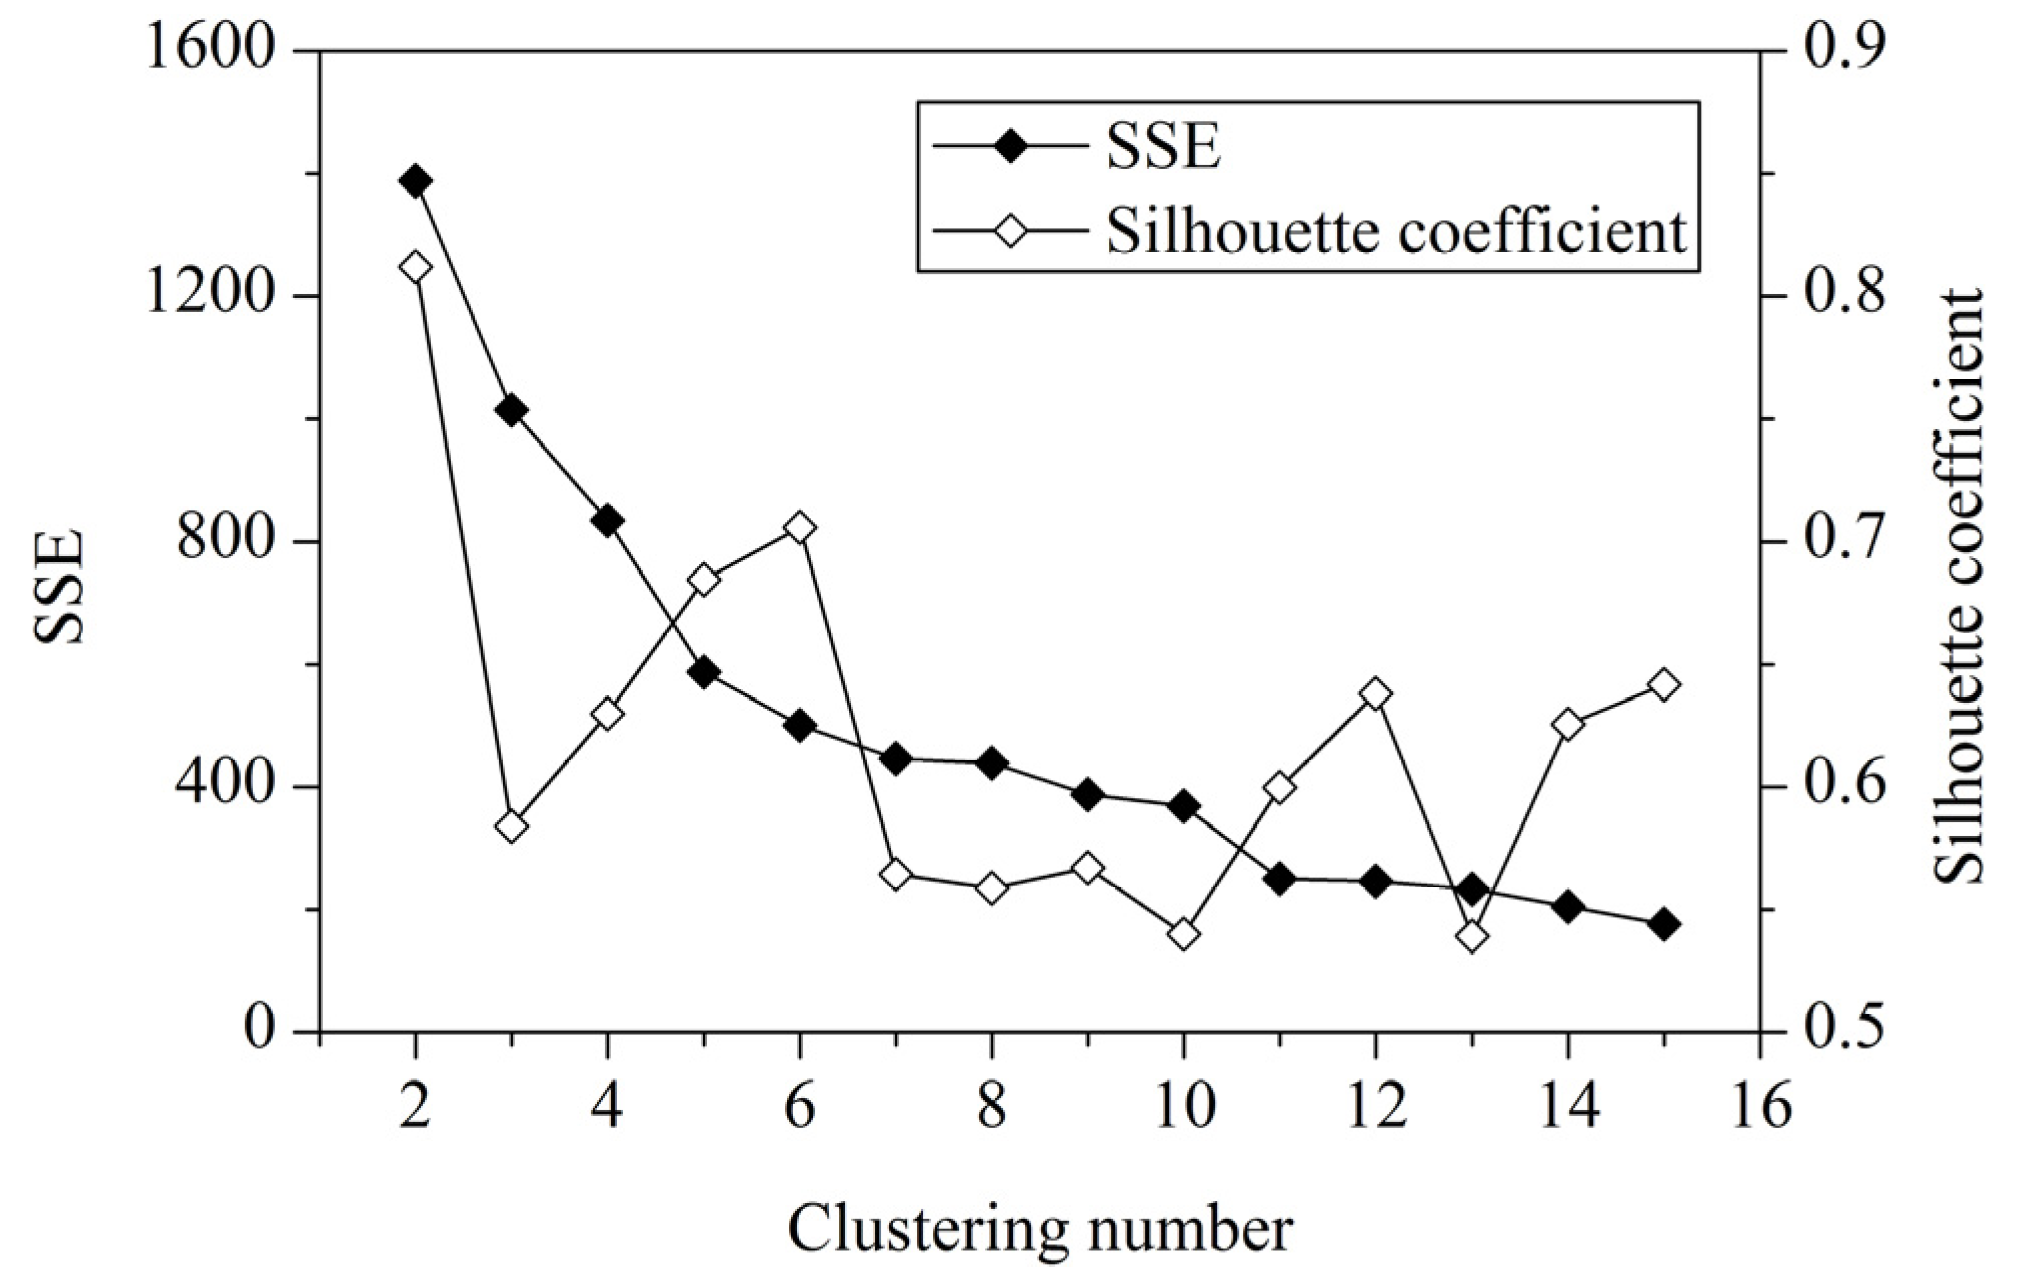
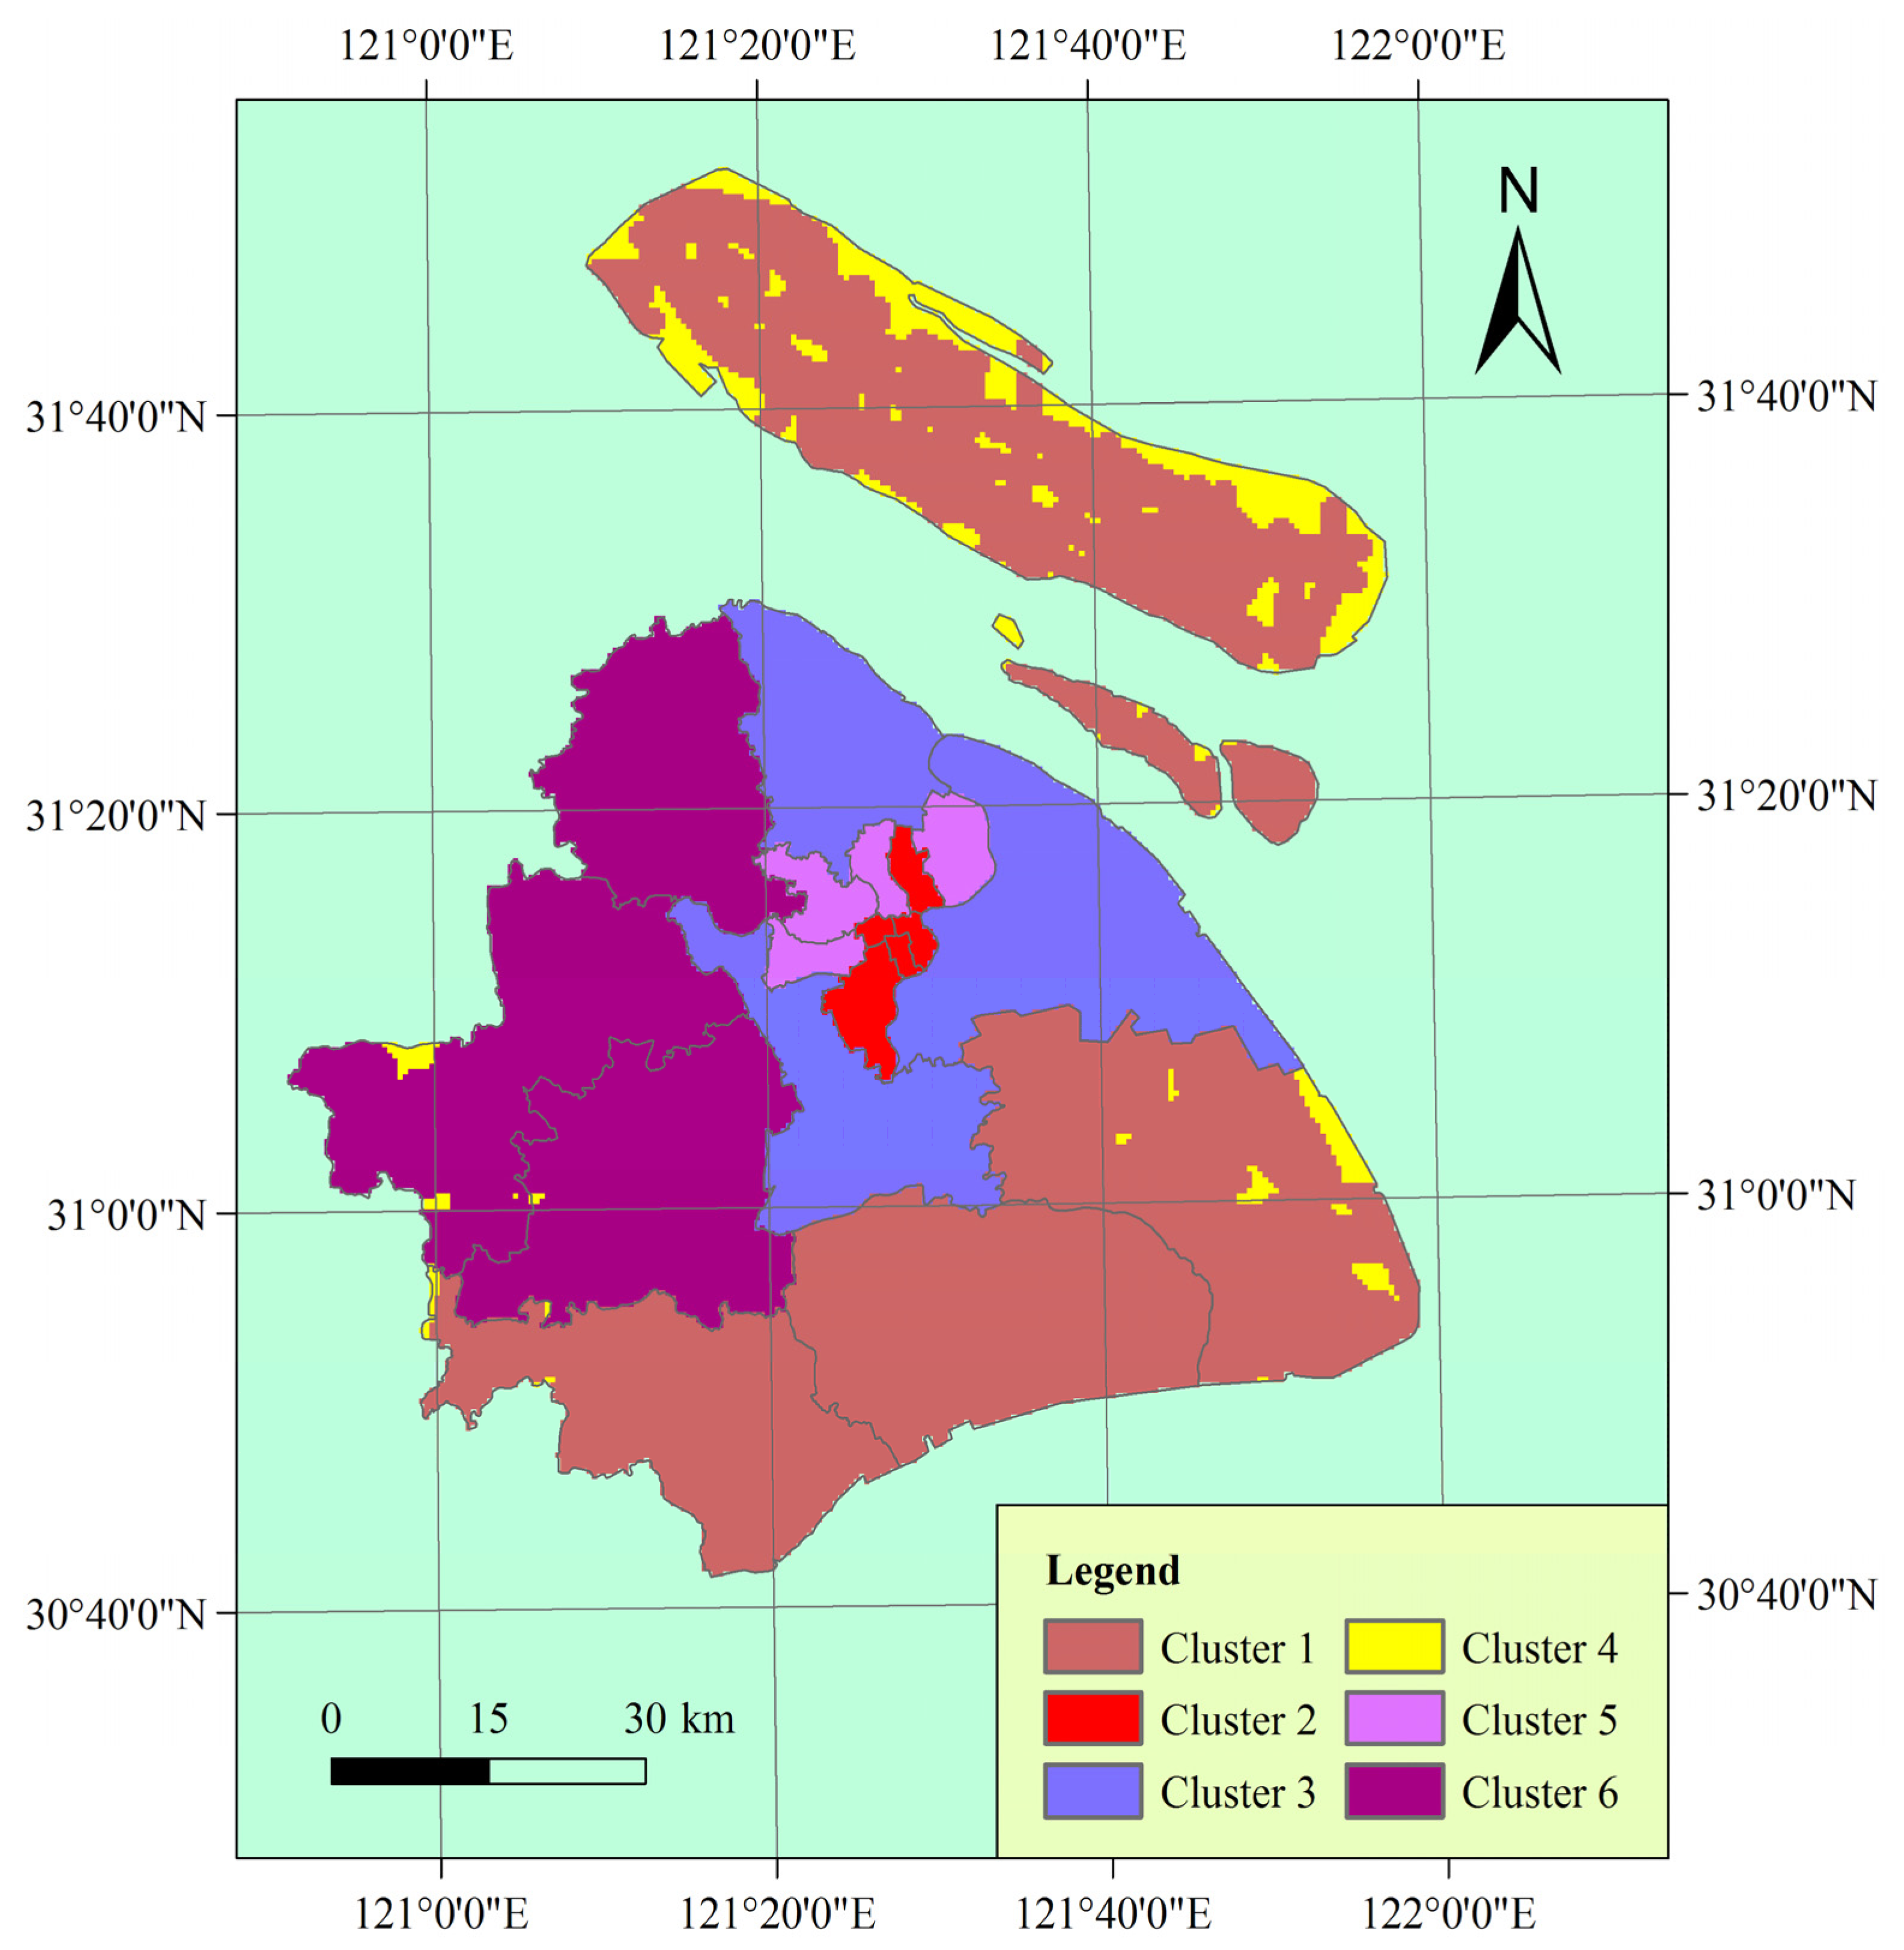
3.2. Vulnerability Mapping


| Vulnerability indicators | Chi-Square | DF | Prob > Chi-Square |
|---|---|---|---|
| Exposure | 12,522.2 | 5 | 0 |
| Population density | 16,870.7 | 5 | 0 |
| GDP per capita | 23,382.7 | 5 | 0 |
| Hospital beds per 10,000 population | 21,105.7 | 5 | 0 |
| Distance to the nearest main road | 7,058.82 | 5 | 0 |
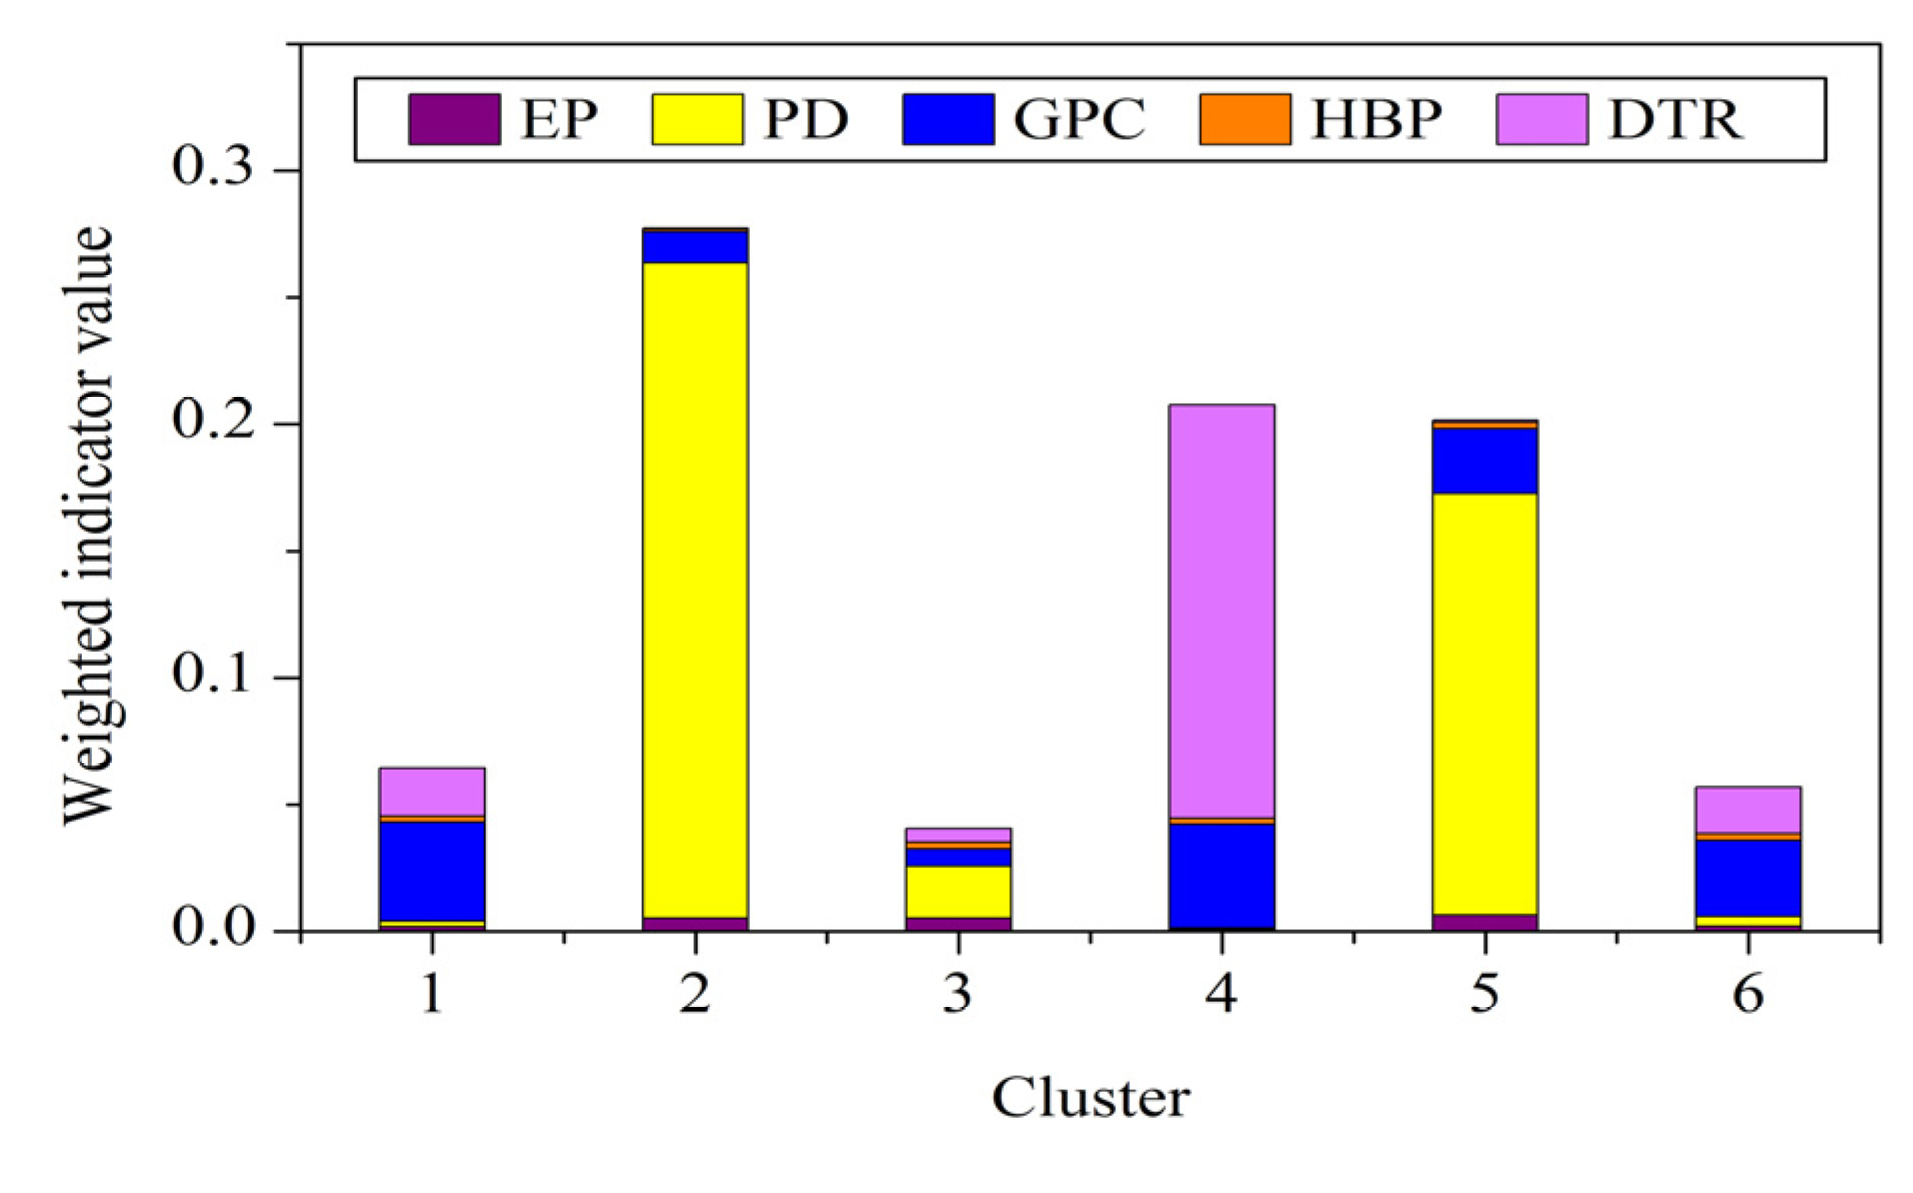
3.3. Human Vulnerability Evaluation and Reduction Points
| Vulnerability indicators | Infromation entropy ( ej) | Weight ( wj) |
|---|---|---|
| Exposure | 0.9684 | 0.0997 |
| Population density | 0.8495 | 0.4746 |
| GDP per capita | 0.9866 | 0.0421 |
| Hospital beds per 10,000 population | 0.9991 | 0.0028 |
| Distance to the nearest main road | 0.8793 | 0.3807 |
4. Conclusions
Acknowledgments
Conflict of Interest
References
- Malich, G.; Braun, M.; Loullis, P.; Winder, C. Comparison of regulations concerning hazardous substances from an international perspective. J. Hazard. Mater. 1998, 62, 143–159. [Google Scholar] [CrossRef]
- Adger, W.N. Vulnerability. Glob. Environ. Change 2006, 16, 268–281. [Google Scholar] [CrossRef]
- Adger, W.N.; Agrawala, S.; Mirza, M.M.Q.; Conde, C.; O’Brien, K.; Pulhin, J.; Pulwarty, R.; Smit, B.; Takahashi, K. Assessment of adaptation practices, options, constraints and capacity. In Climate Change 2007: Impacts, Adaptation and Vulnerability; Parry, M.L., Canziani, O.F., Palutikof, J.P., van der Linden, P.J., Hanson, C.E., Eds.; Cambridge University Press: Cambridge, UK, 2007; pp. 717–743. [Google Scholar]
- Kelly, P.M.; Adger, W.N. Theory and practice in assessing vulnerability to climate change and facilitating adaptation. Clim. Change 2000, 47, 325–352. [Google Scholar] [CrossRef]
- Luers, A.L.; Lobell, D.B.; Sklar, L.S.; Addams, C.L.; Matson, P.A. A method for quantifying vulnerability, applied to the agricultural system of the Yaqui Valley, Mexico. Glob. Environ. Change 2003, 13, 255–267. [Google Scholar] [CrossRef]
- Preston, B.L.; Brooke, C.; Measham, T.G.; Smith, T.; Gorddard, R. Igniting change in local government: Lessons learned from a bushfire vulnerability assessment. Mitig. Adapt. Strateg. Glob. Change 2009, 14, 251–283. [Google Scholar] [CrossRef]
- Birkmann, J. Measuring vulnerability to promote disaster-resilient societies: Conceptual frameworks and definitions. In Measuring Vulnerability to Natural Hazards-Towards Disaster Resilient Societies; Birkmann, J., Ed.; United Nations University Press: New York, NY, USA, 2006; pp. 9–54. [Google Scholar]
- Janssen, M.A.; Schoon, M.L.; Ke, W.; Börner, K. Scholarly networks on resilience, vulnerability and adaptation within the human dimensions of global environmental change. Glob. Environ. Change 2006, 16, 240–252. [Google Scholar]
- Füssel, H.M. Vulnerability, a generally applicable conceptual framework for climate change research. Glob. Environ. Change 2007, 17, 155–167. [Google Scholar] [CrossRef]
- Bone, C.; Alessa, L.; Altaweel, M.; Kliskey, A.; Lammers, R. Assessing the impacts of local knowledge and technology on climate change vulnerability in remote communities. Int. J. Environ. Res. Public Health 2011, 8, 733–761. [Google Scholar] [CrossRef]
- Kim, E.S.; Choi, H.I. Assessment of vulnerability to extreme flash floods in design storms. Int. J. Environ. Res. Public Health 2011, 8, 2907–2922. [Google Scholar] [CrossRef]
- Huang, G.L.; London, J.K. Cumulative environmental vulnerability and environmental justice in California’s San Joaquin Valley. Int. J. Environ. Res. Public Health 2012, 9, 1593–1608. [Google Scholar] [CrossRef]
- Liverman, D. Vulnerability to global environmental change. In Global Environmental Risk; Kasperson, J.X., Kasperson, R.E., Eds.; United Nations University Press: Tokyo, Japan, 2001; pp. 201–216. [Google Scholar]
- Malone, E.L.; Engle, N.L. Evaluating regional vulnerability to climate change: Purposes and methods. Rev. Clim. Change 2011, 2, 462–474. [Google Scholar]
- Turner, B.L., II; Kasperson, R.E.; Matson, P.A.; McCarthy, J.J.; Corell, R.W.; Christensen, L.; Eckley, N.; Kasperson, J.X.; Luers, A.; Martello, M.L.; et al. A framework for vulnerability analysis in sustainability science. Proc. Natl. Acad. Sci. USA 2003, 100, 8074–8079. [Google Scholar] [CrossRef]
- Schneider, S.; Sarukhan, J. Overview of impacts, adaptation, and vulnerability to climate change. In Climate Change 2001: Impacts, Adaptation, and Vulnerability; McCarthy, J.J., Canziani, O.F., Leary, N.A., Dokken, D.J., White, K.S., Eds.; Cambridge University Press: Cambridge, UK, 2001; pp. 75–103. [Google Scholar]
- Turner, B.L., II; Matson, P.A.; McCarthy, J.J.; Corell, R.W.; Christensen, L.; Eckley, N.; Hovelsrud-Broda, G.K.; Kasperson, J.X.; Kasperson, R.E.; Luers, A.; et al. Illustrating the coupled human-environment system for vulnerability analysis: Three case studies. Proc. Natl. Acad. Sci. USA 2003, 100, 8080–8085. [Google Scholar] [CrossRef]
- Kasperson, R.E.; Dow, K.; Archer, E.R.M.; Cáceres, D.; Downing, T.E.; Elmqvist, T.; Eriksen, S.; Folke, C.; Han, G.; Iyengar, K.; et al. Vulnerable people and places. In Ecosystems and Human Well-Being: Current State and Trends; Hassan, R., Scholes, R., Ash, N., Eds.; Island Press: Washington, DC, USA, 2005; pp. 143–164. [Google Scholar]
- Smit, B.; Wandel, J. Adaptation, adaptive capacity and vulnerability. Glob. Environ. Change 2006, 16, 282–292. [Google Scholar] [CrossRef]
- Clark, G.E.; Moser, S.C.; Ratick, S.J.; Dow, K.; Meyer, W.B.; Emani, S.; Weigen, J.; Kasperson, J.X.; Kasperson, R.E.; Schwarz, H.E. Assessing the vulnerability of coastal communities to extreme storms: The case of Revere, MA, USA. Mitig. Adapt. Strateg. Glob. Change 1998, 3, 59–82. [Google Scholar] [CrossRef]
- Preston, B.L.; Yuen, E.J.; Westaway, R.M. Putting vulnerability to climate change on the map: A review of approaches, benefits, and risks. Sustain. Sci. 2011, 6, 177–202. [Google Scholar] [CrossRef]
- de la Torre, A.; Iglesias, I.; Carballo, M.; Ramirez, P.; Munoz, M.J. An approach for mapping the vulnerability of European Union soils to antibiotic contamination. Sci. Total. Environ. 2012, 414, 672–679. [Google Scholar] [CrossRef]
- Petschel-Held, G.; Block, A.; Cassel-Gintz, M.; Kropp, J.; Lüdeke, M.K.B.; Moldenhauer, O.; Reusswig, F.; Schellnhuber, H.J. Syndromes of global change: A qualitative modelling approach to assist global environmental management. Environ. Modell. Assess. 1999, 4, 295–314. [Google Scholar] [CrossRef]
- O’Brien, K.L.; Leichenko, R.; Kelkar, U.; Venemad, H.; Aandahl, G.; Tompkins, H.; Javed, A.; Bhadwal, S.; Barg, S.; Nygaard, L.; West, J. Mapping vulnerability to multiple stressors: Climate change and globalization in India. Glob. Environ. Change 2004, 14, 303–313. [Google Scholar] [CrossRef]
- Yan, L.; Xu, X.G. Assessing the vulnerability of social-environmental system from the perspective of hazard, sensitivity, and resilience: A case study of Beijing, China. Environ. Earth Sci. 2010, 61, 1179–1186. [Google Scholar] [CrossRef]
- Chang, C.L.; Chao, Y.C. Using the analytical hierarchy process to assess the environmental vulnerabilities of basins in Taiwan. Environ. Monit. Assess. 2012, 184, 2939–2945. [Google Scholar] [CrossRef]
- Zou, B.; Wilson, J.G.; Zhan, F.B.; Zeng, Y.N. An emission-weighted proximity model for air pollution exposure assessment. Sci. Total. Environ. 2009, 407, 4939–4945. [Google Scholar] [CrossRef]
- Bross, I. Estimates of the LD50: A critique. Biometrics 1950, 6, 413–423. [Google Scholar] [CrossRef]
- Weil, C.S. Tables for convenient calculation of median-effective dose (LD50 or ED50) and instructions in their use. Biometrics 1952, 8, 249–263. [Google Scholar] [CrossRef]
- Petrick, J.S.; Jagadish, B.; Mash, E.A.; Aposhian, H.V. Monomethylarsonous acid (MMA(III)) and arsenite: LD50 in hamsters and in vitro inhibition of pyruvate dehydrogenase. Chem. Res. Toxicol. 2001, 14, 651–656. [Google Scholar]
- Zbinden, G.; Fluryroversi, M. Significance of the LD50-test for the toxicological evaluation of chemical-substances. Arch. Toxicol. 1981, 47, 77–99. [Google Scholar]
- Schlede, E.; Mischke, U.; Roll, R.; Kayser, D. A national validation-study of the acute-toxic-class method—An alternative to the LD50 test. Arch. Toxicol. 1992, 66, 455–470. [Google Scholar] [CrossRef]
- Tan, P.N.; Steinbach, M.; Kumar, V. Introduction to Data Mining; Pearson Addison Wesley: Boston, MA, USA, 2006; pp. 487–556. [Google Scholar]
- Shannon, C.E. A mathematical theory of communication. Bell Syst. Tech. J. 1948, 27, 379–423. [Google Scholar]
© 2013 by the authors; licensee MDPI, Basel, Switzerland. This article is an open access article distributed under the terms and conditions of the Creative Commons Attribution license (http://creativecommons.org/licenses/by/3.0/).
Share and Cite
Shi, W.; Zeng, W. Genetic k-Means Clustering Approach for Mapping Human Vulnerability to Chemical Hazards in the Industrialized City: A Case Study of Shanghai, China. Int. J. Environ. Res. Public Health 2013, 10, 2578-2595. https://doi.org/10.3390/ijerph10062578
Shi W, Zeng W. Genetic k-Means Clustering Approach for Mapping Human Vulnerability to Chemical Hazards in the Industrialized City: A Case Study of Shanghai, China. International Journal of Environmental Research and Public Health. 2013; 10(6):2578-2595. https://doi.org/10.3390/ijerph10062578
Chicago/Turabian StyleShi, Weifang, and Weihua Zeng. 2013. "Genetic k-Means Clustering Approach for Mapping Human Vulnerability to Chemical Hazards in the Industrialized City: A Case Study of Shanghai, China" International Journal of Environmental Research and Public Health 10, no. 6: 2578-2595. https://doi.org/10.3390/ijerph10062578
APA StyleShi, W., & Zeng, W. (2013). Genetic k-Means Clustering Approach for Mapping Human Vulnerability to Chemical Hazards in the Industrialized City: A Case Study of Shanghai, China. International Journal of Environmental Research and Public Health, 10(6), 2578-2595. https://doi.org/10.3390/ijerph10062578