Toxicology Testing in Fatally Injured Workers: A Review of Five Years of Iowa FACE Cases


Abstract
:1. Introduction
2. Experimental Section
2.1. Research Design
2.2. Demographics and Survival Time
2.3. Toxicology Testing and Positive Status
2.4. Occupation, Industry, and Cause of Death Coding
2.5. Analyses
3. Results and Discussion
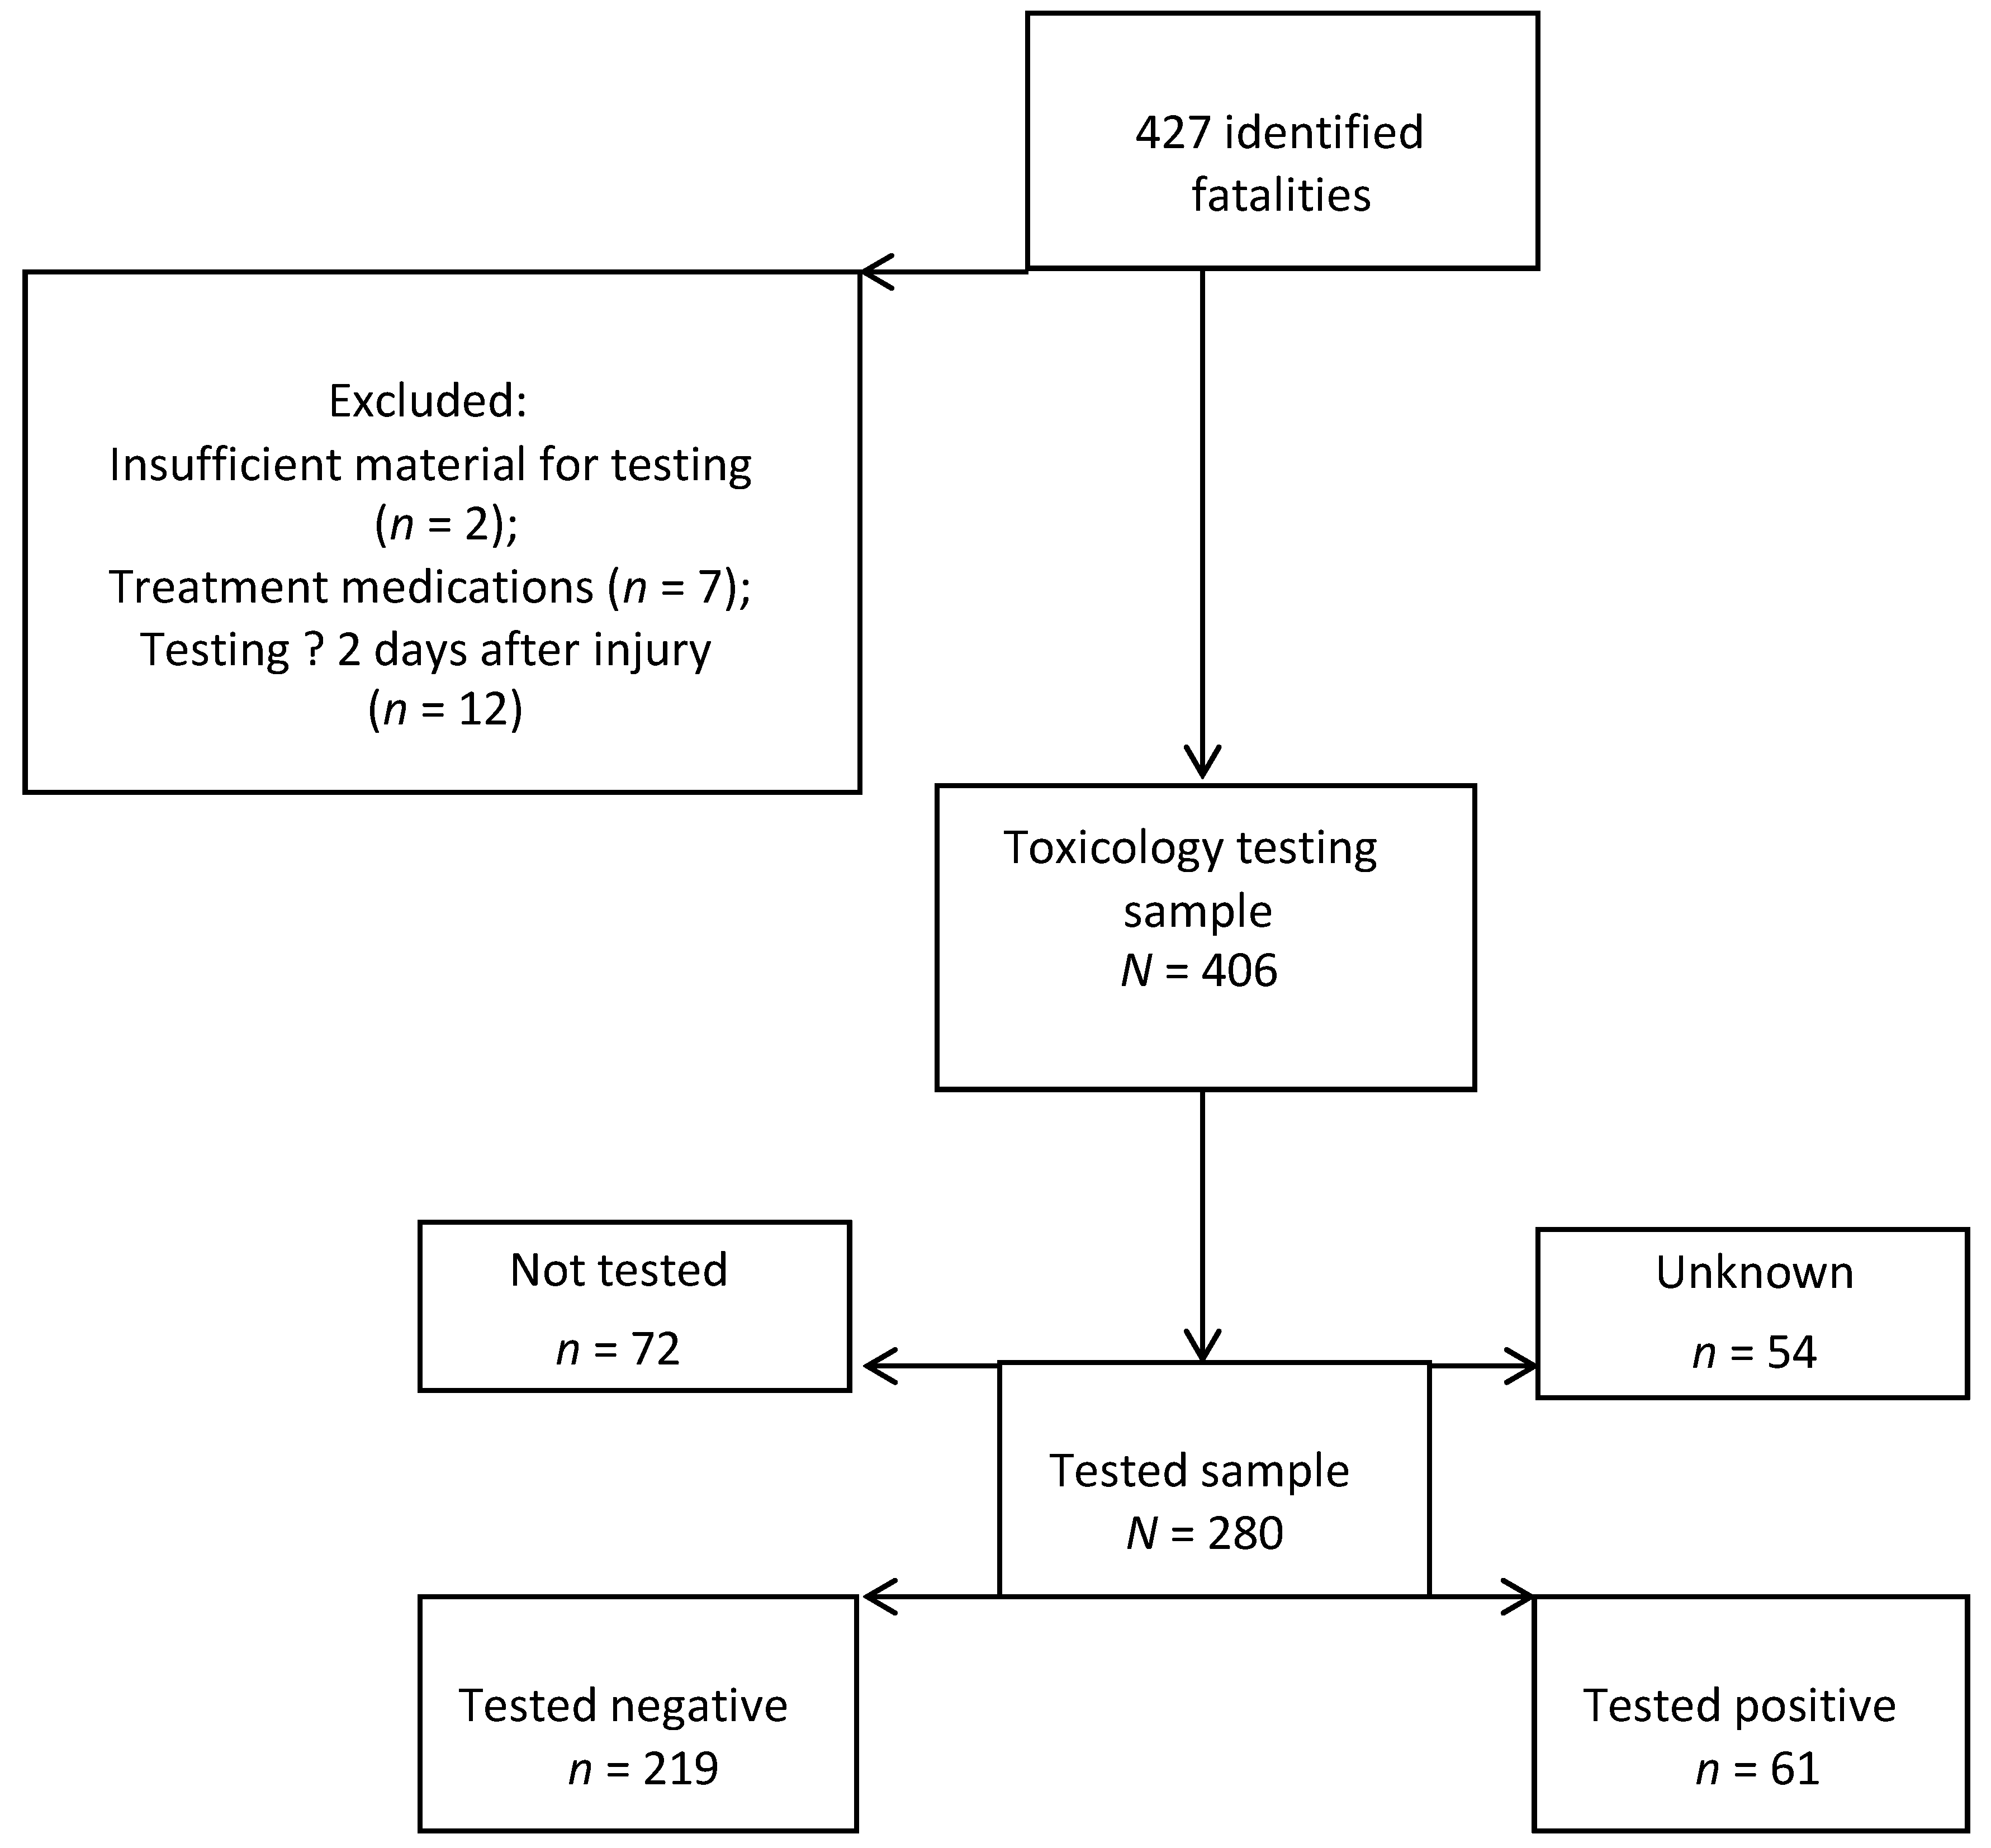
3.1. Fatal Cases


| Frequency | Percent | |
|---|---|---|
| Age (years) | ||
| 0–18 | 6 | 1.5 |
| 19–34 | 68 | 16.8 |
| 35–49 | 114 | 28.1 |
| 50–64 | 142 | 35.0 |
| 65–74 | 49 | 12.1 |
| 75 and older | 27 | 6.7 |
| Survival since day of injury (days) | ||
| 0 | 357 | 87.9 |
| > 0 | 49 | 12.1 |
| Sex | ||
| Female | 22 | 5.4 |
| Male | 384 | 94.6 |
| Race | ||
| Asian | 1 | 0.3 |
| Black | 6 | 1.7 |
| Hispanic | 5 | 1.4 |
| Native American | 1 | 0.3 |
| White | 352 | 96.4 |
| Missing | 41 | |
| Toxicology test performed | ||
| No or Unknown | 126 | 31.0 |
| TestedYes | 280 | 69.0 |
| SOC Occupation Groups | ||
| Construction & Maintenance | 85 | 21.3 |
| Farming, Fishing, & Forestry | 135 | 33.8 |
| Management, Business, Science, & Arts/Service/Sales & Office | 57 | 14.3 |
| Production, Transportation, and Material Moving | 122 | 30.6 |
| Missing | 7 | |
| NORA Industry Groups | ||
| Agriculture, Forestry & Fishing | 139 | 35.9 |
| Construction/Mining/Oil & Gas Extraction | 61 | 15.8 |
| Manufacturing | 26 | 6.7 |
| Services/Public Safety/Health Care & Social Assistance | 64 | 16.5 |
| Transportation, Warehousing & Utilities | 66 | 17.1 |
| Wholesale & Retail Trade | 31 | 8.0 |
| Missing | 19 | |
| External Cause of Injury | ||
| Cut/Pierce | 2 | 0.5 |
| Drowning | 5 | 1.2 |
| Fall | 37 | 9.1 |
| Fire/Flame | 8 | 2.0 |
| Firearm | 14 | 3.5 |
| Machinery (including agricultural machinery) | 18 | 4.4 |
| MV traffic | 98 | 24.1 |
| Other Pedestrian (not traffic-related) | 9 | 2.2 |
| Other Land Transport (not traffic-related) | 93 | 22.9 |
| Other Transport (primarily air & water) | 14 | 3.5 |
| Natural/ Environmental (primarily weather-related) | 11 | 2.7 |
| Poisoning | 7 | 1.7 |
| Struck By/Against (objects or persons) | 33 | 8.1 |
| Suffocation | 18 | 4.4 |
| Other Specified & Unspecified (not assigned to specific category) | 39 | 9.6 |
3.2. Toxicology Testing
| Sex | ||||
| Female | 22 (5.4) | 13 (59.1) | 0.6 (0.3–1.5) | 0.5 (0.2–1.6) |
| Male | 384 (94.6) | 267 (69.5) | 1.0 (referent) | 1.0 (referent) |
| Race | ||||
| White | 352 (96.4) | 258 (73.3) | 1.0 (referent) | 1.0 (referent) |
| Other | 13 (3.6) | 10 (76.9) | 1.2 (0.3–4.5) | 0.6 (0.1–2.7) |
| Age Group ** | ||||
| 0–34 | 74(18.2) | 60 (81.1) | 3.9 (1.9–8.1) | 4.2 (1.6–11.2) |
| 35–49 | 114 (28.1) | 84 (73.7) | 2.5 (1.4–4.7) | 2.7 (1.2–6.1) |
| 50–64 | 142 (35.0) | 96 (67.6) | 1.9 (1.1–3.3) | 1.6 (0.8–3.2) |
| 65 & older | 76 (18.7) | 40 (52.6) | 1.0 (referent) | 1.0 (referent) |
| Survival since day of injury (days) ** | ||||
| 0 | 357 (87.9) | 270 (75.6) | 12.1 (5.8–25.3) | 13.3 (5.8–30.8) |
| >0 | 49 (12.1) | 10 (20.4) | 1.0 (referent) | 1.0 (referent) |
| SOC Occupation group ** | ||||
| Construction & Maintenance | 85 (21.3) | 63 (74.1) | 0.7 (0.3–1.3) | 1.2 (0.5–2.9) |
| Farming, Fishing, & Forestry | 135 (33.8) | 78 (57.8) | 0.3 (0.2–0.6) | 0.4 (0.2–0.8) |
| Management, Business, Science, & Arts/Service/Sales & Office | 57 (14.3) | 38 (66. 7) | 0.5 (0.2–1.0) | 0.8 (0.3–2.0) |
| Production, Transport, Material Moving | 122 (30.6) | 99 (81.2) | 1.0 (referent) | 1.0 (referent) |
| NORA Industry group ** | ||||
| Agriculture, Forestry & Fishing | 139 (35.9) | 81 (58.3) | 0.5 (0.2–1.2) | |
| Construction/Mining/Oil & Gas | 61 (15.8) | 48 (78.7) | 1.3 (0.5–3.5) | |
| Manufacturing | 26 (6.7) | 20 (76.9) | 1.2 (0.3–3.9) | |
| Services/Public Safety/Health Care & Social Assistance | 64 (16.5) | 45 (70.3) | 0.8 (0.3–2.2) | |
| Transportation, Warehousing & Utilities | 66 (17.1) | 52 (78.8) | 1.3 (0.5–3.5) | |
| Wholesale & Retail Trade | 31 (8.0) | 23 (74.2) | 1.0 (referent) | |
| External Cause of Injury ** | ||||
| MV Traffic | 98 (24.1) | 79 (80.6) | 1.0 (referent) | 1.0 (referent) |
| Other Land Transport | 93 (22.9) | 62 (66.7) | 0.5 (0.3–0.9) | 0.5 (0.2–1.3) |
| All Other | 215 (52.1) | 139 (64.7) | 0.4 (0.3–0.8) | 0.6 (0.3–1.2) |
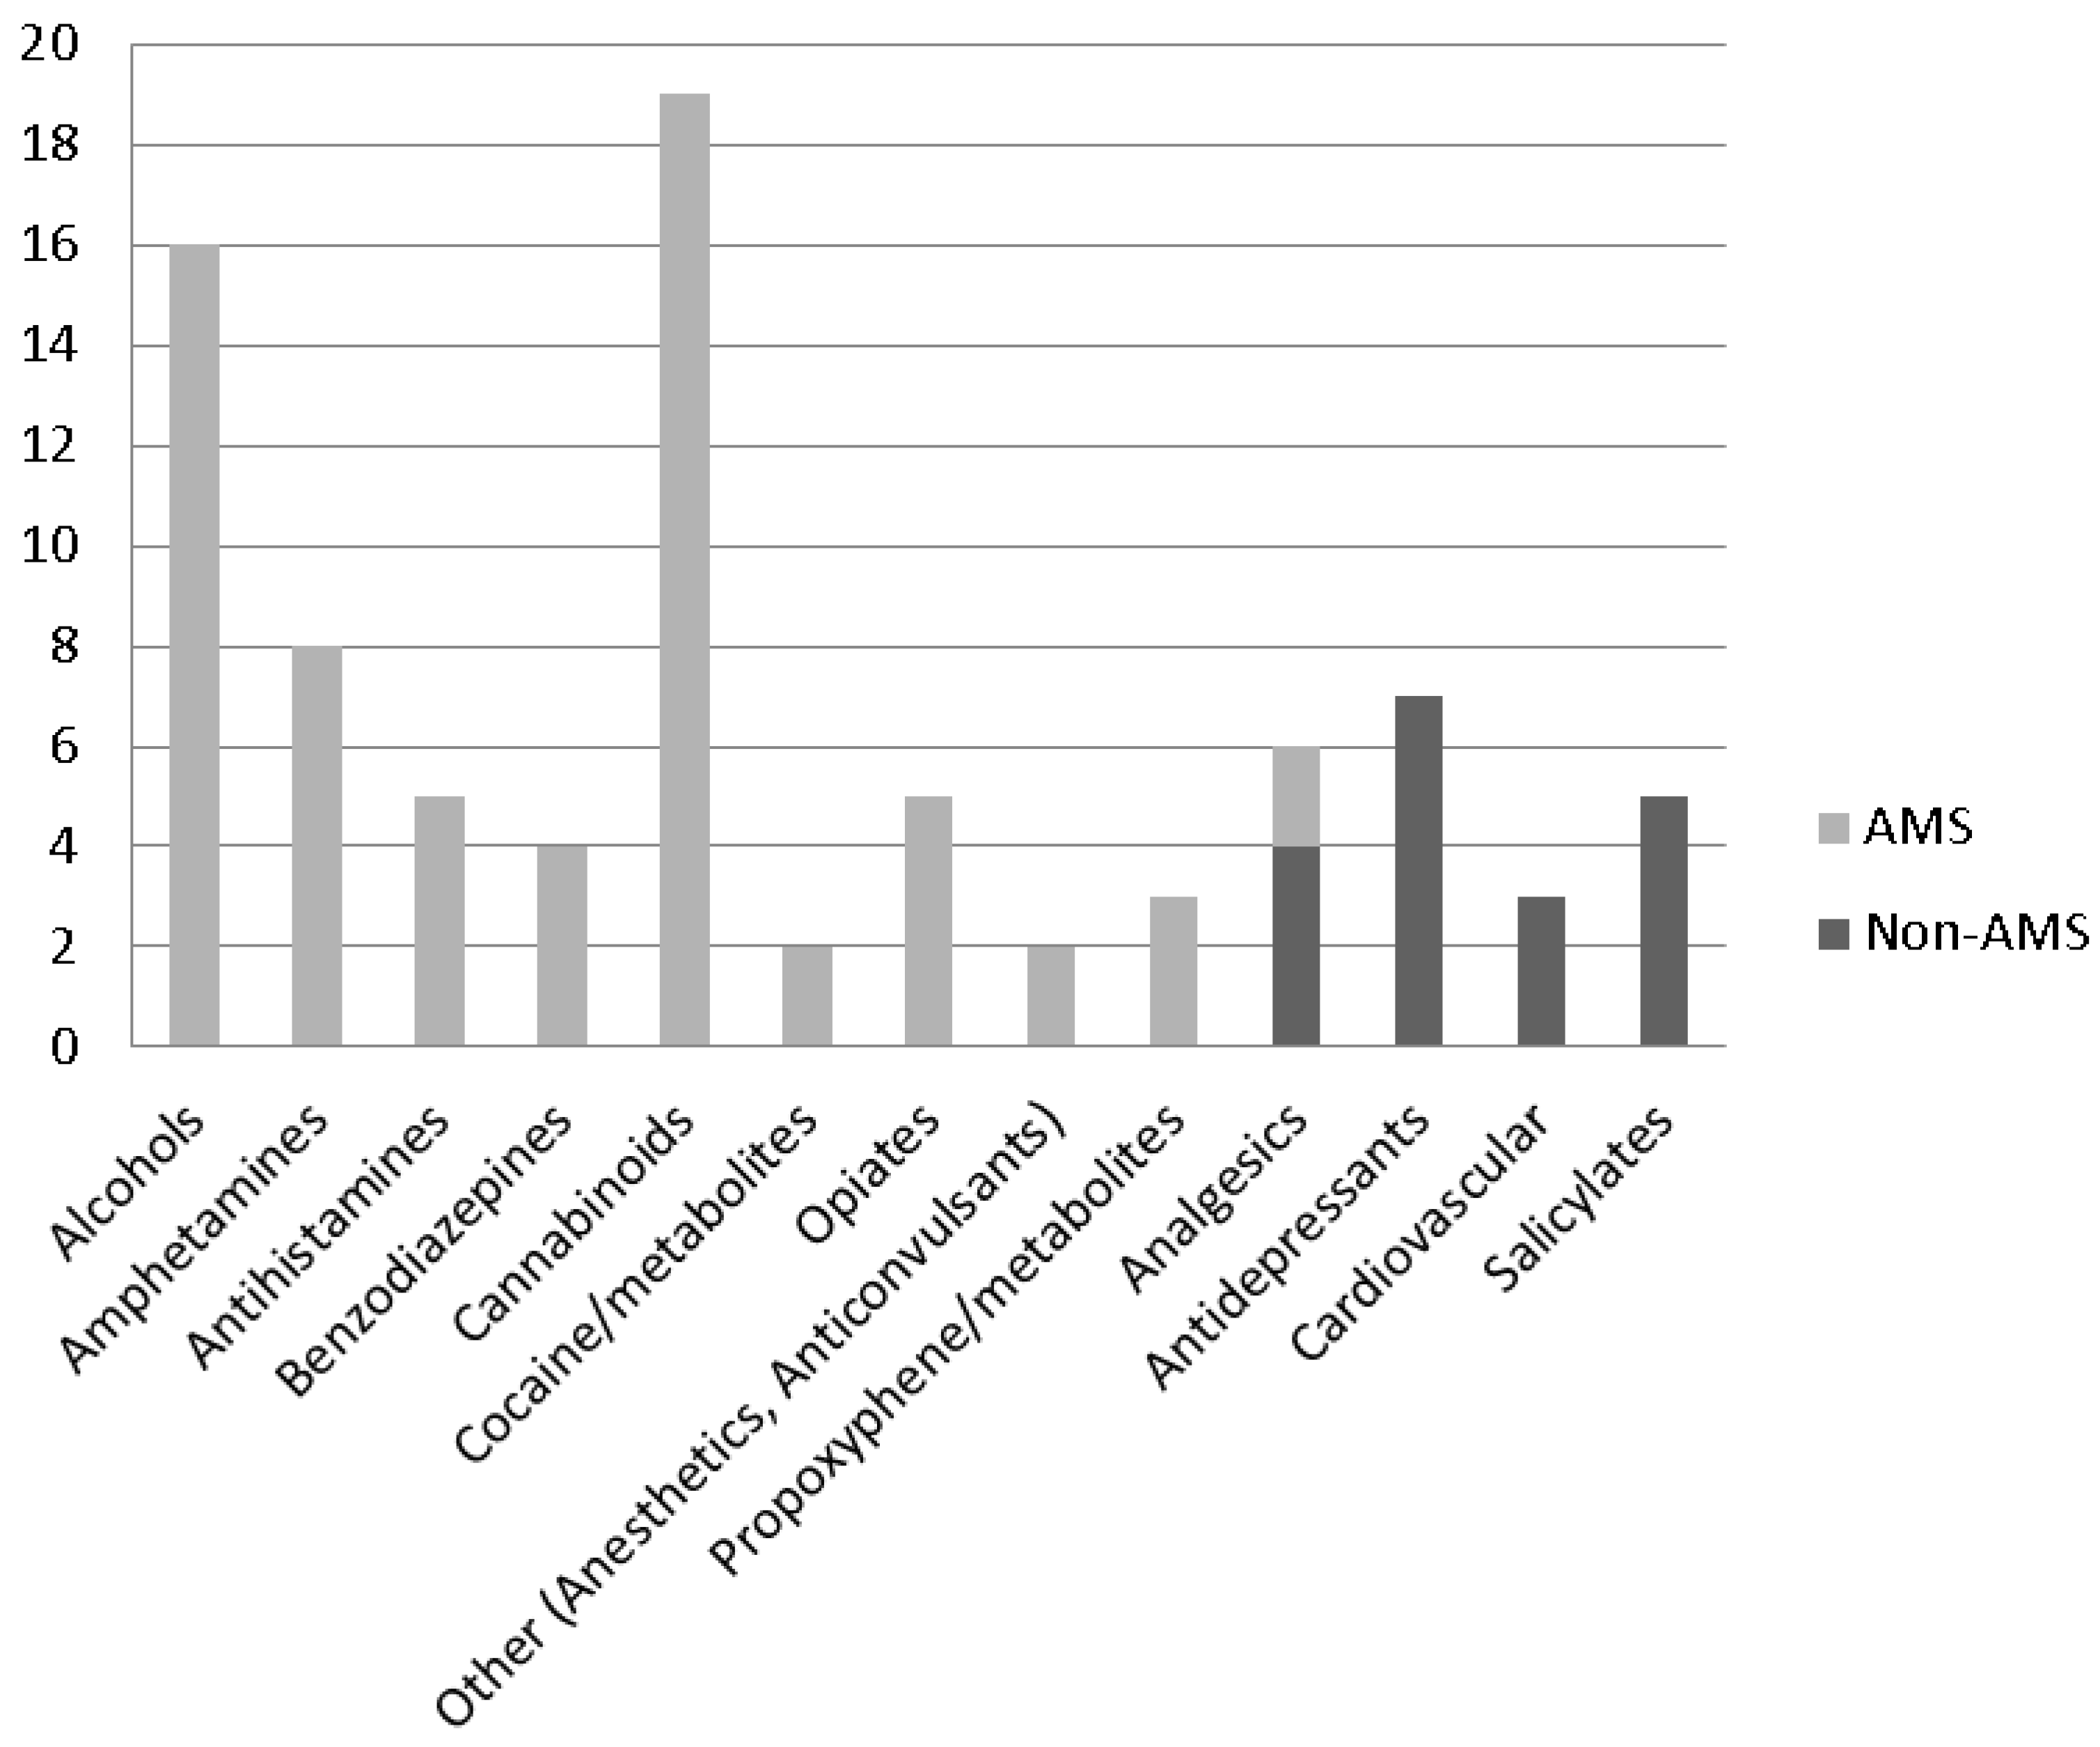
3.2. Positive Toxicology Tests
| Characteristic | Positive for any drug | Positive for drug with potential to alter mental status | Total n (col %) | ||
|---|---|---|---|---|---|
| n (row %) | p-value * | n (row %) | p-value * | ||
| ALL | 61 (21.8%) | 50 (17.9%) | 280 | ||
| Sex | 0.908 | 0.616 | (100%) | ||
| Female | 3 (23.1) | 3 (23.1) | 13 (4.6) | ||
| Male | 58 (21.7) | 47 (17.6) | 267 (95.4) | ||
| Race | 0.175 | 0.078 | |||
| White | 55 (21.3) | 44 (17.1) | 258 (96.3) | ||
| Other | 4 (40.0) | 4 (40.0) | 10 (3.7) | ||
| Age Group | 0.596 | 0.608 | |||
| 0–34 | 13 (21.7) | 12 (20.0) | 60 (21.4) | ||
| 35–49 | 20 (23.8) | 17 (20.2) | 84 (30.0) | ||
| 50–64 | 17 (17.7) | 13 (13.5) | 96 (34.3) | ||
| 65 & older | 11 (27.5) | 8 (20.0) | 40 (14.3) | ||
| Survival since day of injury (days) | 0.168 | 0.317 | |||
| 0 | 57 (21.1) | 47 (17.4) | 270 (96.4) | ||
| >0 | 4 (40.0) | 3 (30.0) | 10 (3.6) | ||
| SOC Occupation group | 0.612 | 0.500 | |||
| Construction & Maintenance | 11 (17.5) | 9 (14.3) | 63 (22.7) | ||
| Farming, Fishing, & Forestry | 17 (21.8) | 14 (18.0) | 78 (28.1) | ||
| Management, Business, Science, & Arts/Service/Sales & Office | 11 (29.0) | 10 (26.3) | 38 (13. 7) | ||
| Production, Transportation, & Material Moving | 22 (22.2) | 17 (17.2) | 99 (35.6) | ||
| NORA Industry group | 0.531 | 0.106 | |||
| Agriculture, Forestry & Fishing | 16 (19.8) | 14 (17.3) | 81 (30.1) | ||
| Construction/Mining/Oil & Gas Extraction | 10 (20.8) | 10 (20.8) | 48 (17.8) | ||
| Manufacturing | 6 (30.0) | 5 (25.0) | 20 (7.4) | ||
| Services/Public Safety/Health Care & Social Assistance | 14 (31.1) | 14 (31.1) | 45 (16.7) | ||
| Transportation, Warehousing & Utilities | 11 (21.2) | 5 (9.6) | 52 (19.3) | ||
| Wholesale & Retail Trade | 3 (13.0) | 2 (8.7) | 23 (8.6) | ||
| External Cause of Injury | 0.505 | 0.331 | |||
| MV Traffic | 14 (17.7) | 12 (15.2) | 79 (28.2) | ||
| Other Land Transport | 16 (25.8) | 15 (24.2) | 62 (22.1) | ||
| All Other | 31 (22.3) | 23 (16.6) | 139 (49.6) | ||
3.4. Discussion
4. Conclusions
Acknowledgments
Conflicts of interest
References
- North American Industry Classification System (NAICS). Available online: http://www.census.gov/eos/www/naics/ (accessed on 6 November 2013).
- Concha-Barrientos, M.; Nelson, D.I.; Fingerhut, M.; Driscoll, T.; Leigh, J. The global burden due to occupational injury. Am. J. Ind. Med. 2005, 48, 470–481. [Google Scholar] [CrossRef]
- Villanueva, V.; Garcia, A.M. Individual and occupational factors related to fatal occupational injuries: A case-control study. Accid. Anal. Prev. 2011, 43, 123–127. [Google Scholar] [CrossRef]
- Smith, G.S. Public health approaches to occupational injury prevention: do they work? Inj. Prev. 2001, 7, i3–i10. [Google Scholar] [CrossRef]
- Frone, M.R. Prevalence and distribution of alcohol use and impairment in the workplace: A U.S. national survey. J. Stud. Alcohol Drugs 2006, 67, 147–156. [Google Scholar]
- Smith, G.S.; Kraus, J.F. Alcohol and residential, recreational, and occupational injuries: A review of the epidemiologic evidence. Ann. Rev. Public Health 1988, 9, 99–121. [Google Scholar] [CrossRef]
- Baker, S.P.; Samkoff, J.S.; Fisher, R.S.; van Buren, C.B. Fatal occupational injuries. J. Am. Med. Assoc. 1982, 248, 692–697. [Google Scholar] [CrossRef]
- Zwerling, C. Current practice and experience in drug and alcohol testing in the workplace. Bull. Narc. 1993, 45, 155–196. [Google Scholar]
- Alleyne, B.C.; Stuart, P.; Copes, R. Alcohol and other drug use in occupational fatalities. J. Occup. Med. 1991, 33, 496–500. [Google Scholar]
- McNeilly, B.; Ibrahim, J.E.; Bugeja, L.; Ozanne-Smith, J. The prevalence of work-related deaths associated with alcohol and drugs in Victoria, Australia, 2001–6. Inj. Prev. 2010, 16, 423–428. [Google Scholar] [CrossRef]
- Fullerton, L.; Olson, L.; Crandall, C.; Sklar, D.; Zumwalt, R. Occupational Injury Mortality in New Mexico. Ann. Emerg. Med. 1995, 26, 447–454. [Google Scholar] [CrossRef]
- Lewis, R.J.; Cooper, S.P. Alcohol, other drugs, and fatal work-related injuries. J. Occup. Med. 1989, 31, 23–28. [Google Scholar]
- Greenberg, M.; Hamilton, R.; Toscano, G. Analysis of toxicology reports from the 1993–94 census of fatal occupational injuries. Compens. Work. Cond. Fall 1999, 26–28. [Google Scholar]
- Crandall, C.S.; Fullerton, L.; Olson, L.; Sklar, D.P.; Zumwalt, R. Farm-related injury mortality in New Mexico, 1980–91. Accid. Anal. Prev. 1997, 29, 257–261. [Google Scholar] [CrossRef]
- Kraus, J.F.; Peek, C.; Silberman, T.; Anderson, C. The accuracy of death certificates in identifying work-related fatal injuries. Am. J. Epidemiol. 1995, 141, 973–979. [Google Scholar]
- Peek-Asa, C.; McArthur, D.L.; Kraus, J.F. Determining injury at work on the California death certificate. Am. J. Public Health 1997, 87, 998–1002. [Google Scholar] [CrossRef]
- Runyan, C.W.; Loomis, D.; Butts, J. Practices of county medical examiners in classifying deaths as on the job. J. Occup. Environ. Med. 1994, 36, 36–41. [Google Scholar]
- Kleinbaum, D.G.; Kupper, L.L.; Morgenstern, H. Epidemiologic Research; John Wiley & Sons Inc.: Hoboken, NJ, USA, 1982. [Google Scholar]
- Higgins, D.N.; Casini, V.J.; Bost, P.; Johnson, W.; Rautiainen, R. The fatality assessment and control evaluation program’s role in the prevention of occupational fatalities. Inj. Prev. 2001, 7, i27–i33. [Google Scholar] [CrossRef]
- Physician’s Reference for Urine and Blood Drug Testing and Interpretation. Available online: http://www.aitlabs.com/uploadedfiles/services/pocket_guide_smr086.pdf (accessed on 6 November 2013).
- Substance Abuse; Mental Health Services Administration. In Clinical Drug Testing in Primary Care; Health and Human Services Publication: Rockville, MD, USA, 2012.
- Standard Occupational Classification. Available online: http://www.bls.gov/soc/ (accessed on 6 November 2013).
- Manta Media Inc. Available online: http://www.manta.com/ (accessed on 2 June 2013).
- The National Occupational Research Agenda (NORA). Available online: http://www.cdc.gov/niosh/nora/L (accessed on 6 November 2013).
- DiSantostefano, J. International classification of diseases 10th revision (ICD-10). J. Nurse Pract. 2009, 5, 56–57. [Google Scholar] [CrossRef]
- Heckman, J.J. Sample selection bias as a specification error. Econometrica 1979, 47, 153–161. [Google Scholar] [CrossRef]
- Rogers, E.; Wiatrowski, W.J. Injuries, illnesses, and fatalities among older workers. Mon. Labor Rev. 2005, 128, 24–30. [Google Scholar]
- Toossi, M. Employment outlook: 2008–18. Labor force projections to 2018: Older workers staying more active. Mon. Labor Rev. 2009, 132, 30–51. [Google Scholar]
© 2013 by the authors; licensee MDPI, Basel, Switzerland. This article is an open access article distributed under the terms and conditions of the Creative Commons Attribution license (http://creativecommons.org/licenses/by/3.0/).
Share and Cite
Ramirez, M.; Bedford, R.; Sullivan, R.; Anthony, T.R.; Kraemer, J.; Faine, B.; Peek-Asa, C. Toxicology Testing in Fatally Injured Workers: A Review of Five Years of Iowa FACE Cases. Int. J. Environ. Res. Public Health 2013, 10, 6154-6168. https://doi.org/10.3390/ijerph10116154
Ramirez M, Bedford R, Sullivan R, Anthony TR, Kraemer J, Faine B, Peek-Asa C. Toxicology Testing in Fatally Injured Workers: A Review of Five Years of Iowa FACE Cases. International Journal of Environmental Research and Public Health. 2013; 10(11):6154-6168. https://doi.org/10.3390/ijerph10116154
Chicago/Turabian StyleRamirez, Marizen, Ronald Bedford, Ryan Sullivan, T. Renee Anthony, John Kraemer, Brett Faine, and Corinne Peek-Asa. 2013. "Toxicology Testing in Fatally Injured Workers: A Review of Five Years of Iowa FACE Cases" International Journal of Environmental Research and Public Health 10, no. 11: 6154-6168. https://doi.org/10.3390/ijerph10116154
APA StyleRamirez, M., Bedford, R., Sullivan, R., Anthony, T. R., Kraemer, J., Faine, B., & Peek-Asa, C. (2013). Toxicology Testing in Fatally Injured Workers: A Review of Five Years of Iowa FACE Cases. International Journal of Environmental Research and Public Health, 10(11), 6154-6168. https://doi.org/10.3390/ijerph10116154