Article

Discovery of MK8383s with Antifungal Activity from Mangrove Endophytic Fungi Medicopsis sp. SCSIO 40440 Against Fusarium Wilt of Banana

1
CAS Key Laboratory of Tropical Marine Bio-Resources and Ecology/Guangdong Key Laboratory of Marine Materia Medica, South China Sea Institute of Oceanology, Chinese Academy of Sciences, 164 West Xingang Road, Guangzhou 510301, China
2
University of Chinese Academy of Sciences, Beijing 100049, China
3
College of Plant Protection, South China Agricultural University, Guangzhou 510642, China
*
Authors to whom correspondence should be addressed.
These authors contribute equally to this work.
Mar. Drugs 2025, 23(2), 88; https://doi.org/10.3390/md23020088
Submission received: 27 January 2025 / Revised: 12 February 2025 / Accepted: 15 February 2025 / Published: 18 February 2025

Abstract

:
Fusarium wilt of banana (FWB), caused by Fusarium oxysporum f. sp. cubense (Foc) tropical race 4 (TR4), poses a severe threat to the global banana industry. The screening of endophytic fungi from the mangrove plant led to the identification of Medicopsis sp. SCSIO 40440, which exhibited potent antifungal activity against Fusarium. The further fraction of the extract yielded ten compounds, including MK8383 (1) and nine new analogues, MK8383s B-J (210). The structures of 110 were elucidated using extensive spectroscopic data and single-crystal X-ray diffraction analysis. In vitro antifungal assays revealed that 1 showed strongly antifungal activities against Foc TR4, with an EC50 of 0.28 μg/mL, surpassing nystatin and hygromycin B (32 and 16 μg/mL, respectively). Pot experiments showed that 1 or spores of SCSIO 40440 could significantly reduce the virulence of Foc TR4 on Cavendish banana.

Graphical Abstract

1. Introduction

Fusarium wilt of banana (FWB) is widely recognized as the most challenging epidemic affecting bananas, which are considered the fourth most important staple crop globally, following corn, rice, and wheat [1]. The FWB-causing pathogen is Fusarium oxysporum f. sp. cubense (Foc), a member of the Fusarium oxysporum species complex (FOSC) [2]. Foc can survive in soil for decades and spreads through contaminated plants, soil, tools, and water [3]. Four races of Foc have been identified based on the host banana cultivars, with tropical race 4 (TR4) being the most devastating [1,4]. TR4 can infect nearly all banana cultivars and poses a significant threat to global banana trade and food security, potentially exacerbating poverty in developing nations and intensifying world hunger [1,5]. Initially confined to East Asia and parts of Southeast Asia for over two decades, Foc TR4 has spread westward since 2010 to five additional countries in Southeast and South Asia (Vietnam, Laos, Myanmar, India, and Pakistan) and transcontinentally to the Middle East (Oman, Jordan, Lebanon, and Israel) and Africa (Mozambique) [3]. In China and Australia, FWB causes an approximately 40% annual yield loss, resulting in economic losses of USD 91 million and USD 138 million, respectively [6]. Projections estimate FWB will affect 17% of global banana-growing areas by 2040, equating to 36 million tons of production loss valued at over USD 1 billion [7].
Mangrove-associated microorganisms are a proven source of bioactive metabolites [8,9,10], particularly endophytic fungi, which are the second-largest ecological group and play a pivotal role in the biosphere’s creation and maintenance [10]. These fungi are a rich source of diversity of bioactive natural products, attracting significant interest from organic chemists and pharmacologists [10]. Recent research has highlighted their potential in producing antifungal compounds. For instance, symmetrical dimer coumarins showed significant antifungal activities against Fusarium oxysporum, surpassing the positive control, triadimefon [11]. Additionally, fusaridioic acid, characterized by a β-lactone ring, exhibited antifungal activities against pathogenic fungus pestalotiopsis theae [12].
In our efforts to explore bioactive natural products from mangrove endophytic fungi, Medicopsis sp. SCSIO 40440 was isolated from the healthy stem of Pluchea indica of mangrove [13]. The strain’s fermentation extract exhibited potent antifungal properties against the FOSC. Subsequently, ten decalin carboxylic acids were isolated from the extract of Medicopsis, including MK8383 (1) and nine new analogues, MK8383s B–J (210). The structures of 110 were elucidated by NMR spectroscopic data analyses and X-ray single-crystal diffraction. In vitro antifungal assays against Fusarium sp. compound 1 was found to display a strong inhibitory effect on the mycelial growth of Foc TR4, with an EC50 of 0.28 μg/mL, 57 or 114 times more potent than hygromycin B (16 μg/mL) and nystatin (32 μg/mL), respectively. Pot experiments were carried out to further investigate the biocontrol efficiency of compound 1 and Medicopsis sp. SCSIO 40440 against Foc TR4. The results showed a considerable reduction in the disease index and effective inhibition of root infection. Herein, we report the isolation, structure elucidation, and antifungal bioactivity of compounds 110.

2. Results

2.1. Antifungal Activity and Isolation

The endophytic fungus Medicopsis sp. SCSIO 40440 was isolated from the fresh, healthy stems of Pluchea indica and identified through a sequence analysis of the ITS region of its rDNA [13]. The antifungal activity of extracts of M. sp. SCSIO 40440 was evaluated, showing strong inhibitory activity against five FOSCs (Table S1). To further characterize the antifungal metabolites, Medicopsis sp. SCSIO 40440 was subsequently fermented in oat media. The organic phase was extracted four times using butanone, and the extracts were subjected to a variety of chromatographic steps, including column chromatography, gel chromatography, and semi-preparative HPLC. This process led to the isolation of ten decline carboxylic acids (110), nine of which were new (210) (Figure 1). The structures of isolated compounds were elucidated by HRESIMS, spectroscopic data, and X-ray analysis.

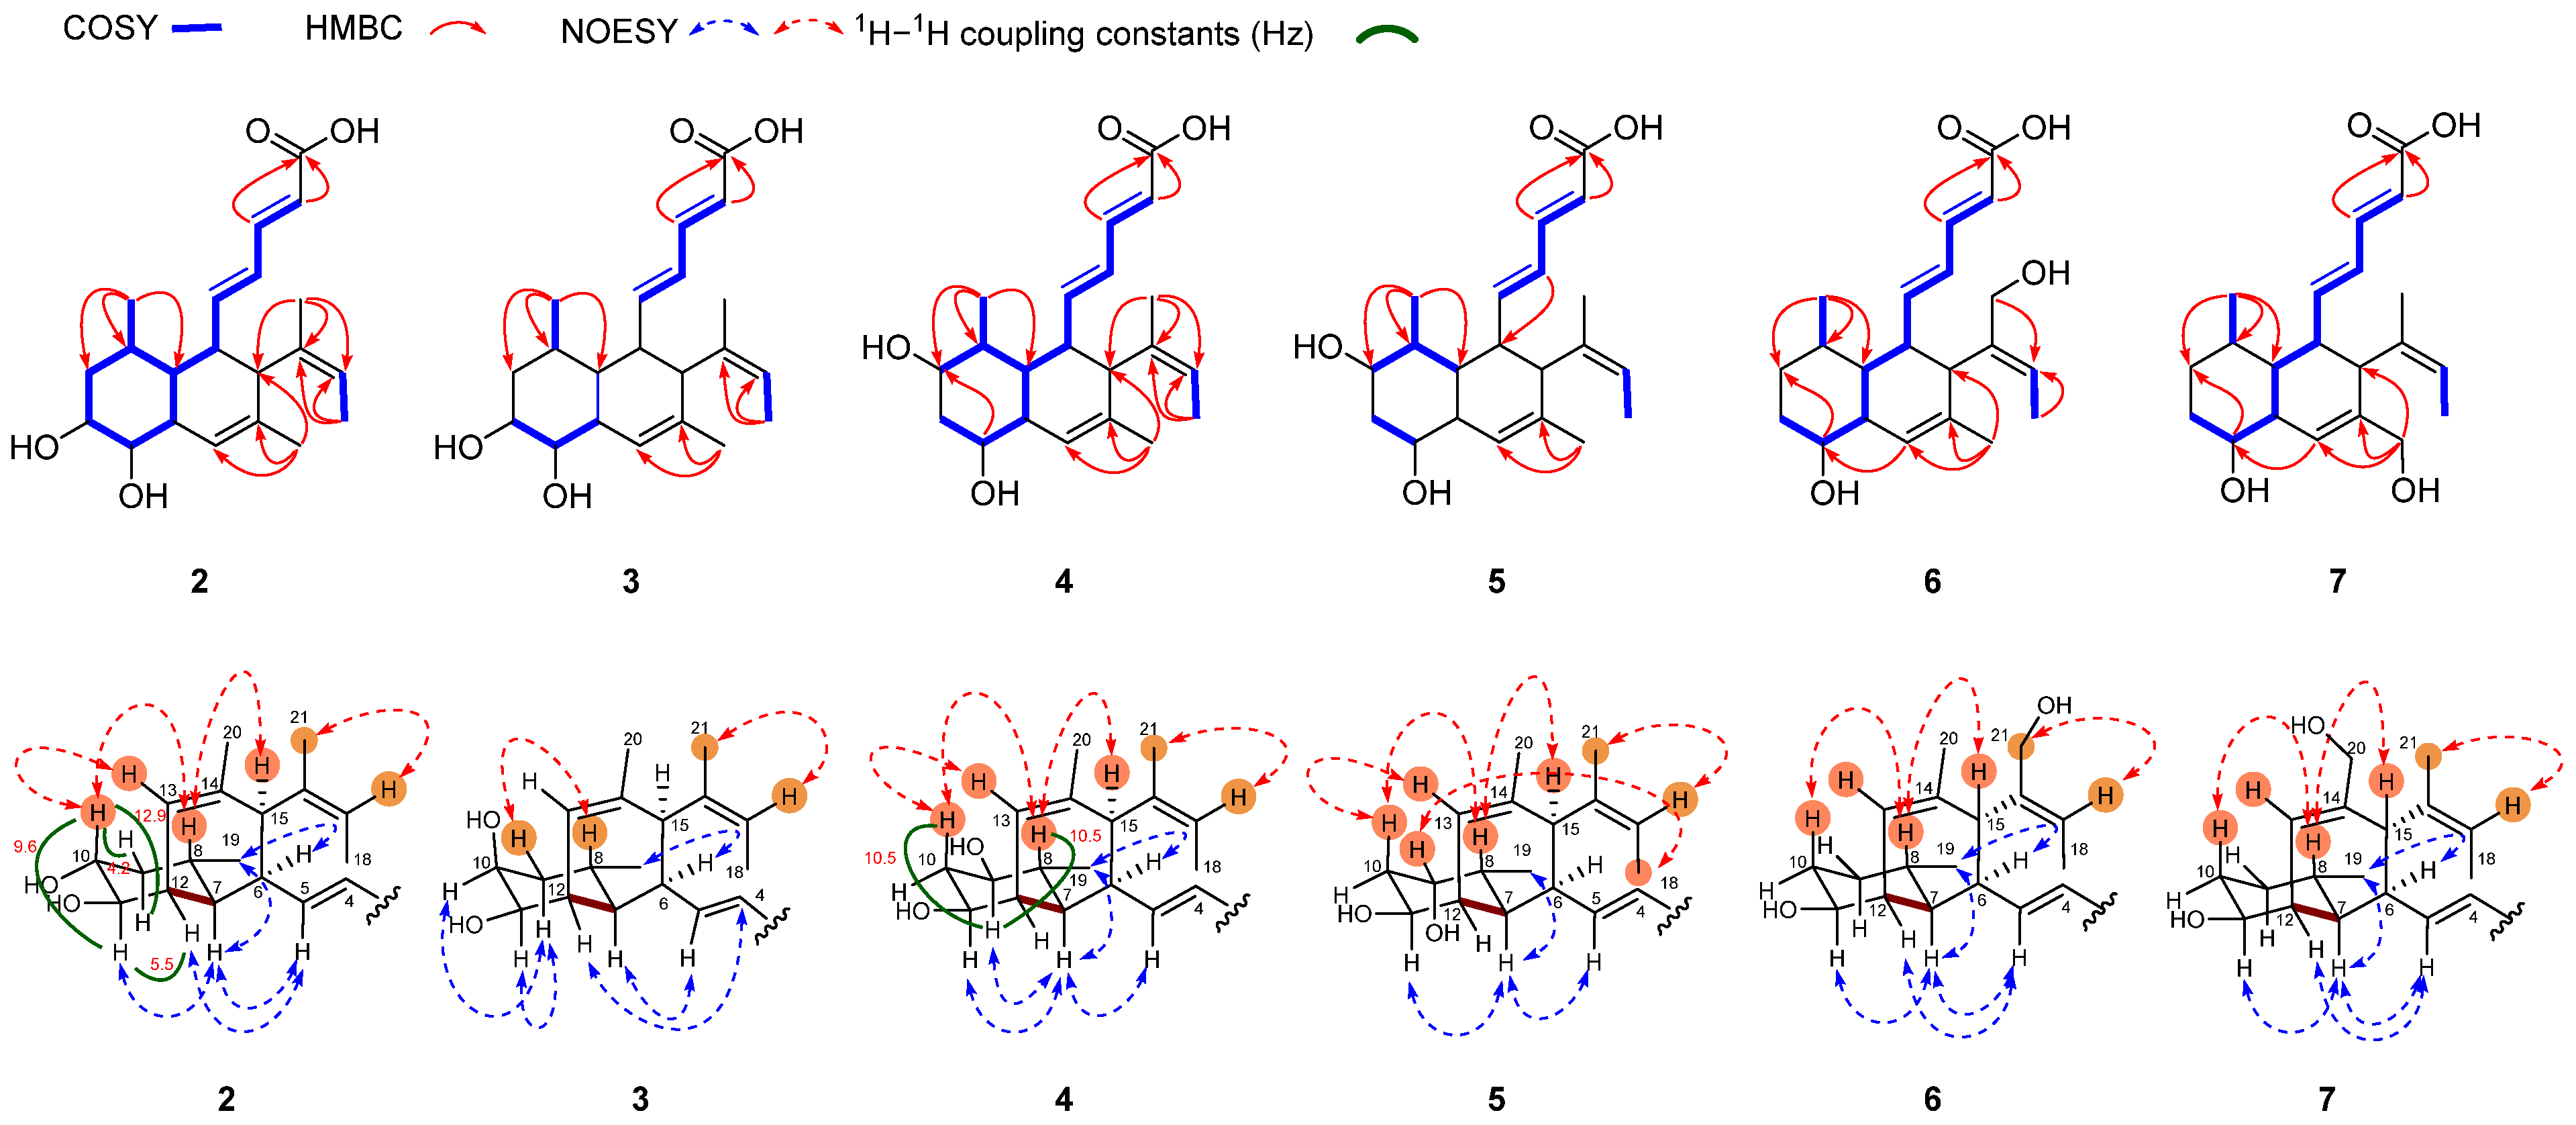
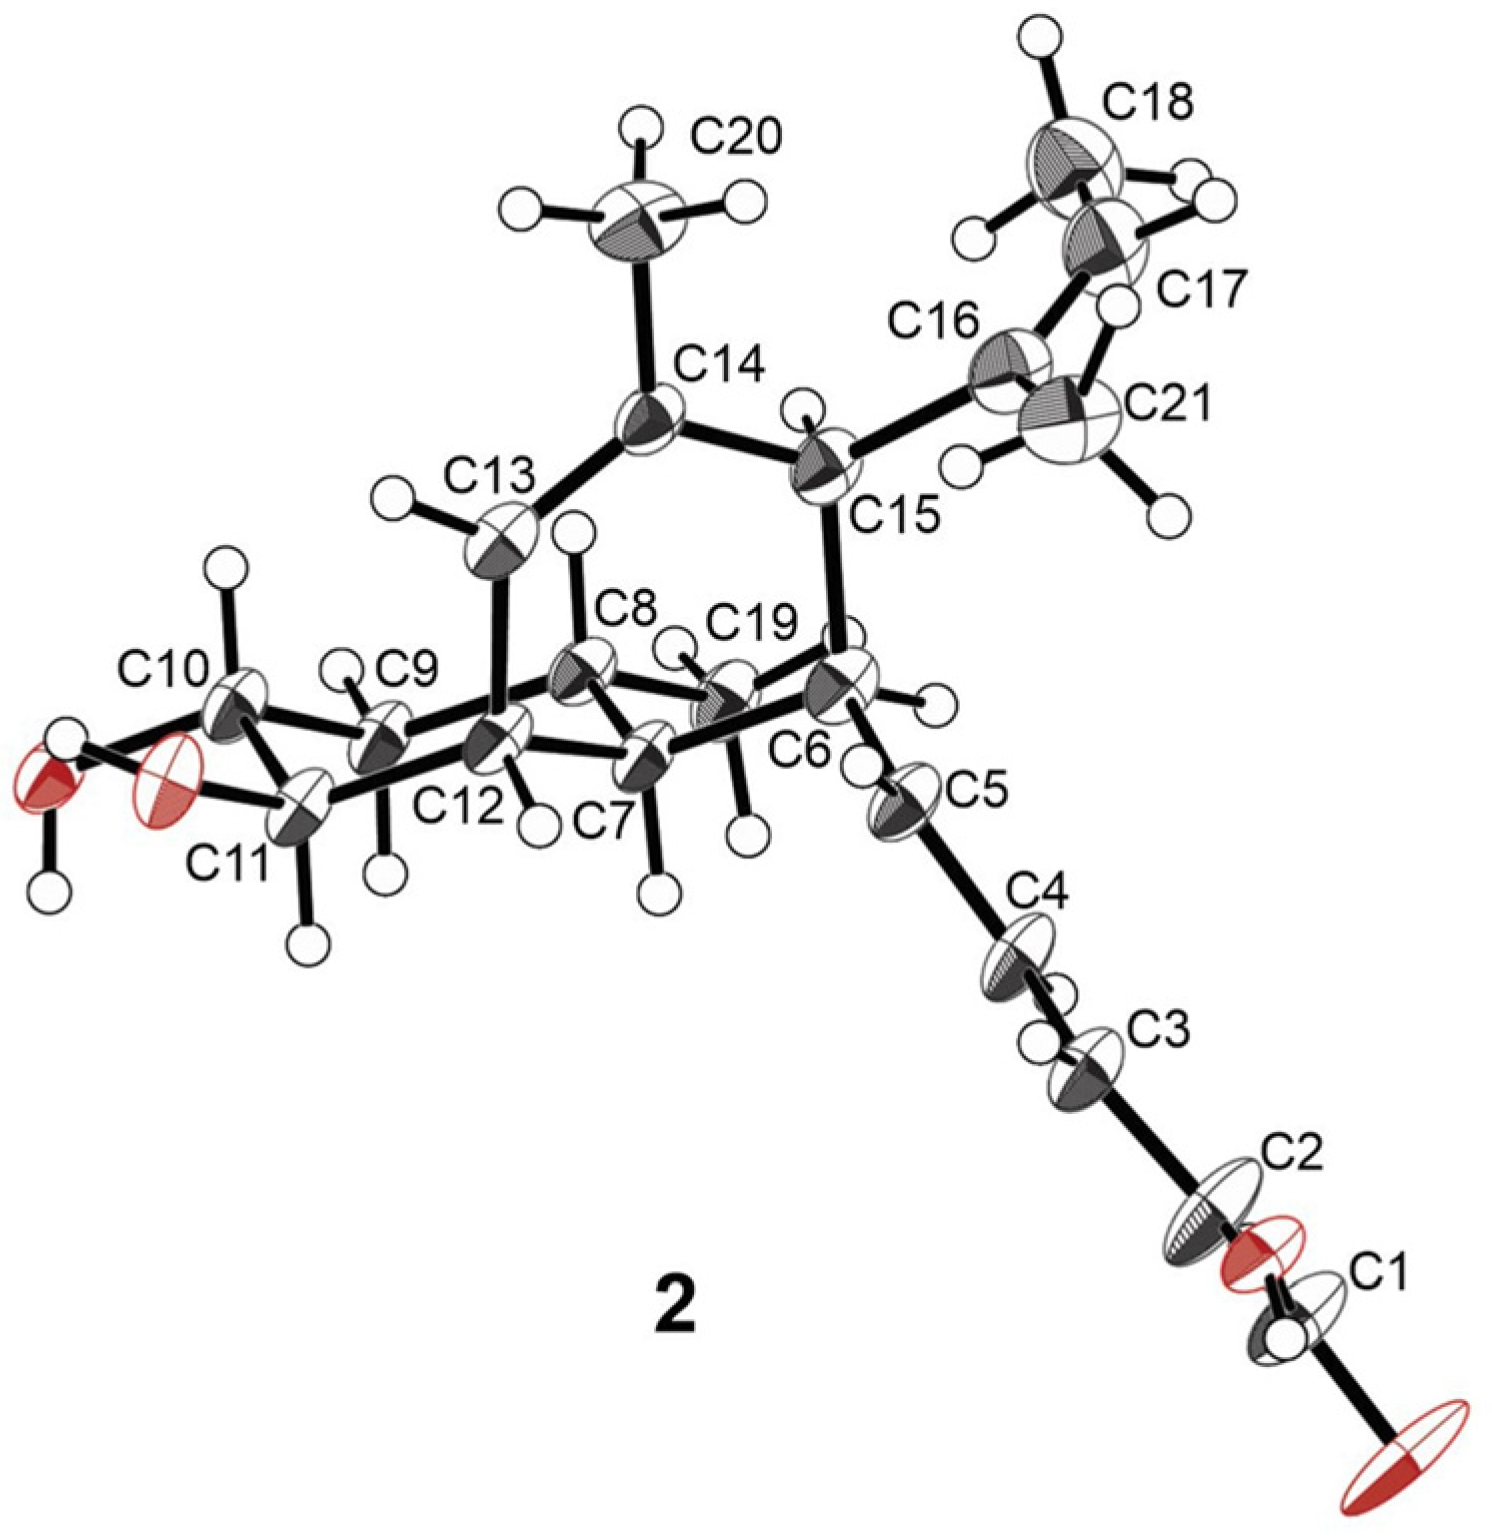
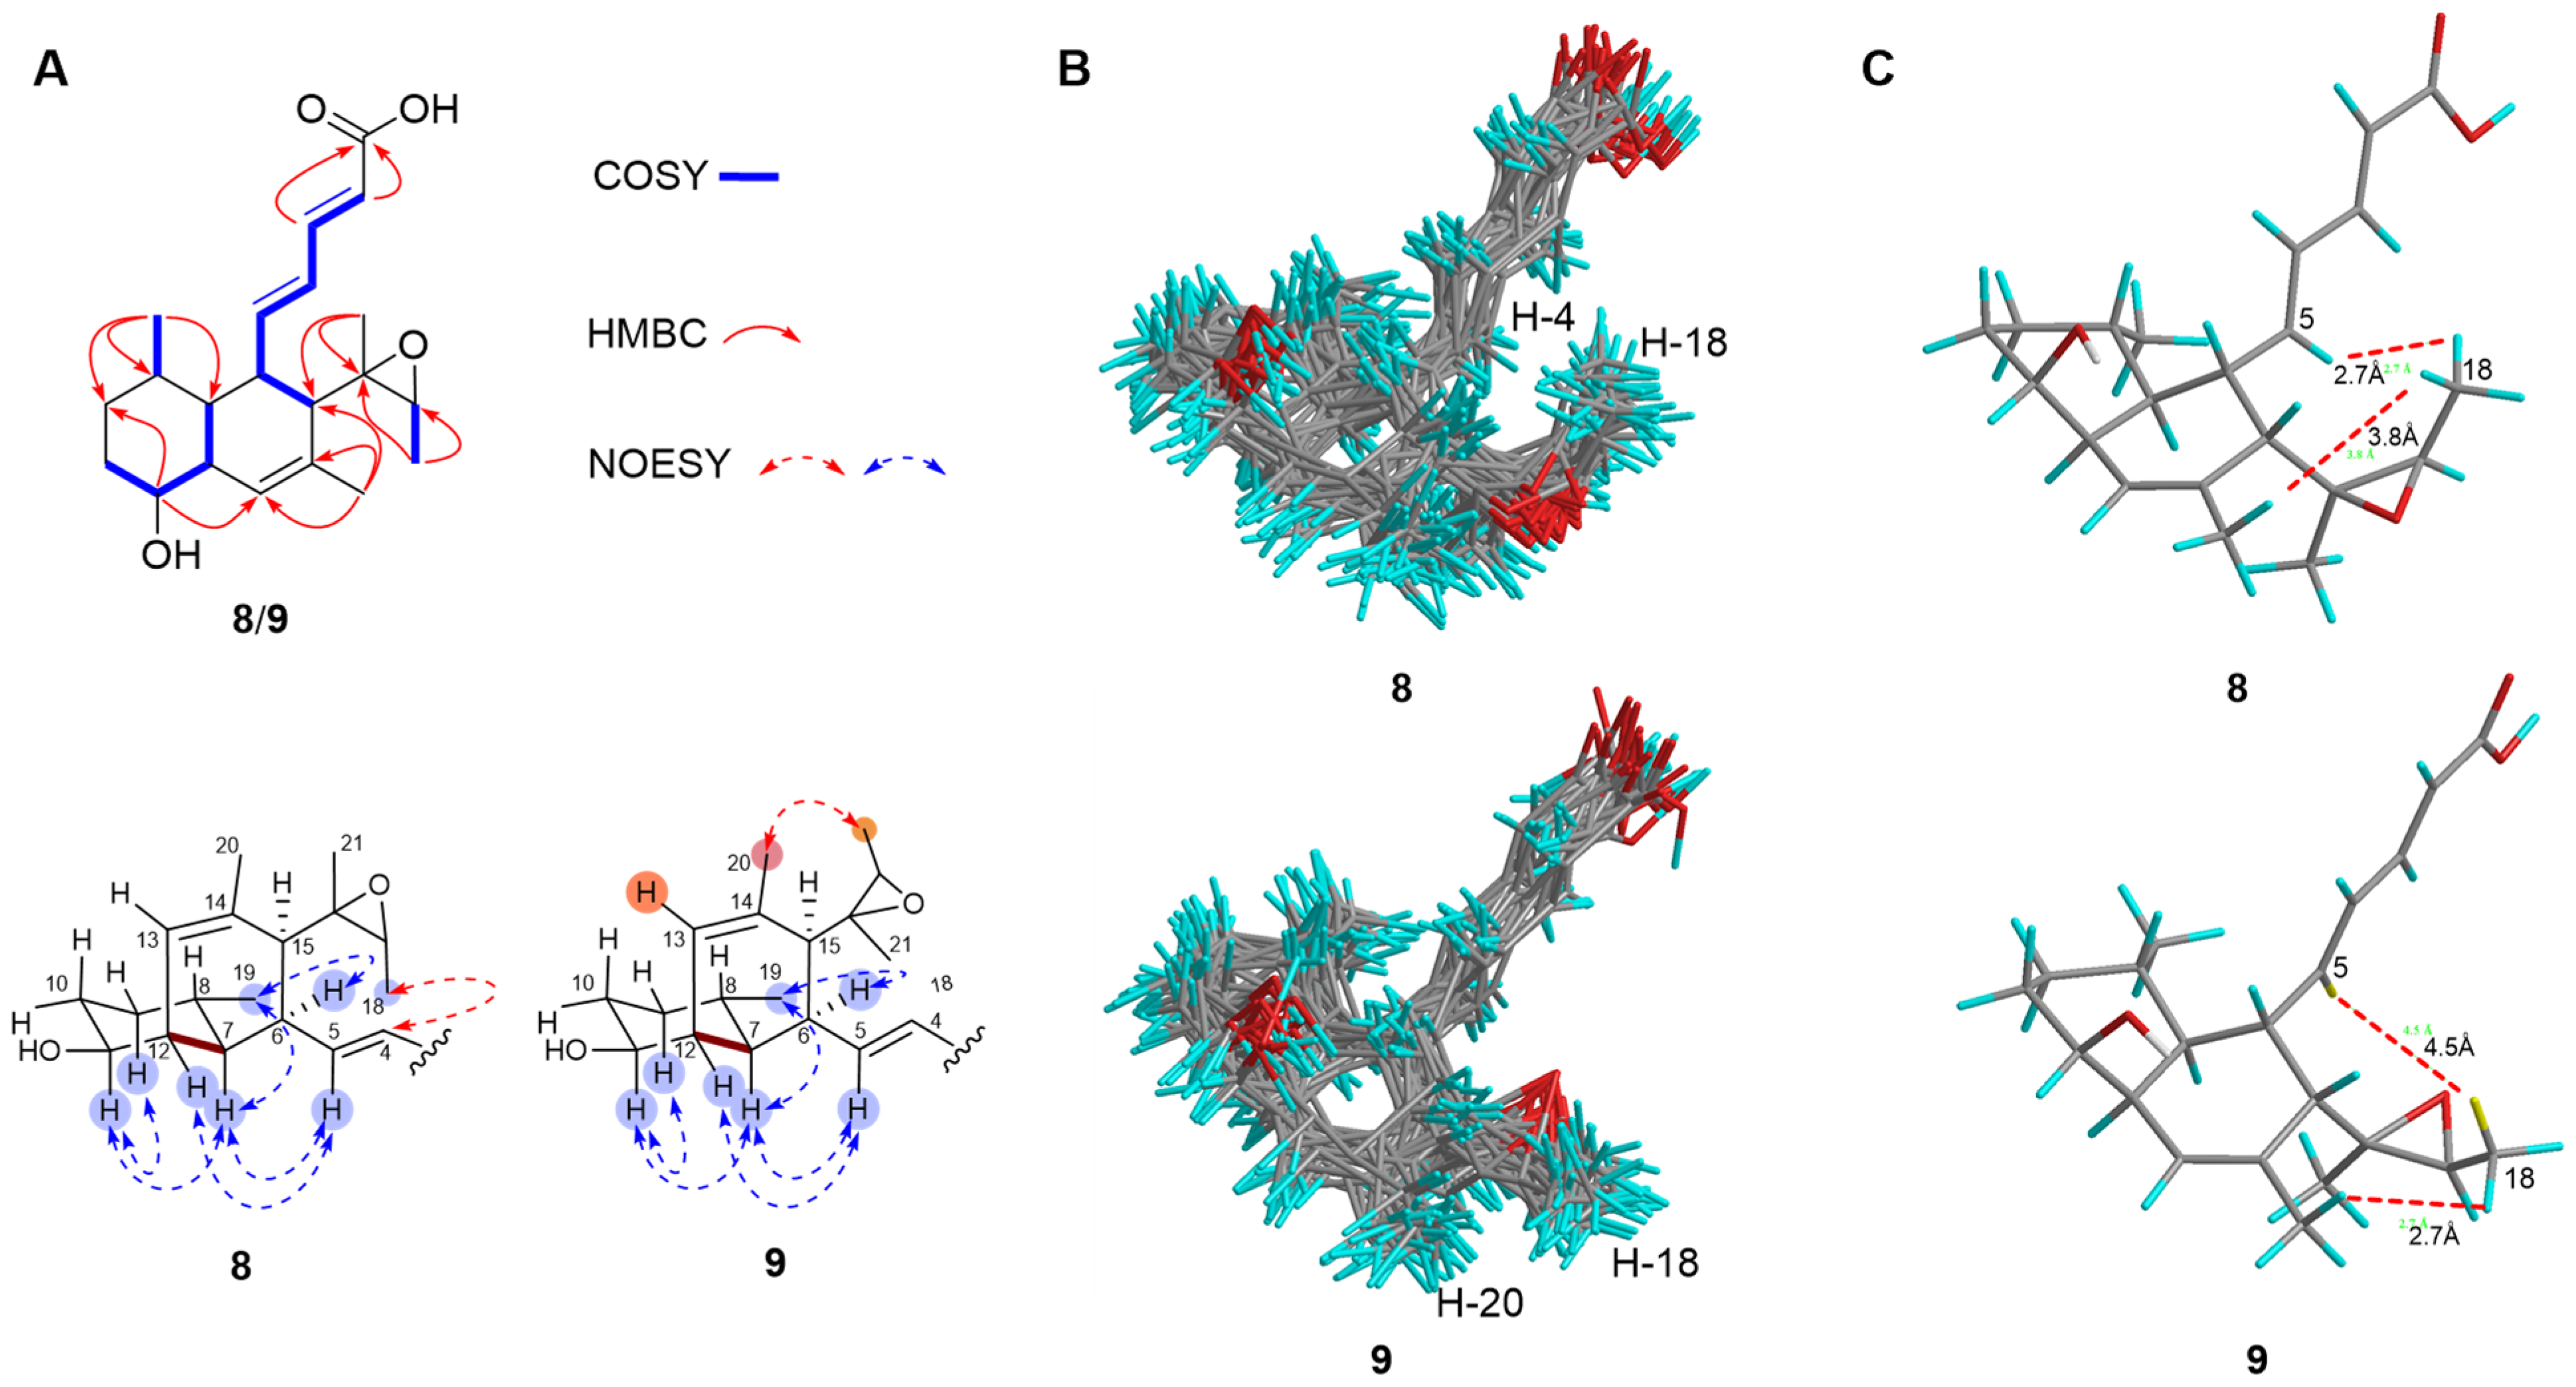
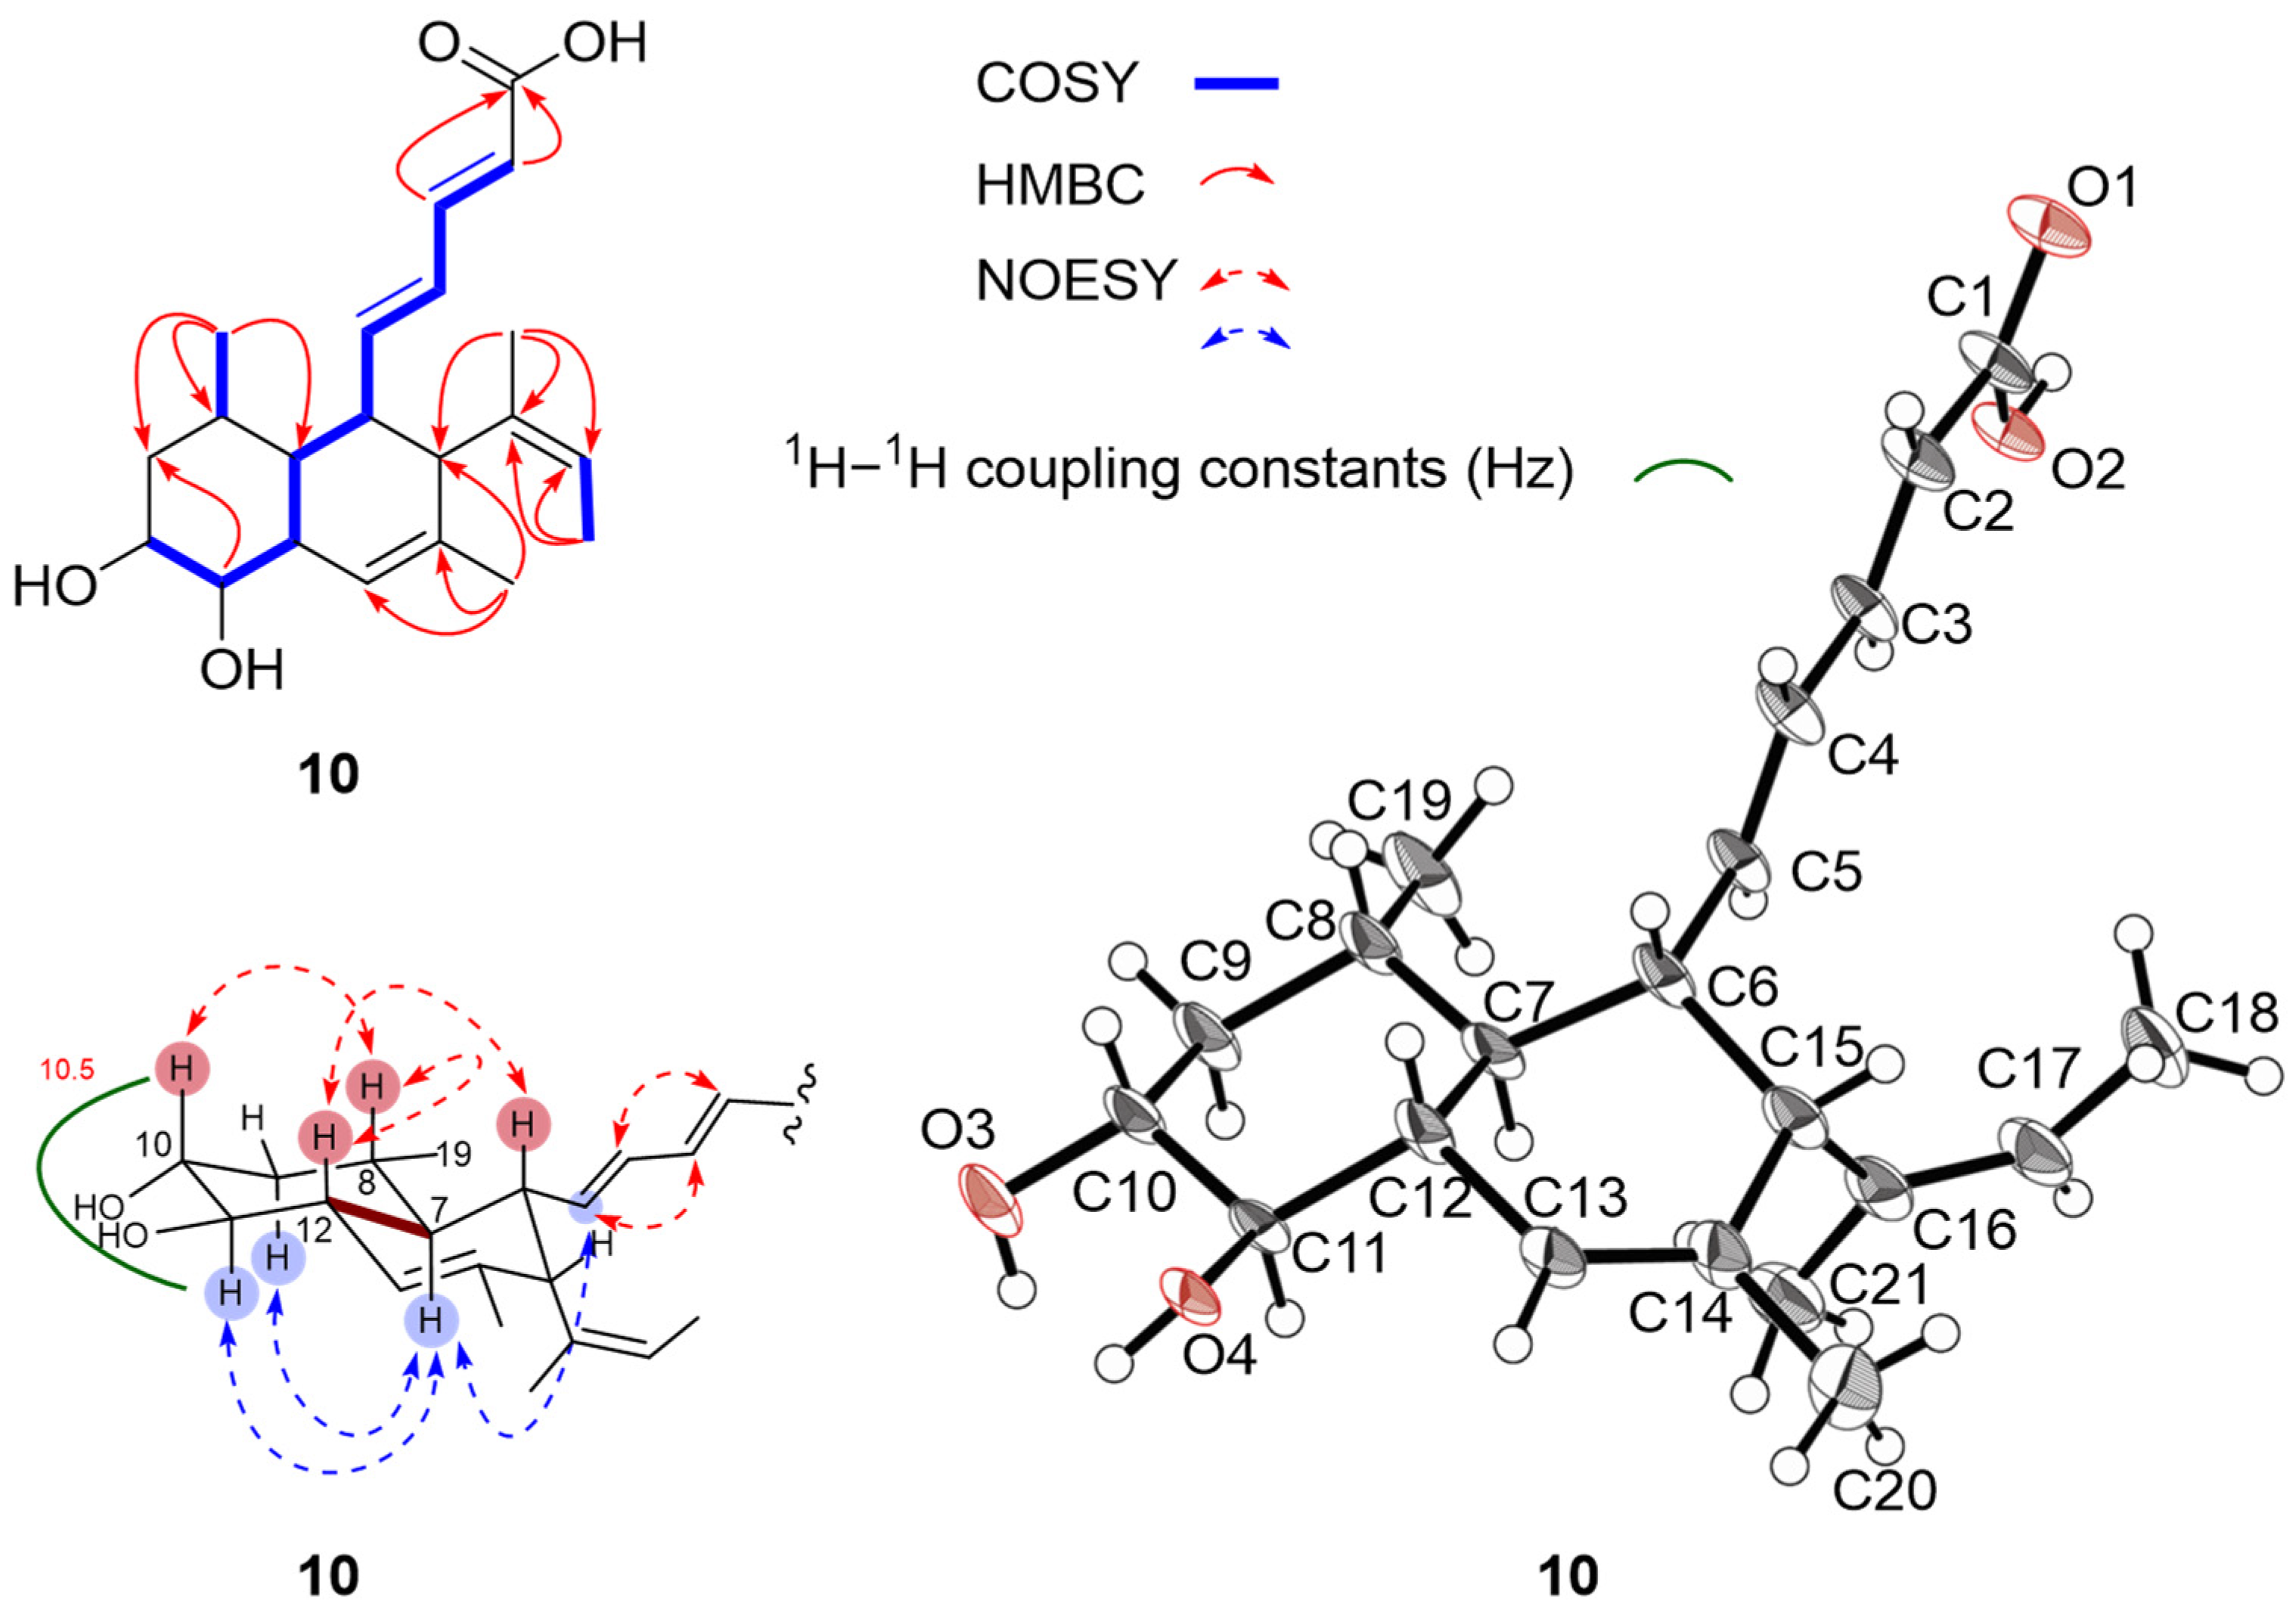
2.2. Structure Elucidation

Compound 1 was assigned as MK8383 by comparing its HRESIMS and NMR data with those reported in the literature (Table S2, Figure S1) [14,15]. MK8383 B (2) was isolated as a colorless solid. The HR-ESI(+)MS analysis determined a molecular formula of C21H30O4, containing an additional oxygen atom compared to 1. The 1H and 13C NMR data in 2 (Table 1 and Table 2, Figure S2) were highly similar to those of 1. The significant difference was the presence of an additional hydroxyl group (δH 3.42; δC 70.4) at C-10 in 2, which was supported by the COSY correlations of H-10/H-11, and HMBC correlations from H-8/H-12 to C-10 (Figure 2). The relative configuration of 2 was determined by its 1H NMR data and NOESY correlations. The geometries of Δ2 and Δ4 were determined to be E by the corresponding coupling constants of 15.0 Hz and 15.4 Hz. The Δ16 was assigned as Z due to the observed NOESY correlation of H-17 and H3-21. The coupling constants of H-10 (δH 3.42) with H-9ax, H-11, and H-9eq were observed to be 12.9 Hz, 9.6 Hz, and 4.2 Hz, respectively (Table 1, Table S3), suggesting an axial orientation for H-10, H-9ax, and H-11, and an equatorial orientation for H-9eq. The observed signal at H-11 (δH 3.36) displayed a coupling constant of 5.5 Hz with H-12, implying an equatorial orientation for H-12. The NOESY correlations of H-11/H-7, H-7/H3-19, H-6/H3-19, and H-7/H-5 indicated an axial orientation for H-7 and H-11 and an equatorial orientation for H3-19 and H-6. The NOESY correlations of H-15/H-8 and H-8/H-10 revealed a pseudo-axial orientation for H-15. Finally, compound 2 was crystallized in a methanol solution. The single X-ray crystal diffraction analysis using Cu Kα radiation (CCDC no. 2400777, flack parameter value 0.1 (2)) (Figure 3, Table S4) confirmed the planar structure and the relative configuration of 2. Given that 2 was proposed to be biosynthetically derived from 1 by hydroxylation at C-11 [16], the absolute configurations of 2 was assigned as 6S, 7S, 8S, 10R, 11R, 12S, and 15R, consistent with that of 1.
10-epi-MK8383 B (3) was isolated as a white amorphous powder. The HRESIMS analysis of 3 established a molecular formula of C21H30O4, which is an isomer of 2. The 1H and 13C NMR data for 3 (Table 1 and Table 2, Figure S3) were almost identical to those of 2. An extensive NMR analysis suggested that 3 and 2 should have the same planar structure. The NOESY correlations of H-10/H-9ax, H-9ax/H-11, and H-9aq/H-8 revealed the β-configuration of 10-OH, which was different from that in 2 (Figure 2, Table S3). Thus, the absolute configurations of 3 was assigned as 6S, 7S, 8S, 10S, 11R, 12S, and 15R.
MK8383 C (4) was isolated as a white powder. The HRESIMS analysis of 4 demonstrated a molecular formula of C21H30O4, which was the same as that of 2. The 1H and 13C NMR data of 4 (Table 1 and Table 2, Figure S4) were similar to those of 2. The HMBC correlations from H3-19 to C-9 supported an OH group at C-9 in 4, different from the 10-OH in 2. The 1H NMR data of 4 revealed the 9-OH was in an equatorial orientation, supported by the large coupling constants of H-9 with H-10ax (J = 10.5 Hz) and H-8 (J = 10.5 Hz) (Table S5). Furthermore, the relative configuration of 4 were assigned by NOESY correlations (Figure 2), and its absolute configuration was thus assigned as 6S, 7R, 8R, 9R, 11S, 12S, and 15R.
9-epi-MK8383 C (5) was isolated as a white amorphous powder. The HRESIMS analysis determined a molecular formula of C21H30O4 for 5, which indicated 5 to be an isomer of 4. The 1H and 13C NMR data for 5 (Table 1 and Table 2, Figure S5) were almost identical to those of 4. An extensive NMR analysis suggested that 5 had the same planar structure as that of 4. The NOESY correlations of H-9/H3-18 revealed the α-orientation of 9-OH in 5, different from the β-orientation in 4 (Figure 2). Thus, the absolute configurations of 5 was assigned as 6S, 7R, 8R, 9S, 11S, 12S, and 15R.
MK8383 D (6) was isolated as a white powder. The HRESIMS analysis established a molecular formula of C21H31O4. The 1H and 13C NMR data of 6 (Table 1 and Table 2, Figure S6) and 1 were highly similar. The difference was that 6 has an additional hydroxyl group at C-21, which was assigned by the HMBC correlations from H2-21/H3-18 to C-17 (Figure 2). Finally, the relative configuration of 6 was assigned by coupling constants and NOESY correlations, and the absolute configuration assigned as 6S, 7S, 8S, 11S, 12S, and 15S, which was the same as 1 according to the biosynthetic pathway [16].
MK8383 E (7) was isolated as a white powder. The HRESIMS analysis established a molecular formula of C21H30O4, which included one oxygen atom more than 1. The 1H and 13C NMR data of 7 (Table 1 and Table 2, Figure S7) was similar to those of 1. The difference was the presence of an additional hydroxyl group at C-20, as evidenced by HMBC correlations from H2-20 to C-13/C-14/C-15 (Figure 2). The relative configuration of 7 was determined by coupling constants and NOESY correlations, with the absolute configuration assigned as the same as that of 1.
MK8383 F (8) was isolated as a white powder. The HRESIMS analysis established a molecular formula of C21H30O4, having one more oxygen atom than 1. The NMR data of 8 and 1 (Table 1 and Table 2, Figure S8) were highly similar. The difference was the observation of two sp3 oxygen-bearing carbons (δH 2.82/δC 59.4, H-17/C-17; δC 62.7, C-16) in 8, instead of the sp2 methine (δH 5.36/δC 122.5, H-17/C-17) and olefinic quaternary carbon (δC 135.6, C-16) in 1. This indicated the presence of an epoxide group at C-16/C-17 in 8, instead of the double bond in 1, which was further supported by HMBC correlations from H3-18/H3-21 to C-16/C-17 (Figure 4).
MK8383 G (9) was isolated as a white powder. The molecular formula of 9 was established as C21H30O4 by HRESIMS. A detailed NMR data (Table 1 and Table 2, Figure S9) analysis established that the planar structures of 9 and 8 were identical. The stereochemistry of 6S, 7S, 8S, 11S, 12S, and 15S in 8 and 9 were assigned according to their shared biosynthetic pathway, which was the same as that of 1 [16]. Due to the considerable conformational flexibility of the epoxide group, assigning the stereochemistry of C-16/C-17 proved challenging. The careful analysis of the NOESY correlations of 8 and 9 showed a correlation between H3-18 and H-4 in 8, and a correlation between H3-18 and H3-20 in 9 (Figure 4). Subsequently, molecular models of the α-oriented and β-oriented epoxide at C-16/C-17 were subjected to a Low-Mode MD conformational search (MMFF94x force field) to identify conformers within 5 kcal/mol of the energy geometry (Figure 4). The Boltzmann-weighted average distance between H3-18 and H-4 was found to be shorter in an α-oriented epoxide, while the distance between H3-18 and H3-20 was shorter in a β-oriented epoxide (Figure 4). Based on these data, the relative configurations were tentatively assigned as 16S*, 17R* for 8, and 16R*, 17S* for 9.
MK8383 I (10) was isolated as a white powder. The HRESIMS analysis established a molecular formula of C21H30O4. Detailed NMR data (Table 1 and Table 2, Figure 5 and Figure S10) suggested that 10 and 2 shared the same planar structure. The large couplings for H-2/H-3 (J = 15.3 Hz), as well as the NOESY correlation for H-2/H4 and H-3/H-5, confirmed the E-geometry for 2Δ and 4Δ in 10. The large couplings for H-10/H-11 (J = 10.5 Hz) indicated that both 10-OH and 11-OH were in an equatorial orientation, the same as those in 2. The NOESY correlations of H-10/H-8, H-12/H-8, and H-12/H-6 suggested that H-10/H-8/H-12/H-6 were on the same side of the decalin ring. In contrast, the NOESY correlations of H-11/H-7 and H-7/H-5 indicated that H-11/H-7/H-5 were on the opposite side. This assignment revealed a trans configuration between H-7 and H-12 in 10, instead of a cis configuration in 2. Finally, compound 10 was crystallized from a mixture of MeOH and H2O (9:1), which allowed the confirmation of the planar structure of 10 and the unequivocal assignment of its absolute configuration as 6S,7S,8S,10R,11R,12R, and 15R by single X-ray crystal diffraction analysis with the Flack parameter of 0.06(11) using Cu Kα radiation (CCDC no. 2400778) (Table S4).
Compounds 19 feature a rare cis-decalin ring, while 10 has a trans-decalin ring. The NMR spectra of 19 were significantly broadened or even diminished to be unobservable in various solvents (Figure S1B and Figure 6A), whereas 10 displayed sharp resonance signals (Figure 6A). Notable, 2 differs from 10 only in the configuration of C-12. We hypothesized that the broadening NMR signals for 19 are due to the increased flexibility of the cis-decalin ring, as described recently [17,18]. Thus, we moved to DFT calculations to substantiate our hypothesis. We computed the Boltzmann populations of 2 and 10 using DFT calculation at the B3LYP/6- 31+G(d,p) level. The results showed that the conformational space of 2 is occupied by four conformations (99.2%), while 10 exhibits less flexibility, with its conformational space primarily populated by two conformations (99.5%) (Figure 6B). This calculation explains why the 1H and 13C NMR spectra of 19 were significantly broadened or even diminished to be unobservable, whereas 10 displayed sharp resonance signals.

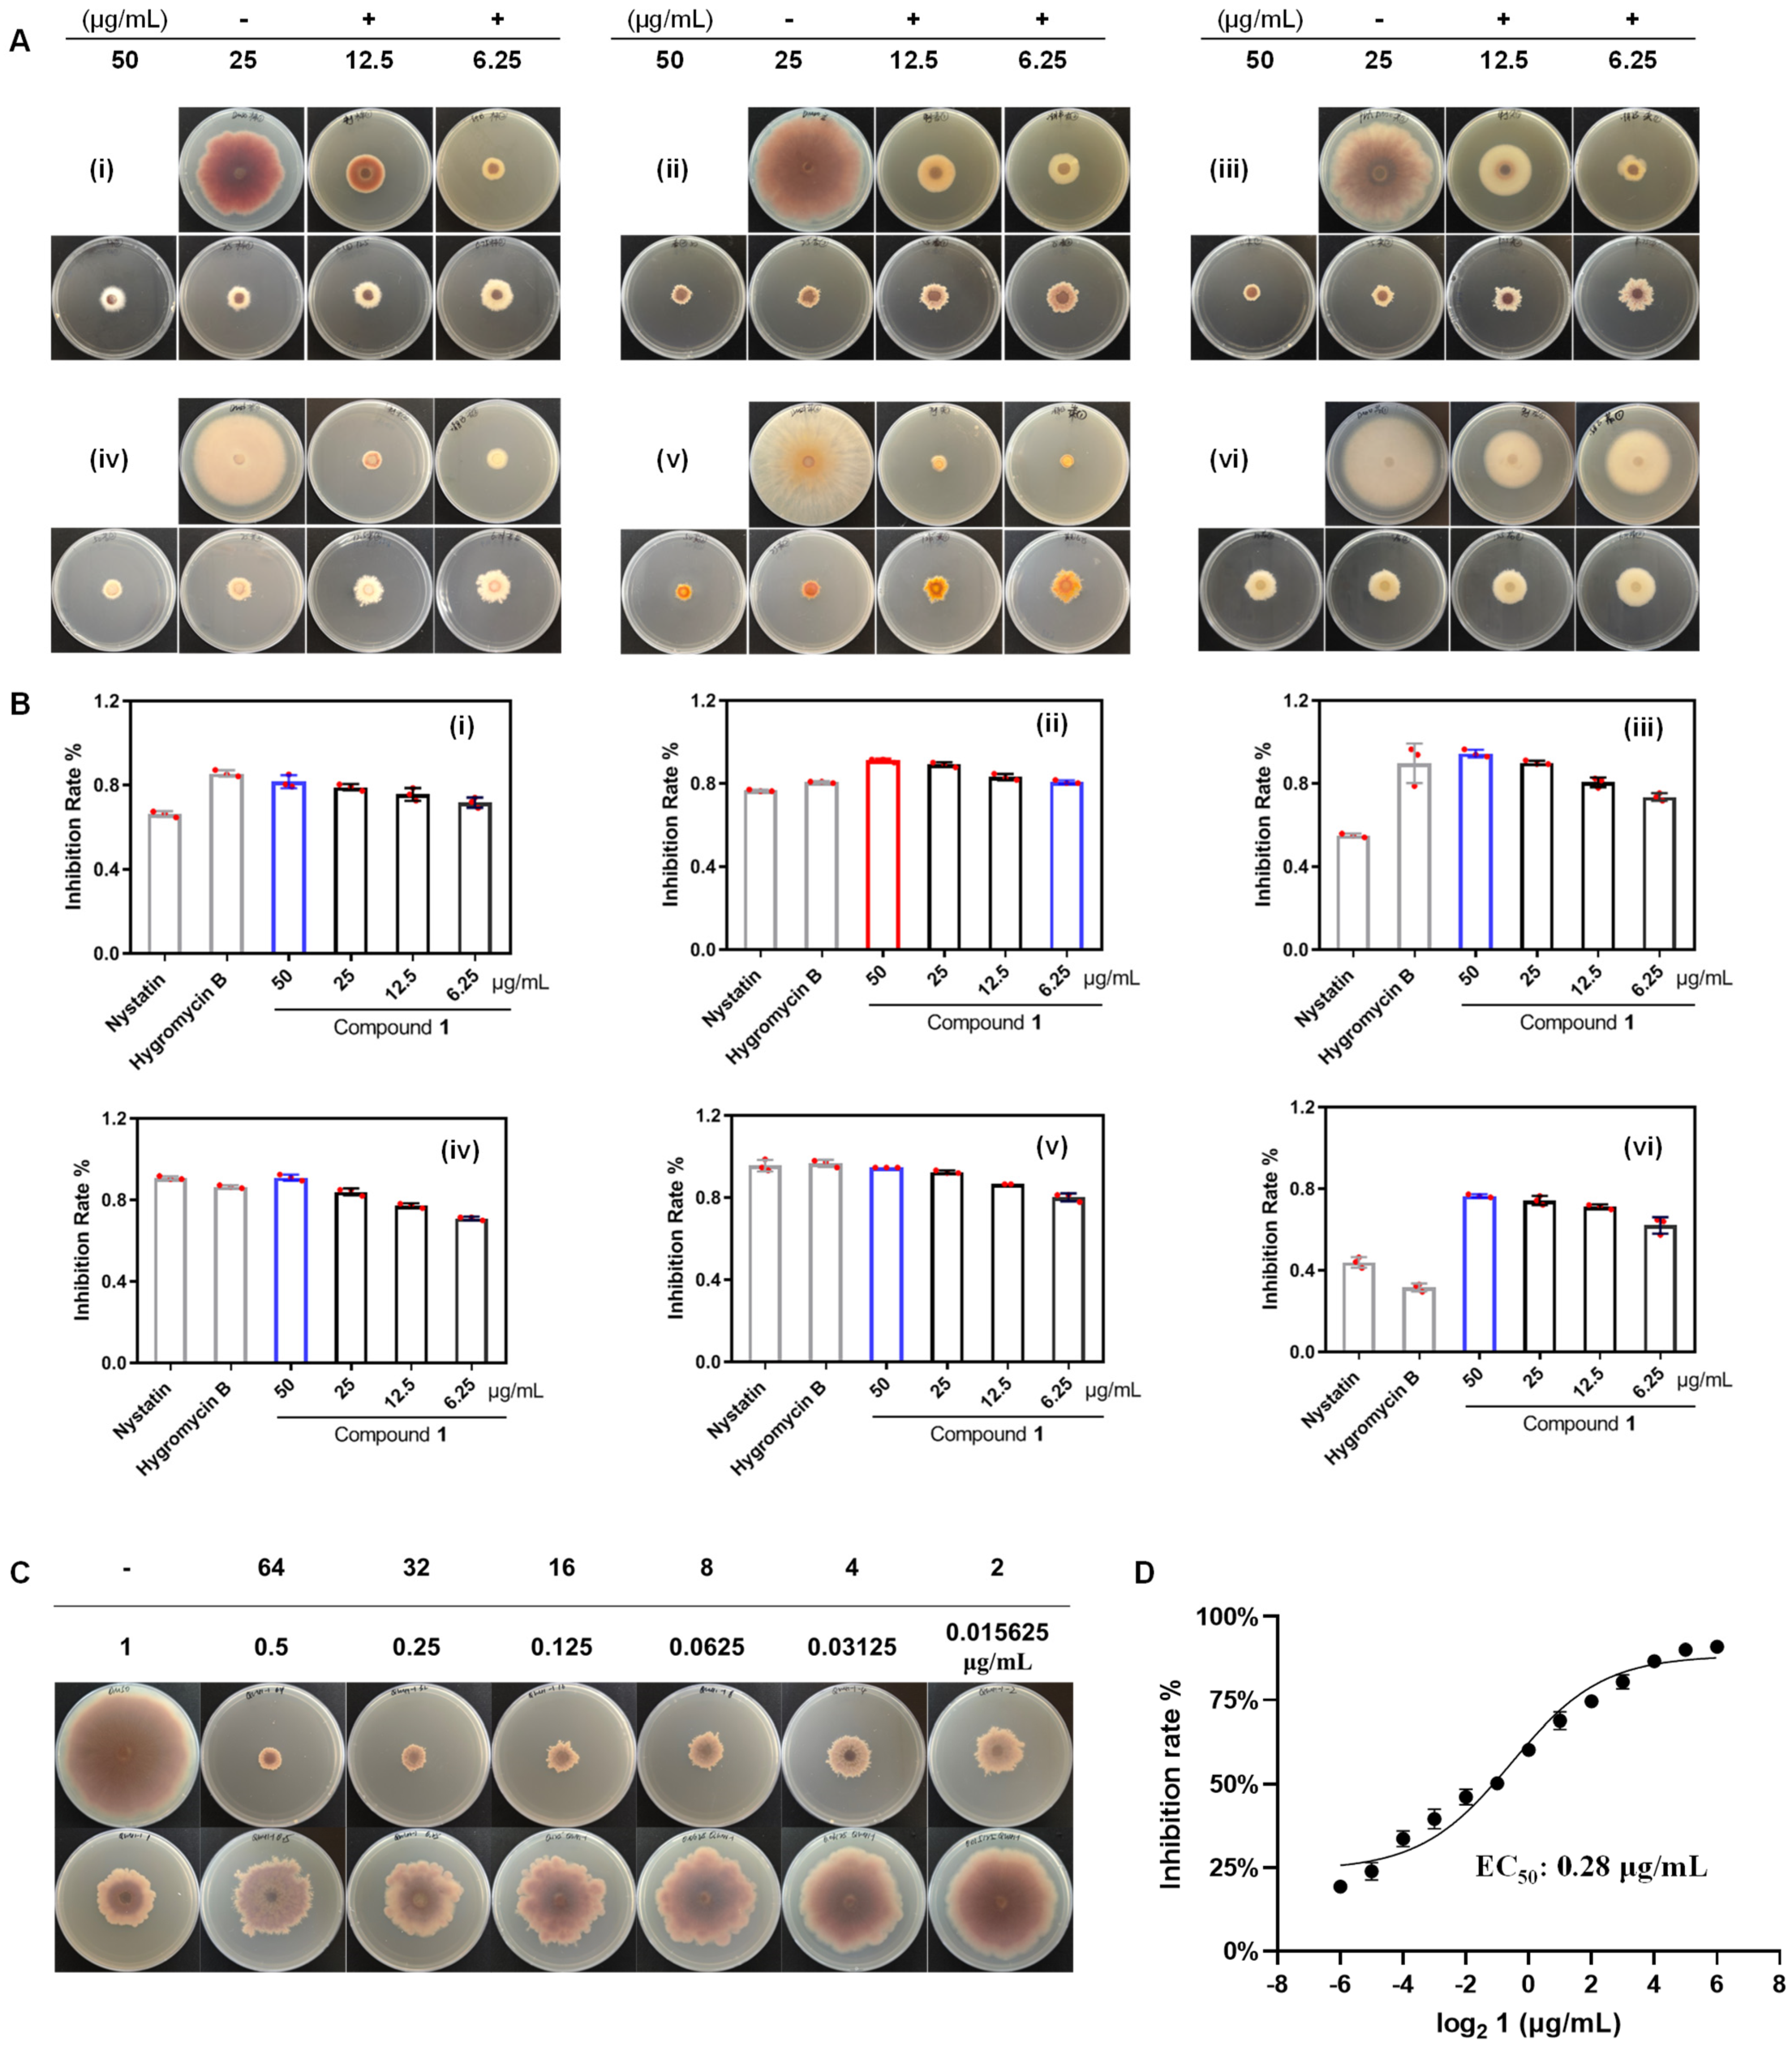
2.3. Activity of Isolated Compounds Against Fusarium Species

Compounds 1, 2, 4, 6, and 10 were evaluated for their antifungal activities using the Kirby–Bauer disc diffusion method. Among these, compounds 1 and 2 demonstrated a range of antifungal effects against various the FOSC (Figure S11). Notably, compound 1 displayed strong antifungal activity against multiple FOSCs, including Fov [19], Foc TR4 [1], Fov Atk. Sny & Hans [20], Fom Sun & Huang [21], Foc Owen [22], and Fsp [23] (Figure S11). Furthermore, the inhibitory effect of compound 1 on the mycelial growth of six different FOSCs was assessed. As shown in Figure 7, at a concentration of 50 ppm (50 μg/mL), the inhibition rate of compound 1 against Fom Sun & Huang and Foc Owen was comparable to nystatin and hygromycin B (Figure 7A(iv,v),B(iv,v)). Compound 1 showed comparable inhibition activity to hygromycin B and a stronger inhibition effect than that of nystatin against Fov and Fov Atk. Sny & Hans (Figure 7A(i,iii),B(i,iii)). Significantly, at the same concentration (50 ppm), compound 1 exhibited superior inhibitory effects against Foc TR4 and Fsp compared to nystatin and hygromycin B (Figure 7A(ii,vi),B(ii,vi)). Notably, even at a lower concentration of 6.75 ppm, compounds 1 demonstrated an inhibition rate of 80.6% against Foc TR4, similar to that of hygromycin B (80.0%) and surpassing nystatin (76.5%) at 50 ppm (Figure 7A(ii),B(ii)). Given the potence of compound 1 against Foc TR4, we depicted the relationship between the dosage of 1 and the corresponding reduction in mycelial growth (Figure 7C). This graph demonstrated an inverse proportionality between the inhibition rate and 1. As shown in this figure, the inhibition of mycelial growth decreases at a lower concentration of compound 1. Based on these data, the EC50 (concentration of the compound to inhibit 50% of the mycelial growth) was calculated and presented in Figure 7D. It is noteworthy that pathogen inhibition almost reached 100% at doses of 64 ppm. According to the scale proposed by Edgington et al. in 1971 [24], the efficacy of a compound in reducing a variable associated with the studied pathogen is delineated by the estimated value of its EC50. Specifically, when EC50 < 1 μg/mL, the compound is classified as having high efficiency (HE). In our investigation, 1 exhibited high efficiency in reducing the mycelial growth of Foc TR4, with EC50 values of 0.28 μg/mL, while the EC50 values for nystatin and hygromycin B are 32 μg/mL and 16 μg/mL (Figure S12).
Subsequently, the disease symptom on rhizomes of banana tissue plantlets were recorded at 30 days after inoculation with 1 and spores of the strain SCSIO 40440. The results showed that 1 and spores of M. sp. SCSIO 40440 appeared to be safe to the banana plantlets, since they did not induce obvious vascular discoloration in the corm of the banana plantlets (Figure 8A(iv,v)). In contrast, the pathogen fungus Foc TR4 typically causes pronounced vascular discoloration (Figure 8A(i)). When a co-inoculation with 1 or spores of SCSIO 40440 is administered, the virulence of Foc TR4 on Cavendish bananas was significantly reduced compared to treatments with Foc TR4 alone (Figure 8A(ii,iii)). The disease indexes were 0.14 for the inoculation with compound 1 and 0.37 for the inoculation with spores of SCSIO 40440, respectively, both of which were notably lower than those for the control group (0.65) (Figure 8B).

3. Materials and Methods

3.1. General Experimental Procedures

Optical rotations were measured with an MCP 500 polarimeter (Anton, Graz, Austria). UV spectra were recorded on a UV-2600 spectrophotometer (Shimadzu, Kyoto, Japan). IR spectra were measured on an IR Affinity-1 FT-IR spectrometer (Shimadzu, Kyoto, Japan). 1H, 13C, and 2D NMR spectra were recorded on a Bruker AVANCE III HD 500 MHz or 700 MHz NMR spectrometer (Bruker Company, Karlsruhe, Germany) with tetramethylsilane (TMS) as an internal standard. Deuterated NMR solvents were purchased from Cambridge Isotopes. High-Resolution Electrospray Ionization Mass Spectrometry (HRESIMS) data were measured on a Bruker Maxis 4G UHR-TOFMS spectrometer (Bruker Company, Karlsruhe, Germany). Materials for column chromatography (CC) were silica gel (100–200 mesh; Jiangyou Silica Gel Development, Inc, Qingdao, China), Sephadex LH-20 (40–70 μm; Amersham Pharmacia Biotech AB, Uppsala, Sweden), and YMC*GEL ODS-A-HG (12 nm S-50 μm; YMC Company Ltd. Kyoto, Japan). Thin-layer chromatography (TLC, 0.1–0.2 or 0.3–0.4 mm) was conducted with precoated glass plates (silica gel GF254, 10–40 nm, Jiangyou Silica Gel Development, Inc., Qingdao, China). Medium-pressure liquid chromatography (MPLC) was performed with automatic flash chromatography (Cheetahtmmp 200, Bonna-Agela Technologies Co., Ltd., Tianjin, China) with a monitoring wavelength of 254 nm and a collecting wavelength of 304 nm. Semipreparative HPLC was performed on a Hitachi-L2130 HPLC workstation with Hitachi L-2455 detector using a reversed-phase column (Luna C18, 250 mm × 10.0 mm, 5 μm; Phenomenex, CA, USA); flow rate 2.5 mL/min. General HPLC analysis was carried out on a reversed-phase column (Luna C18, 150 mm × 4.6 mm, 5 μm; Phenomenex, CA, USA) or a polar column (Polar BiPFP 250 × 4.6 mm; 5 μm, Comixsep®, P/N FMG-BPF5-EONU) with UV detection at 304 nm on a Agilent series 1200 workstation under the following program: solvent A, 10% CH3CN in H2O supplementing with 0.1% formic acid; solvent B, 90% CH3CN in H2O; 5% B to 80% B (0–20 min), 80% B to 100% B (20–21 min), 100% B (21–24 min), 100% B to 5% B (24–25 min), 5% B (25–30 min); flow rate 1 mL/min.

3.2. Fungal Material

The strain SCSIO 40440 was isolated from a fresh leaf of the mangrove plant Pluchea indica (L.) Less. (E 109.7595°, N 21.5676°) in Zhanjiang Mangrove National Nature Reserve (E 109.7595°, N 21.5676° Zhanjiang, China; With permission). It was incubated on a PDA medium plate (Potato dextrose broth 24.0 g/L, artificial sea salt 15.0 g/L, agar 20.0 g/L, pH 7.0–7.4) at 28 °C for 7 days and then was preserved in the type culture collection of the Center for Marine Microbiology of the South China Sea Institute of Oceanology, Chinese Academy of Sciences. The strain was identified as a species of Medicopsis sp. by the ITS gene sequence analysis (GenBank accession number MH865072.1) [13].

3.3. Fermentation, Extraction and Isolation

The strain SCSIO 40440 was cultivated on a PDA medium (Potato dextrose broth 24.0 g/L, artificial sea salt 15.0 g/L, agar 20.0 g/L, pH 7.0–7.4) plate at 28 °C for 7 days and then inoculated into 50 mL of PDB medium (Potato dextrose broth 24.0 g/L, artificial sea salt 15.0 g/L, pH 7.0) for incubation at 28 °C and 200 rpm for 3 days in a 250 mL Erlenmeyer flask. After growing to the logarithmic growth phase, a 20 mL portion of the seed cultures was transferred to 250 mL fermenters containing 100 mL of oat medium (oats 500.0 g/L, artificial sea salt 15.0 g/L, pH 7.0). The fermentation (a total of 20 kg) was incubated statically at 28 °C for 35 days. The mycelia were extracted 5 times with 20 L of acetone, and the acetone fractions were concentrated under vacuum to afford the aqueous residues, which were combined with the supernatants and further extracted 3 times with 5 L of butanone. The butanone extracts were concentrated under vacuum to afford the crude extracts (100 g). The extracts were subjected to a normal phase silica gel (200–300 mesh) column and eluted with CHCl3/MeOH (90/10, 80/20, 70/30, 50/50, 0/100, v/v) to obtain four fractions (Fr.1 to Fr.4). Fr.3 was separated by MPLC using a reversed-phase C-18 column to obtain 1 (298.6 mg). Fr.4 was subjected to a normal phase silica gel (200–300 mesh) column and eluted with petroleum ether/ethyl acetate (100/0, 90/10, 80/20, 50/50, 0/100, v/v) to obtain four fractions (Fr.4-A to Fr.4-G). Subfraction Fr.4-D was purified on a Sephadex LH-20 column, eluted with CHCl3/MeOH (1/1, v/v) to yield six fractions (Fr.4-D-L1 to Fr.4-D-L6). Then, Fr.4-D-L4 was purified by semipreparative HPLC (H2O/CH3CN, 45/55, v/v) to obtain 2 (15.4 mg), 4 (17.2 mg), 6 (41.0 mg), and 10 (7.2 mg). Subfraction Fr.4-C was purified on a Sephadex LH-20 column, eluted with CHCl3/MeOH (1/1, v/v) to yield six fractions (Fr.4-C-L1 to Fr.4-C-L6). Then, Fr.4-C-L4 was purified by semipreparative HPLC (H2O/CH3CN, 45/55, v/v) to obtain 3 (5.2 mg). Subfraction Fr.4-F was purified on a Sephadex LH-20 column, eluted with CHCl3/MeOH (1/1, v/v) to yield five fractions (Fr.4-F-L1 to Fr.4-F-L5). Then, Fr.4-F-L3 was purified by semipreparative HPLC (H2O/CH3CN, 45/55, v/v) to obtain 8 (6.1 mg). Subfraction Fr.4-G was purified on a Sephadex LH-20 column, eluted with CHCl3/MeOH (1/1, v/v) to yield six fractions (Fr.4-G-L1 to Fr.4-G-L6). Then, Fr.4-G-L5 was purified by semipreparative HPLC (H2O/CH3CN, 45/55, v/v) to obtain 5 (6.1 mg), 7 (12.1 mg), and 9 (5.8 mg).
MK8383 (1): colorless solid; [α ] D 25 +82.8 (c 0.1, MeOH); UV (MeOH) λmax (log ε) 263 (4.28) nm; IR (film) νmax 3368, 2922, 1684, 1636, 1267, 1005 cm−1; 1H and 13C NMR data, see Table 1; HRESIMS m/z 331.2281 [M + H]+; 348.2545 [M + NH4]+ (calcd for C21H31O3, 331.2268; C21H34NO3, 348.3533).
MK8383 B (2): colorless solid; [α ] D 25 +98.3 (c 0.1, MeOH); UV (MeOH) λmax (log ε) 262 (4.27) nm; IR (film) νmax 3358, 2920, 2359, 1684, 1636, 1024 cm−1; 1H and 13C NMR data, see Table 1; HRESIMS m/z 347.2220 [M + H]+; 364.2474 [M + NH4]+ (calcd for C21H31O4, 347.2217; C21H34NO4, 364.2482).
10-epi-MK8383 B (3): colorless solid; [α ] D 25 +67.2 (c 0.1, MeOH); UV (MeOH) λmax (log ε) 263 (4.56) nm; IR (film) νmax 3391, 2928, 2359, 1684, 1636, 1003 cm−1; 1H and 13C NMR data, see Table 1; HRESIMS m/z 347.2218 [M + H]+, 364.2491 [M + NH4]+ (calcd for C21H31O4, 347.2217; C21H34NO4, 364.2482).
MK8383 C (4): colorless solid; [α ] D 25 +57.3 (c 0.1, MeOH); UV (MeOH) λmax (log ε) 262 (4.30) nm; IR (film) νmax 3356, 2920, 2359, 1636, 1013, 689 cm−1; 1H and 13C NMR data, see Table 1; HRESIMS m/z 347.2221 [M + H]+, 364.2484 [M + NH4]+ (calcd for C21H31O4, 347.2217; C21H34NO4, 364.2482).
9-epi-MK8383 C (5): colorless solid; [α ] D 25 -27.3 (c 0.1, MeOH); UV (MeOH) λmax (log ε) 262 (4.30) nm; IR (film) νmax 3360, 2359, 1653, 1015, 659 cm−1; 1H and 13C NMR data, see Table 1; HRESIMS m/z 345.2073 [M − H]- (calcd for C21H29O4, 345.2071).
MK8383 D (6): colorless solid; [α ] D 25 +29.4 (c 0.1, MeOH); UV (MeOH) λmax (log ε) 262 (4.32) nm; IR (film) νmax 3358, 2945, 2359, 1668, 1456, 1020 cm−1; 1H and 13C NMR data, see Table 1; HRESIMS m/z 364.2481 [M + NH4]+ (calcd for C21H34NO4, 364.2482).
MK8383 E (7): colorless solid; [α ] D 25 +7.2 (c 0.1, MeOH); UV (MeOH) λmax (log ε) 263 (4.56) nm; IR (film) νmax 3359, 2938, 2359, 1658, 1471, 1020 cm−1; 1H and 13C NMR data, see Table 1; HRESIMS m/z 345.2074 [M − H]- (calcd for C21H29O4, 345.2071).
MK8383 F (8): colorless solid; [α ] D 25 +29.4 (c 0.1, MeOH); UV (MeOH) λmax (log ε) 259 (4.16) nm; IR (film) νmax 3379, 29223, 2361, 1684, 1009, 669 cm−1; 1H and 13C NMR data, see Table 1; HRESIMS m/z 347.2225 [M + H]+, 364.2488 [M + NH4]+ (calcd for C21H31O4, 347.2217; C21H34NO4, 364.2482).
MK8383 G (9): colorless solid; [α ] D 25 +17.3 (c 0.1, MeOH); UV (MeOH) λmax (log ε) 259 (4.29) nm; IR (film) νmax 3335, 2943, 2362, 1684, 1020, 667 cm−1; 1H and 13C NMR data, see Table 1; HRESIMS m/z 347.2222 [M + H]+, 347.2222 [M + NH4]+ (calcd for C21H31O4, 347.2217; C21H34NO4, 364.2482).
MK8383 H (10): colorless solid; [α ] D 25 +15.3 (c 0.1, MeOH); UV (MeOH) λmax (log ε) 263 (4.04) nm; IR (film) νmax 3362, 2920, 2359, 1636, 1015, 669 cm−1; 1H and 13C NMR data, see Table 1; HRESIMS m/z 347.2225 [M + H]+, 364.2486 [M + NH4]+ (calcd for C21H31O4, 347.2217; C21H34NO4, 364.2482).

3.4. X-Ray Crystallographic Analysis

Single crystals of 2 and 10 were obtained in methanol or methanol–H2O (v/v 10:1). The suitable crystals were selected, and the crystal data were collected on an XtaLAB AFC12 (RINC): Kappa single diffractometer with Cu Kα radiation (λ = 1.54184 Å). The crystal was kept at 100.0(3) K during the data collection. Using Olex2 [25], the crystal structure was solved with the SHELXT 2018/2 [26] structure solution program with Intrinsic Phasing and refined with the SHELXL refinement package using Least Squares minimization. Crystallographic data have been deposited in the Cambridge Crystallographic Data Center with the deposition number CCDC 2400777 for 2 and 2400778 for 10.
Crystal Data for 2 C84H118O16 (M =1383.78 g/mol): monoclinic, space group P21 (no. 4), a = 9.1600(5) Å, b = 25.1362(14) Å, c = 10.6058(10) Å, β = 106.507(9)°, V = 2341.3(3) Å3, Z = 4, T = 100.0(3) K, μ(Cu Kα) = 0.534 mm−1, Dcalc = 0.981 g/cm3, 31740 reflections measured (7.034° ≤ 2Θ ≤ 149.82°), 9035 unique (Rint = 0.0913, Rsigma = 0.0818), which were used in all calculations. The final R1 was 0.0918 (I > 2σ(I)) and wR2 was 0.2769 (all data).
Crystal Data for 10 C21H30O4 (M =346.45 g/mol): tetragonal, space group P41212 (no. 92), a = 9.1899(2) Å, c = 53.8671(13) Å, V = 4549.3(2) Å3, Z = 8, T = 99.98(12) K, μ(Cu Kα) = 0.549 mm−1, Dcalc = 1.012 g/cm3, 21859 reflections measured (6.564° ≤ 2Θ ≤ 148.182°), 4561 unique (Rint = 0.0410, Rsigma = 0.0329), which were used in all calculations. The final R1 was 0.0708 (I > 2σ(I)) and wR2 was 0.2300 (all data).

3.5. DFT Calculations

The conformational analysis of 2 and 10 were performed in Sybyl 8.1 software using the MMFF94s force field, which afforded the conformers for 2 and 10 with an energy cutoff of 3.0 kcal/mol to the global minima. All of the obtained conformers were optimized using the B3LYP/6-31+G(d) level in a gas phase by using Gaussian09 software [27]. The Boltzmann populations of 2 and 10 were determined by DFT calculation at the B3LYP/6-31+G(d,p) level.

3.6. Antifungal Activity of Extracts of Medicopsis sp. SCSIO 40440

The antifungal activity against twenty phytopathogenic fungi, including Altemaria solani, Alternaria tenuissima, Bipolaris sorokiniana, Botrytis cinerea Pers, Ceratobasidium cornigerum, Colletotrichum fructicola, Colletotrichum gloeosporioides, Dothiorella gregaria, Fusarium culmorum, Fusarium graminearum, Fusarium oxysporum, Fusarium oxysporum f. sp. cucumerinu, Fusarium oxysporum f. sp. momordicae, Fusarium oxysporum f. sp. vasinfectum, Fusarium solani f. sp. pisi, Haematonectria, Peronophythora litchii, Phoma herbarum, Physalospora piricola Nose, and Valsa mali (Strains obtained from CAMS Collection Center of Pathogenic Microorganisms), was evaluated by the modified Kirby–Bauer disc diffusion method [28]. Pathogenic fungi were cultured on potato dextrose agar (PDA) plates. From the actively growing edge of each colony, 6 mm agar discs were punched out and placed in the center of a new PDA plate. The plates were incubated upside down at 28 °C for 1–2 days. A standard paper disk (6 mm) was placed at the edge of PDA agar plates, ~1 cm away from the fungal colony. Each paper disk was impregnated with 10 μL of freshly prepared extracts of Medicopsis sp. SCSIO 40440 at a concentration of 20 μg/μL. Dimethylsulfoxide (DMSO) was used as the negative control, while nystatin (10 μg/mL) was used as the positive control. The plates were incubated at 25 °C for 2–3 days. The inhibition zones were measured to evaluate the antifungal activity. The experiments were performed in triplicate. For each phytopathogenic fungi, antifungal activity was recorded and graded as 0–3 based on the zone of inhibition of DMSO and nystatin. Grade 0 indicated no inhibition zone was observed; grade 1 indicated an inhibition zone less than that of nystatin; grade 2 indicated that the inhibition zone approximates to that of nystatin; and grade 3 indicated that the inhibition zone was larger than that of nystatin.

3.7. Antifungal Activity of Isolated Compounds Against Fusarium Species

The in vitro antifungal effects of isolated compounds against Fusarium species were evaluated using either the Kirby–Bauer disc diffusion method [28] or the mycelium growth rate method [29,30]. The mycelium growth rate method is briefly described as follows: 50 mg of the tested compound was dissolved in 5 mL DMSO to prepare an initial solution with a concentration of 10 mg/mL, which was then diluted to 50, 25, 12.5, and 6.75 μg/mL in the PDA medium. DMSO was used as the negative control, while nystatin and hygromycin B (50 μg/mL) were used as a positive control. Activated pathogens were punched with a 6 mm diameter puncher and inoculated in the center of the medicated medium (PDA) in a 28 °C incubator for 3–4 days. Each experiment was run in triplicate. The antifungal activities were expressed by the inhibition rate of mycelium growth (IR) in the following Equation:
IR (%) = (BT)/B × 100
where B and T represent the growth diameters of the colony of the blank control and the colony which was treated with compounds, respectively.

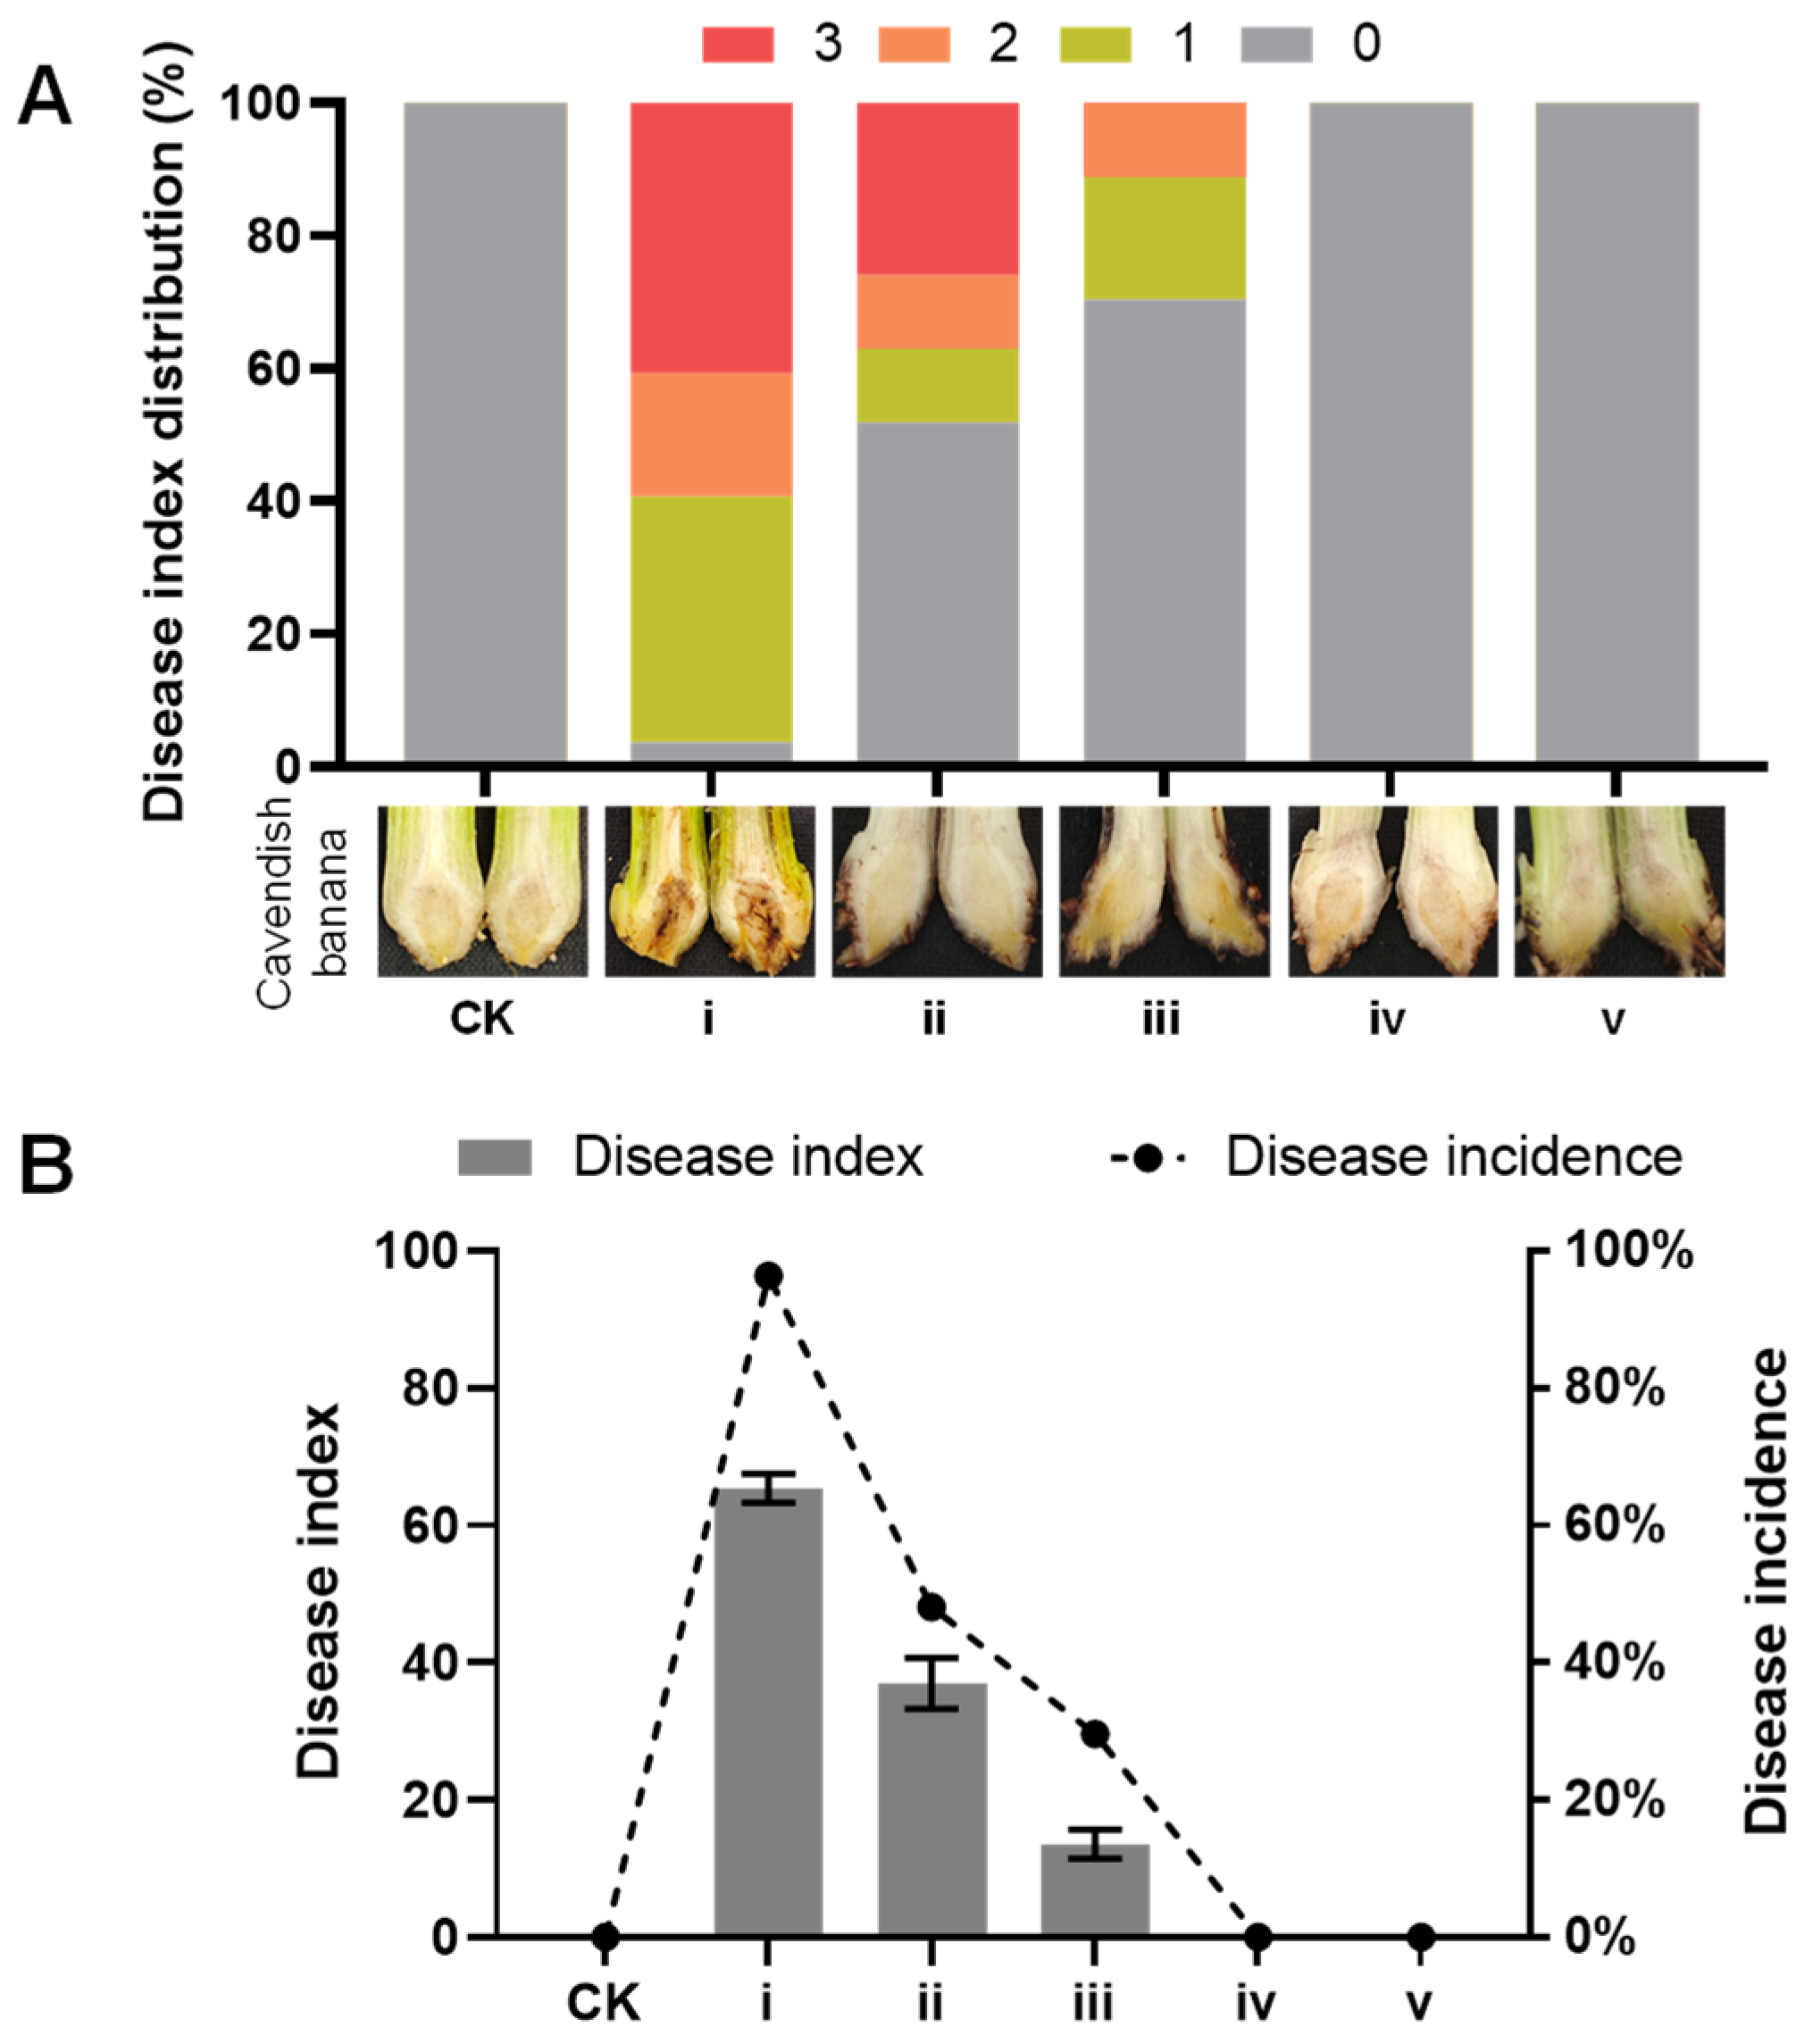
3.8. Virulence Assays

Compound 1 and the strain Medicopsis sp. SCSIO 40440 were both evaluated for the ability to control the disease through pathogenicity tests on roots of tissue culture-derived banana plantlets (Cavendish banana, AAA) at the 4–5 leaf stage. The isolate XJZ2 of F. oxysporum f. sp. cubense tropical race 4 (Foc TR4) was used as the target pathogen [31]. Banana root inoculation assays were performed in a growth chamber, as previously described [32]. Disease symptoms were assessed 30 days after inoculation. For each plantlet, the severity of disease was recorded as grades 1–4 based on the extent of the vascular discoloration in the rhizome. Grade 1 (with value = 0) indicated no vascular discoloration was observed; grade 2 (with value = 1) indicated a little vascular discoloration, expressed as brown dots; grade 3 (with value = 2) indicated that vascular discoloration accounted for up to 50%; and grade 4 (with value = 3) indicated that vascular discoloration was over 50% in the corm of the banana plantlet. Thirty plantlets were inoculated with each fungal strain in an inoculation experiment, and the experiments were performed in triplicate. The disease incidence was calculated as the percentage of symptomatic plantlets (grade 1–3) over the total number of inoculated plantlets. The disease index was calculated using the following formula: the disease index = ∑(the number of plantlets × the grade value) × 100/(the total number of plantlets × the maximum grade value). Statistical analyses were performed using the t test with p ≤ 0.01 indicating a significant difference.

3.9. Statistical Analysis

All data are expressed as mean ±SEM and analyzed with GraphPad Prism 8.0 software. A one-way analysis of variance (ANOVA) followed by a Tukey multiple comparison test was performed to compare the differences among three or more groups. p < 0.05 was considered statistically significant.

4. Conclusions

In summary, ten decalin carboxylic acids (110) were isolated from the mangrove endophytic fungus Medicopsis sp. SCSIO 40440. These compounds encompass five planar structural groups, comprising nine new stereoisomeric compounds (210). Interesting, 2 and 10 are a pair of cis-trans-fused ring epimers. DFT calculations revealed that the cis-fused decalin ring exhibits greater flexibility than the trans-fused decalin counterpart. Compound 1 exhibited exceptional antifungal activity against Foc TR4, surpassing the positive controls nystatin and hygromycin B, as well as the recently reported niphimycin C (EC50 1.20 μg/mL) [33] and R-prothioconazole (EC50 0.78 μg/mL) [34]. These findings show the potential of 1 as a potential lead for biocontrol against FWB.

Supplementary Materials

The following supporting information can be downloaded at: https://www.mdpi.com/article/10.3390/md23020088/s1, Figure S1: Spectral data for MK8383 (1); Figure S2: Spectral data for MK8383 B (2); Figure S3: Spectral data for 10-epi-MK8383 B (3) (1); Figure S4: Spectral data for MK8383 C (4); Figure S5: Spectral data for 9-epi-MK8383 C (5); Figure S6: Spectral data for MK8383 D (6); Figure S7: Spectral data for MK8383 E (7); Figure S8: Spectral data for MK8383 F (8); Figure S9: Spectral data for MK8383 G (9); Figure S10: Spectral data for MK8383 I (10); Figure S11: Antifungal activities of compounds 1, 2, 4, 6, and 10; Figure S12: EC50 of nystatin and hygromycin B on mycelial growth of Foc TR4; Table S1: Antibacterial Activity grade of the extract of M. sp. SCSIO 40440 against twenty phytopathogenic fungi; Table S2: 1H and 13C NMR data of MK8383 (1) in acetone-d6; Table S3: H-9eq and H-9ax of MK8383B (2) and 10-epi-MK8383 B (3) in acetone-d6; Table S4: X-ray crystallographic data of MK8383 B (2) and I (10); Table S5: H-10eq and H-10ax of MK8383 C (4) and 9-epi-MK8383 C (5) in acetone-d6; Table S6: Disease severity expressed by disease incidence and disease index; check CIF report of 2; check CIF report of 10.

Author Contributions

Conceptualization, C.Z. and W.Z.; funding acquisition, C.Z. and W.Z.; formal analysis, T.Z., Y.Q., H.Z., L.Z., S.L. and M.L.; investigation, T.Z., Y.Q., L.W. and Z.L.; methodology, Y.Q. and M.L.; supervision, C.Z.; writing—original draft, T.Z., Y.Q. and W.Z.; writing—review and editing, C.Z., M.L. and W.Z. All authors have read and agreed to the published version of the manuscript.

Funding

This research was funded by the National Natural Science Foundation of China (42176127, 81973372, 82274120), the Natural Science Foundation of Guangdong Province of China (2024A1515011056), and the Guangdong Basic and Applied Basic Research Foundation (2021A1515110284, 2021A1515010839, 2022A1515110883).

Institutional Review Board Statement

Not applicable.

Data Availability Statement

The authors declare that all relevant data supporting the findings of this study are available within the article and its Supplementary Materials files or from the corresponding authors upon request.

Acknowledgments

We appreciate Xuan Ma for X-ray diffraction analyses, and Zhihui Xiao, Aijun Sun, Yun Zhang, and Xiaohong Zheng for recording MS and NMR data.

Conflicts of Interest

The authors declare no conflicts of interest.

References

  1. Ploetz, R.C. Fusarium wilt of banana. Phytopathology 2015, 105, 1512–1521. [Google Scholar] [CrossRef]
  2. Dean, R.; Van Kan, A.; Pretorius, Z.; Hammond, K.; Dipietro, A.; Spanu, P.; Rudd, J.; Dickman, M.; Kahmann, R.; Ellis, J.; et al. The Top 10 fungal pathogens in molecular plant pathology. Mol. Plant Pathol. 2012, 13, 414–430. [Google Scholar] [CrossRef] [PubMed]
  3. Dita, M.; Barquero, M.; Heck, D.; Mizubuti, E.S.; Staver, C.P. Fusarium wilt of banana: Current knowledge on epidemiology and research needs toward sustainable disease management. Front. Plant. Sci. 2018, 9, 1468. [Google Scholar] [CrossRef]
  4. Usman, S.; Ge, X.; Xu, Y.; Qin, Q.; Xie, J.; Wang, B.; Jin, C.; Fang, W. Loss of phosphomannose isomerase impairs growth, perturbs cell wall integrity, and reduces virulence of Fusarium oxysporum f. sp. cubense on banana plants. J. Fungi 2023, 9, 478. [Google Scholar] [CrossRef] [PubMed]
  5. Zhang, Y.; Liu, S.W.; Mostert, D.; Yu, H.L.; Zhuo, M.X.; Li, G.T.; Zuo, C.W.; Haridas, S.; Webster, K.; Li, M.H.; et al. Virulence of banana wilt-causing fungal pathogen Fusarium oxysporum tropical race 4 is mediated by nitric oxide biosynthesis and accessory genes. Nat. Microbiol. 2024, 9, 2232–2243. [Google Scholar] [CrossRef]
  6. Tinzaara, W.; Mutambuka, M.; Oyesigye, E.; Blomme, G.; Dita, M.; Gold, C.S.; Rouard, M.; Karamura, E. Banana wilt diseases: Current status and future research strategies for their management. Int. J. Pest Manag. 2024, 70, 290–309. [Google Scholar] [CrossRef]
  7. Staver, C.; Pemsl, D.E.; Scheerer, L.; Perez Vicente, L.; Dita, M. Ex Ante Assessment of Returns on Research Investments to Address the Impact of Fusarium Wilt Tropical Race 4 on Global Banana Production. Front. Plant Sci. 2020, 11, 844. [Google Scholar] [CrossRef]
  8. Li, K.; Chen, S.; Pang, X.; Cai, J.; Zhang, X.; Liu, Y.; Zhu, Y.; Zhou, X. Natural products from mangrove sediments-derived microbes: Structural diversity, bioactivities, biosynthesis, and total synthesis. Eur. J. Med. Chem. 2022, 230, 114117. [Google Scholar] [CrossRef] [PubMed]
  9. Zhao, M.; Zhang, W.; Yang, C.; Zhang, L.; Huang, H.; Zhu, Y.; Ratnasekera, D.; Zhang, C. Discovery of kebanmycins with antibacterial and cytotoxic activities from the mangrove-derived Streptomyces sp. SCSIO 40068. J. Nat. Prod. 2024, 87, 1591–1600. [Google Scholar] [CrossRef] [PubMed]
  10. Chen, S.; Cai, R.; Liu, Z.; Cui, H.; She, Z. Secondary metabolites from mangrove-associated fungi: Source, chemistry and bioactivities. Nat. Prod. Rep. 2022, 39, 560–595. [Google Scholar] [CrossRef] [PubMed]
  11. Yan, Z.; Wen, S.; Ding, M.; Guo, H.; Huang, C.; Zhu, X.; Huang, J.; She, Z.; Long, Y. The purification, characterization, and biological activity of new polyketides from mangrove-derived endophytic fungus Epicoccum nigrum SCNU-F0002. Mar. Drugs 2019, 17, 414. [Google Scholar] [CrossRef] [PubMed]
  12. Tang, X.-X.; Yan, X.; Fu, W.-H.; Yi, L.-Q.; Tang, B.-W.; Yu, L.-B.; Fang, M.-J.; Wu, Z.; Qiu, Y.-K. New β-Lactone with tea pathogenic fungus inhibitory effect from marine-derived fungus MCCC3A00957. J. Agric. Food Chem. 2019, 67, 2877–2885. [Google Scholar] [CrossRef]
  13. Wang, L.; Ye, W.X.; Zhao, M.R.; Zhang, Q.B.; Zhang, L.P.; Zhang, C.S.; Zhang, W.J. Diversity of culturable endophytic fungi from Zhanjiang mangroves and secondary metabolites of the isolate Stemphyliums sp. SCSIO 40436. Microbiol. China 2022, 49, 2995–3007. [Google Scholar]
  14. Wakui, F.; Harimaya, K.; Iwata, M.; Sashita, R.; Chiba, N.; Mikawa, T. Dicyclic carboxylic acid MK8383, its manufacture with Phoma spp., and the use as agrochemical microbicides. Jpn. Kokai Tokkyo Koho JP 1995, 7. [Google Scholar]
  15. Namikoshi, M.; Kobayashi, H.; Yoshimoto, T.; Hosoya, T. Phomopsidin, a new inhibitor of microtubule assembly produced by Phomopsis sp. isolated from coral reef in Pohnpei. J. Antibiot. 1997, 50, 890–892. [Google Scholar] [CrossRef]
  16. Kobayashi, H.; Meguro, S.; Yoshimoto, T.; Namikoshi, M. Absolute structure, biosynthesis, and anti-microtubule activity of phomopsidin, isolated from a marine-derived fungus Phomopsis sp. Tetrahedron 2003, 59, 455–459. [Google Scholar] [CrossRef]
  17. Tabekoueng, G.; Li, H.; Goldfuss, B.; Schnakenburg, G.; Dickschat, J.S. Skeletal rearrangements in the enzyme-catalysed biosynthesis of coral-type diterpenes from Chitinophaga pinensis. Angew. Chem. Int. Ed. Engl. 2024, 63, e202413860. [Google Scholar] [CrossRef] [PubMed]
  18. Li, J.; Chen, B.; Fu, Z.; Mao, J.; Liu, L.; Chen, X.; Zheng, M.; Wang, C.-Y.; Wang, C.; Guo, Y.-W.; et al. Discovery of a terpene synthase synthesizing a nearly non-flexible eunicellane reveals the basis of flexibility. Nat. Commun. 2024, 15, 5940. [Google Scholar] [CrossRef] [PubMed]
  19. Chakrabarti, A.; Rep, M.; Wang, B.; Ashton, A.; Dodds, P.; Ellis, J. Variation in potential effector genes distinguishing Australian and non-Australian isolates of the cotton wilt pathogen Fusarium oxysporum f.sp. vasinfectum. Plant Pathol. 2011, 60, 232–243. [Google Scholar] [CrossRef]
  20. Smith, S.N.; Snyder, W.C. Persistence of Fusarium oxysporum f. sp. vasinfectum. Phytopathology 1975, 65, 190–196. [Google Scholar] [CrossRef]
  21. Xiao, C.; Yu, X.; He, Y.; Deng, X.; Tang, E. Studies on the biological characteristics of the pathogen of cucurbit wilt. Plant Prot. 2008, 34, 83–86. [Google Scholar]
  22. Lan, C.; Ruan, H.; Yang, X.; Yao, J.; Jiang, J. Development of a loop-mediated isothermal amplification assay for sensitive and specific detection of Fusarium oxysporum f. sp. cucumerinum owen. Phytoparasitica 2018, 46, 283–293. [Google Scholar] [CrossRef]
  23. Jung, Y.S.; Kim, Y.T.; Yoo, S.J.; Kim, H.G. Mycological characteristics of Fusarium solani f. sp. pisi isolated from pea, ginseng and soybean in Korea. Plant Pathol. J. 1999, 15, 44–47. [Google Scholar]
  24. Edgington, L.V.; Khew, K.L.; Barron, G.L. Fungitoxic spectrum of benzimidazole compounds. Phytopathology 1971, 61, 42–44. [Google Scholar] [CrossRef]
  25. Dolomanov, O.V.; Bourhis, L.J.; Gildea, R.J.; Howard, J.A.; Puschmann, H. OLEX2: A complete structure solution, refinement and analysis program. J. Appl. Crystallogr. 2009, 42, 339–341. [Google Scholar] [CrossRef]
  26. Sheldrick, G.M. SHELXT–Integrated space-group and crystal-structure determination. Acta Crystallogr. Sect. A Found. Crystallogr. 2015, 71, 3–8. [Google Scholar] [CrossRef]
  27. Frisch, M.J.; Trucks, G.W.; Schlegel, H.B.; Scuseria, G.E.; Robb, M.A.; Cheeseman, J.R.; Scalmani, G.; Barone, V.; Mennucci, B.; Petersson, G.A.; et al. Gaussian 09, Revision A.02; Mennucci and G. Petersson, Inc.: Wallingford, CT, USA, 2009. [Google Scholar]
  28. Hudzicki, J. Kirby-Bauer disk diffusion susceptibility test protocol. Am. Soc. Microbiol. 2009, 15, 1–23. [Google Scholar]
  29. Tao, P.; Wu, C.; Hao, J.; Gao, Y.; He, X.; Li, J.; Shang, S.; Song, Z.; Song, J. Antifungal application of rosin derivatives from renewable pine resin in crop protection. J. Agric. Food Chem. 2020, 68, 4144–4154. [Google Scholar] [CrossRef]
  30. Kyselka, J.; Bleha, R.; Dragoun, M.; Bialasová, K.; Horáčková, Š.; Schätz, M.; Sluková, M.; Filip, V.; Synytsya, A. Antifungal polyamides of hydroxycinnamic acids from sunflower bee pollen. J. Agric. Food Chem. 2018, 66, 11018–11026. [Google Scholar] [CrossRef] [PubMed]
  31. Li, M.; Shi, J.; Xie, X.; Leng, Y.; Wang, H.; Xi, P.; Zhou, J.; Zhong, S.; Jiang, Z. Identification and application of a unique genetic locus in diagnosis of Fusarium oxysporum f. sp. cubense tropical race 4. Can. J. Plant Pathol. 2013, 35, 482–493. [Google Scholar] [CrossRef]
  32. Li, M.H.; Xie, X.L.; Lin, X.F.; Shi, J.X.; Ding, Z.J.; Ling, J.F.; Xi, P.G.; Zhou, J.N.; Leng, Y.; Zhong, S.; et al. Functional characterization of the gene FoOCH1 encoding a putative α-1,6-mannosyltransferase in Fusarium oxysporum f. sp. cubense. Fungal Genet. Biol. 2014, 65, 1–13. [Google Scholar] [CrossRef]
  33. Chen, Y.; Wei, Y.; Cai, B.; Zhou, D.; Qi, D.; Zhang, M.; Zhao, Y.; Li, K.; Wedge, D.E.; Pan, Z.; et al. Discovery of Niphimycin C from Streptomyces yongxingensis sp. nov. as a Promising Agrochemical Fungicide for Controlling Banana Fusarium Wilt by Destroying the Mitochondrial Structure and Function. J. Agric. Food Chem. 2022, 70, 12784–12795. [Google Scholar] [CrossRef] [PubMed]
  34. Yang, X.; Gong, R.; Chu, Y.; Liu, S.; Xiang, D.; Li, C. Mechanistic Insights into Stereospecific Antifungal Activity of Chiral Fungicide Prothioconazole against Fusarium oxysporum F. sp. cubense. Int. J. Mol. Sci. 2022, 23, 2352. [Google Scholar] [CrossRef] [PubMed]
Figure 1. Structures of compounds 110. Carbon atom color-coding indicates distinct hydroxylation modifications or a tran-decalin ring.
Marinedrugs 23 00088 g001
Figure 2. Key COSY, HMBC, and NOESY correlations of 27, and 1H–1H coupling constants (Hz) of 2 and 4.
Marinedrugs 23 00088 g002
Figure 3. The X-ray crystal structure of 2. The ellipsoids of non-hydrogen atoms of 2 are shown at 50% probability levels.
Marinedrugs 23 00088 g003
Figure 4. (A) Key COSY, HMBC, and NOESY correlations of 8 and 9. (B) MMFF94x energy-minimized 3D structures of 8 (16S*, 17R*) and 9 (16R*, 17R*). (C) The distances between H3-18/H-4 and H3-18/H3-19 (The shown distances are the Boltzmann-weighted averages of all conformers within 5 kcal/mol of the global minimum energy geometry).
Marinedrugs 23 00088 g004
Figure 5. Key COSY, HMBC, and NOESY correlations, 1H–1H coupling constants (Hz) and X-ray crystal structure of 10. The ellipsoids of non-hydrogen atoms of 10 are shown at 50% probability.
Marinedrugs 23 00088 g005
Figure 6. (A) 13C NMR spectra (175 MHz) of compounds 2 and 10 were recorded under identical conditions using the same instrument. (B) The Boltzmann populations of compounds 2 and 10 were determined by DFT calculations at the B3LYP/6-31+G(d,p) level. A pie chart representing the statistical distribution of all conformations was constructed, highlighting those with a population greater than 9%. The colors in the pie chart (left) correspond to the colors assigned to each conformation (right) in the charts.
Marinedrugs 23 00088 g006
Figure 7. Effect of compound 1 at 6.25, 12.5, 25, and 50 ppm (μg/mL) on mycelial growth of FOSC. (A) Colony morphology of FOSC on nystatin and hygromycin B and 1; (B) inhibition rate of 1 on mycelial growth of FOSC; (C) colony morphology of Foc TR4 on nystatin and hygromycin B and 1; (D) EC50 of 1 on mycelial growth of Foc TR4. (i. Fusarium oxysporum f. sp. Vasinfectum (Fov); ii. Fusarium oxysporum f. sp. Cubense (Foc) race 4; iii. Fusarium oxysporum f. sp. vasinfectum (Fov) Atk. Sny & Hans; iv. Fusarium oxysporum f. sp. momdicae (Fom) Sun & Huang; v. Fusarium. oxysporum f. sp. Cucumerinu (Foc) Owen; vi. Fusarium solani f. sp. pisi (Fsp); -: DMSO; +: nystatin, hygromycin B).
Marinedrugs 23 00088 g007
Figure 8. (A) Disease symptom on rhizomes of banana tissue culture plantlets; (B) disease index and disease incidence on rhizomes of banana tissue culture plantlets. CK: water; i: treated with spores of Foc race 4; ii: treated with spores of Foc race 4 and M. sp. SCSIO 40440; iii: treated with spores of Foc race 4 and compound 1; iv: treated with spores of M. sp. SCSIO 40440; v: treated with compound 1. The data recorded at 30 days after inoculation with compound 1 and spores of SCSIO 40440. The inoculation data of 27 plantlets were randomly divided into three groups for statistical analysis and the mean ± S.D. (n = 3).
Marinedrugs 23 00088 g008
Table 1. 1H NMR data of 210.
No.2 a,c3 a,c4 a,c5 b,d6 a,c7 a,c8 a,c9 b,d10 b,d
δH, mult.
(J in Hz)
δH, mult.
(J in Hz)
δH, mult.
(J in Hz)
δH, mult.
(J in Hz)
δH, mult.
(J in Hz)
δH, mult.
(J in Hz)
δH, mult.
(J in Hz)
δH, mult.
(J in Hz)
δH, mult.
(J in Hz)
25.84, d (15.0)5.79, d (15.5)5.81, overlap5.84, d (15.4)5.79, d (15.3)5.84, d (15.5)5.88, d (15.5)5.84, d (15.4)5.82, d (15.3)
37.31, dd
(15.4, 11.4)
7.11, dd
(14.5, 10.8)
7.30, dd
(15.0, 11.2)
7.27, dd
(15.0, 10.5)
7.24, dd
(13.8, 11.5)
7.28, dd
(11.4, 15.5)
7.25, dd
(15.5, 10.2)
7.17, dd
(15.1, 11.1)
7.27, dd
(15.3, 10.6)
46.27, dd
(14.9, 11.3)
6.21, dd
(15.0, 11.5)
6.27, dd
(14.3, 10.7)
6.27, dd
(14.3, 11.0)
6.26, dd
(14.9, 11.4)
6.28, dd
(10.5, 15.0)
6.35, dd
(15.5, 9.8)
6.32, dd
(14.9, 11.1)
6.26, overlap
56.47, dd
(15.0, 10.4)
6.01, br s6.47, dd
(14.9, 10.5)
6.49, br s6.40, br s6.37, m6.37, dd
(15.5, 9.8)
6.46, dd
(15.3, 10.7)
6.26, overlap
62.80, sn2.83, br s2.83, overlap2.97, s2.95, br s2.87, m2.73, m2.55, m
71.32, m1.34, br s1.29, br s1.85, br s1.34, m1.40, br s1.22, m1.15, m1.41, overlap
81.70, s1.85, br s1.42, br s 1.63, overlap1.39, o1.59, br s1.35, m1.21, overlap1.40, overlap
91.06, m1.09 br s;3.11, dt (4.2, 10.5)3.89, br s1.02, m;n1.64, overlap1.52, m;1.17, m
91.82, dt (12.9, 3.9)1.66 br s 1.64, m 1.01, overlap0.93 m1.83, m
103.42, ddd
(12.9, 9.6, 4.2)
3.64, br s1.46, q (10.5)1.79, overlap1.39, m;n1.60, overlap1.48, overlap3.39, ddd
(11.2, 8.3, 4.2)
1.95, dtd
(10.6, 4.0, 1.0)
1.58, overlap1.64, m 1.33, overlap1.16, dd
(12.5, 3.7)
113.36, dd (5.5, 9.6)3.57, br s3.70, dt (10.5, 3.7)4.09, br s3.64, m3.71, m3.61, td
(11.2, 4.5)
3.432.96, dd
(10.8, 8.6)
122.86, s2.42, br s2.72, s2.72, br s2.78, m2.76, br s2.71, s2.60, m1.78, m
135.85, s5.67, br s5.84, br s 5.74, br s5.76, s6.13, br s5.81, br s5.72, br s5.98, m
15nn3.43, br s3.41, br s3.02, mn2.17, s 2.05, s3.24, d (4.3)
175.36, m5.34, br s5.38, brs5.38,5.53, m5.38, q (6.4)2.82, q (6.0)2.79, q (5.4)5.44, dq
(6.3. 1.3)
181.65, d (6.6)1.49, br s1.65, d (7.5)1.62, overlap1.64, overlap 1.63, overlap1.41, d (5.7)1.23, d (6.5)1.48, d (6.2)
191.01, d (6.6)0.94, d (6.59)1.09, d (6.2)1.00, d (5.94)0.97, d (5.7)1.00, d (6.0)0.91, d (6.3)0.81, d (6.4)1.00, d (5.9)
201.59, s1.49, overlap1.61, s1.79, overlap1.64, overlap 3.94, d (13.0)1.82, s1.68, s1.52, s
211.55, s1.53, overlap1.56, s1.59, overlap3.91, br s 3.87, d (13.0)1.19, s1.10, s1.67, m
a Data were recorded on Bruker Avance 700 MHz NMR spectrometer; b on Bruker Avance 500 MHz NMR spectrometer; c in acetone-d6, d in methonal-d4, with TMS as an internal standard; n, signals not observed; the signals were assigned with the aid of COSY, HSQC, and HMBC data.
Table 2. 13C NMR data of 210.
No.2 a,c3 a,c4 a,c5 b,d6 a,c7 a,c8 a,c9 b,d10 b,d
δC, TypeδC, TypeδC, TypeδC, TypeδC, TypeδC, TypeδC, TypeδC, TypeδC, Type
1167.1, C168.4, C167.1, C169.4, C168.2, C167.7, C171.2, C168.6, C168.0, C
2119.8, CH120.8, CH119.8, CH121.8, CH120.3, CH120.3, CH122.6, CH122.4, CH120.0, CH
3145.2, CH144.8, CH145.2, CH146.3, CH146.2, CH144.8, CH145.6, CH144.3, CH146.0, CH
4128.3, CH128.7, CH128.3, CH130.1, CH129.4, CH128.4, CH129.9, CH129.0, CH127.2, CH
5146.7, CH147.7, CH146.9, CH148.0, CH147.8, CH146.8, CH147.3, CH147.0, CH150.5, CH
643.2, CH43.0, CH43.1, CH44.9, CH44.0, CH43.1, CH42.3, CH41.4, CH49.7, CH
747.9, CH44.7, CH45.1, CH43.1, CH48.5, CH47.2, CH49.9, CH48.6, CH35.7, CH
828.1, CH34.0, CH36.9, CH35.1, CH29.8, CH28.5, CH29.9, CH29.2, CH45.7, CH
941.4, CH237.5, CH272.5, CH73.1, CH34.2, CH238.5, CH2 34.2, CH233.1, CH244.4, CH2
1070.4, CH67.3, CH40.2, CH239.4, CH231.5, CH238.9, CH231.1, CH231.3, CH275.1, CH
1176.8, CH72.0, CH69.0, CH67.8, CH72.5, CH70.9, CH73.3, CH71.1, CH78.4, CH
1237.5, CH36.4, CH37.7, CH39.3, CH38.6, CH37.3, CH38.9, CH38.2, CH47.6, CH
13122.7, CH122.8, CH122.7, CH126.3, CH122.4, CH123.2, CH125.0, CH124.2, CH125.1, CH
14133.3, C135.5, C134.1, C135.0, C136.0, C139.3, C134.9, C132.1, C134.4, C
1541.1, CHn41.3, CHn41.9, CHn45.5, CH40.8, CH47.1, CH
16135.6, C135.5, C135.7, C137.0, C139.4, C135.0, CH62.7, C60.9, C134.8, C
17122.5, CH125.8, CH122.6, CH124.4, CH123.3, CH122.7, CH59.4, CH62.0, CH124.3, CH
1812.5, CH313.6, CH312.4, CH314.3, CH13.1, CH312.7, CH314.7, CH315.0, CH313.7, CH3
1918.7, CH320.3, CH314.2, CH316.6, CH319.5, CH318.7, CH319.6, CH319.1, CH323.2, CH3
2021.2, CH322.4, CH321.3, CH323.1, CH322.2, CH364.6, CH222.5, CH322.2, CH321.5, CH3
2121.6, CH322.7, CH321.3, CH323.2, CH368.9, CH222.1, CH322.7, CH321.9, CH322.9, CH3
a Data were recorded on Bruker Avance 175 MHz NMR spectrometer; b on Bruker Avance 125 MHz NMR spectrometer; c in acetone-d6; d in methonal-d4, with TMS as an internal standard. n, signal not observed; the signals were assigned with the aid of COSY, HSQC, and HMBC data.
Disclaimer/Publisher’s Note: The statements, opinions and data contained in all publications are solely those of the individual author(s) and contributor(s) and not of MDPI and/or the editor(s). MDPI and/or the editor(s) disclaim responsibility for any injury to people or property resulting from any ideas, methods, instructions or products referred to in the content.

