You are currently viewing a new version of our website. To view the old version click .
Marine Drugs
  • Article
  • Open Access

15 October 2025

Novel Discorhabdin Derivatives from Antarctic Sponges of the Genus Latrunculia: Expanding the Chemical Diversity of Polar Marine Natural Products

,
,
,
,
,
and
1
Department of Chemistry, University of South Florida, 4202 E. Fowler Avenue, CHE205, Tampa, FL 33620, USA
2
School of Biological Sciences, The University of Western Australia, 35 Stirling Highway, Crawley, WA 6009, Australia
3
Collections & Research, Western Australian Museum, 49 Kew Street, Welshpool, WA 6106, Australia
*
Author to whom correspondence should be addressed.
Mar. Drugs2025, 23(10), 401;https://doi.org/10.3390/md23100401 
(registering DOI)
This article belongs to the Section Structural Studies on Marine Natural Products

Abstract

In this study, three Antarctic sponges of the genus Latrunculia were investigated, leading to the isolation of five unreported pyrroloiminoquinone alkaloids along with the known metabolite (+)-debromodiscorhabdin A (3). Three of the new metabolites were brominated, while the other two were found to have a C-5/C-8 sulfur bridge and a C-2/N-18 bridge. Three of the metabolites were shown to have a phenyl ketone substituent on C-14, not previously reported for discorhabdin derivatives. The cytotoxicity against the A549 cell lines was studied and compounds 14 showed activity of 4.3, 1.8, 1.0, and 23.9 µM, respectively, while no inhibition was found for 5 and 6.

1. Introduction

Sponges of the genus Latrunculia (family: Latrunculiidae; class: Demospongiae) are known for producing cytotoxic pyrroloiminoquinone alkaloids known as discorhabdins, a name derived from the unusual discorhabd spicules that characterize the sponge family [,]. The sponges are commonly found in cold habitats, mainly Antarctica and the North Pacific []. They are known to produce a significant variety of secondary metabolites, but mainly the highly pigmented discorhabdins, many of which have shown strong activity against various cancer cell lines []. Discorhabdins described to date consist of a pentacyclic backbone of 18 carbons and 3 nitrogen atoms with a C-6 spiro-center and a C-11 ketone, or di- and trimers thereof [,]. The backbone displays various substitution including mono- and dibromination and a C-5/C-8 sulfur bridge [].
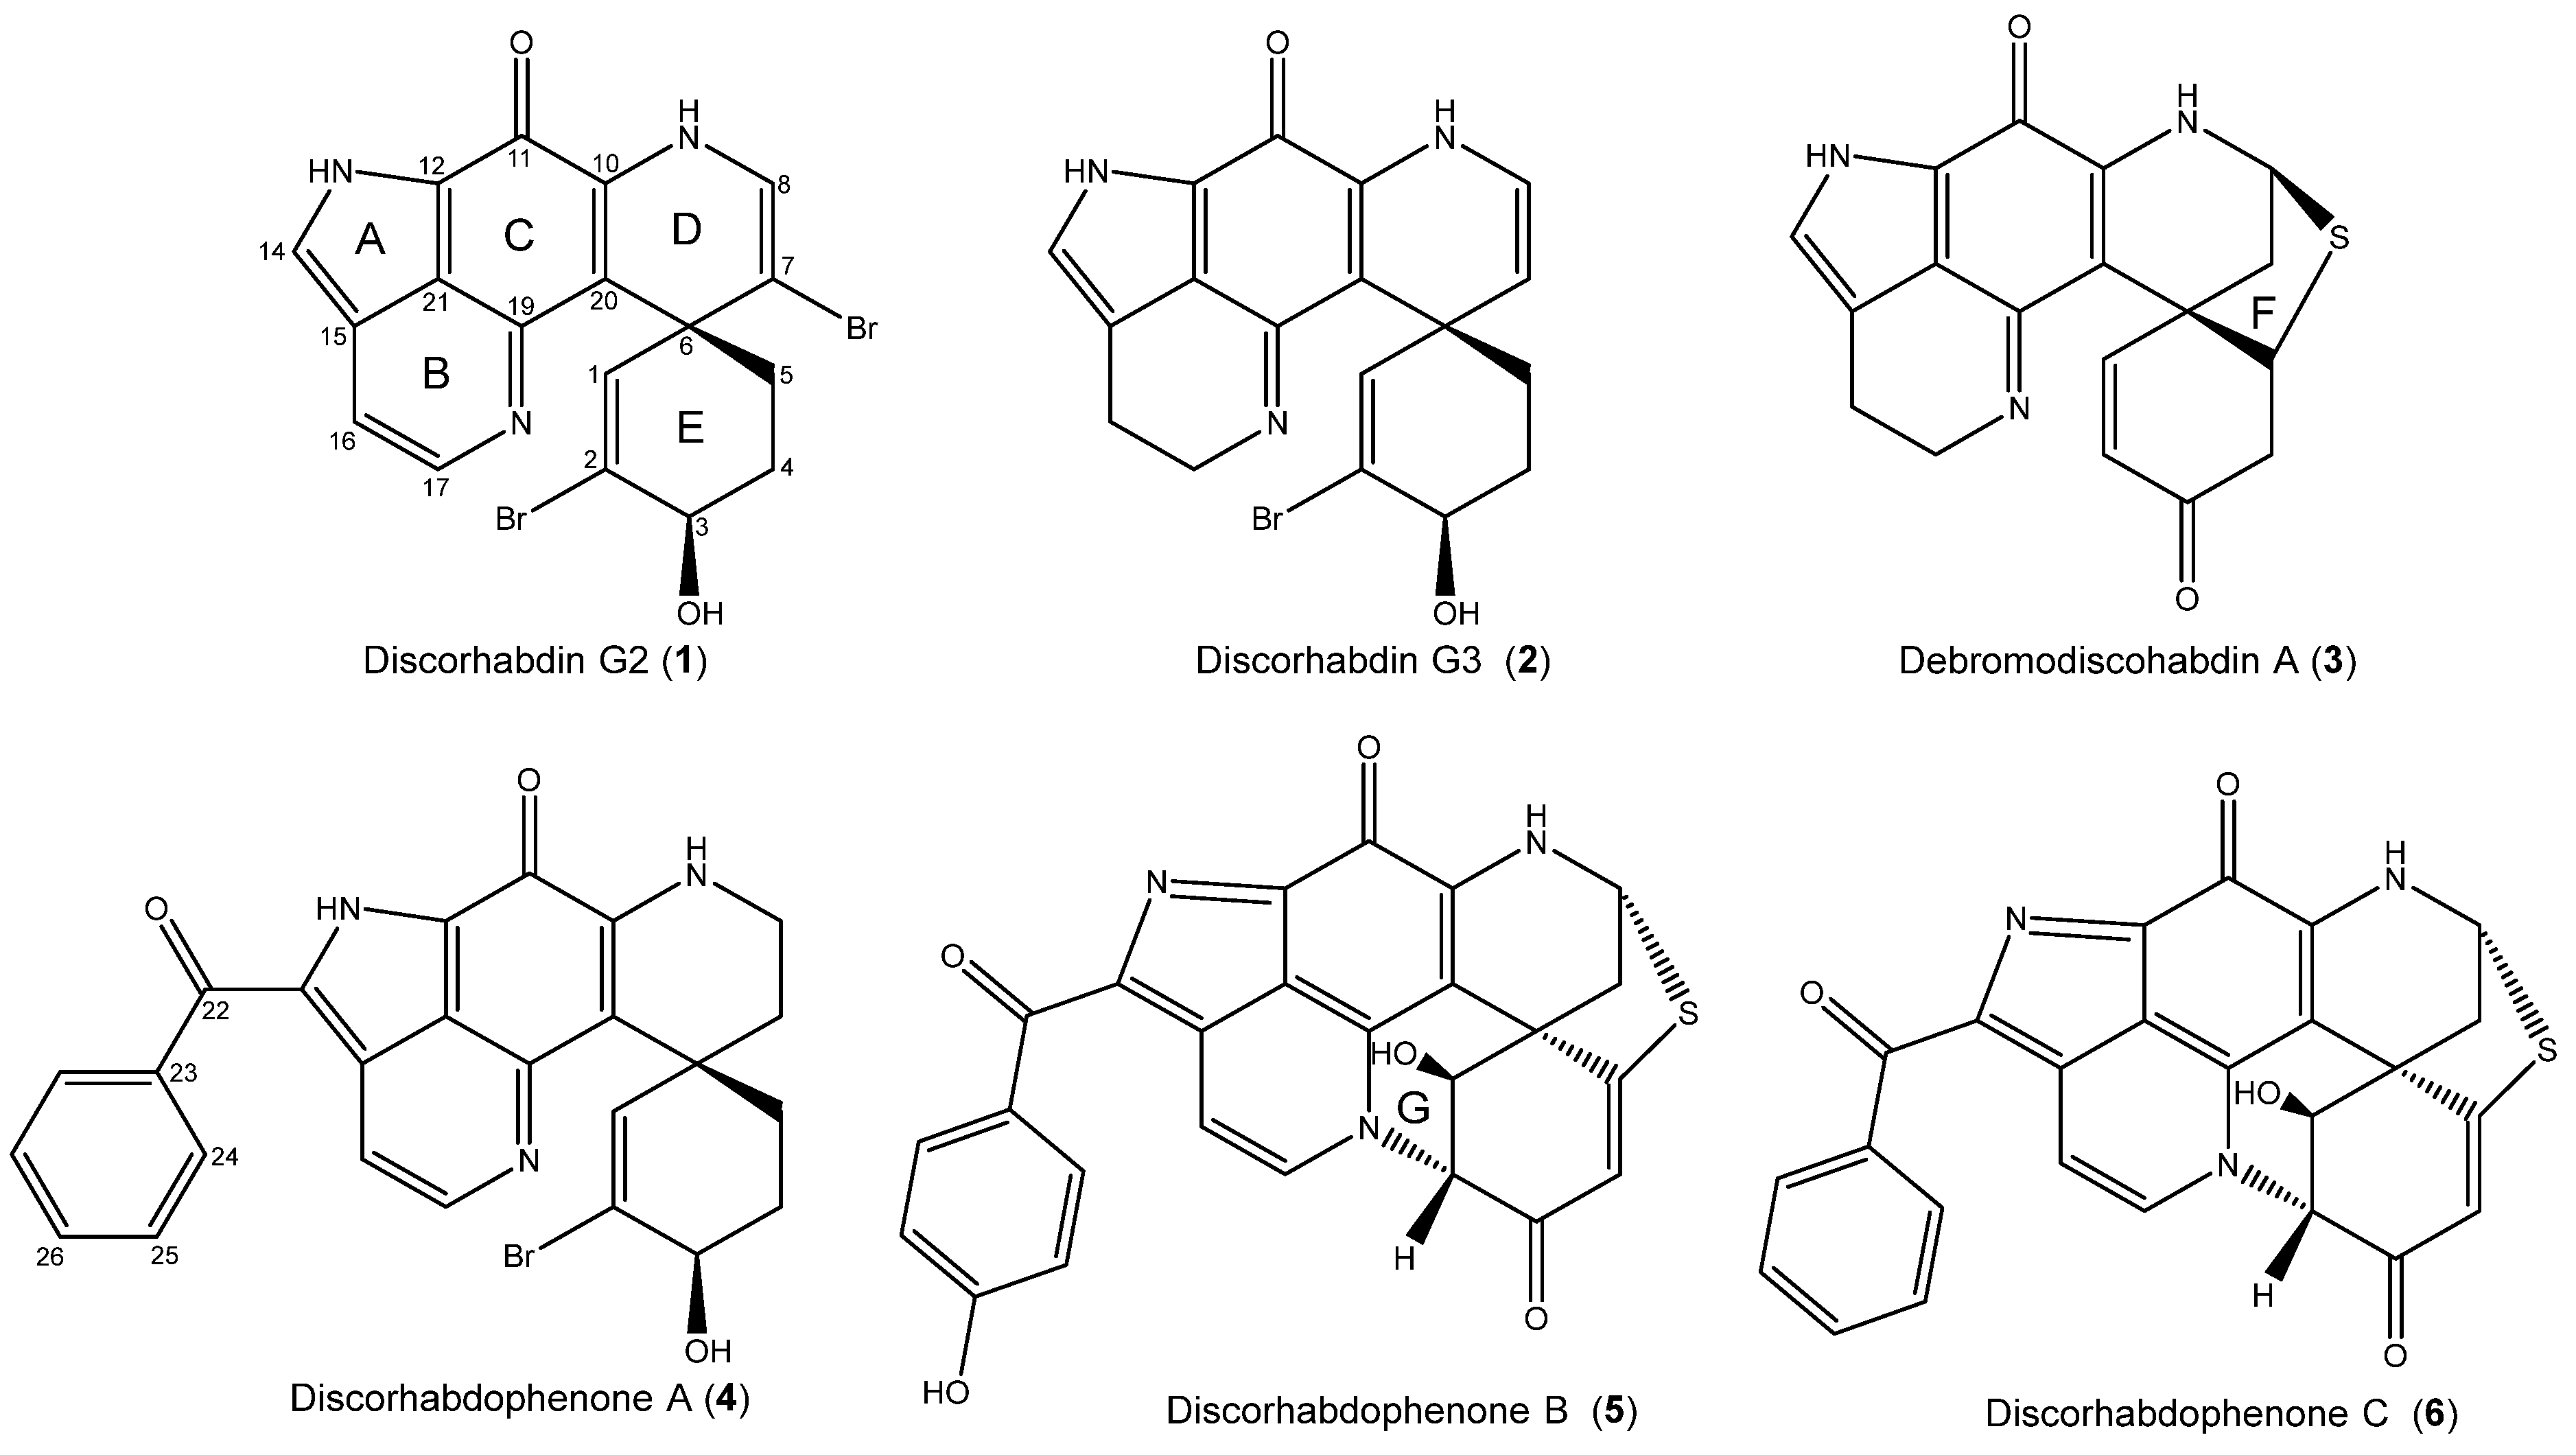
The research discussed herein involves the investigation of three specimens of the genus Latrunculia sp. collected in Antarctica at two different locations. During a circumpolar cruise of Antarctica, led by the Swiss Polar Institute in 2016, two specimens of Latrunculia cf. biformis were obtained by trawl from the Kerguelen Plateau. A third, as yet unidentified, specimen of Latrunculia sp. was collected by SCUBA from the Palmer Archipelago in 2018. The metabolites were prioritized based on an MS-guided fractionation by pursuing fractions with a 1:1 or 1:2:1 isotopic pattern, indicative of mono- and dibrominated metabolites, combined with targeting aromatic 1H NMR signals. Five new metabolites with the discorhabdin backbone, illustrated in Figure 1, were isolated and characterized and one known metabolite, (+)-debromodiscorhabdin A (3), was identified through a comparison of its spectroscopic data to that previously published []. The metabolites were characterized through 1D/2D Nuclear Magnetic Resonance (NMR) Spectroscopy data, high-resolution mass spectrometry (HR-MS), and comparison of experimental and calculated chemical shifts, using DP4+ and Sorted Training Set (STS) comparison tools, and Electronic Circular Dichroism (ECD) spectra.
Figure 1. Alkaloids isolated from Antarctic sponges Latrunculia cf. biformis and Latrunculia sp.

2. Results and Discussion

2.1. Structure Elucidation

Discorhabdin G2 (7-bromo-3-dihydro-16,17-dehydrodiscorhabdin G, 1) was obtained from the 50% MeOH/H2O eluent from the Latrunculia cf. biformis specimen designated ACE16-49 (WAMZ44145). It was isolated as a deep-red solid with the pseudo-molecular ion peak at m/z 463.9450 ([M + H]+, HRESIMS) and a 1:2:1 isotopic pattern, indicative of two bromine atoms in the molecule. The 1H and 13C NMR data (Table 1) corroborated the molecular formula as C18H13Br2N3O2. The 18 carbon and 3 nitrogen atoms indicated that the compound had the backbone of the discorhabdins. The NMR data suggested that 1 had five olefinic protons; ten quaternary carbons, with nine of these being deshielded; one oxymethine; and two methylene groups.
Table 1. NMR data for Discorhabdin G2 and Discorhabdin G3 (1 and 2) (600 (1H) and 150 (13C) MHz, (CD3)2SO)).
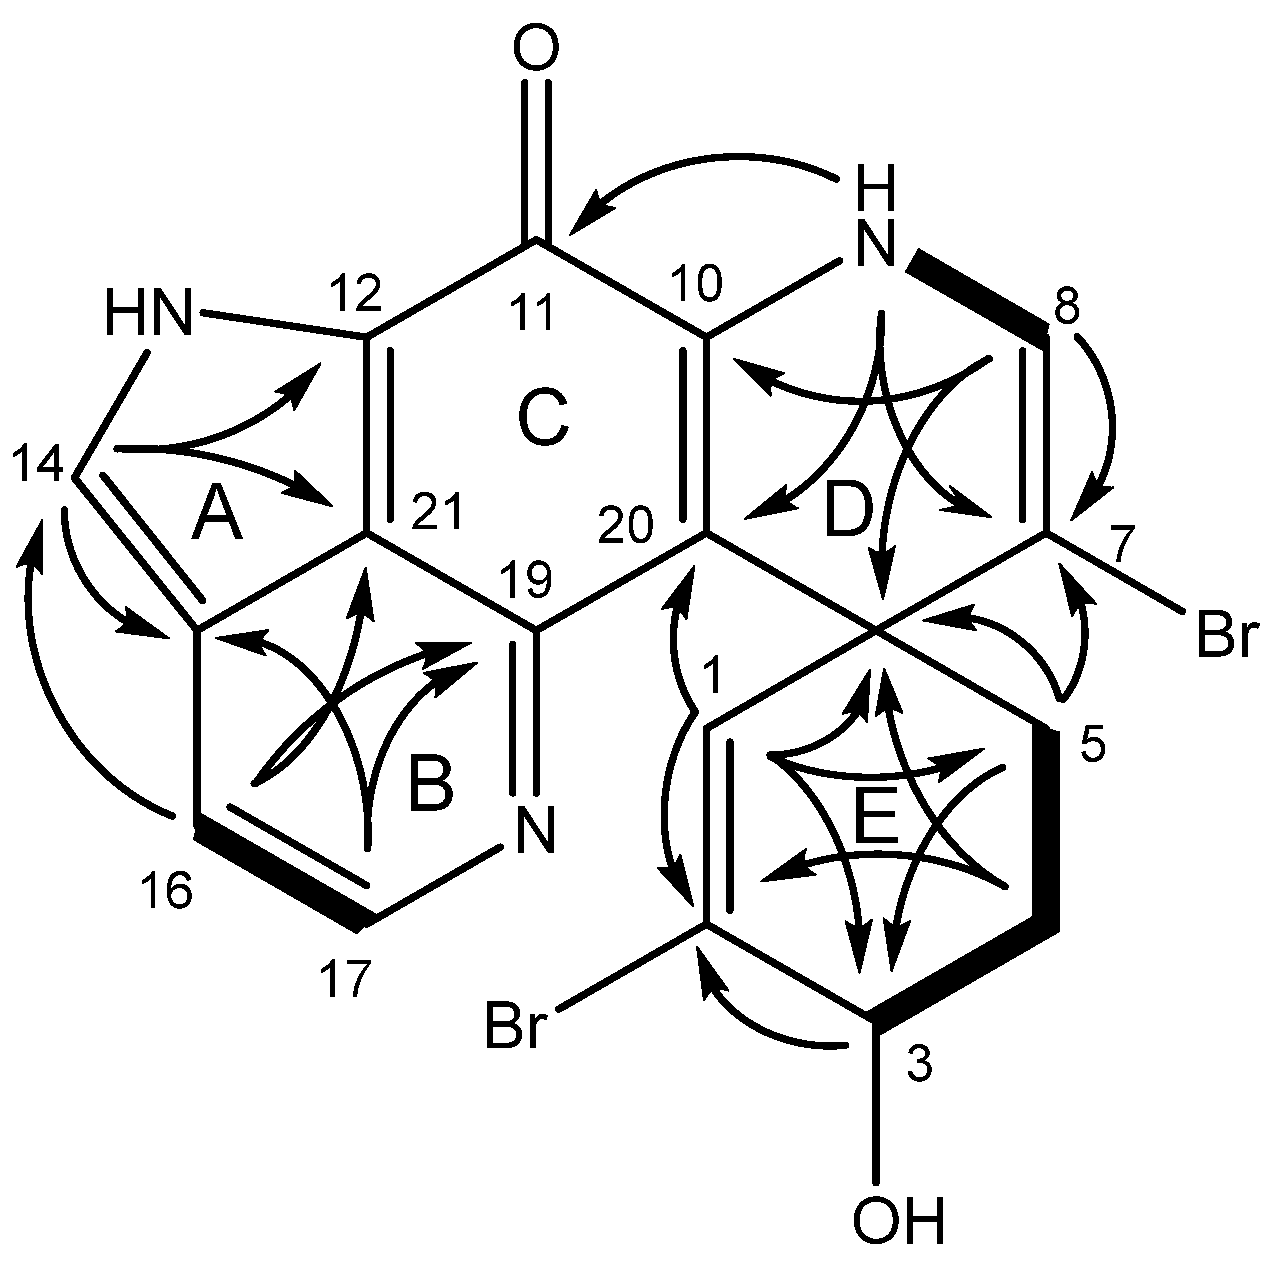
The structure was elucidated starting from homonuclear correlation spectroscopy (COSY) and Heteronuclear Multiple Bond Correlation (HMBC) correlations, as illustrated in Figure 2. Key correlations include COSY correlation between the oxymethine H-3 (δH 4.42) and H2-4 (δH 2.18/2.04) and further to H2-5 (δH 2.70/2.11). HMBC correlations were displayed from H-3 to the olefinic proton C-1 (δC 134.9) and quaternary carbon C-2 (δC 129.2). H-1 (δH 6.15) had HMBC correlations to C-2, C-3 (δC 67.3), C-5 (δC 36.9), C-6 (δC 45.9), C-7 (δC 104.0), and C-20 (δC 111.7). H2-4 and H2-5 showed HMBC correlations to C-3 and C-6, while H2-5 also showed correlations to C-7 and C-20. The high-field quaternary carbon C-6 was indicative of the spiro-center between rings D and E of the discorhabdin backbone, with C-3 often displaying an oxymethine. The H-8 (δH 6.60) olefinic proton had COSY correlation to the H-9 (δH 8.72) exchangeable proton and HMBC correlations to quaternary carbons C-6, C-7, and C-10 (δC 137.9), establishing the Δ7-olefin. Further HMBC correlations between H-9 and C-20 completed the assignment of the D and E rings of a discorhabdin skeleton, and another correlation to C-11 (δC 164.1) extended that ring system to the iminoquinone ketone.
Figure 2. COSY (bold) and HMBC (arrow) correlations of 1.
The olefinic protons H-16 (δH 7.54) and H-17 (δH 8.31) showed COSY correlation to each other, while H-16 showed HMBC correlations to C-14 (δC 128.6), C-17 (δC 141.6), C-19 (δC 147.3), and C-21 (δC 119.5) and H-17 showed HMBC correlations to C-15 (δC 124.6), C-16 (δC 113.7), C-19, and C-21. This suggested that the olefin was on ring B. The remaining olefinic proton (H-14, δH 8.24) had HMBC correlations to quaternary carbons C-11 (δC 164.1), C-12 (δC 118.5), C-15, and C-21. Correlation from H-9 and H-14 on opposite sides of the molecule to C-11, indicated this deshielded quaternary carbon to be the carbonyl displayed in the discorhabdin backbone on ring C. The two bromines indicated by the HRESIMS were placed on the two open valences C-2 and C-7, completing the planar structure of 1.
Discorhabdin G3 (3-dihydrodiscorhabdin G, 2) was obtained from the same extract as 1 and was isolated as a green solid with the molecular formula C18H16BrN3O2, corroborated by the m/z of 386.0505 (HRESIMS, [M + H]+) and its 1H and 13C NMR data. The molecular formula indicated 2 to have three extra protons and one fewer bromine compared to 1, while its 1H NMR spectrum suggested 2 to have two of the olefinic protons replaced by methylene groups. The 2D NMR data (Table S2) suggested the two compounds to display significant similarities, with the only differences being a lack of bromine at C-7 and reduction in the Δ16-olefin. The missing bromine was replaced by a new methine at δH 5.24 (H-7) with COSY correlation to H-8 (δH 6.28). The reduction in the Δ16-olefin was established by COSY correlation between the methylene protons H2-16 (δH 2.87) and H2-17 (δH 3.91) and HMBC correlations to C-14 (δC 126.8), C-15 (δC 119.4), C-17 (δC 44.8), C-21 (δC 122.4), and C-16 (δC 17.9) and C-19 (δC 157.2), respectively.
The 1D and 2D NMR data for 2 had significant similarities to the published data for discorhabdin G, published in 1995 by Yang et al. from Latrunculia apicalis, collected from the vicinity of McMurdo station in Antarctica []. Discorhabdin G was published with a molecular formula of C18H15BrN3O2, suggesting the loss of two protons compared to 2. This matched the suggested structure elucidation with the C-3 ketone for discorhabdin G undergoing a reduction to the C-3 hydroxyl found for 2.
A second specimen of Latrunculia cf. biformis from the 2016 sampling campaign, designated ACE16-51 (WAMZ144147), also produced two pyrroloiminoquinone metabolites, one of which was the known Latrunculia-derived metabolite debromodiscorhabdin A (3) based on comparison of NMR (Table S3) and mass spectral data to published values. Discorhabdophenone A (4) was isolated as a deep-red solid with a formula of C25H20BrN3O3, corroborated by 1H and 13C NMR data (Table 2 and Table S4) and the m/z of 490.0773 (HRESIMS, [M + H]+). The formula indicated that the structure had 7 additional carbons, compared to 13, suggesting a significant difference from the discorhabdin backbone. The primary difference in the 1H NMR spectra was the presence of two 2H aromatic protons at δH 8.37 (d, H2-24) and δH 7.56 (t, H2-25), suggesting that the structure had a phenyl ring. This was confirmed using 2D NMR data that showed COSY correlation between the two, while H-25 had further COSY correlation to a 1H olefinic proton signal at δH 7.63 (H-26). Phenyl rings are unknown from previously described discorhabdin derivatives. Furthermore, H-25 had HMBC correlation to C-23 (δC 138.9) and H-24 had HMBC correlation to the deshielded C-22 (δC 189.1), suggesting a benzoyl substituent.
Table 2. 1H and 13C NMR data for Discorhabdophenone A, B, and C (4–6) ((600 (1H) and 150 (13C) MHz, (CD3)2SO)).
Other than that benzoyl group, the NMR data suggested a discorhabdin backbone with the presence of the C-6 spiro-center (δC 38.7), the C-3 oxymethine (δC 68.0) (C-3), and the C-11 deshielded quaternary carbon (δC 169.2). The 1D and 2D NMR data showed the backbone of 4 to have significant similarities to 1 with the only changes being two methylene groups in the place of the Δ7-olefin, the C-7 bromine, and the loss of the proton previously seen on C-14. To complete the planar structure of 4, the benzoyl substituent provides a ketone bridge between the phenyl ring and the open valence on C-14. While no correlations from H-16 to C-22 or H-24 to C-14 were present in multiple HMBC or LR-HMBC experiments, the open valence on C-14 offers the only plausible location for the benzoyl group.
The Latrunculia sp. specimen from Palmer Station yielded two pyrroloiminoquinones with significant similarities to each other. One, discorhabdophenone B (5) displayed two 2H olefin doublets (H2-24, δH 8.42; H2-25, δH 6.90) compared to the second, discorhabdophenone C (6), with one olefinic doublet (H2-24, δH 8.35) and two olefinic triplets (H2-25, δH 7.55; H-26, δH 7.63). These shifts suggested that 5 had a p-disubstituted phenyl ring and that 6 had a mono-substituted phenyl ring, as found in 4.
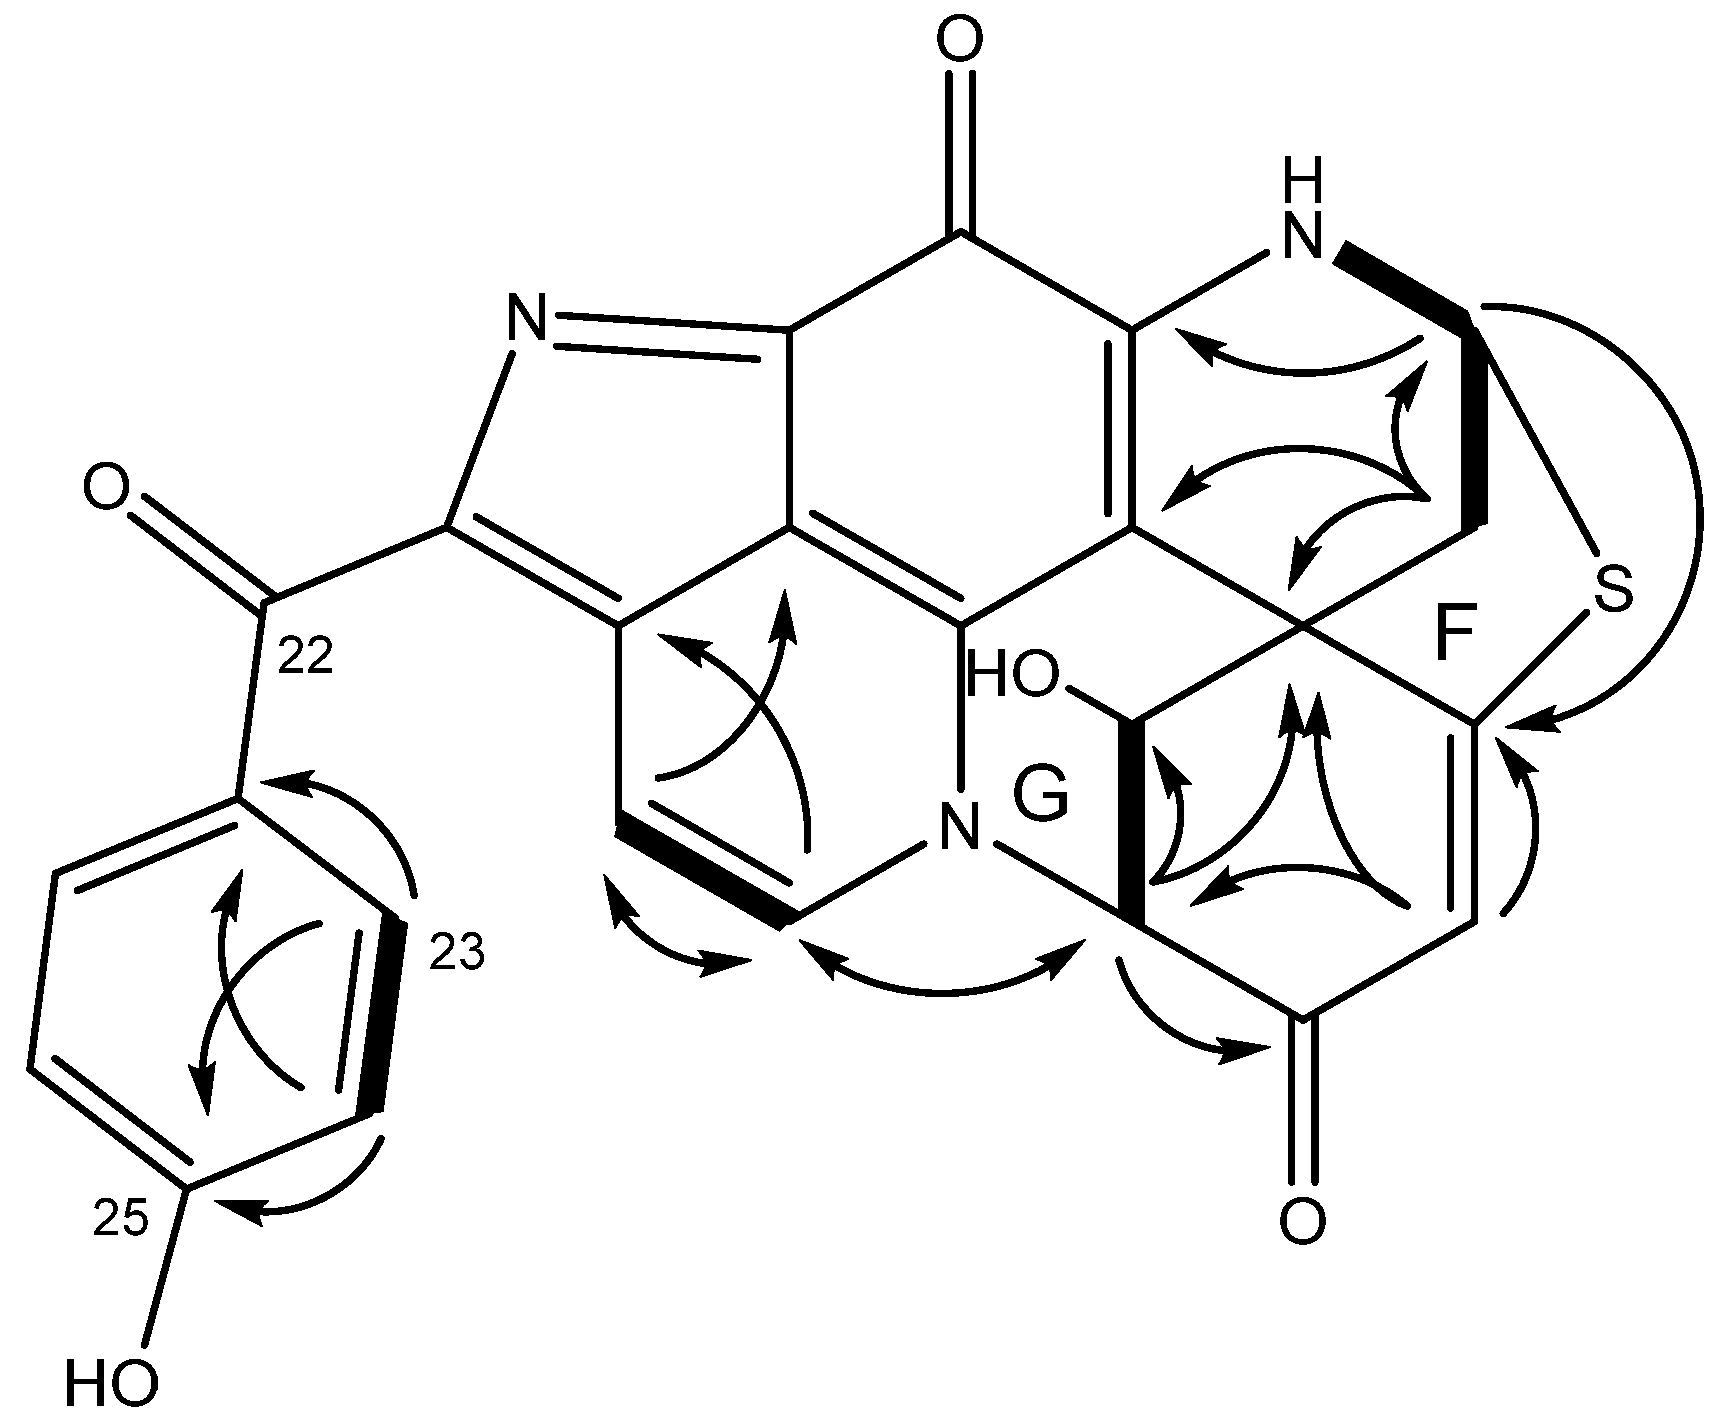
Discorhabdophenone B (5) was isolated with a m/z of 470.0810 (HRESIMS, [M + H]+) and a molecular formula of C25H15N3O4S, corroborated by the 1H and 13C NMR data (Table 2). Structure elucidation was completed by COSY and HMBC correlations (Figure 3) and comparison with known discorhabdin derivatives. The compound was identified as a discorhabdin due to the C-6 spiro-center (δH 47.5) and the C-11 carbonyl (δC 168.7). The 1H NMR data indicated that 5 had a p-substituted phenyl ring, two additional aromatic protons, four deshielded methines, and one methylene.
Figure 3. COSY (bold) and HMBC (arrow) correlations of 5 establishing new rings F and G.
Discorhabdophenone B (5) differed from the previously presented discorhabdins herein due to the presence of a sulphur atom in the molecular formula; however, a C-5/C-8 sulphur bridge is a common feature among discorhabdin derivatives. Additional differences were the presence of three deshielded methines and the absence of the bromine atom, identified by the lack of a 1:1 isotopic pattern in the mass spectrum (Figure S36), and the presence of two extra deshielded quaternary carbons. The two deshielded methines H-1 (δH 4.84) and H-2 (δH 5.02) had COSY correlation to each other, with H-1 being identified as an oxymethine due to COSY correlation between the exchangeable δH 6.75 (OH-1) and H-1. H-2 displayed HMBC correlations to deshielded C-1 (δC 67.2), C-3 (δC 184.5), C-6 (δC 47.5), and C-17 (δC 131.5). H-4 (δH 5.96) had HMBC correlations to C-2 (δC 65.7), C-5 (δC 171.3), and C-6, identifying ring E, as shown in Figure 3, with a ketone on C-3, Δ4 olefin, and an open valence on C-2 and C-5.
The lack of a clear HMBC correlation from H2-7 to C-1 left a level of uncertainty regarding the position of the carbonyl and hydroxy group on ring D. The chemical shift in the carbonyl suggested that it was part of a conjugated system, positioning it on C-3. Conversely, TOCSY correlations displayed evidence of a spin-coupled system between H-1/H-2/H-4, supporting the assignment of the hydroxy group to C-3. To determine the location of the carbonyl, DFT-based chemical shift predictions for the regioisomers of 5 were compared to the experimental chemical shift. The predicted chemical shifts in both thiol–ene and carbonyl carbons were in significantly better agreement with the experimental chemical shifts with the hydroxy group on C-1 and the carbonyl on C-3 (Figure 4A). Examination of the geometry-optimized conformer of 5 showed that H-2 and H-4 occupy the same plane (<10°). This is consistent with W-coupling between H-2/H-4, explaining the observed H-1/H-2/H-4 TOCSY spin system, while no direct COSY correlation from the hydroxyl (H-1) to H-4 was observed (Figure 4B).
Figure 4. (A) Predicted vs. experimental chemical shifts in possible regioisomers of discorhabdophenone B (5) measured in delta ppm. (B) 3D model of geometry-optimized conformer of discorhabdophenone B (5) showing H-2 and H-4 are in the same plane of ring D.
The third deshielded methine H-8 (δH 5.70) displayed COSY correlations with methylene H2-7 (δH 2.86/2.61) and the exchangeable H-9 (δH 9.30). Furthermore, H2-7 showed HMBC correlations to C-6, C-8 (δC 63.4), and C-20, placing these in ring D. The open valences on C-5 and C-8 suggested the sulphur bridge previously mentioned. This was corroborated by HMBC correlations from H-8 to C-5. The two olefinic protons δH 7.94 (H-16) and δH 8.05 (H-17) were left to assign, with COSY correlations shown between the two and HMBC correlations from H-16 to C-19 (δC 146.0). H-17 had HMBC correlation to C-2, suggesting an N-18 to C-2 heterocycle, as reported for previous discorhabdin derivatives. Lastly, the previously established benzoyl group was connected to the discorhabdin backbone at the only remaining open valence, C-14, as observed in 4.
Discorhabdophenone C (6) was isolated with the m/z of 454.0861 (HRESIMS, [M + H]+). Corroborating 1H and 13C NMR data (Table 2), 6 was found with the molecular formula of C25H15N3O4S, which is one oxygen atom fewer than found in 5. The 1D and 2D NMR data indicated a significant difference for C-26 (δC 161.5 for 5 and 132.1 for 6), suggesting that 6 lacked the phenol function and congruent with the 1H NMR analysis of the two that was described above. Unlike the reported discorhabdins which contain the C-2 to N-18 bridge, compounds 5 and 6 were not isolated in a protonated state. This was determined based on the number of exchangeable protons visible in 1H NMR spectra, and the presence of sodium adducts [M + Na]+ (5: calculated m/z: 492.0635, observed m/z: 492.0613, Δ 4.6 ppm; 6: calculated m/z: 476.0681, observed m/z: 476.0679, Δ 0.4 ppm) in HRESIMS data (Figures S37 and S49) [,,].

2.2. Stereochemical Analysis

2.2.1. Relative Stereochemistry

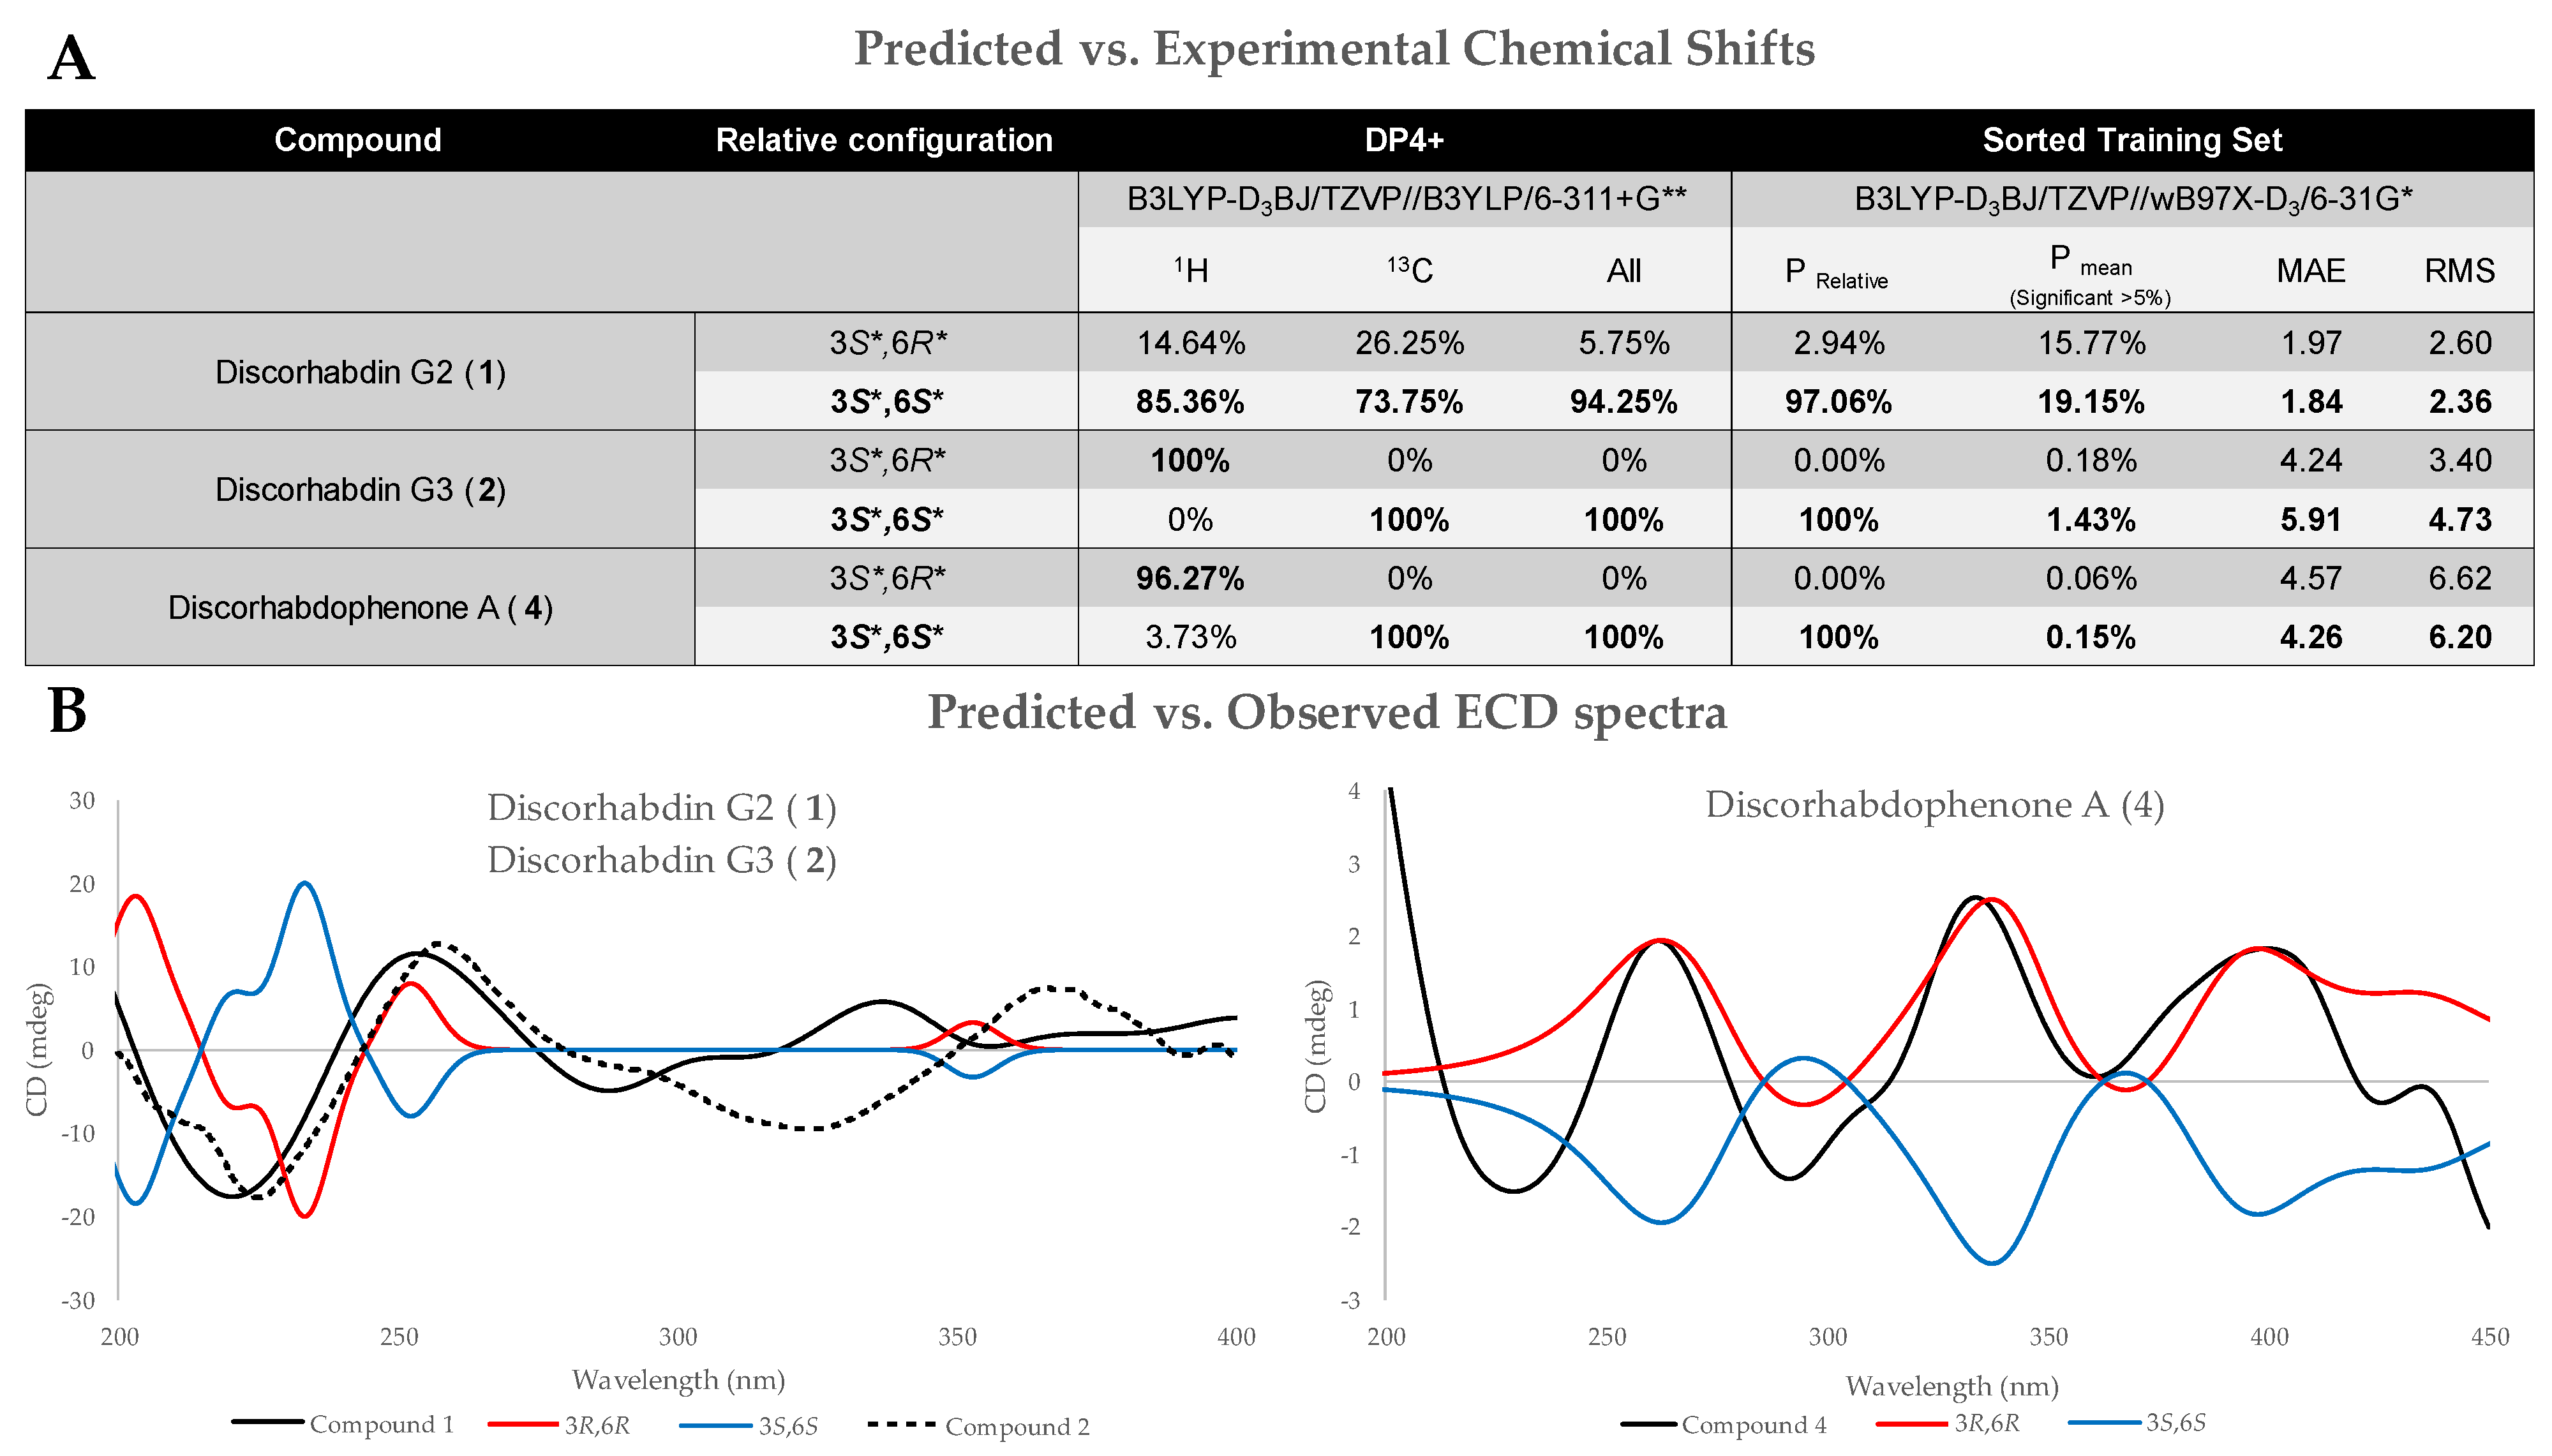
The stereochemistry of the new discorhabdin derivatives reported herein (1, 2 and 4–6) was established based on coupling constants and chemical shift predictions using Density Functional Theory (DFT) and Gauge-Including Atomic Orbitals (GIAO). Compounds 1, 2, and 4 have two stereocenters, the C-6 spiro-center, which was prominent for all metabolites with the discorhabdins backbone, and a C-3 hydroxyl. As 2D Nuclear Overhauser Effect Spectroscopy (NOESY) correlations for 1, 2, and 4 from H-3 to methylene signals H-5 were inconclusive for determining relative configurations of C-3, DFT/GIAO-based chemical shift prediction and comparison tools DP4+ and Sorted Training Set (STS) were employed. A comparison of predicted 13C shielding tensors for 3S*,6S* and 3S*,6R* for 1, 2, and 4, at a B3LYP-D3BJ/TZVP//wB97X-D3/6-31G* level, were compared to the experimental chemical shifts using STS, resulting in a 97%, 100%, and 100% probability of 3S*,6S* relative configuration for 1, 2, and 4, respectively []. To increase our confidence in the assigned relative configuration, shielding tenors were additionally predicted at a B3LYP-D3BJ/TZVP//B3YLP/6-311+G** level and compared using DP4+, yielding a 94%, 100%, and 100% probability of the three metabolites possessing a 3S*,6S* configuration when incorporating both 1H and 13C shielding tensors (Figure 5A) [].
Figure 5. (A) DP4+ and STS probabilities from comparing experimental and DFT-predicted chemical shift in relative configurations of compounds 1, 2, and 4, with results indicating 3S*,6S* configuration. (B) Experimental vs. observed ECD spectra of 1, 2, and 4. Spectra were predicted and measured in methanol.
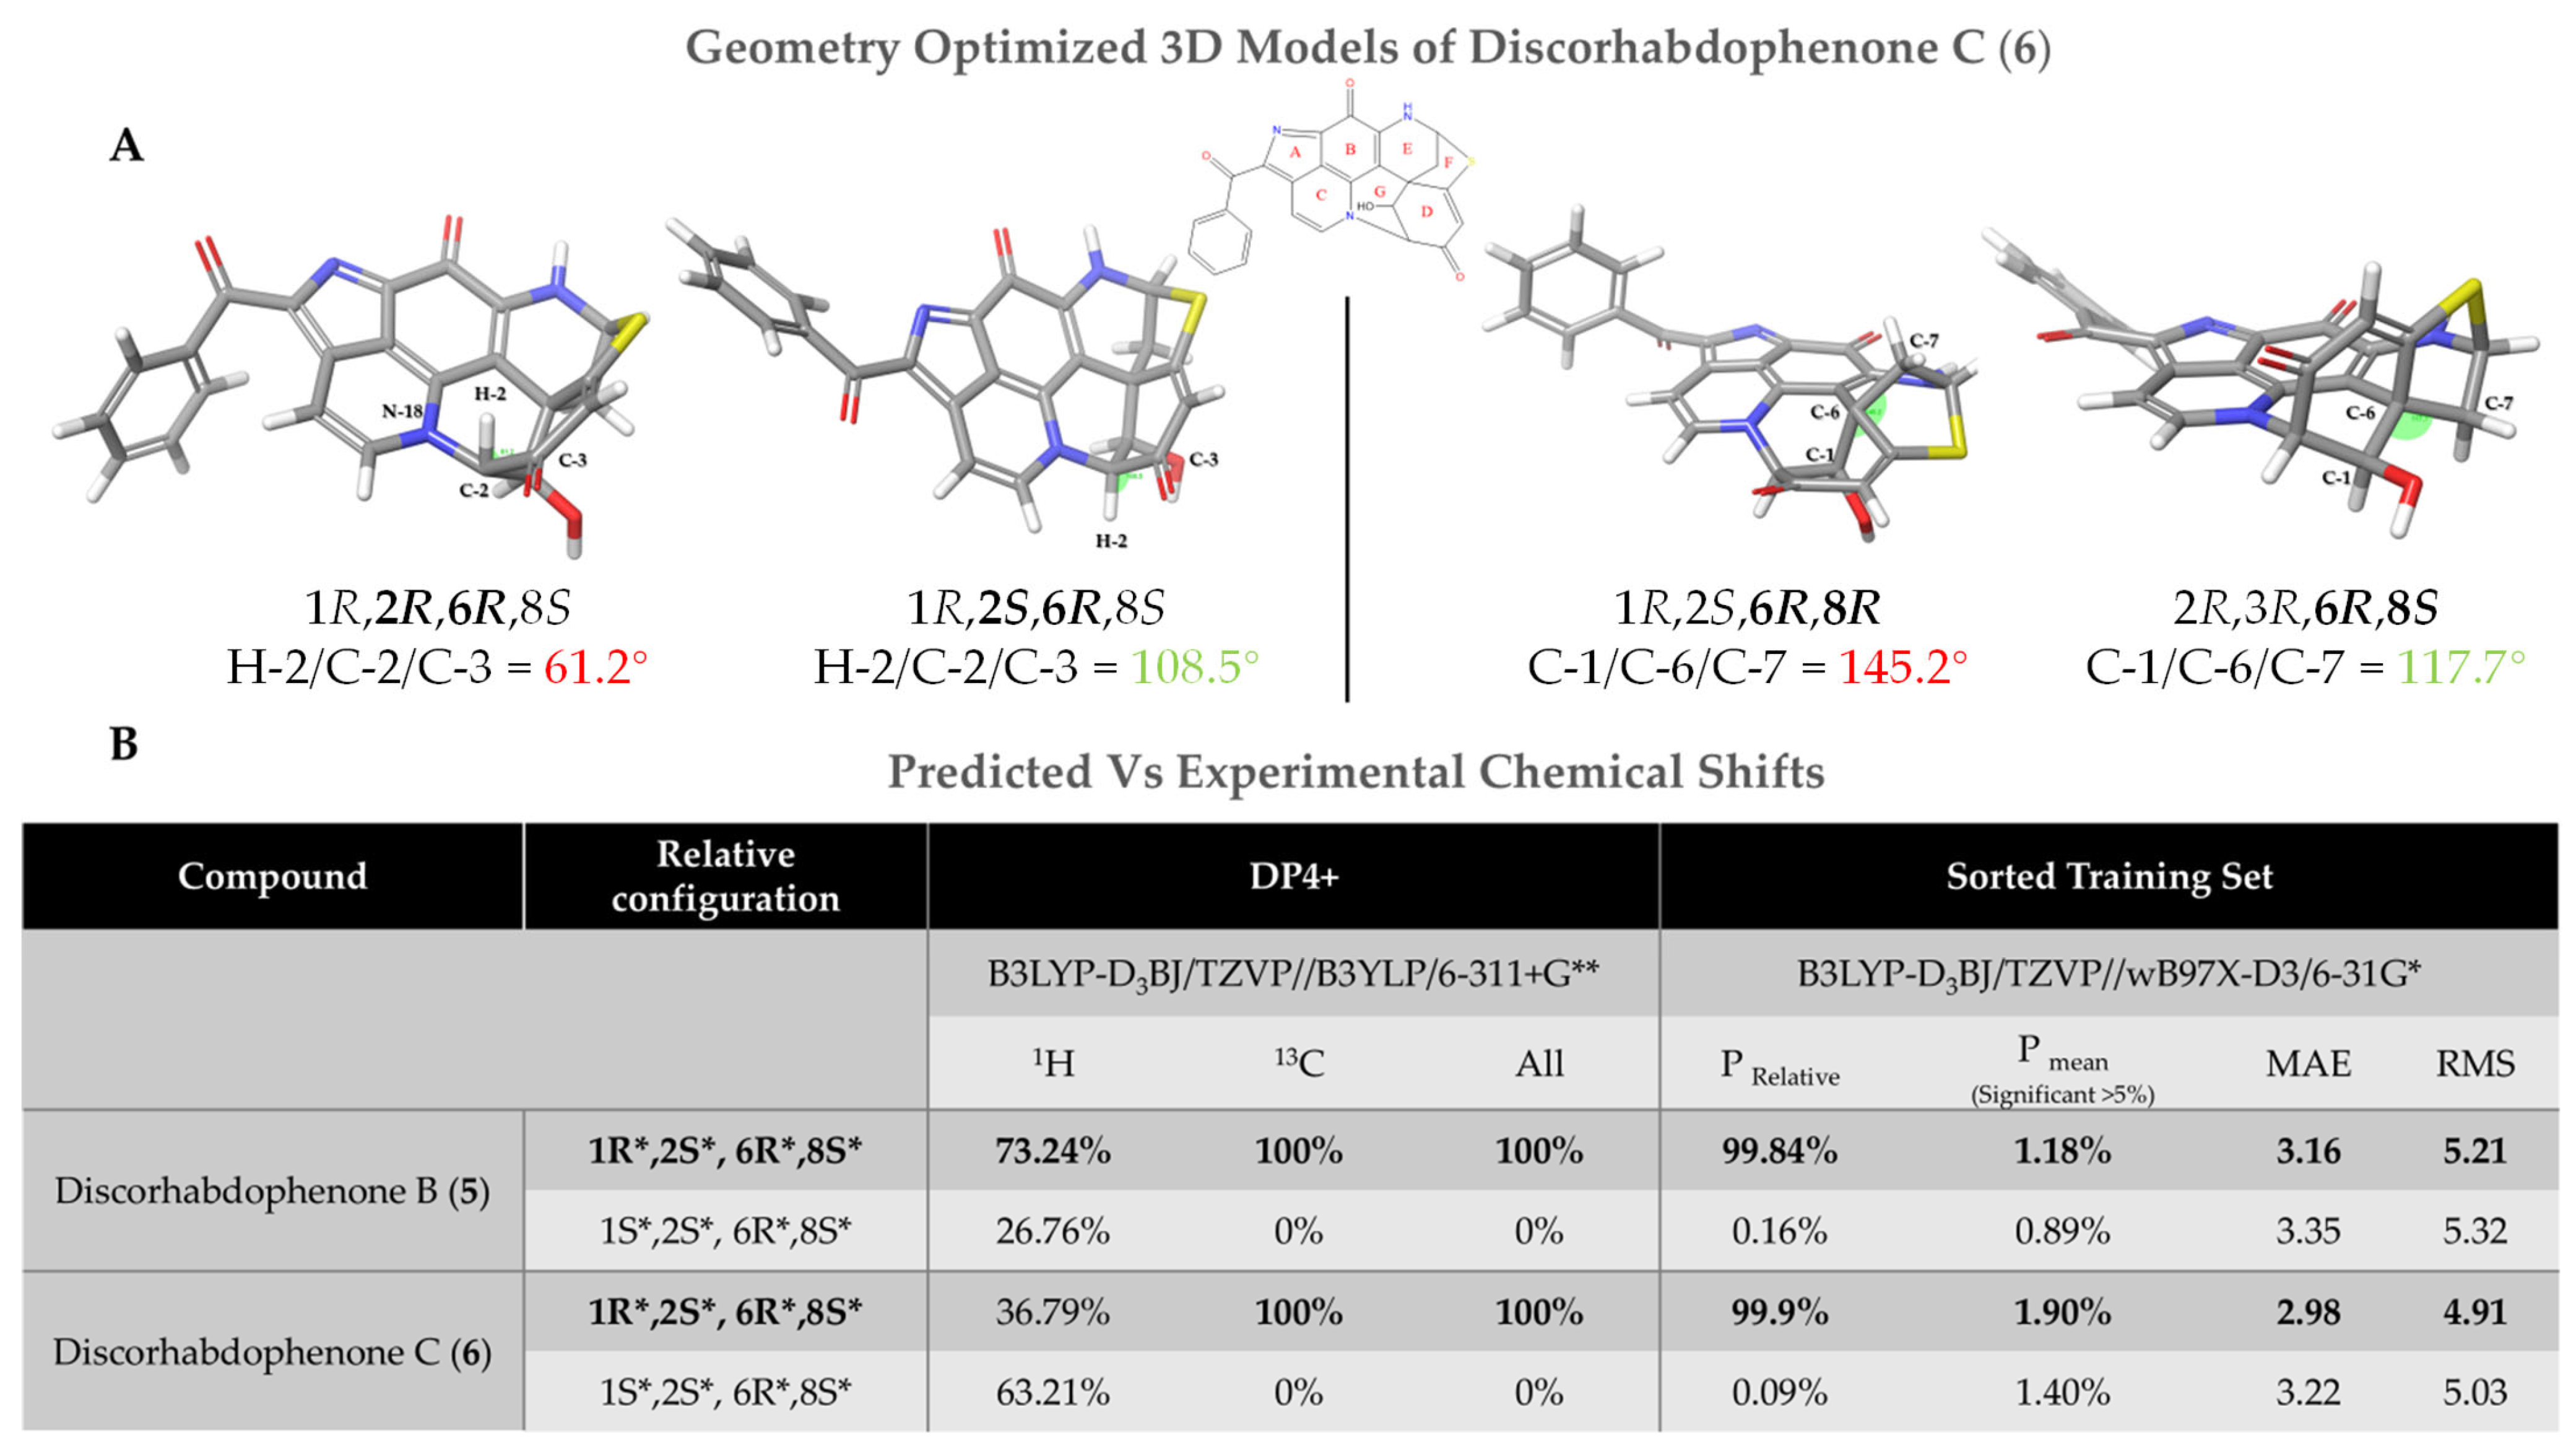
Compounds 5 and 6 have four chiral centers, C-1, C-2, C-6, and C-8, with eight theoretical relative configurations. Analysis of bond angles C-5/C-6/C-20 and C-1/C-6/C-7 of energy-minimized 3D models indicates that only 6R*,8S* or 6S*,8R* configurations possess plausible geometries around C-6, when C-5 and H-8 are on opposite faces of ring E, due to conformational constraints. Similarly, the examination of bond angles of 3D models, centering on C-2, limit H-2 and C-4 to occupying opposite faces of ring G, consistent with 1X, 2S*,6R*,8S* (X = R or S) configurations (Figure 5A).
Examination of coupling constants between H-1/H-2 was inconclusive for the assignment of C-1 relative configuration, with 3JHH 2.4 Hz being consistent with a 64° dihedral angle, compared to 45° found for 1R*, 2R* and 82° found for 1S*, 2R*, respectively. To determine the relative configuration of C-1, a comparison of DFT/GAIO-based chemical shift predictions and experimental was conducted for 1R*,2S*,6R*,8S* and 1S*,2S*,6R*,8S*, using the same methodology that was applied for 1, 2, and 4. STS and the DP4+ probability calculator predicted >99% and 100% of 1R*,2S*,6R*,8S* relative configurations for both 5 and 6, respectively (Figure 6B).
Figure 6. (A) Geometry-optimized models of possible relative configurations of 6, used to determine the bond angles and feasibility of relative configurations. (B) DP4+ and STS probabilities from comparing experimental and DFT-predicted chemical shift in relative configurations of compounds 5 and 6, with results indicating a 1R*,2S*,6R*,8S* configuration.

2.2.2. Absolute Stereochemistry

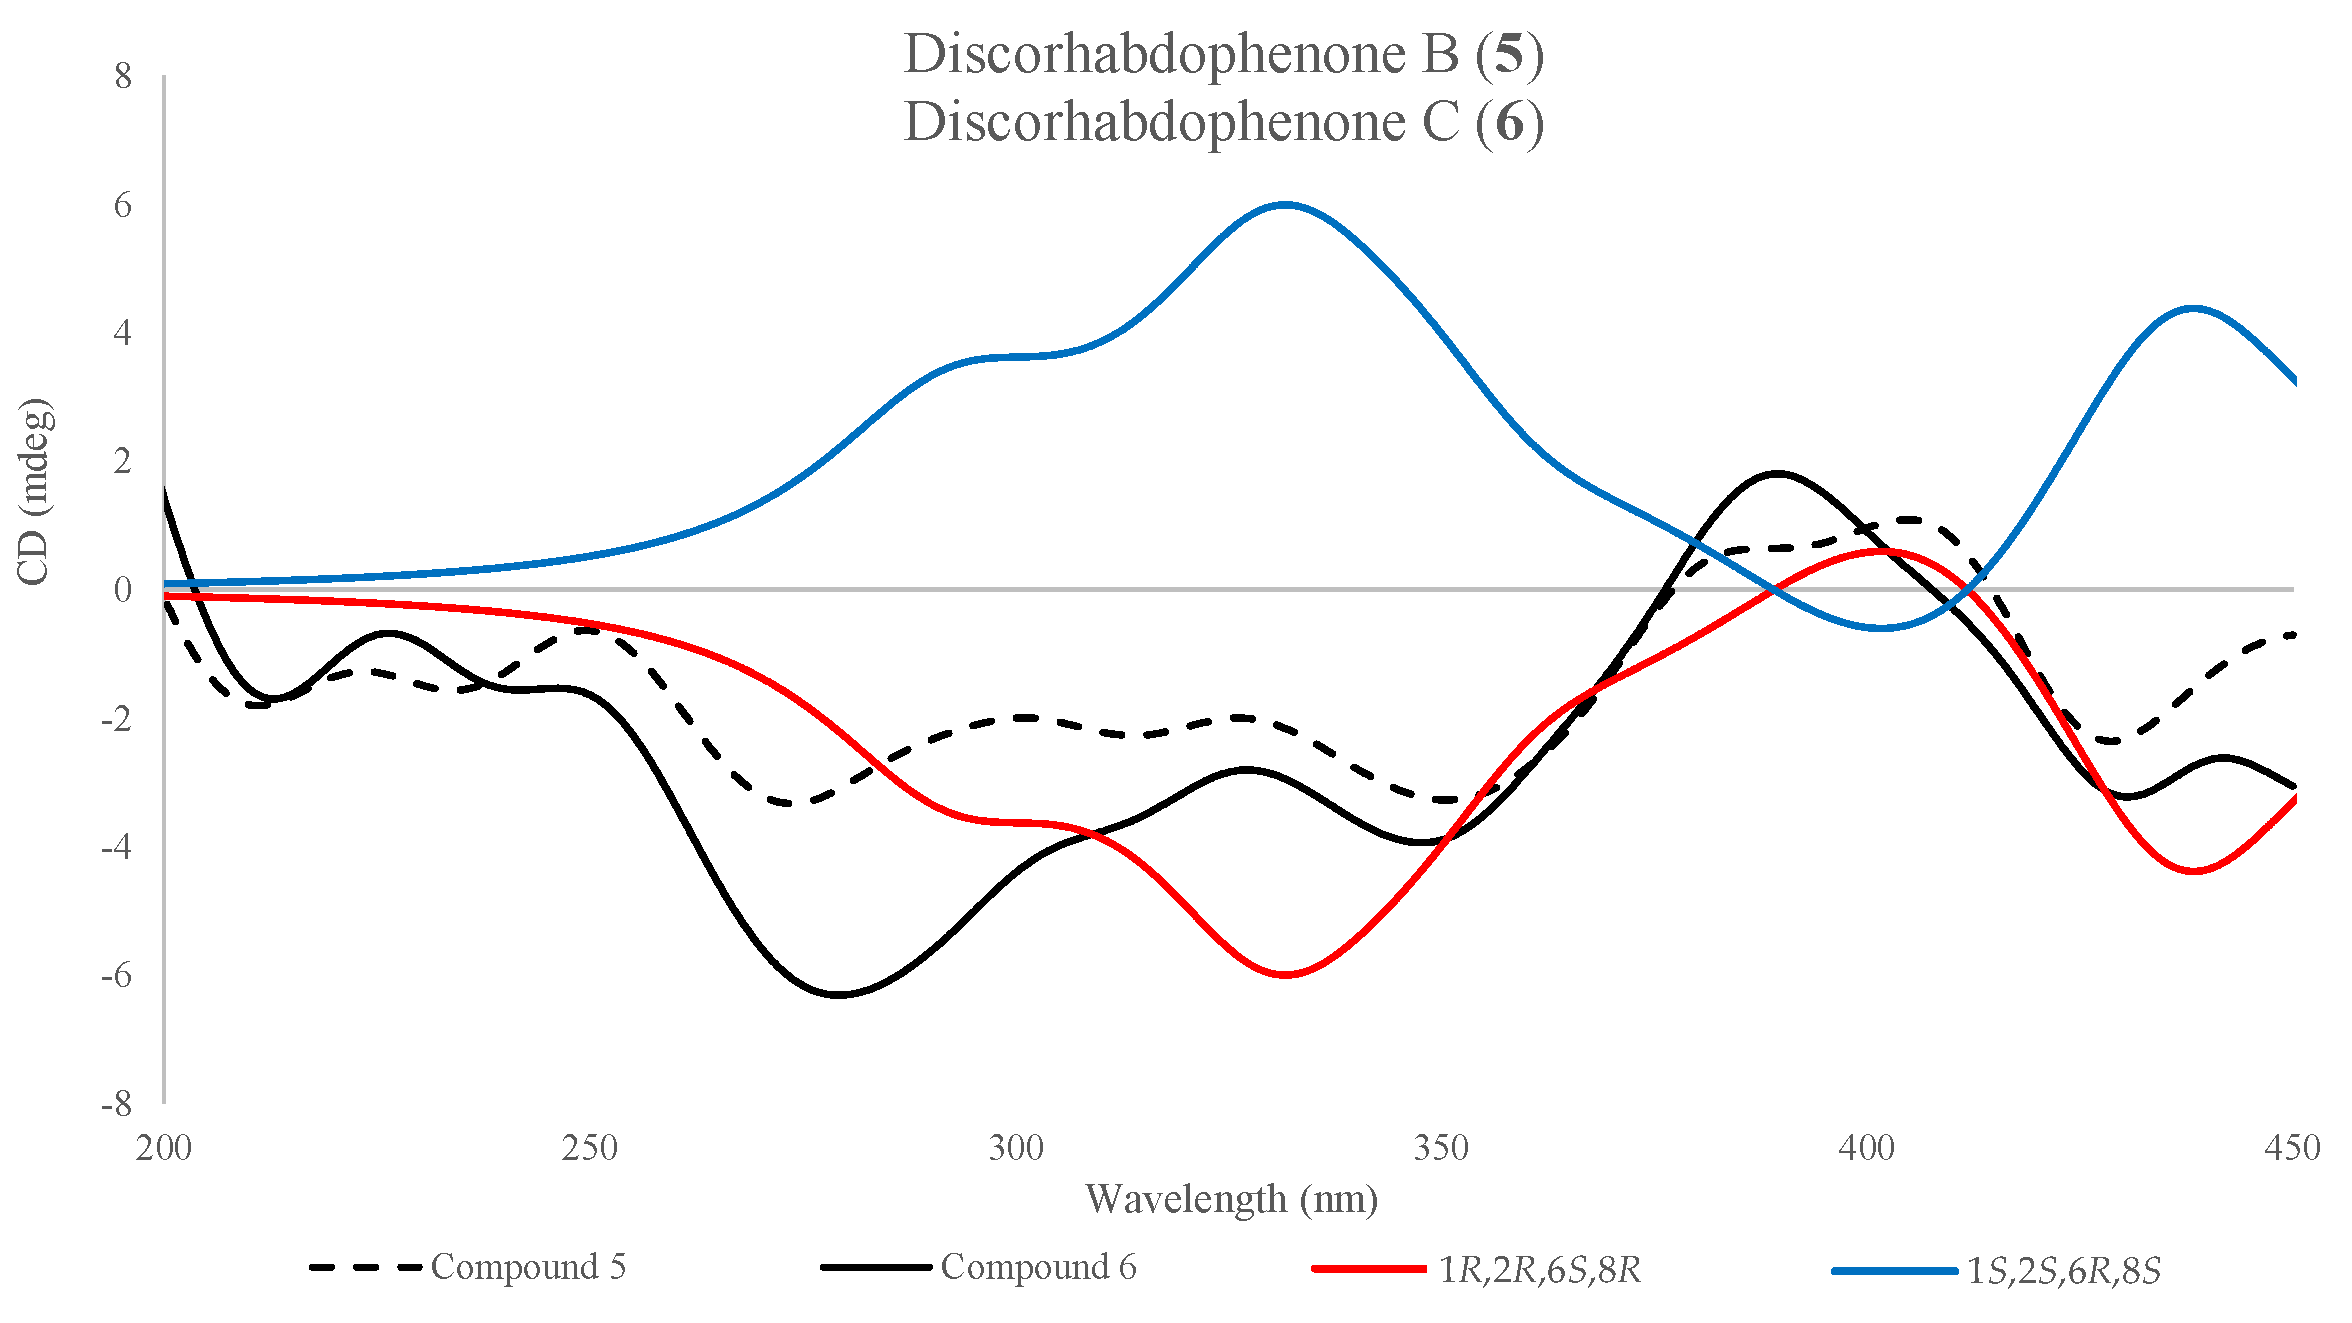
The absolute configuration of compounds 1, 2, and 46 was determined by a comparison of experimental Electronic Circular Dichroism (ECD) and simulated ECD spectra using time-dependent density functional theory (TD-DFT), predicted at a B3LYP-D3/CC-PVDZ// B3LYP-D3/CC-PVDZ level using a PCM solvation model. Compounds 5 and 6 were assigned an absolute configuration of 1S,2R,6S,8R (Figure 7), while 1, 2, and 4 were assigned 3R,6R (Figure 5B). It is worth noting that the predicted spectra of 1 and 2 required a scaling factor of 0.65 to accurately match the experimental ECD spectra.
Figure 7. Comparison of observed ECD spectra of discorhabdophenone B (5, dashed-black) and discorhabdophenone C (6, solid-black) to the TD-DFT-predicted spectra of both epimers of 6, 1R,2S,6R,8S (blue) and 1S,2R,6S,8R (red). Spectra were predicted and measured in methanol.

2.3. Bioactivity

The three crude extracts from specimens of Latrunculia spp. showed strong cytotoxic properties against a strain of human lung cells (A549) but no activity against Candida albicans nor C. auras. Upon the purification of metabolites, each were screened for their cytotoxic properties. The new discorhabdin derivatives 1 and 2 showed strong cytotoxicity, with IC50’s (Table 3) of 4.3 μM and 1.8 μM, respectively, and the known metabolite (+)-debromodiscorhabdin A (3) showed an IC50 of 1.0 μM. No biological activity has been previously reported for (+)-debromodiscorhabdin A. Weak cytotoxicity was shown for 4, with an IC50 of 23.9 μM (Table 3), while 5 and 6 were inactive in the cytotoxicity assay. Their activity profile suggested that the discorhabdin backbone had a strong influence on cytotoxicity, with a decrease in cytotoxicity for 4 which had a Δ16 olefin compared to the Δ7 olefins shown for 1 and 2. Additionally, 4 had a benzophenone substituent. The benzophenone substituent was also present in 5 and 6 but neither showed cytotoxicity when tested at 50 μg/mL. Compounds 5 and 6 differed from 4 in terms of the C-2/N-18 bridge, a C-5/C-8 sulphur bridge, and Δ4,16 olefins. Such structural insights may shed light on a cytotoxicity-optimized derivative.
Table 3. Cytotoxicity activity against the A549 cells (IC50).

3. Materials and Methods

3.1. General Experimental Procedures

Optical rotations were measured using an AutoPol IV digital polarimeter (Hackettstown, NJ, USA) at 589 nm with a 1 dm path length cell. UV-Vis spectra were extracted from HPLC chromatograms. NMR spectra were acquired using a Bruker Neo 600 MHz broadband spectrophotometer (Rheinstetten, Germany). The residual solvent peaks were used as an internal chemical shift reference ((CD3)2SO: δC 39.5; δH 2.50). High-resolution mass spectrometry–liquid chromatography data were obtained on an Agilent 6540 LC-MS QTOF (Wilmington, DE, USA) coupled to an Agilent Jet-stream electrospray ionization detector. H2O + 0.1% FA (A) and CH3CN + 0.1% FA (B) were used as mobile phases on a Phenomenex Kinetex C18 column (2.6 μm, 100 Å, 150 × 3 mm: 0.5 mL/min) (Torrance, CA, USA). Reverse-phase HPLC was performed on a Shimadzu LC20-AT system (Canby, OR, USA) equipped with a photodiode array detector (M20A) using a preparative Phenomenex C18 column (5 μm, 100 Å, 250 × 21.2 mm: 10 mL/min) or a semi-preparative Phenomenex C18 column (10 μm, 100 Å, 250 × 10 mm: 4 mL/min). CCS values were measured on an Agilent 6560c LC-IMS-Q-TOF (Wilmington, DE, USA) using high-purity N2, with CCS values referenced to Agilent ESI tune Mix, in positive mode, with CCS value calculations using Agilent Mass Hunter IM-MS Browser (build 10.0.1.10039). The drift gas temperature was 27 °C at 3.940 torr. The electronic field was 18.549 V/cm. The methanol and acetonitrile used for column chromatography were obtained from Fisher Co. (Waltham, MA, USA) and were HPLC grade (>99% purity), while the H2O was distilled and filtered. Solvents mixtures are reported as % v/v.

3.2. Biological Materials

Two specimens of Latrunculia cf. biformis (Figure S50) were collected at 210 m depth from the Kerguelen Plateau, Antarctica (−51.137 S, 71.8269 E), by trawling (sample codes ACE16-49, WAMZ44145; ACE16-51, WAMZ44147), with wet weights of 0.15 kg and 1.5 kg, respectively. An additional specimen (sample code PSC18-41, wet weight: 3.3 kg) of Latrunculia sp. (Figure S50) was collected by SCUBA at 40 m depth from Cormorant Island near Palmer station, Antarctica (−64.77551 S; −64.071805 W). A small piece of tissue from the two specimens from the Kerguelen Plateau were extracted for DNA using the Qiagen Blood & Tissue DNeasy kit according to the manufacturer’s instructions. A fragment of the mitochondrial Cytochrome Oxidase I (COI) gene was amplified by PCR using primers from [], purified enzymatically, and bidirectionally Sanger sequenced at the Australian Genome Research Facility (AGRF, Perth, Australia). Reads were assembled and edited using Geneious Prime v2022.1, and analyzed with other relevant data from NCBI in a Maximum Likelihood framework in IQ-tree [] implementing ModelFinder []. The resulting tree shows the phylogenetic placement of the specimens (Figure S51).

3.3. Extraction, Isolation, and Purification

Specimens were kept frozen upon collection and freeze-dried on return to our lab. Upon analysis, the three freeze-dried specimens were crushed and extracted separately in MeOH for 24 h. The extracts were filtered and replaced with fresh MeOH twice. Extracts from the three specimens were separately eluted from the HP20 by first washing the fresh resin with Me2CO before pre-equilibrating the columns with H2O. The extracts were then applied to the resin and eluted from their respective HP20 column before the eluent was diluted with equal volume H2O and again eluted from the column. This was repeated a second time. Three fractions of decreasing polarity were created by eluting the column with (A) 30% Me2CO/H2O, (B) 75% Me2CO/H2O, and (C) 100% Me2CO. Fraction B was further pursued for all three specimens.
Preparative C18 HPLC was performed on ACE16-49B (420 mg) with a gradient of 50–100% ACN/H2O over 30 min, resulting in 12 fractions, designated B1–B12. The mass spectrum (MS) indicated that fractions B1 (32.4 mg) and B6 (50.2 mg) contained brominated metabolites and therefore they were further prioritized. Fraction B1 was further fractionated by semipreparative C18 HPLC with a 10–100% MeOH/H2O gradient over 30 min, resulting in the pure compound B1-B. B1-B (2: 10 mg, RT = 13.7 min) and B6 (1: 50.2 mg, RT = 23.4 min) were determined pure compounds by 1H NMR spectroscopy. ACE16-51B (8.3 g) and PSC18-41B (6.2 g) were purified by RP-MPLC with a gradient of 10–100% MeOH/H2O over 60 min, resulting in 12 fractions each, designated as B1-B12. Fractions B2, B7, and B8 from ACE16-51 were further fractionated by semipreparative C18 HPLC with a gradient of 30–100% ACN/H2O (0.1% FA), resulting in the pure compounds (+)-debromodiscorhabdin A (3: 2.4 mg, RT = 12.1 min) and discorhabdophenone A (4: 6.3 mg, RT = 16.5 min), determined pure by 1H NMR spectroscopy. MPLC fractions B6, B7, and B8 from PSC18-41 were all combined due to similarities in 1H NMR and MS spectra. They were fractionated by semipreparative C18 HPLC with a gradient of 20–100% ACN/H2O (0.1% FA) over 30 min, resulting in the pure compounds discorhabdophenone B (5: 4.5 mg, RT = 7 min) and discorhabdophenone C (6: 1.9 mg, RT = 18.2 min).

3.4. Spectroscopic Data (1, 2, and 46)

Discorhabdin G2 (1): deep-red solid; [ α ] D 22 −241.4 (c 0.029, MeOH); UV (MeOH/H2O) λmax (log ε ) 211, 228 (sh), 463 (sh) nm (8.22, 8.53, 1.65); 1H NMR (600 MHz) and 13C NMR (150 MHz) data, see Table 1 and Table S1; HRESIMS m/z 463.9450 [M + H]+ (calcd for C18H14O2N379Br, 463.9427; ∆ 4.96 ppm). CCS [M + H]+ 195.8 Å2.
Discorhabdin G3 (2): green solid; [ α ] D 22   +207.4 (c 0.068, MeOH); UV (MeOH/H2O λmax (log ε ) 207, 247 (sh), 336 (sh), 564 (sh) nm (7.45, 5.99, 2.79, 0.34); 1H NMR (400 MHz) and 13C NMR (100 MHz) data, see Table 1 and Table S2; HRESIMS m/z 386.0505 [M + H]+ (calcd for C18H17O2N379Br2, 386.0499; ∆ 1.6 ppm). CCS [M + H]+ 193.0 Å2.
(+)-Debromodiscorhabdin A (3) was dereplicated by Small Molecular Accurate Recognition Technology (SMART) NMR, with a cosine score of 0.890, by the use of its HSQC data []. Compound 3 was identified by its multiplicity-edited HSQC data as having three olefinic protons, two deshielded methines, and four methylene groups. Its HRESIMS displayed an [M + H]+ ion at m/z 338.0976, which, with its 1H and 13C NMR data (see Table S3), matches the molecular formula of C18H16N3O2S for the known debromodiscorhabdin A (3) []. The published optical rotation of [ α ] D 22   +207 agrees well the experimental optical rotation of [ α ] D 22   +178.9.
Discorhabdophenone A (4): deep-red solid; [ α ] D 22   +66.0 (c 0.076, MeOH); UV (ACN/H2O) λmax (log ε ) 229, 306 (sh), 462 (sh) nm (21.96, 11.67, 4.03); 1H NMR (400 MHz) and 13C NMR (100 MHz) data, see Table 2 and Table S4; HRESIMS m/z 490.0773 [M + H]+ (calcd for C25H21O3N379Br, 490.0761; Δ 2.5 ppm). CCS [M + H]+ 214.1 Å2.
Discorhabdophenone B (5): deep-red solid; [ α ] D 22   +310.5 (c 0.11, MeOH); UV (ACN/H2O) λmax (log ε ) 214, 282 (sh), 469 (sh) nm (19.16, 14.65, 3.68); 1H NMR (400 MHz) and 13C NMR (100 MHz) data, see Table 2 and Table S5; HRESIMS m/z 470.0810 [M + H]+ (calcd for C25H16O5N3S, 470.0805; Δ 1.1 ppm). CCS [M + H]+ 208.2 Å2.
Discorhabdophenone C (6): deep-red solid; [ α ] D 22   +229.2 (c 0.096, MeOH); UV (ACN/H2O) λmax (log ε ) 205, 282 (sh), 475 (sh) nm (10.11, 6.76, 1.97); 1H NMR (400 MHz) and 13C NMR (100 MHz) data, see Table 2 and Table S6; HRESIMS m/z 454.0861 [M + H]+ (calcd for C25H16O4N3S, 454.0856; Δ 1.1 ppm). CCS [M + H]+ 208.1 Å2.

3.5. Computational Methods

All molecular mechanics and quantum mechanics calculations were integrated using Macromodel and Jaguar (version 2024-1, Schrodinger LLC) and ORCA 6.0.1 [,,,,,].

3.5.1. Conformer Generation

Conformation searches for each isomer utilized OPLS4 to generate low-energy conformers within a 5 kcal/mol energy window, in the liquid phase (water), using a mixed torsional/low-mode sampling approach. Conformers with <0.5 Å atom deviation were removed to prevent redundancy.

3.5.2. Chemical Shift and Shielding Tensor Predictions

Conformers underwent geometry optimization using DFT at the B3LYP-D3(BJ)/TZVP level with a CPCM (DMSO) solvation model and tightSCF convergence tolerance using ORCA 6.0.1. Frequency calculations were conducted on geometry-optimized conformers and conformers with a negative frequency were re-optimized with an extremeSCF convergence tolerance. NMR shielding tensors were predicted using DFT/GIAO at the ωB97X-D/6-31G* level, with bromine atoms being calculated at the ωB97X-D/6-311G* level, using a CPCM solvation model (DMSO), for use with the Sorted Training Set (STS) comparison tool. Shielding tensor predictions were repeated at a B3YLP/6-311+G** level for use with the DP4+ probability predictor. Boltzmann-weighted shielding tensors were calculated based on each conformers Gibbs Free energy calculated at B3LYP-D3(BJ)/TZVP level. A Sorted Training Set (STS) excel sheet was used to compare the experimental 13C chemical shift to predicted chemical shifts for each configuration. Additionally, a DP4+ excel sheet was used for a comparison of experimental 1H and 13C chemical shifts to predicted shielding tensors. The experimental and predicted chemical shifts in the non-equivalent protons were aligned based on their relative shielding, with upfield and downfield trends used to guide the assignments. Exchangeable protons were excluded from chemical shift comparisons. Metabolites were calculated as neutral molecules.

3.5.3. Electronic Circular Dichroism Spectral Predictions

Conformers underwent geometry optimization and subsequent relative thermal free energies (ΔG) at 298.15 K, using DFT at the B3LYP-D3/cc-pVDZ level. Geometry optimization was carried out using a methanol PCM solvation model, while single-point energy calculations were conducted using a PBF solvent model for improved energy calculation accuracy. Conformers with negative vibrational frequencies were removed. ECD spectra for each conformer were computed using TD-DFT at the B3LYP-D3/cc-pVDZ level, using 20 excited states generated by Tamm–Dancoff approximation. Boltzmann conformer populations were used to create a weighted averaged ECD spectrum. Experimental and predicted spectra were visualized using Excel and a Schrodinger spectral plot tool. A comparison between experimental and predicted UV spectra was used to determine wavelength corrections. Predicted ECD spectra were normalized to match the intensities of experimental signals. Metabolites were calculated as neutral molecules. The predicted spectra of 1 and 2 required a scaling factor of 0.65 to accurately match the experimental ECD spectra.

3.6. Cytotoxicity Assay

Stock solutions of A549 cells were prepared at 1 × 10⁴ cells/mL in growth media (FK12 medium Kaighn’s modification, 10% bovine growth serum, 1% penicillin-streptomycin) using a calibration curve based on UV-Vis absorbance at 450, 530, and 600 nm. To each well of a 96-well plate 200 μL of this solution was added and incubated for 24 h at 37 °C and 5% CO2 atmosphere. Each testing solution (2 μL) was then added to the wells in triplicate and the plate was incubated for 72 h, at which point the media in each plate was removed and each well was washed with 1× phosphate-buffered saline (PBS). After the solution of MTT (1.25 mg/mL in 75% growth media 25% PBS) was added to each well, the plate was incubated. After 4 h of incubation, the media was removed carefully to avoid disturbing the crystals in the bottom of each well. DMSO (200 μL) was added to each well and the cell viability was calculated as a percentage using the negative control. DMSO was used as a negative control, and the positive control was nystatin.

4. Conclusions

Three specimens of Latrunculia spp. from two different Southern Ocean locations were found with new discorhabdin derivatives, including the novel C-14 phenone function. The highly colored metabolites were purified using RP-HPLC by targeting characteristic 1H NMR signals and masses that sometimes displayed isotopic patterns. Five unreported metabolites were isolated, 1, 2, and 56, as well as one previously described metabolite, 3. Their cytotoxic properties were investigated against the A549 cell lines, where 1 and 2 displayed significant cytotoxicity at 4.3 μM and 1.8 μM, respectively. Compounds 46 showed weak or no cytotoxicity and differ from the other discorhabdins by the aforementioned phenone substituent.

Supplementary Materials

The following supporting information can be downloaded at https://www.mdpi.com/article/10.3390/md23100401/s1. Figures S1–S51 and Tables S1–S6: 1H, 13C, COSY, HSQC, and HMBC NMR spectra, as well as HRMS, and geometry-optimized conformers of metabolites 1, 2, and 46; maximum likelihood tree of Latrunculiidae COI; photographs of study specimens.

Author Contributions

Conceptualization, B.J.B. and N.G.W.; methodology, S.S.H.O., S.A., E.C.R. and B.J.B.; formal analysis, S.S.H.O., S.A. and E.C.R.; taxonomy, N.G.W. and B.J.B.; data curation, S.A., S.S.H.O., N.G.W. and B.J.B.; writing—original draft preparation, S.S.H.O. and S.A.; writing—review and editing, all authors; supervision, B.J.B.; funding acquisition, B.J.B. and N.G.W. All authors have read and agreed to the published version of the manuscript.

Funding

This work was supported by the US National Institutes of Health grant R21 AT010939 and R56 AI154922, National Science Foundation grant PLR-1341339 to B.J.B., and by the Antarctic Circumnavigation Expedition (carried out by the Swiss Polar Institute, supported by the ACE Foundation and Ferring Pharmaceuticals). A portion of this work was performed in the McKnight Brain Institute at the National High Magnetic Field Laboratory’s Advanced Magnetic Resonance Imaging and Spectroscopy (AMRIS) Facility, which is supported by National Science Foundation Cooperative Agreement DMR-2128556 and the State of Florida.

Institutional Review Board Statement

Not applicable.

Data Availability Statement

The NMR data for the following compounds have been deposited in the Natural Products Magnetic Resonance Database (NP-MRD; www.np-mrd.org, accessed on 30 July 2025 and can be found at NP0351379 (Discorhabdin G2), NP0351380 (Discorhabdin G3), NP0351381 (Discorhabdophenone A), NP0351382 (Discorhabdophenone B), and NP NP0351383 (Discorhabdophenone C). Other data not found in the Supplementary Materials will be available upon request to the corresponding author.

Acknowledgments

The authors wish to thank the crew and science participants of the Antarctic Circumnavigation Expedition, and acknowledge collection permit 2016-168 for the French southern and Antarctic lands. We also thank USF core facility staff, including the Directors of the Chemical Purification, Analysis, and Screening, and the Interdisciplinary NMR Facility, and the collections staff at the Western Australian Museum, with particular thanks to Alex Hickling.

Conflicts of Interest

The authors declare no conflicts of interest.

References

  1. Hu, J.-F.; Fan, H.; Xiong, J.; Wu, S.-B. Discorhabdins and pyrroloiminoquinone-related alkaloids. Chem. Rev. 2011, 111, 5465–5491. [Google Scholar] [CrossRef] [PubMed]
  2. Kalinski, J.-C.J.; Polyzois, A.; Waterworth, S.C.; Siwe Noundou, X.; Dorrington, R.A. Current perspectives on pyrroloiminoquinones: Distribution, biosynthesis and drug discovery potential. Molecules 2022, 27, 8724. [Google Scholar] [CrossRef] [PubMed]
  3. Na, M.; Ding, Y.; Wang, B.; Tekwani, B.L.; Schinazi, R.F.; Franzblau, S.; Kelly, M.; Stone, R.; Li, X.-C.; Ferreira, D.; et al. Anti-infective discorhabdins from a deep-water Alaskan sponge of the senus Latrunculia. J. Nat. Prod. 2010, 73, 383–387. [Google Scholar] [CrossRef] [PubMed]
  4. Li, F.; Peifer, C.; Janussen, D.; Tasdemir, D. New discorhabdin alkaloids from the Antarctic deep-sea sponge Latrunculia biformis. Mar. Drugs 2019, 17, 439. [Google Scholar] [CrossRef]
  5. Li, F.; Kelly, M.; Tasdemir, D. Chemistry, chemotaxonomy and biological activity of the Latrunculid sponges (Order Poecilosclerida, Family Latrunculiidae). Mar. Drugs 2021, 19, 27. [Google Scholar] [CrossRef]
  6. Lang, G.; Pinkert, A.; Blunt, J.W.; Munro, M.H.G. Discorhabdin W, the first dimeric discorhabdin. J. Nat. Prod. 2005, 68, 1796–1798. [Google Scholar] [CrossRef]
  7. El-Naggar, M.; Capon, R.J. Discorhabdins revisited: Cytotoxic alkaloids from Southern Australian marine sponges of the genera Higginsia and Spongosorites. J. Nat. Prod. 2009, 72, 460–464. [Google Scholar] [CrossRef]
  8. Yang, A.; Baker, B.J.; Grimwade, J.; Leonard, A.; McClintock, J.B. Discorhabdin alkaloids from the Antarctic sponge Latrunculia apicalis. J. Nat. Prod. 1995, 58, 1596–1599. [Google Scholar] [CrossRef]
  9. Grkovic, T.; Pearce, A.N.; Munro, M.H.G.; Blunt, J.W.; Davies-Coleman, M.T.; Copp, B.R. Isolation and characterization of diastereomers of discorhabdins H and K and assignment of absolute configuration to discorhabdins D, N, Q, S, T, and U. J. Nat. Prod. 2010, 73, 1686–1693. [Google Scholar] [CrossRef]
  10. Grkovic, T.; Ding, Y.; Li, X.-C.; Webb, V.L.; Ferreira, D.; Copp, B.R. Enantiomeric discorhabdin alkaloids and establishment of their absolute configurations using theoretical calculations of electronic circular dichroism spectra. J. Org. Chem. 2008, 73, 9133–9136. [Google Scholar] [CrossRef]
  11. Jeon, J.-E.; Na, Z.; Jung, M.; Lee, H.-S.; Sim, C.J.; Nahm, K.; Oh, K.-B.; Shin, J. Discorhabdins from the Korean marine sponge Sceptrella sp. J. Nat. Prod. 2010, 73, 258–262. [Google Scholar] [CrossRef]
  12. Li, J.; Liu, J.-K.; Wang, W.-X. GIAO 13C NMR calculation with sorted training sets improves accuracy and reliability for structural assignation. J. Org. Chem. 2020, 85, 11350–11358. [Google Scholar] [CrossRef] [PubMed]
  13. Zanardi, M.M.; Sarotti, A.M. Sensitivity analysis of DP4+ with the probability distribution terms: Development of a universal and customizable method. J. Org. Chem. 2021, 86, 8544–8548. [Google Scholar] [CrossRef] [PubMed]
  14. Geller, J.; Meyer, C.; Parker, M.; Hawk, H. Redesign of PCR primers for mitochondrial cytochrome c oxidase subunit I for marine invertebrates and application in all-taxa biotic surveys. Mol. Ecol. Resour. 2013, 13, 851–861. [Google Scholar] [CrossRef] [PubMed]
  15. Trifinopoulos, J.; Nguyen, L.-T.; von Haeseler, A.; Minh, B.Q. W-IQ-TREE: A fast online phylogenetic tool for maximum likelihood analysis. Nucleic Acids Res. 2016, 44, W232–W235. [Google Scholar] [CrossRef]
  16. Kalyaanamoorthy, S.; Minh, B.Q.; Wong, T.K.F.; von Haeseler, A.; Jermiin, L.S. ModelFinder: Fast model selection for accurate phylogenetic estimates. Nat. Methods 2017, 14, 587–589. [Google Scholar] [CrossRef]
  17. Zhang, C.; Idelbayev, Y.; Roberts, N.; Tao, Y.; Nannapaneni, Y.; Duggan, B.M.; Min, J.; Lin, E.C.; Gerwick, E.C.; Cottrell, G.W.; et al. Small Molecule Accurate Recognition Technology (SMART) to enhance natural products research. Sci. Rep. 2017, 7, 14243. [Google Scholar] [CrossRef]
  18. Izsák, R.; Neese, F. An overlap fitted chain of spheres exchange method. J. Phys. Chem. 2011, 135, 144105. [Google Scholar] [CrossRef]
  19. Izsák, R.; Hansen, A.; Neese, F. The resolution of identity and chain of spheres approximations for the LPNO-CCSD singles Fock term. Mol. Phys. 2012, 110, 2413–2417. [Google Scholar] [CrossRef]
  20. Neese, F. The ORCA program system. WIREs Comput. Mol. Sci. 2012, 2, 73–78. [Google Scholar] [CrossRef]
  21. Izsák, R.; Neese, F.; Klopper, W. Robust fitting techniques in the chain of spheres approximation to the Fock exchange: The role of the complementary space. J. Chem. Phys. 2013, 139, 094111. [Google Scholar] [CrossRef]
  22. Neese, F. Software update: The ORCA program system, version 4.0. WIREs Comput. Mol. Sci. 2018, 8, e1327. [Google Scholar] [CrossRef]
  23. Neese, F.; Wennmohs, F.; Becker, U.; Riplinger, C. The ORCA quantum chemistry program package. J. Chem. Phys. 2020, 152, 224108. [Google Scholar] [CrossRef]
Disclaimer/Publisher’s Note: The statements, opinions and data contained in all publications are solely those of the individual author(s) and contributor(s) and not of MDPI and/or the editor(s). MDPI and/or the editor(s) disclaim responsibility for any injury to people or property resulting from any ideas, methods, instructions or products referred to in the content.

Article Metrics

Citations

Article Access Statistics

Multiple requests from the same IP address are counted as one view.