Abstract
Four new polyketides, namely furantides A–B (1–2), talamin E (3) and arugosinacid A (4), and two known polyketides were obtained from the mangrove-derived fungus Penicillium sp. HDN15-312 using the One Strain Many Compounds (OSMAC) strategy. Their chemical structures, including configurations, were elucidated by detailed analysis of extensive NMR spectra, HRESIMS and ECD. The DPPH radicals scavenging activity of 3, with an IC50 value of 6.79 µM, was better than vitamin C.
1. Introduction
ROS (reactive oxygen species) play a twofold role as both toxic and beneficial compounds to organism’s systems. At optimal concentrations, ROS contribute positively to a range of physiological functions. They are integral to maintaining cellular homeostasis through redox regulation, modulating cell signaling pathways, and bolstering immune responses. However, when ROS levels escalate, their reactivity can become detrimental, leading to a state of oxidative stress [1,2]. Excessive ROS accumulation causes oxidative damage to mitochondria, lipids, proteins, RNA, and DNA [3,4]. Furthermore, oxidative stress also plays a key role in mediating inflammation, cardiovascular diseases, and the development of multiple cancers [5,6,7,8,9]. Antioxidants function by inhibiting or delaying the oxidation of chemicals [10]. Antioxidants exert their protective effects through two principal modes of action: The initial mechanism is characterized by chain breaking, wherein primary antioxidants sacrifice an electron to neutralize free radicals. The subsequent mechanism involves the intervention of secondary antioxidants, which eliminate the reactive species initiators by deactivating the catalysts that trigger the chain reaction [3]. At present, the antioxidants on the market can be divided into synthetic antioxidants (such as BHA, BHT, PG, etc.) and natural antioxidants (such as tea polyphenols, phytic acid, etc.) according to their sources [11]. Most of the antioxidants from natural sources are derived from terrestrial plants; there are also some lead compounds of marine origin with antioxidant activity [10], but no marketed antioxidant from secondary metabolites of marine fungal origin.
Marine organisms have been proven to be rich sources of structurally novel and biologically active secondary metabolites [12,13,14]. In the ongoing process of our group’s research for natural products with excellent bioactivity from marine-derived microorganisms, mangrove-derived fungus Penicillium sp. HDN15-312 has piqued our interest. The OSMAC strategy was employed for cultivating Penicillium sp. HDN15-312, which led to producing compounds with significantly different UV absorption profiles in modified Fungus 2# liquid media under static conditions, compared to other conditions. Under the guidance of HPLC-UV and LC-MS, four new compounds (1–4) and two known compounds (5 and 6) were obtained (Figure 1). Compounds 1–6 were evaluated for scavenging activity against DPPH radicals. The DPPH radical scavenging activity of 3, with an IC50 value of 6.79 µM, was better than that of a natural antioxidant, vitamin C. Herein, we cover the isolation, structure elucidation, and DPPH scavenging activities of 1–6 from the mangrove-derived fungus Penicillium sp. HDN15-312.
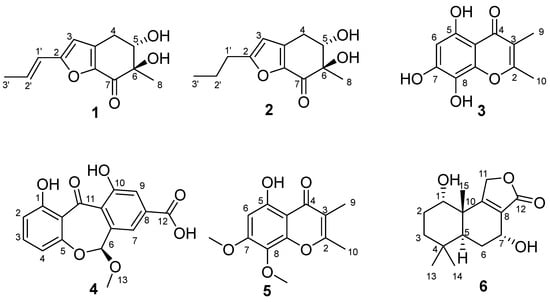
Figure 1.
Structures of the isolated compounds 1–6.
2. Results
The Penicillium sp. HDN15-312 was meticulously isolated from a mangrove forest sample collected in Sanya, Hainan. A comprehensive study of the metabolites produced by this fungal species was conducted across six distinct culture media. Notably, the ethyl acetate extract derived from Penicillium sp. HDN15-312, when cultured in the modified Fungus 2# liquid medium, exhibited markedly distinct UV absorption profiles. Following these intriguing findings, a large-scale fermentation process was initiated, utilizing the same modified Fungus 2# liquid medium to optimize the production of the desired metabolites. As a result, the ethyl acetate extract was fractionated by extensive column chromatography (silica gel, LH-20, and HPLC) to obtain four undescribed compounds, named furantides A–B (1–2), talamin E (3) and arugosinacid A (4) (Figure 1).
Furantide A (1) was isolated as a white solid. High-resolution electrospray ionization mass spectrometry (HRESIMS) data provided the molecular formula C12H14O4 determined from the negative ion peak at m/z 223.0965 [M + H]+ (calcd for C12H15O4, 223.0965), indicating six degrees of unsaturation. The data of the 1H NMR, 13C NMR, (Table 1) and HSQC spectra of 1 showed 12 carbon signals, including two methyls, one methylene, four methines, four quaternary carbons, and one carbonyl carbon (δC 188.7). The 1D NMR data of 1 (Table 1) were similar to aspergifuranone [15]. The difference was the replacement of a moiety of orsellinic acid at C-6 in aspergifuranone [15] by a hydroxyl group, which was supported by the NMR data (Figure 2) and a difference in molecular weight.

Table 1.
NMR data of 1 in CD3OD-d4 and 2 in DMSO-d6 (δ in ppm, 400 MHz for 1H and 100 MHz for 13C).
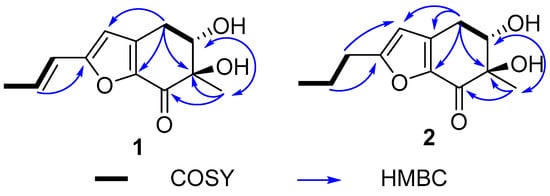
Figure 2.
The key HMBC and COSY correlations in 1–2.
The side chain in 1 was identified as trans-unsaturated according to coupling constant of H-2′ (J = 15.8). In the 1H NMR spectrum, H-5 (δH 4.01) showed ax/eq coupling (J = 5.2 Hz) to H-4a (δH 3.07) and ax/ax coupling (J = 9.2 Hz) to H-4b (δH 2.66). In the NOE spectrum, upon irradiation of H3-8 (δH 1.31), a pronounced increase in the signal intensity from H-4b was observed (Figure S8), which implied that the methyl group and H-4b were oriented in the same spatial direction. In order to provide additional confirmation, we performed computational analysis of the NMR data, thereby determining the relative configurations. There were two relative configurations, named 1a (5S*, 6R*) and 1b (5S*, 6S*), theoretically. The two possible relative configurations of 1 were calculated by employing Time-Dependent Density Functional Theory (TDDFT) at the B3LYP/6-31+G(d)//B3LYP/6-311+G (d, p) levels. The result showed that 1a (5S*, 6R*) represented a striking predominance (100% probability). (Table 2 and Figure S8) The absolute configuration of 1 was identified by ECD calculations at the B3LYP/6-31+G(d) level. Analysis of the ECD curve of 1 permitted us to come to the conclusion that the negative Cotton effect around 217 nm and positive Cotton effect around 298 nm indicated the 5S and 6R absolute configuration of 1 (Figure 3).

Table 2.
DP4+ computational analysis of the relative configurations of 1 and 2.
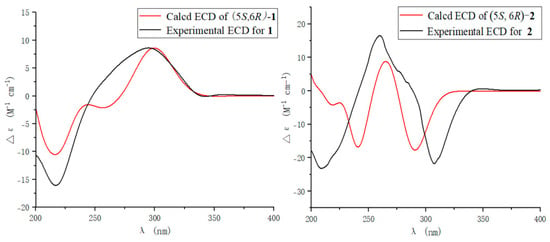
Figure 3.
ECD spectra of 1 and 2.
Furantide B (2) was isolated as a white solid. HRESIMS data provided the molecular formula C12H16O4, determined from the positive ion peak at m/z 225.1124 [M + H]+ (calcd for C12H17O4, 225.1121). NMR analysis revealed that the trans-unsaturated side chain double bonds (δC 133.6, 120.3) present in compound 1 were reduced to alkanes (δC 20.5, 29.6) in compound 2. And, the absolute configuration of 2 was also the same as 1, which was determined by calculating NMR data and ECD (Table 2, Figure 3 and Figure S16).
Talamin E (3) was isolated as a pale yellow powder with the molecular formula of C11H10O5 on the basis of HRESIMS data at m/z 223.0595 [M + H]+ (calcd for C11H11O5, 223.0601), indicating seven degrees of unsaturation. The 1H and 13C NMR data (Table 3) showed two singlet methyls, eight olefinic carbons (δC 99.2, 104.2, 115.2, 125.7, 146.7, 153.7, 154.9 and 164.6) and one carbonyl carbon (δC 183.5). Discreet analysis of the NMR data indicated that 3 and talamin B [16] (5) shared the same skeleton. The key distinction was the substitution of two methoxy groups at the C-7, C-8 position respectively in 5 with hydroxyl groups, which was corroborated by the absence of HSQC correlation for the methyl group and the molecular formula (Table 3 and Figure 4). Thus, compound 3 was determined as 5,7,8-dihydroxy-2,3-dimethylchromone, referred to as talamin E.

Table 3.
NMR data of compound 3 and 5 in CD3OD-d4 (δ in ppm, 400 MHz for 1H and 150 MHz for 13C).
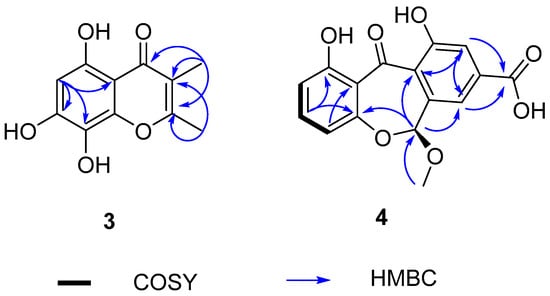
Figure 4.
The key HMBC correlations of 3 and 4.
Arugosinacid A (4), isolated as yellow powder, had a molecular formula of C16H12O7 from the negative ion peak at m/z [M − H]− 315.0505 (calcd for C16H11O7, 315.0501) in the HRESIMS spectrum, indicating 11 degrees of unsaturation. Analysis of 1H NMR, 13C NMR and HSQC data (Table 4 and Figure 4) revealed the presence of 16 carbons, including one methoxy group, twelve aromatic carbons, one methine carbon, and two possible carbonyl carbons (δC 194.8, 166.2), which shared a similar skeletal structure with arugosin K [17]. The differences were the absence of isopentenyl at C-2 supported by HSQC correlation from H-2 (δH 6.67) to C-2 (δC 110.5) and 1H-1H COSY of H-2 to H-3 (δH 7.50), along with the replacement of methyl at C-8 (δC 134.8) by a carboxyl group (δC 166.2), which was manifested in HMBC correlation from H-7 (δH 7.60) and H-9 (δH 7.56) to C-12 (δC 166.2). Based on these findings, the planar structure was successfully elucidated. It can be known from the literature [18] that the planar structure of this compound has appeared in an article on synthesis, but the stereostructure has not been characterized.

Table 4.
NMR data of compound 4 in DMSO-d6 (δ in ppm, 400 MHz for 1H and 150 MHz for 13C).
To further determine the absolute configuration of 4, the optimized conformations of (6S)-4 were obtained at the B3LYP/6-31+G(d) level and used for ECD calculations. The agreement of the experimental and calculated ECD curves (Figure 5) indicated the 6S absolute configuration of 4.
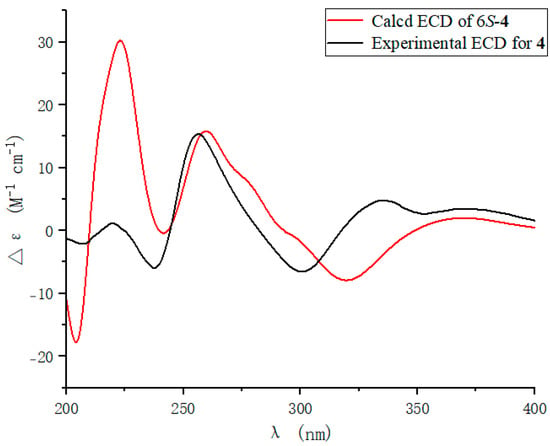
Figure 5.
ECD spectra of 4.
Compound 5 was isolated as a pale yellow powder. The 1H and 13C NMR data (Table 3) showed two singlet methyls (δC 9.1, 18.5), two methoxy groups (δC 56.9, 61.8), eight olefinic carbons (δC 96.3, 104.8, 115.7, 129.6, 150.7, 158.5, 159.6, 165.0) and one carbonyl carbon (δC 183.5). Upon careful analysis of the 1H NMR, 13C NMR, and HMBC spectrum (Table 3 and Table S1 and Figures S36–S39), it was found that compound 5 was identical to the known talamin B [16]. Therefore, compound 5 was identified as talamin B.
Compound 6 was isolated as a white solid and was identified astalaminoid C [19] through meticulous comparison of its physical and spectroscopic characteristics with those documented in the existing literature (Table S2, Figures S40 and S41).
Compounds 1–6 were evaluated for 2,2-diphenyl-1-picrylhydrazyl (DPPH) radical eliminating activity. Consequently, 3, 4, and 6 had DPPH radical eliminating activities, with IC50 values of 6.79 to 56.92 µM (Table 5). Among them, 3 displayed significantly better values than those of the positive control Vitamin C (IC50 = 12.15 µM). Analysis of compounds 3 and 5 shows that the hydroxyl group is the basis for antioxidant activity, and the hydroxyl group at position C-8 of 3 may be essential for bioactivity.

Table 5.
DPPH radical scavenging activity of compounds 1–6 (IC50, µM).
3. Materials and Methods
3.1. General Experimental Procedures
The HRESIMS data were measured on a Thermo Scientific LTQ Orbitrap XL mass spectrometer (Thermo Fisher Scientific, Waltham, MA, USA). UV spectra were recorded on a Hitachi 5430 spectrophotometer (Hitachi Ltd., Tokyo, Japan). NMR spectra were collected on Bruker AVANCE NEO 400 MHz spectrometer and JEOL JNM-ECZ600R/S1 spectrometer with tetramethylsilane (TMS) as an internal standard. Column chromatography (CC) was performed with silica gel (300–400 mesh, Qingdao Marine Chemical Inc., Qingdao, China) and Sephadex LH-20 (Amersham Biosciences, Buckinghamshire, UK). MPLC was performed on a Waters 1526. HPLC spectra were recorded on a Hitachi Primaide HPLC using an ODS column (HPLC (YMC-Pack ODS-A, 10 × 250 mm, 5 µm, 3 mL/min)) (YMC Co., Ltd., NJ, USA).
3.2. Fungi Material and Fermentation
Penicillium sp. HDN15-312 (GenBank No.MK41874) was isolated from a sample of a mangrove forest in Sanya, Hainan. It was deposited at Key Laboratory of Marine Drugs, the Ministry of Education of China, School of Medicine and Pharmacy, Ocean University of China, Qingdao, People’s Republic of China. This strain is a facultative anaerobe, producing an aerial mycelium that is beige to light yellow, a substrate mycelium that is green, and straight to curved hyphae with long, straight spore chains.
3.3. OSMAC Study, Fermentation, and Extraction
Based on the OSMAC strategy, six different liquid media, labeled as Fungus 2# liquid media (glucose 1%, maltose 2%, mannitol 2%, monosodium glutamate 1%, KH2PO4 0.05%, MgSO4·7H2O 0.03%, corn steep liquor 0.1% and yeast extract 0.3%, seawater), modified Fungus 2# liquid media (soluble starch 4%, yeast extract 0.1%, MgSO4·7H2O 0.03%, monosodium glutamate 0.2%, sucrose 4%, KH2PO4 0.05%, maltose 3%, soybean flour 0.05%, peptone 0.2%, seawater), SDA liquid media (peptone 1%, NaCl 0.5%, glucose 4%, freshwater), oligotrophic liquid media (soluble starch 1%, peptone 0.1%, seawater), PDB liquid media (glucose 20 g/L, potato extract 200 g/L, seawater), and glycerol liquid media (glycerin 2%, peptone 0.2%, yeast powder 0.4%, seawater) were utilized to culture the strain HDN15-312 under static or shaking conditions. The products of the strain HDN15-312 cultured in modified Fungus 2# liquid media under static conditions were different from the products under other conditions. Therefore, the modified Fungus 2# liquid media under static conditions was selected as the optimal condition for large-scale fermentation. The fungus was cultured in 1000 mL Erlenmeyer flasks, each containing 300 mL of modified Fungus 2# liquid media, at 28 °C for 30 days after adjusting its pH to 6.5 in natural seawater (collected from JiaoZhou Bay, Qingdao, China). A total of 15 L of broth was extracted using EtOAc (3 × 15 L) to obtain an extract weighing 50 g.
3.4. Isolation and Purification of Compounds
The crude extract was applied over a VLC column and eluted with mixtures of Petroleum ether-EtOAc to give nine fractions (Fr.1–Fr.9). Fr.2–Fr.5 were combined as Fr.A, which was separated by MPLC using an ODS column to obtain ten subfractions (Fr.A.1–Fr.A.10). Fr.A.6 was purified by semi-preparative HPLC to obtain 1 (3 mg, tR = 15 min) and 2 (2 mg, tR = 16 min). Fr.A.7 was purified by semi-preparative HPLC to obtain 3 (2.5 mg, tR = 11 min). Fr.6–Fr.8 were combined as Fr.B, which was separated by HPLC using an ODS column to obtain ten subfractions (Fr.B.1–Fr.B.8). Fr.B.6 was purified by semi-preparative HPLC to obtain 4 (3 mg, tR = 15 min) and 5 (5 mg, tR = 19 min). Fr.B.3 was purified by semi-preparative HPLC to obtain 6 (3 mg, tR = 11 min).
Furantide A (1): pale yellow powder, +45.6 (c 0.05 MeOH); UV (MeOH) λmax 217 (1.8), 322 (1.3) nm; IR (KBr) νmax 3298, 2932, 1671, 1446 cm−1; 1H and 13C NMR data, Table 1; HRESIMS m/z 223.0965 [M + H]+ (calcd for C12H15O4, 223.0965).
Furantide B (2): pale yellow powder, +81.4 (c 0.1 MeOH); UV (MeOH) λmax 206 (0.9), 234 (0.8), 297 (1.9) nm; IR (KBr) νmax 2967, 2873, 1671, 1528, 1447 cm−1; 1H and 13C NMR data, Table 1; HRESIMS m/z 225.1124 [M + H]+ (calcd for C12H17O4, 225.1121).
Talamin E (3): yellow powder, +56.2 (c 0.05 MeOH); UV (MeOH) λmax 226 (0.3), 260 (0.6), 344 (0.1) nm; IR (KBr) νmax 1655, 1576, 1523, 1436, 1198 cm−1; 1H and 13C NMR data, Table 2; HRESIMS m/z 223.0595 [M + H]+ (calcd for C11H11O5, 223.0601).
Arugosinacid A (4): yellow powder, −37.5 (c 0.05 MeOH); UV (MeOH) λmax 216 (0.5), 263 (0.4), 344 (0.1) nm; IR (KBr) νmax 3736.19, 2932.84, 1682.38, 1586.14, 1206.97 cm−1; 1H and 13C NMR data, Table 2; HRESIMS m/z 315.0505 [M − H]− (calcd for C16H11O7, 315.0501).
3.5. Computation Section
Conformational searches were conducted using Spartan’14 [20], based on the MMFF (Merck Molecular Force Field). Compounds 1, 2, and 4 were further optimized with DFT calculations at the B3LYP/6-31+G(d) level, utilizing the Gaussian 09 program [21]. TDDFT calculations were performed on the two lowest-energy conformations for 1 and 2 (>5% population). ECD spectra were gained using the SpecDis program [22] in conjunction with a Gaussian [21] band shape with 0.2 eV width for 1, 0.4 eV width for 2, and 0.1 eV width for 4 from dipole-length rotational strengths. The calculated spectra were shifted by −10 nm for 1, −20 nm for 2, +5 nm for 4 to facilitate comparison to the experimental data. We acknowledge the support of the High-Performance Biological Supercomputing Center at the Ocean University of China for this research.
3.6. Assay of DPPH Activity
Based on the method of Sharma [23], with some amendments, the eliminating activity against DPPH radicals was enforced. The compounds 1–6 and vitamin C were dissolved in absolute ethanol and diluted into 5 gradients. These were vortexed to mix well, protected from light at room temperature for 30 min, and the absorbance was read at 515 nm as a positive control.
The ability to scavenge the DPPH was calculated according to the equation:
DPPH free radical scavenging rate D VC% = [(Ablank − Acontrol) ÷ Ablank] × 100%
DPPH free radical scavenging rate D sample% = [[Ablank − (Asample − Acontrol)] ÷ Ablank] × 100%
Acontrol: the absorbance of the DPPH solution;
Ablank: the absorbance of ethanol.
4. Conclusions
In conclusion, four polyketides (1–4) were isolated and determined from Penicillium sp. HDN15-312, which was isolated from a sample of a mangrove forest in Egret Park in Sanya, Hainan. Compounds 1 and 2 stood as the unique pair of naturally occurring substances characterized by their distinctive 6-methyl-cyclohexanone-furan ring structure. The bioactivity screening showed that compounds 3, 4 and 6 showed potent DPPH radical scavenging capacities. The DPPH radicals scavenging activity of 3, with an IC50 value of 6.79 µM, was better than vitamin C. Our research highlights the potential for sifting and exploiting therapeutic molecules from marine fungi.
Supplementary Materials
The following supporting information can be downloaded at: https://www.mdpi.com/article/10.3390/md22080360/s1, Figure S1: OSMAC strategy for cultivating Penicillium sp. HDN15-312; Figure S2. HRESIMS spectrum of compound 1; Figure S3. 1H NMR (400 MHz, MeOD-d4) spectrum of compound 1; Figure S4. 13C NMR (100 MHz, MeOD-d4) of compound 1; Figure S5. COSY spectrum of compound 1; Figure S6. HSQC spectrum of compound 1; Figure S7. HMBC spectrum of compound 1; Figure S8. NOE spectrum of compound 1; Figure S9. DP4+ computational analysis the relative configurations of 1; Figure S10. UV spectrum of compound 1; Figure S11. IR spectrum of compound 1; Figure S12. HRESIMS spectrum of compound 2; Figure S13. 1H NMR (400 MHz, DMSO-d6) spectrum of compound 2; Figure S14. 13C NMR (100 MHz, DMSO-d6) of compound 2; Figure S15. COSY spectrum of compound 2; Figure S16. HSQC spectrum of compound 2; Figure S17. HMBC spectrum of compound 2; Figure S18. DP4+ computational analysis the relative configurations of 2; Figure S19. UV spectrum of compound 2; Figure S20. IR spectrum of compound 2; Figure S21. HRESIMS spectrum of compound 3; Figure S22. 1H NMR (400 MHz, MeOD-d4) spectrum of compound 3; Figure S23. 13C NMR (150 MHz, MeOD-d4) of compound 3; Figure S24. HSQC spectrum of compound 3; Figure S25. HMBC spectrum of compound 3; Figure S26. UV spectrum of compound 3; Figure S27. IR spectrum of compound 3; Figure S28. HRESIMS spectrum of compound 4; Figure S29. 1H NMR (400 MHz, DMSO-d6) spectrum of compound 4; Figure S30. 13C NMR (150 MHz, DMSO-d6) spectra of compound 4; Figure S31. COSY spectrum of compound 4; Figure S32. HSQC spectrum of compound 4; Figure S33. HMBC spectrum of compound 4; Figure S34. UV spectrum of compound 4; Figure S35. IR spectrum of compound 4; Figure S36. 1H NMR (400 MHz, MeOD-d4) spectrum of compound 5; Figure S37. 13C NMR (150 MHz, MeOD-d4) spectra of compound 5; Figure S38. 1H NMR (400 MHz, DMSO-d6) spectrum of compound 5; Figure S39. 13C NMR (100 MHz, DMSO-d6) spectra of compound 5; Figure S40. 1H NMR (400 MHz, MeOD-d4) spectrum of compound 6; Figure S41.13C NMR (100 MHz, MeOD-d4) spectra of compound 6. Table S1. The comparison of NMR data between compound 5 in DMSO-d6 and talamin B in DMSO-d6; Table S2. The comparison of NMR data between compound 6 in CD3OD-d4 and astalaminoid C in CDCl3-d.
Author Contributions
F.L. drafted the work and performed isolation and structural elucidation of the extract. W.W. also performed structural elucidation. F.L. and F.W. performed isolation and scale-up fermentation of the strain. Biological evaluations were performed by F.L., L.Z., G.L. and G.Z.; T.Z. provided the necessary strains and guidance on fermentation processes for the experiment. Q.C. provided guidance on structural analysis. D.L. designed the project and contributed to the critical reading of the manuscript. Q.C., T.Z. and D.L. checked the procedures of this work. All authors have read and agreed to the published version of the manuscript.
Funding
This work was supported by the National Key Research and Development Program of China (2022YFC2804400), the Hainan Provincial Joint Project of Sanya Yazhou Bay Science and Technology City (2021CXLH0012), the Fundamental Research Funds for the Central Universities (202362008), the Shandong Provincial Natural Science Foundation (ZR2021MH257).
Institutional Review Board Statement
Not applicable.
Informed Consent Statement
Not applicable.
Data Availability Statement
The data presented in this study are available in this article and Supplementary Material.
Conflicts of Interest
The authors declare no conflicts of interest.
References
- Phaniendra, A.; Jestadi, D.B.; Periyasamy, L. Free Radicals: Properties, Sources, Targets, and Their Implication in Various Diseases. India J. Clin. Biochem. 2015, 30, 11–26. [Google Scholar] [CrossRef] [PubMed]
- Ponist, S.; Zloh, M.; Bauerova, K.; Ponist, S.; Zloh, M.; Bauerova, K. Impact of Oxidative Stress on Inflammation in Rheumatoid and Adjuvant Arthritis: Damage to Lipids, Proteins, and Enzymatic Antioxidant Defense in Plasma and Different Tissues. Anim. Models Exp. Med. 2019, 8, 261. [Google Scholar] [CrossRef]
- Lobo, V.; Patil, A.; Phatak, A.; Chandra, N. Free Radicals, Antioxidants and Functional Foods: Impact on Human Health. Pharmacogn. Rev. 2010, 4, 118–126. [Google Scholar] [CrossRef] [PubMed]
- Stephenson, E.; Nathoo, N.; Mahjoub, Y.; Dunn, J.F.; Yong, V.W. Iron in Multiple Sclerosis: Roles in Neurodegeneration and Repair. Nat. Rev. Neurol. 2014, 10, 459–468. [Google Scholar] [CrossRef] [PubMed]
- Conti, V.; Izzo, V.; Corbi, G.; Russomanno, G.; Manzo, V.; De Lise, F.; Di Donato, A.; Filippelli, A. Antioxidant Supplementation in the Treatment of Aging-Associated Diseases. Front. Pharmacol. 2016, 7, 24. [Google Scholar] [CrossRef] [PubMed]
- Chaudhary, P.; Janmeda, P.; Docea, A.O.; Yeskaliyeva, B.; Abdull Razis, A.F.; Modu, B.; Calina, D.; Sharifi-Rad, J. Oxidative Stress, Free Radicals and Antioxidants: Potential Crosstalk in the Pathophysiology of Human Diseases. Front. Chem. 2023, 11, 1158198. [Google Scholar] [CrossRef] [PubMed]
- Valavanidis, A.; Vlachogianni, T.; Fiotakis, K.; Loridas, S. Pulmonary Oxidative Stress, Inflammation and Cancer: Respirable Particulate Matter, Fibrous Dusts and Ozone as Major Causes of Lung Carcinogenesis through Reactive Oxygen Species Mechanisms. Int. J. Environ. Res. Public Health 2013, 10, 3886–3907. [Google Scholar] [CrossRef] [PubMed]
- Kim, S.-J.; Cheresh, P.; Jablonski, R.P.; Williams, D.B.; Kamp, D.W. The Role of Mitochondrial DNA in Mediating Alveolar Epithelial Cell Apoptosis and Pulmonary Fibrosis. Int. J. Mol. Sci. 2015, 16, 21486–21519. [Google Scholar] [CrossRef] [PubMed]
- Coughlin, S.S. Oxidative Stress, Antioxidants, Physical Activity, and the Prevention of Breast Cancer Initiation and Progression. J. Environ. Health Sci. 2018, 4, 55–57. [Google Scholar] [CrossRef] [PubMed]
- Rahaman, M.M.; Hossain, R.; Herrera-Bravo, J.; Islam, M.T.; Atolani, O.; Adeyemi, O.S.; Owolodun, O.A.; Kambizi, L.; Daştan, S.D.; Calina, D.; et al. Natural Antioxidants from Some Fruits, Seeds, Foods, Natural Products, and Associated Health Benefits: An Update. Food Sci. Nutr. 2023, 11, 1657–1670. [Google Scholar] [CrossRef] [PubMed]
- Reiter, R.J.; Tan, D.X.; Rosales-Corral, S.; Galano, A.; Zhou, X.J.; Xu, B. Mitochondria: Central Organelles for Melatonin’s Antioxidant and Anti-Aging Actions. Molecules 2018, 23, 509. [Google Scholar] [CrossRef] [PubMed]
- Sun, C.; Jiang, Y.; Li, C.; Sun, S.; Lin, J.; Wang, W.; Zhou, L.; Li, L.; Shah, M.; Che, Q.; et al. Discovery, Total Synthesis, and Anti-inflammatory Evaluation of Naturally Occurring Naphthopyrone-Macrolide Hybrids as Potent NLRP3 Inflammasome Inhibitors. Angew. Chem. Int. Ed. 2024, 4, e202405860. [Google Scholar] [CrossRef]
- Zhang, K.; Liu, J.; Jiang, Y.; Sun, S.; Wang, R.; Sun, J.; Ma, C.; Chen, Y.; Wang, W.; Hou, X.; et al. Sorbremnoids A and B: NLRP3 Inflammasome Inhibitors Discovered from Spatially Restricted Crosstalk of Biosynthetic Pathways. J. Am. Chem. Soc. 2024, 146, 18172–18183. [Google Scholar] [CrossRef] [PubMed]
- Wu, J.; Wang, W.; Yang, Y.; Shah, M.; Peng, J.; Zhou, L.; Zhang, G.; Che, Q.; Li, J.; Zhu, T.; et al. Phenylhydrazone Alkaloids from the Deep-Sea Cold Seep Derived Fungus Talaromyces Amestolkiae HDN21-0307. J. Nat. Prod. 2024, 87, 1407–1415. [Google Scholar] [CrossRef] [PubMed]
- Liu, Y.; Chen, S.; Liu, Z.; Lu, Y.; Xia, G.; Liu, H.; He, L.; She, Z. Bioactive Metabolites from Mangrove Endophytic Fungus Aspergillus sp. 16-5B. Mar. Drugs 2015, 13, 3091–3102. [Google Scholar] [CrossRef]
- Song, Q.; Yang, S.-Q.; Li, X.-M.; Hu, X.-Y.; Li, X.; Wang, B.-G. Aromatic Polyketides from the Deep-Sea Cold-Seep Mussel Associated Endozoic Fungus Talaromyces Minioluteus CS-138. Mar. Drugs 2022, 20, 529. [Google Scholar] [CrossRef] [PubMed]
- Sun, T.; Kuang, R.; Chen, G.; Qin, S.; Wang, C.; Hu, D.; Wu, B.; Liu, X.; Yao, X.; Gao, H. Three Pairs of New Isopentenyl Dibenzo [b,e] Oxepinone Enantiomers from Talaromyces Flavus, a Wetland Soil-Derived Fungus. Molecules 2016, 21, 1184. [Google Scholar] [CrossRef] [PubMed]
- Hida, T.; Ishii, T.; Kanamaru, T.; Muroi, M. TAN-931, A Novel Nonsteroidal Aromatase Inhibitor produced by Penicillium Funiculosum No. 8974. J. Antibiot. 1991, 44, 601–612. [Google Scholar] [CrossRef][Green Version]
- Chang, D.; Zuo, W.; Mei, W.; Dai, H. Metabolites from endophytic fungus A12 of Dracaena cambodiana. J. Asian Nat. Prod. Res. 2012, 14, 577–580. [Google Scholar] [CrossRef] [PubMed]
- Spartan’14; Wavefunction Inc.: Irvine, CA, USA, 2013.
- Bruhn, T.; Hemberger, Y.; Schaumlöffel, A.; Bringmann, G. SpecDis, Version 1.53; University of Wuerzburg: Wuerzburg, Germany, 2011. [Google Scholar]
- Frisch, M.J.; Trucks, G.W.; Schlegel, H.B.; Scuseria, G.E.; Robb, M.A.; Cheeseman, J.R.; Scalmani, G.; Barone, V.; Mennucci, B.; Petersson, G.A.; et al. Gaussian 09, Revision A.1; Gaussian, Inc.: Wallingford, CT, USA, 2009. [Google Scholar]
- Sharma, O.P.; Bhat, T.K. DPPH antioxidant assay revisited. Food Chem. 2009, 113, 1202–1205. [Google Scholar] [CrossRef]
Disclaimer/Publisher’s Note: The statements, opinions and data contained in all publications are solely those of the individual author(s) and contributor(s) and not of MDPI and/or the editor(s). MDPI and/or the editor(s) disclaim responsibility for any injury to people or property resulting from any ideas, methods, instructions or products referred to in the content. |
© 2024 by the authors. Licensee MDPI, Basel, Switzerland. This article is an open access article distributed under the terms and conditions of the Creative Commons Attribution (CC BY) license (https://creativecommons.org/licenses/by/4.0/).