
Enhancement of Biomass Production of Diatom Nitzschia sp. S5 through Optimisation of Growth Medium Composition and Fed-Batch Cultivation

 ,
, 

Abstract
1. Introduction
2. Results and Discussion
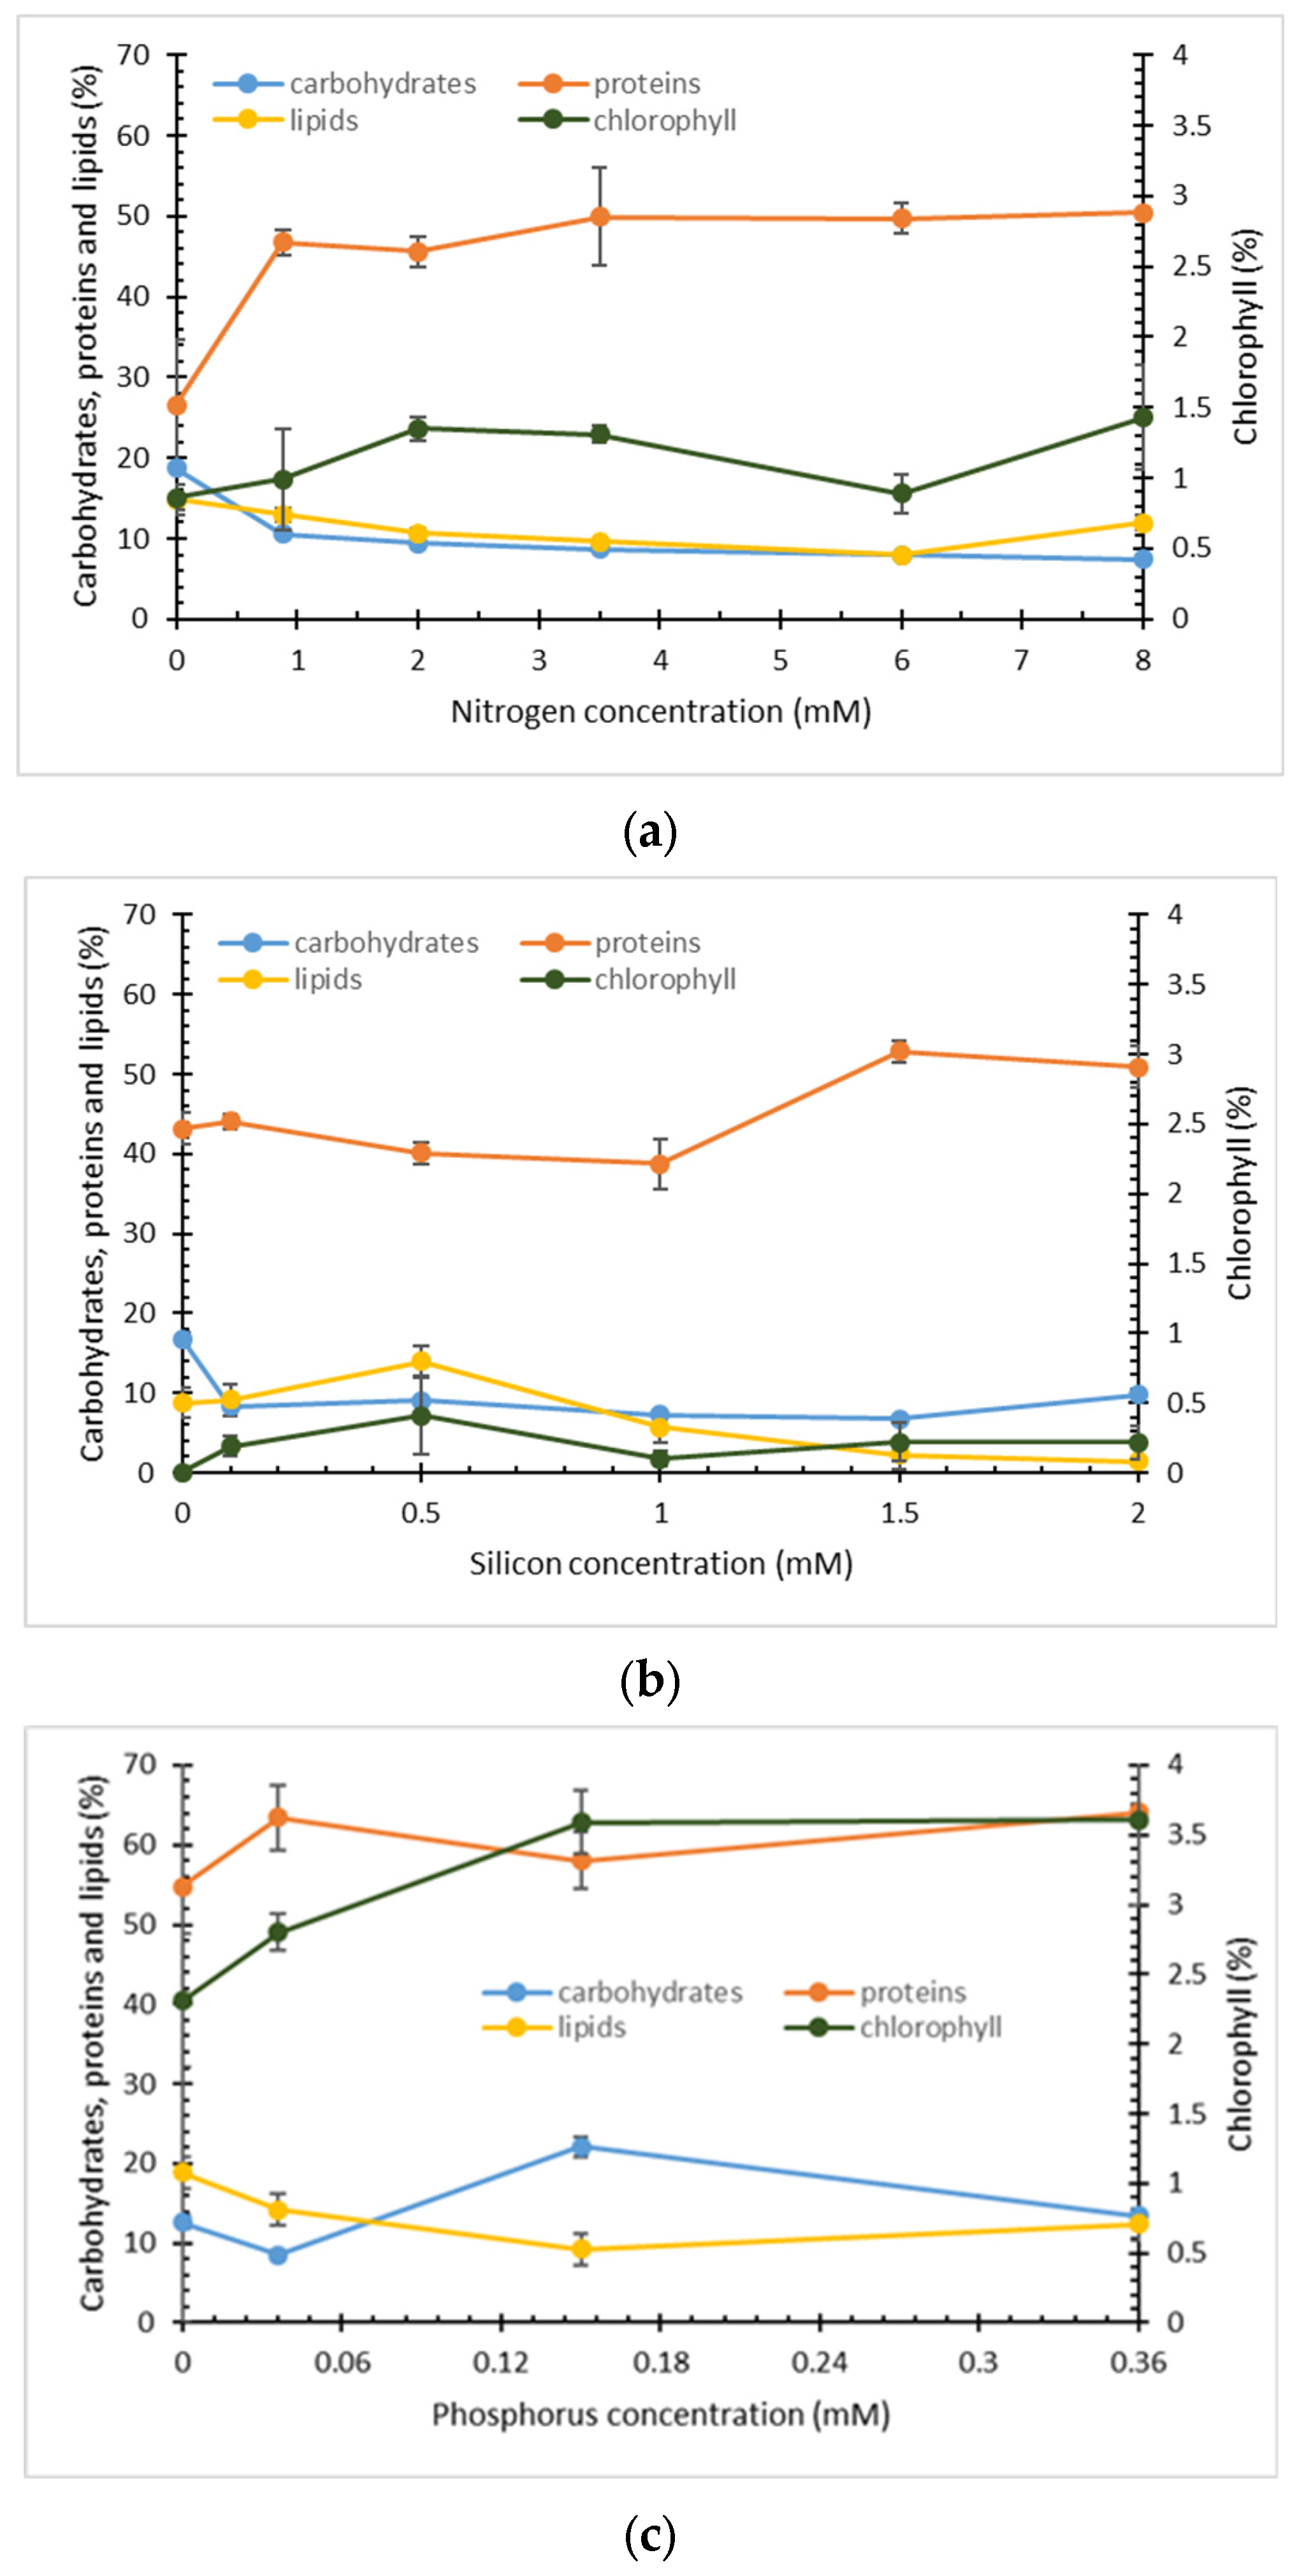
2.1. Effect of Nitrogen, Phosphorus, and Silicon Concentration on Growth and Biomass Composition
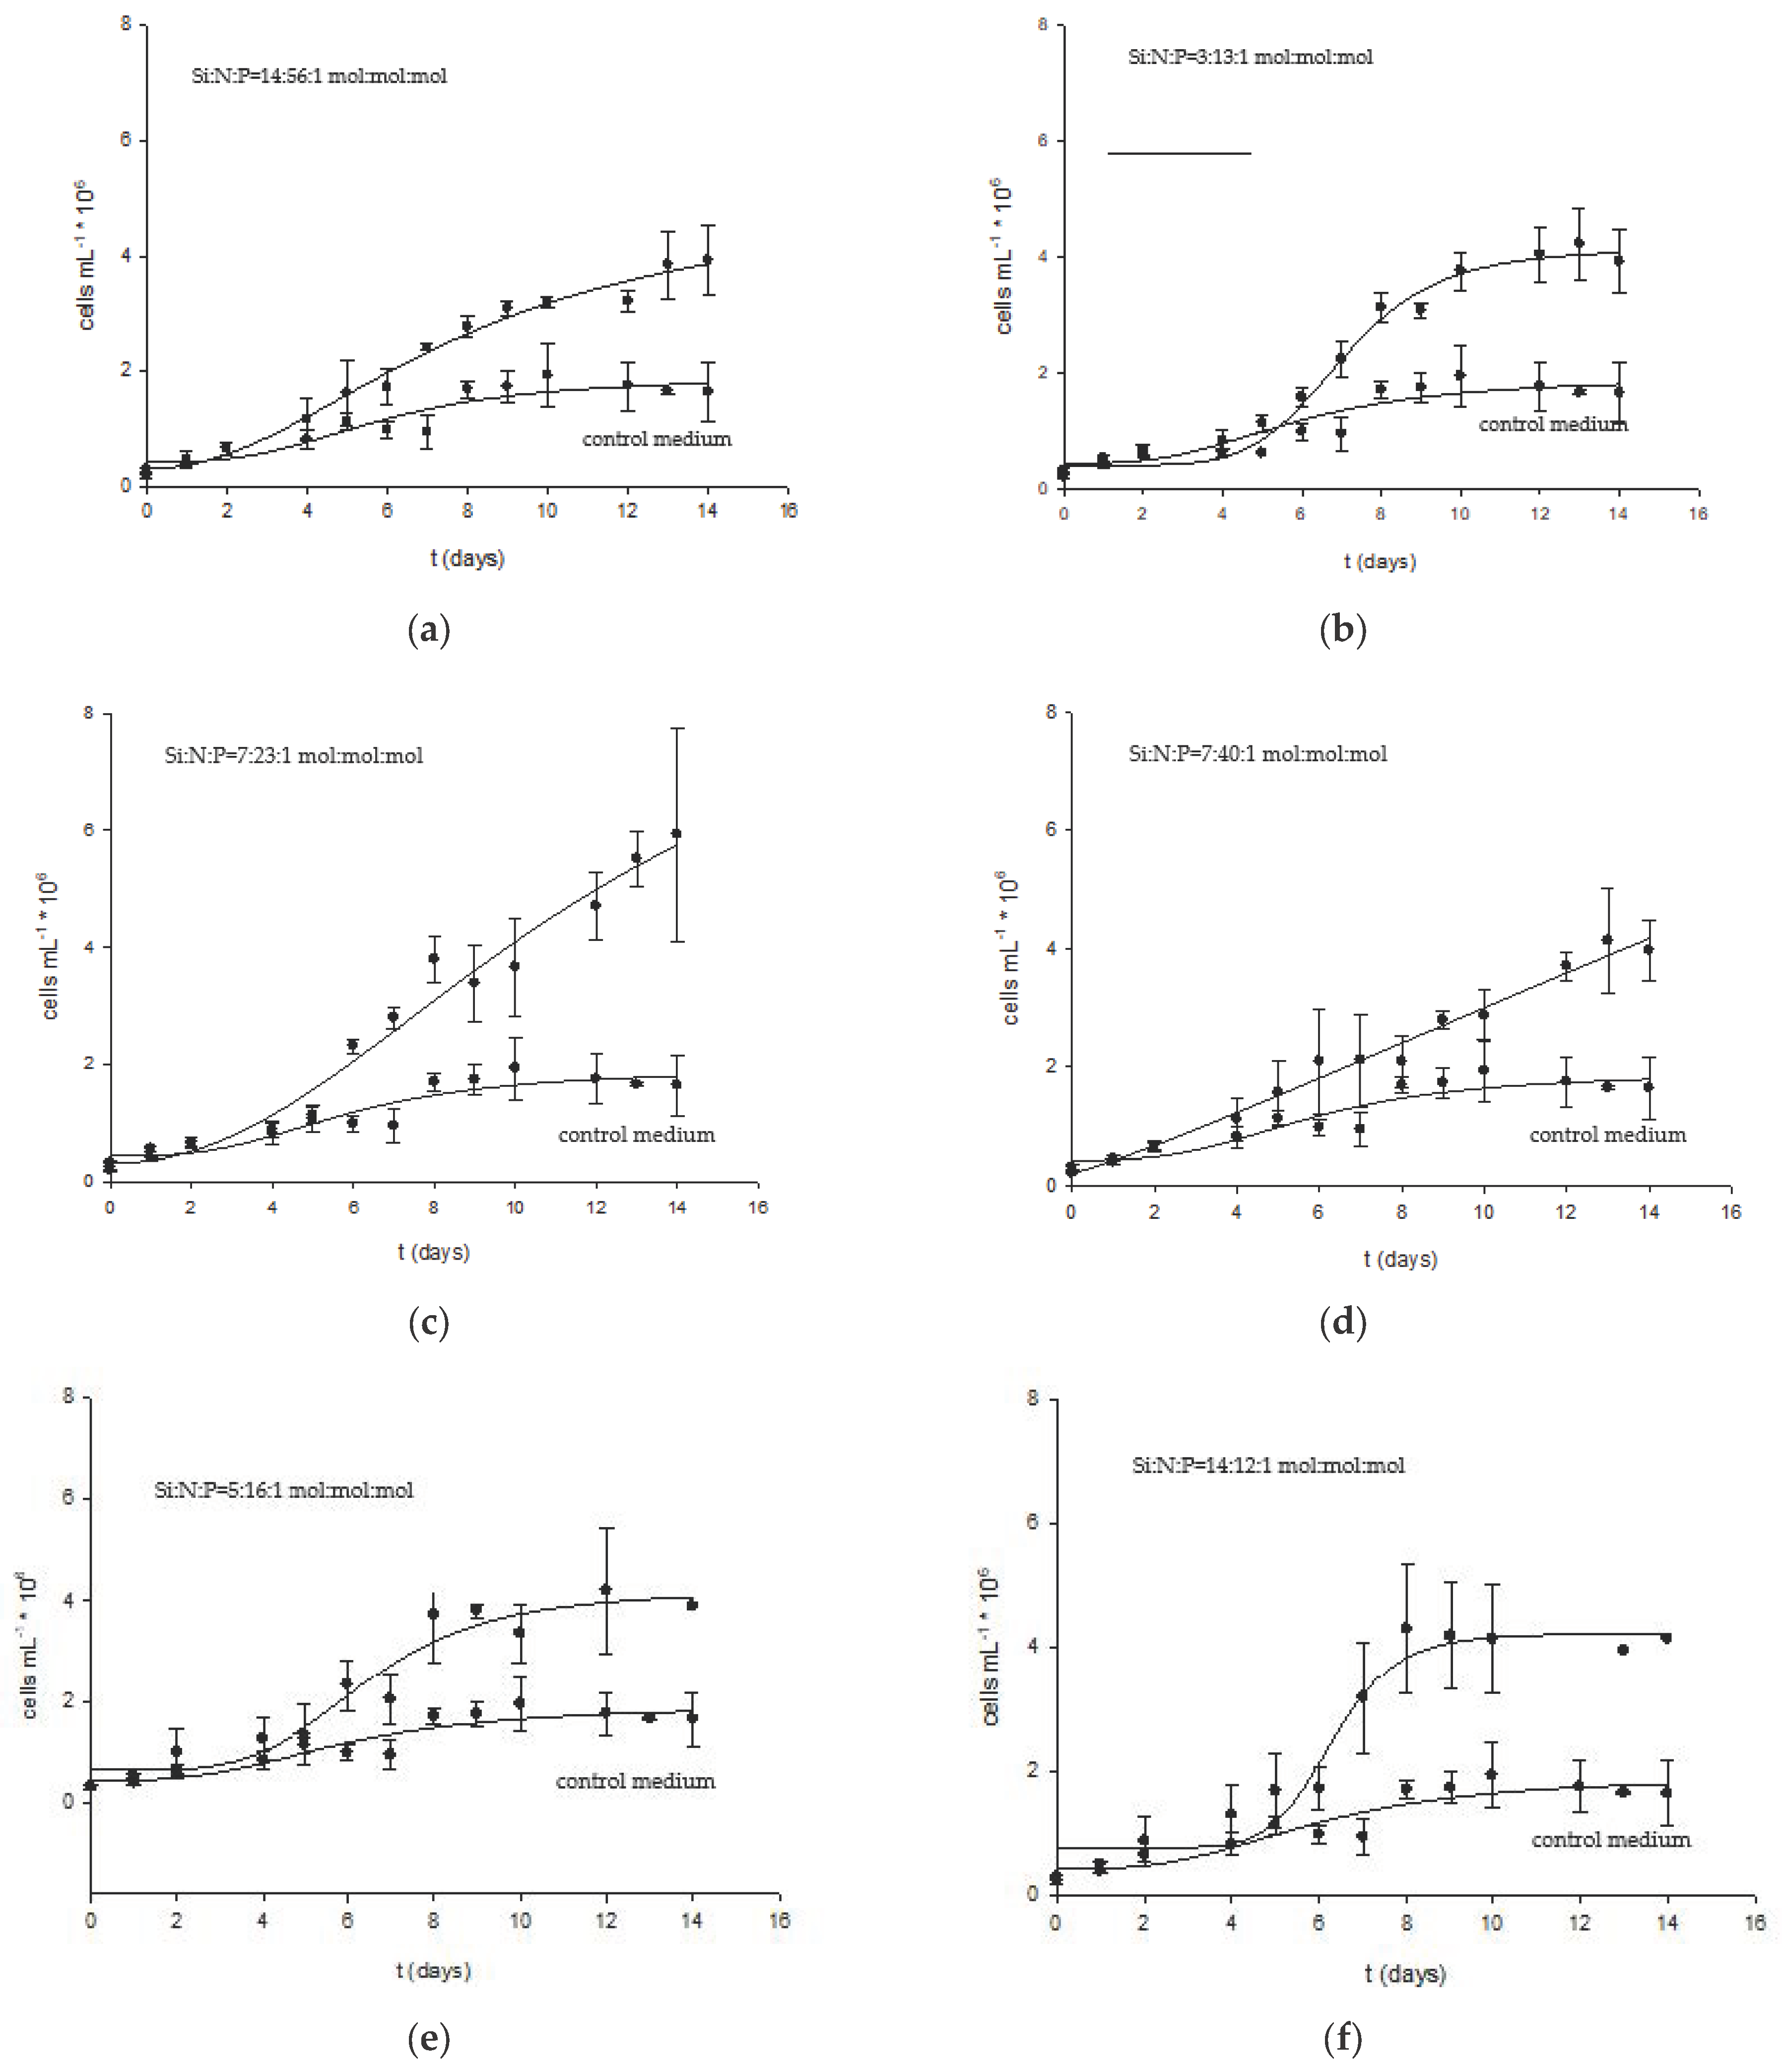
2.2. Effect of Nitrogen, Silicon, and Phosphorus Molar Ratios on Growth and Composition of Biomass
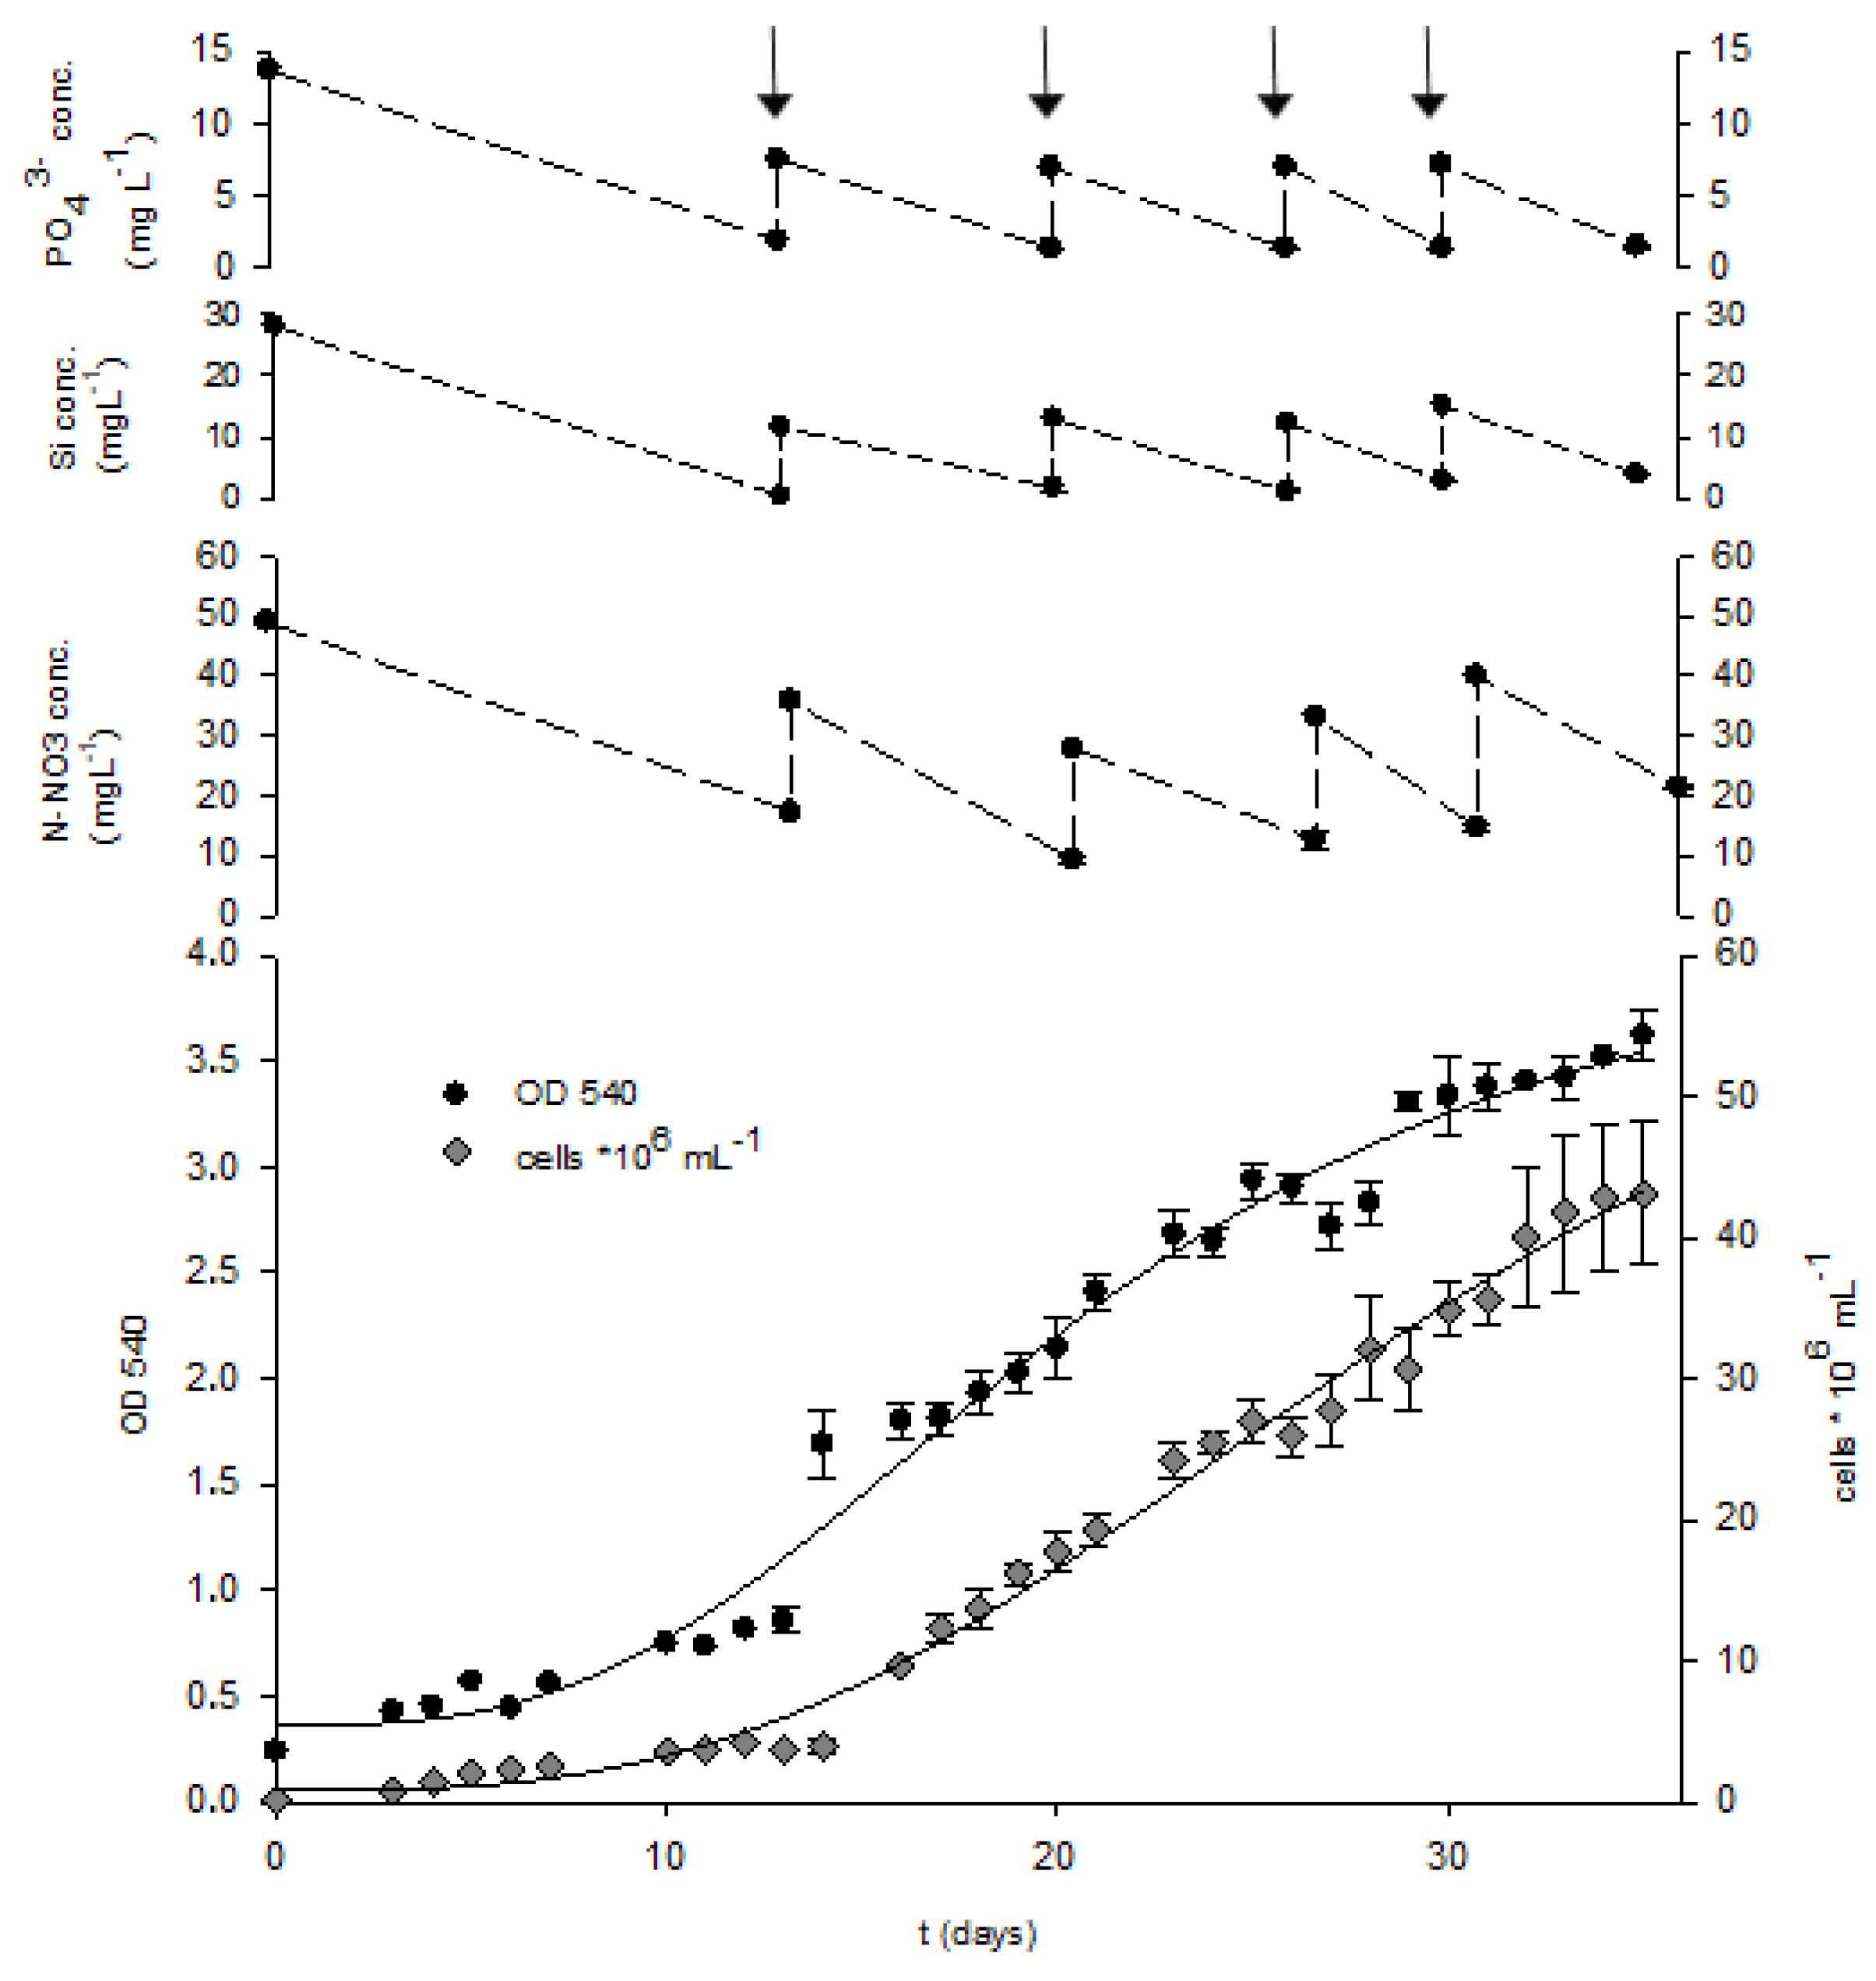
2.3. Fed-Batch Cultivation
3. Materials and Methods
3.1. Microalgae
3.2. Growth Media Preparation and Cultivation Conditions
3.3. Optimisation of Growth Medium for High Biomass Productivity
- -
- Nitrogen: 0 mM (negative control), 0.88 mM (concentration in original f/2 medium), 2 mM, 3.5 mM, 6 mM, and 8 mM;
- -
- Silicon: 0 mM (negative control), 0.1 mM (concentration in original f/2 medium), 0.5 mM, 1 mM, 1.5 mM, and 2 mM;
- -
- Phosphorus: 0 mM (negative control), 0.1 mM (concentration in original f/2 medium), 0.5 mM, 1 mM, 1.5 mM, and 2 mM.
3.4. Growth Parameters
3.5. Determination of Silicate, Nitrate, and Phosphate Concentration
3.6. Biomass Composition
3.6.1. Carbohydrate Content
3.6.2. Total Protein Content
3.6.3. Lipid Content and Fatty Acid Composition
3.6.4. Pigment Content
3.7. Bioprocess Efficiency Parameters
3.8. Statistical Analysis
4. Conclusions
Supplementary Materials
Author Contributions
Funding
Institutional Review Board Statement
Data Availability Statement
Acknowledgments
Conflicts of Interest
References
- Mann, D.G.; Vanormelingen, P. An Inordinate Fondness? The Number, Distributions, and Origins of Diatom Species. J. Eukaryot. Microbiol. 2013, 60, 414–420. [Google Scholar] [CrossRef] [PubMed]
- Botte, P.; Ippolito, G. Combined Exploitation of CO2 and Nutrient Replenishment for Increasing Biomass and Lipid Productivity of the Marine Diatoms Thalassiosira Weissflogii and Cyclotella Cryptica. J. Appl. Phycol. 2017, 30, 243–251. [Google Scholar] [CrossRef]
- Yi, Z.; Xu, M.; Di, X.; Brynjolfsson, S.; Fu, W. Exploring Valuable Lipids in Diatoms. Front. Mar. Sci. 2017, 4, 1–10. [Google Scholar] [CrossRef]
- Nieri, P.; Carpi, S.; Esposito, R.; Costantini, M.; Zupo, V. Bioactive Molecules from Marine Diatoms and Their Value for the Nutraceutical Industry. Nutrients 2023, 15, 464. [Google Scholar] [CrossRef] [PubMed]
- Picardo, M.C.; Luiz, J.; Medeiros, D.; De Queiroz, O.; Araújo, F.; Moreira, R. Effects of CO2 Enrichment and Nutrients Supply Intermittency on Batch Cultures of Isochrysis Galbana. Bioresour. Technol. 2013, 143, 242–250. [Google Scholar] [CrossRef] [PubMed]
- Wang, J.K.; Seibert, M. Biotechnology for Biofuels Prospects for Commercial Production of Diatoms. Biotechnol. Biofuels 2017, 10, 16. [Google Scholar] [CrossRef] [PubMed]
- Jeffryes, C.; Rosenberger, J.; Rorrer, G.L. Fed-Batch Cultivation and Bioprocess Modeling of Cyclotella sp. for Enhanced Fatty Acid Production by Controlled Silicon Limitation. Algal Res. 2013, 2, 16–27. [Google Scholar] [CrossRef]
- Novoveská, L.; Nielsen, S.L.; Eroldoğan, O.T.; Haznedaroglu, B.Z.; Rinkevich, B.; Fazi, S.; Robbens, J.; Vasquez, M.; Einarsson, H. Overview and Challenges of Large-Scale Cultivation of Photosynthetic Microalgae and Cyanobacteria. Mar. Drugs 2023, 21, 445. [Google Scholar] [CrossRef]
- Paul, A.; Krishna, A.; Wayne, K.; Ho, S. Continuous Cultivation of Microalgae in Photobioreactors as a Source of Renewable Energy: Current Status and Future Challenges. Renew. Sustain. Energy Rev. 2022, 154, 111852. [Google Scholar] [CrossRef]
- Lari, Z.; Moradi-kheibari, N.; Ahmadzadeh, H. Bioprocess Engineering of Microalgae to Optimise Lipid Production through Nutrient Management. J. Appl. Phycol. 2016, 28, 3235–3250. [Google Scholar] [CrossRef]
- Baines, S.B.; Twining, B.S.; Vogt, S.; Balch, W.M.; Fisher, N.S.; Nelson, D.M. Elemental Composition of Equatorial Pacific Diatoms Exposed to Additions of Silicic Acid and Iron. Deep Sea Res. Part II 2011, 58, 512–523. [Google Scholar] [CrossRef]
- Tantanasarit, C.; Englande, A.J.; Babel, S. Nitrogen, Phosphorus and Silicon Uptake Kinetics by Marine Diatom Chaetoceros Calcitrans under High Nutrient Concentrations. J. Exp. Mar. Biol. Ecol. 2013, 446, 67–75. [Google Scholar] [CrossRef]
- Grubišić, M.; Šantek, B.; Zorić, Z.; Čošić, Z.; Vrana, I.; Gašparović, B.; Čož-Rakovac, R.; Ivančić Šantek, M. Bioprospecting of Microalgae Isolated from the Adriatic Sea: Characterisation of Biomass, Pigment, Lipid and Fatty Acid Composition, and Antioxidant and Antimicrobial Activity. Molecules 2022, 27, 1248. [Google Scholar] [CrossRef]
- Harrison, P.J.; Denman, K.L. Diel Periodicity of Nitrogen Uptake by Marine Phytoplankton Nitrate-Rich Environments. Limnol. Oceanogr. 1991, 36, 1689–1700. [Google Scholar] [CrossRef]
- Chisholm, S.W.; Morel, F.M.M.; Slocum, W.S. The Phasing and Distribution of Cell Division Cycles in Marine Diatoms. In Primary Productivity in the Sea; Falkowski, P.G., Ed.; Plenum Press: New York, NY, USA, 1980; pp. 281–300. [Google Scholar]
- Chisholm, S.W.; Stross, R.G. Phosphate Uptake Kinetics in Euglena Gracilis (Z)(Euglenophyceae) Grown in Light/Dark Cycles. II. Phased PO_4-P Cultures. J. Phycol. 1976, 12, 217–222. [Google Scholar] [CrossRef]
- Goering, J.J.; Nelson, D.M. Silicic Acid Uptake by Natural Populations of Marine Phytoplankton. Deep Sea Res. Oceanogr. Abstr. 1973, 20, 777–789. [Google Scholar] [CrossRef]
- Fields, M.W.; Hise, A.; Lohman, E.J.; Bell, T.; Gardner, R.D.; Corredor, L.; Moll, K.; Peyton, B.M.; Characklis, G.W.; Gerlach, R. Sources and Resources: Importance of Nutrients, Resource Allocation, and Ecology in Microalgal Cultivation for Lipid Accumulation. Appl. Microbiol. Biotechnol. 2014, 98, 4805–4816. [Google Scholar] [CrossRef]
- Valenzuela, J.; Carlson, R.P.; Gerlach, R.; Cooksey, K. Nutrient Resupplementation Arrests Bio-Oil Accumulation in Phaeodactylum Tricornutum. Appl. Microbiol. Biotechnol. 2013, 97, 7049–7059. [Google Scholar] [CrossRef]
- Yang, M.; Zhao, W.; Xie, X. Effects of Nitrogen, Phosphorus, Iron and Silicon on Growth of Five Species of Marine Benthic Diatoms. Acta Ecol. Sin. 2017, 34, 311–319. [Google Scholar] [CrossRef]
- Ozkan, A.; Rorrer, G.L. Lipid and Chitin Nanofiber Production during Cultivation of the Marine Diatom Cyclotella sp. to High Cell Density with Multistage Addition of Silicon and Nitrate. J. Appl. Phycol. 2017, 29, 1811–1818. [Google Scholar] [CrossRef]
- Zurano, A.S.; Serrano, C.G.; Fernández, F.G.A.; Sevilla, J.M.F.; Grima, E.M. Modelling of Photosynthesis, Respiration, and Nutrient Yield Coefficients in Scenedemus almeriensis Culture as a Function of Nitrogen and Phosphorus. Appl. Microbiol. Biotechnol. 2021, 105, 7487–7503. [Google Scholar] [CrossRef] [PubMed]
- Hwa, S.; Christopher, J.; Cornelia, M.; Alexander, R.; Giovanni, J.; Antonio, L.; Buchholz, R.; Lindenberger, C. A New Approach for Calculating Microalgae Culture Growth Based on an Inhibitory Effect of the Surrounding Biomass. Bioprocess Biosyst. Eng. 2021, 44, 1671–1684. [Google Scholar] [CrossRef]
- Darvehei, P.; Bahri, P.A.; Moheimani, N.R. Model Development for the Growth of Microalgae: A Review. Renew. Sustain. Energy Rev. 2018, 97, 233–258. [Google Scholar] [CrossRef]
- Hildebrand, M.; Davis, A.K.; Smith, S.R.; Traller, J.C. The Place of Diatoms in the Biofuels Industry. Biofuels 2014, 3, 221–240. [Google Scholar] [CrossRef]
- John, E.H.; Flynn, K.J. Modelling Phosphate Transport and Assimilation in Microalgae; How Much Complexity Is Warranted? Ecol. Modell. 2000, 125, 145–157. [Google Scholar] [CrossRef]
- Eixler, S.; Karsten, U.; Selig, U. Phosphorus Storage in Chlorella Vulgaris (Trebouxiophyceae, Chlorophyta) Cells and Its Dependence on Phosphate Supply. Phycologia 2006, 45, 53–60. [Google Scholar] [CrossRef]
- Lemesle, V.; Mailleret, L. A Mechanistic Investigation of the Algae Growth “Droop” Model. Acta Biotheor. 2008, 56, 87–102. [Google Scholar] [CrossRef]
- Droop, M.R. Vitamin B12 and Marine Ecology. IV. The Kinetics of Uptake, Growth and Inhibition in Monochrysis Lutheri. J. Mar. Biol. Assoc. U. K. 1968, 48, 689–733. [Google Scholar] [CrossRef]
- Thamatrakoln, K.; Hildebrand, M. Kinetics and the Role of Silicon Transporters. Plant Physiol. 2008, 146, 1397–1407. [Google Scholar] [CrossRef]
- Metsoviti, M.N.; Katsoulas, N.; Karapanagiotidis, T.; Papapolymerou, G. Effect of Nitrogen Concentration, Two-Stage and Prolonged Cultivation on Growth Rate, Lipid and Protein Content of Chlorella Vulgaris. J. Chem. Technol. Biotechnol. 2019, 94, 1466–1473. [Google Scholar] [CrossRef]
- Martinez, M.E.; Jimnez, J.M.; Yousfi, F.E. Influence of Phosphorus Concentration and Temperature on Growth and Phosphorus Uptake by the Microalga Scenedesmus Obliquus. Bioresour. Technol. 1999, 67, 233–240. [Google Scholar] [CrossRef]
- Li, Q.; Fu, L.; Wang, Y.; Zhou, D.; Rittmann, B.E. Excessive Phosphorus Caused Inhibition and Cell Damage during Heterotrophic Growth of Chlorella Regularis. Bioresour. Technol. 2018, 268, 266–270. [Google Scholar] [CrossRef] [PubMed]
- Lovio-Fragoso, J.P.; Hayano-kanashiro, C.; López-elías, J.A. Effect of Different Phosphorus Concentrations on Growth and Biochemical Composition of Chaetoceros Muelleri. Lat. Am. J. Aquat. Res. 2019, 47, 361–366. [Google Scholar] [CrossRef]
- Lopes, R.G.; Cella, H.; Joaquim, J.; Maria, M.; Freire, R.; Terra, A.; Nelson, S.; Antoniosi, R.; Roberto, F.; Derner, B.; et al. Effect of Phosphorus and Growth Phases on the Transcription Levels of EPA Biosynthesis Genes in the Diatom Phaeodactylum Tricornutum. Braz. J. Bot. 2019, 14, 13–22. [Google Scholar] [CrossRef]
- Moll, K.M.; Gardner, R.D.; Eustance, E.O.; Gerlach, R.; Peyton, B.M. Combining Multiple Nutrient Stresses and Bicarbonate Addition to Promote Lipid Accumulation in the Diatom RGd-1. Algal Res. 2014, 5, 7–15. [Google Scholar] [CrossRef][Green Version]
- Creswell, L. Phytoplankton Culture for Aquaculture Feed. South. Reg. Aquac. Cent. 2010, 5004, 1–16. [Google Scholar]
- Arora, N.; Patel, A.; Pruthi, P.A.; Pruthi, V. Synergistic Dynamics of Nitrogen and Phosphorous Influences Lipid Productivity in Chlorella Minutissima for Biodiesel Production. Bioresour. Technol. 2016, 213, 79–87. [Google Scholar] [CrossRef]
- Alipanah, L.; Winge, P.; Rohloff, J.; Najafi, J.; Brembu, T.; Bones, A.M. Molecular Adaptations to Phosphorus Deprivation and Comparison with Nitrogen Deprivation Responses in the Diatom Phaeodactylum Tricornutum. PLoS ONE 2018, 13, e0193335. [Google Scholar] [CrossRef]
- Singh, P.; Guldhe, A.; Kumari, S.; Rawat, I.; Bux, F. Investigation of Combined Effect of Nitrogen, Phosphorus and Iron on Lipid Productivity of Microalgae Ankistrodesmus Falcatus KJ671624 Using Response Surface Methodology. Biochem. Eng. J. 2015, 94, 22–29. [Google Scholar] [CrossRef]
- Cointet, E.; Wielgosz-Collin, G.; Bougaran, G.; Rabesaotra, V.; Gonçalves, O.; Méléder, V. Effects of Light and Nitrogen Availability on Photosynthetic Efficiency and Fatty Acid Content of Three Original Benthic Diatom Strains. PLoS ONE 2019, 14, e0224701. [Google Scholar] [CrossRef]
- Fabregas, J.; Toribio, L.; Abalde, J.; Cabezas, B.; Herrero, C. Approach to Biomass Production of the Marine Microalga Tetraselmis Suecica (Kylin) Butch Using Common Garden Fertilizer and Soil Extract as Cheap Nutrient Supply in Batch Cultures. Aquac. Eng. 1987, 6, 141–150. [Google Scholar] [CrossRef]
- Xie, T.; Xia, Y.; Zeng, Y.; Li, X.; Zhang, Y. Nitrate Concentration-Shift Cultivation to Enhance Protein Content of Heterotrophic Microalga Chlorella Vulgaris: Over-Compensation Strategy. Bioresour. Technol. 2017, 233, 247–255. [Google Scholar] [CrossRef] [PubMed]
- Pancha, I.; Chokshi, K.; George, B.; Ghosh, T.; Paliwal, C.; Maurya, R.; Mishra, S. Nitrogen Stress Triggered Biochemical and Morphological Changes in the Microalgae Scenedesmus sp. CCNM 1077. Bioresour. Technol. 2014, 156, 146–154. [Google Scholar] [CrossRef]
- Van Mooy, B.A.S.; Fredricks, H.F.; Pedler, B.E.; Dyhrman, S.T.; Karl, D.M.; Lomas, M.W.; Mincer, T.J.; Moore, L.R.; Moutin, T.; Rappe, M.S.; et al. Phytoplankton in the Ocean Use Non-Phosphorus Lipids in Response to Phosphorus Scarcity. Nat. Lett. 2009, 458, 69–72. [Google Scholar] [CrossRef]
- Encinas-Aarzate, J.J.; Marquez-Ríos, E.; López-Elías, J.A.; Torres-Areola, W.; Huerta-Ocampo, J.Á.; Ramírez-Suárez, J.C. Effect of the Deficiency of Nitrate and Silicate on the Growth and Composition of the Benthic Diatom Navicula Incerta. Lat. Am. J. Aquat. Res. 2020, 48, 280–286. [Google Scholar] [CrossRef]
- Chu, W.; Phang, S.; Goh, S. Environmental Effects on Growth and Biochemical Composition of Nitzschia Inconspicua Grunow. J. Appl. Phycol. 1996, 8, 389–396. [Google Scholar] [CrossRef]
- Jiang, Y.; Nunez, M.; Laverty, K.S.; Quigg, A. Coupled Effect of Silicate and Nickel on the Growth and Lipid Production in the Diatom Nitzschia Perspicua. J. Appl. Phycol. 2015, 27, 1137–1148. [Google Scholar] [CrossRef]
- Liang, K.; Zhang, Q.; Gu, M.; Cong, W. Effect of Phosphorus on Lipid Accumulation in Freshwater Microalga Chlorella sp. J. Appl. Phycol. 2013, 25, 311–318. [Google Scholar] [CrossRef]
- Berdalet, E.; Latasa, M.; Estrada, M. Effects of Nitrogen and Phosphorus Starvation on Nucleic Acid and Protein Content of Heterocapsa sp. J. Plankton Res. 1994, 16, 303–316. [Google Scholar] [CrossRef][Green Version]
- Javad, M.; Farhadian, O.; Paykan, F.; Keramat, J. Effect of Nitrogen Concentration on the Growth Rate and Biochemical Composition of the Microalga, Isochrysis Galbana. Egypt. J. Aquat. Res. 2020, 46, 153–158. [Google Scholar] [CrossRef]
- Adams, C.; Bugbee, B. Enhancing Lipid Production of the Marine Diatom Chaetoceros Gracilis: Synergistic Interactions of Sodium Chloride and Silicon. J. Appl. Phycol. 2014, 26, 1351–1357. [Google Scholar] [CrossRef]
- Valenzuela, J.; Mazurie, A.; Carlson, R.P.; Gerlach, R.; Cooksey, K.E.; Peyton, B.M.; Fields, M.W. Potential Role of Multiple Carbon Fixation Pathways during Lipid Accumulation in Phaeodactylum tricornutum. Biotechnol. Biofuels 2012, 5, 40. [Google Scholar] [CrossRef] [PubMed]
- Sabu, S.; Singh, I.S.B.; Joseph, V. Optimisation of Critical Medium Components and Culture Conditions for Enhanced Biomass and Lipid Production in the Oleaginous Diatom Navicula Phyllepta: A Statistical Approach. Environ. Sci. Pollut. Res. 2017, 24, 26763–26777. [Google Scholar] [CrossRef]
- Roopnarain, A.; Gray, V.M.; Sym, S.D. Phosphorus Limitation and Starvation Effects on Cell Growth and Lipid Accumulation in Isochrysis Galbana U4 for Biodiesel Production. Bioresour. Technol. 2014, 156, 408–411. [Google Scholar] [CrossRef] [PubMed]
- Lin, Q.; Hao, W.; Xin, Z.; Wang, W.; Ping, C.; Gao, Y.H.; Liang, J.R. Effects of Fundamental Nutrient Stresses on the Lipid Accumulation Profiles in Two Diatom Species Thalassiosira Weissflogii and Chaetoceros Muelleri. Bioprocess Biosyst. Eng. 2018, 41, 1213–1224. [Google Scholar] [CrossRef]
- Thajuddin, N.; Ilavarasi, A.; Baldev, E. Stress Induced Lipids Accumulation in Naviculoid Marine Diatoms for Bioenergy Stress Induced Lipids Accumulation in Naviculoid Marine Diatoms for Bioenergy Application. Int. J. Biotechnol. Wellness Ind. 2015, 4, 18–24. [Google Scholar] [CrossRef]
- Cheng, J.; Feng, J.; Sun, J.; Huang, Y.; Zhou, J.; Cen, K. Enhancing the Lipid Content of the Diatom Nitzschia sp. by Irradiation Mutation and High-Salinity Domestication. Energy 2014, 78, 9–15. [Google Scholar] [CrossRef]
- Lovio-Fragoso, J.P.; De Jes, D.; Antonio, L.; Luis, Á.; Fimbres-Olivarr, D.; Hayano-Kanashiro, C. Biochemical and Molecular Aspects of Phosphorus Limitation in Diatoms and Their Relationship with Biomolecule Accumulation. Biology 2021, 10, 565. [Google Scholar] [CrossRef]
- Brembu, T.; Mu, A.; Alipanah, L.; Bones, A.M. The Effects of Phosphorus Limitation on Carbon Metabolism in Diatoms. Philos. Trans. B 2017, 372, 20160406. [Google Scholar] [CrossRef]
- Zhang, L.; Liu, J. Bioresource Technology Enhanced Fatty Acid Accumulation in Isochrysis Galbana by Inhibition of the Mitochondrial Alternative Oxidase Pathway under Nitrogen Deprivation. Bioresour. Technol. 2016, 211, 783–786. [Google Scholar] [CrossRef]
- Wen, Z.; Chen, F. Production Potential of Eicosapentaenoic Acid by the Diatom Nitzschia Laevis. Biotechnol. Lett. 2000, 22, 727–733. [Google Scholar] [CrossRef]
- Viso, A.C.; Marty, J.C. Fatty Acids from 28 Marine Microalgae. Phytochemistry 1993, 34, 1521–1533. [Google Scholar] [CrossRef]
- Chen, G.; Jiang, Y.; Chen, F. Fatty Acid and Lipid Class Composition of the Eicosapentaenoic Acid-Producing Microalga, Nitzschia Laevis. Food Chem. 2007, 104, 1580–1585. [Google Scholar] [CrossRef]
- Sahin, M.S.; Khazi, M.I.; Demirel, Z.; Dalay, M.C. Variation in Growth, Fucoxanthin, Fatty Acids Profile and Lipid Content of Marine Diatoms Nitzschia sp. and Nanofrustulum shiloi in Response to Nitrogen and Iron. Biocatal. Agric. Biotechnol. 2019, 17, 390–398. [Google Scholar] [CrossRef]
- Qiao, H.; Cong, C.; Sun, C.; Li, B.; Wang, J.; Zhang, L. Effect of Culture Conditions on Growth, Fatty Acid Composition and DHA/EPA Ratio of Phaeodactylum Tricornutum. Aquaculture 2016, 452, 311–317. [Google Scholar] [CrossRef]
- Zulu, N.N.; Zienkiewicz, K.; Vollheyde, K.; Feussner, I. Current Trends to Comprehend Lipid Metabolism in Diatoms. Prog. Lipid Res. 2018, 70, 1–16. [Google Scholar] [CrossRef]
- Tachihana, S.; Nagao, N.; Katayama, T.; Hirahara, M. High Productivity of Eicosapentaenoic Acid and Fucoxanthin by a Marine Diatom Chaetoceros Gracilis in a Semi-Continuous Culture. Front. Bioeng. bioetchnology 2020, 8, 602721. [Google Scholar] [CrossRef]
- Li, H.; Cheng, K.; Wong, C. Food Chemistry Evaluation of Antioxidant Capacity and Total Phenolic Content of Different Fractions of Selected Microalgae. Food Chem. 2007, 102, 771–776. [Google Scholar] [CrossRef]
- Vítová, M.; Bišová, K.; Kawano, S.; Zachleder, V. Accumulation of Energy Reserves in Algae: From Cell Cycles to Biotechnological Applications. Biotechnol. Adv. 2015, 33, 1204–1218. [Google Scholar] [CrossRef]
- Mortensen, L.M.; Gislerød, H.R. The Growth of Chlorella Sorokiniana as Influenced by CO2, Light, and Flue Gases. J. Appl. Phycol. 2015, 28, 813–820. [Google Scholar] [CrossRef]
- Sabu, S.; Sarojini, I.; Singh, B.; Joseph, V. Improved Lipid Production in Oleaginous Brackish Diatom Navicula Phyllepta MACC8 Using Two-Stage Cultivation Approach. 3 Biotech 2019, 9, 437. [Google Scholar] [CrossRef] [PubMed]
- Alipanah, L.; Rohloff, J.; Winge, P.; Bones, A.M.; Brembu, T. Whole-Cell Response to Nitrogen Deprivation in the Diatom Phaeodactylum tricornutum. J. Exp. Bot. 2015, 66, 6281–6296. [Google Scholar] [CrossRef] [PubMed]
- Duygu, D.Y. Determination of Growth Kinetics and Biochemical Composition of Nitzschia Palea (Kützing) W. Smith Isolated from Freshwater Sources in Turkey. J. Nat. Sci. 2019, 20, 63–70. [Google Scholar] [CrossRef]
- Redfield, A.C. The Biological Control of Chemical Factors in the Environment. Am. Sci. 1958, 46, 205–221. [Google Scholar]
- Li, X.; Marella, T.K.; Tao, L.; Li, R.; Tiwari, A.; Li, G. Optimization of Growth Conditions and Fatty Acid Analysis for Three Freshwater Diatom Isolates. Phycol. Res. 2017, 65, 177–187. [Google Scholar] [CrossRef]
- Kumaran, J.; Jose, B.; Joseph, V.; Sarojini, I.; Singh, B. Optimization of Growth Requirements of Marine Diatom Chaetoceros Muelleri Using Response Surface Methodology. Aquac. Res. 2017, 48, 1513–1524. [Google Scholar] [CrossRef]
- Geider, R.; La Roche, J. Redfield Revisited: Variability of C:N:P in Marine Microalgae and Its Biochemical Basis. Eur. J. Phycol. 2011, 37, 1–17. [Google Scholar] [CrossRef]
- Pimolrat, P.; Direkbusarakom, S.; Chinajariyawong, C.; Powtongsook, S. The Effect of Sodium Bicarbonate Concentrations on Growth and Biochemical Composition of Chaetoceros Gracilis Schutt. J. Fish. Environ. 2010, 34, 40–47. [Google Scholar]
- Rodríguez-Núñez, K.; Toledo-Aguero, P. Fatty Acids Profile and Nutritional Composition of Two Tropical Diatoms from the Costa Rican Pacific Coast. Grasas Y Aceites 2017, 68, e209–e220. [Google Scholar] [CrossRef]
- Morris, I.; Glover, H.E.I.; Yentsch, C.S. Products of Photosynthesis by Marine Phytoplankton: The Effect of Environmental Factors on the Relative Rates of Protein Synthesis. Mar. Biol. 1974, 27, 1–9. [Google Scholar] [CrossRef]
- Conover, S.A.M. Partitioning of Nitrogen and Carbon in Cultures of the Marine Diatom Thalassiosira Fluviatilis Supplied with Nitrate, Ammonium, or Urea. Mar. Biol. 1975, 32, 231–246. [Google Scholar] [CrossRef]
- Badour, S.S.; Gergis, M.S. Cell Division and Fat Accumulation in Nitzschia Sp. Grown in Continuously Illuminated Mass Cultures. Arch. Mikrobiol. 1965, 51, 94–102. [Google Scholar] [CrossRef]
- Handa, N. Carbohydrate Metabolism in the Marine Diatom. Mar. Biol. 1969, 4, 208–2014. [Google Scholar] [CrossRef]
- Millie, D.F. The Effects of Silica, Nitrogen, and Phosphorus Limitation on the Biochemical Composition of Cyclotella Meneghiniana Kütz: An Experimental Analysis. Ph.D. Thesis, Iowa State University, Ames, IA, USA, 1984. [Google Scholar]
- Pekkoh, J.; Phinyo, K.; Thurakit, T.; Lomakool, S.; Duangjan, K. Lipid Profile, Antioxidant and Antihypertensive Activity, and Computational Molecular Docking of Diatom Fatty Acids as ACE Inhibitors. Antioxydans 2022, 11, 186. [Google Scholar] [CrossRef] [PubMed]
- Maltsev, Y.; Maltseva, K. Fatty Acids of Microalgae: Diversity and Applications. Rev. Environ. Sci. Biotechnol. 2021, 20, 515–547. [Google Scholar] [CrossRef]
- Villegas-Méndez, M.Á.; Montañez, J.; Contreras-Esquivel, J.C.; Salmerón, I.; Koutinas, A.A.; Morales-Oyervides, L. Scale-up and Fed-Batch Cultivation Strategy for the Enhanced Co-Production of Microbial Lipids and Carotenoids Using Renewable Waste Feedstock. J. Environ. Manag. 2023, 339, 117866. [Google Scholar] [CrossRef]
- Moreira, J.B.; Terra, A.L.M.; da Costa, W.K.A.; Magnani, M.; de Morais, M.G.; Costa, J.A.V. Lactic Acid Production Using Microbial Bioreactors; Singh, S.P., Upadhyay, S.K., Eds.; John Wiley & Sons Ltd.: Hoboken, NJ, USA, 2023. [Google Scholar]
- Wu, Y.; Su, C.; Zhang, G.; Liao, Z.; Wen, J.; Wang, Y.; Jiang, Y.; Zhang, C.; Cai, D. High-Titer Bioethanol Production from Steam-Exploded Corn Stover Using an Engineering Saccharomyces Cerevisiae Strain with High Inhibitor Tolerance. Fermentation 2023, 9, 906. [Google Scholar] [CrossRef]
- Huerlimann, R.; De Nys, R.; Heimann, K. Growth, Lipid Content, Productivity, and Fatty Acid Composition of Tropical Microalgae for Scale-Up Production. Biotechnol. Bioeng. 2010, 107, 245–257. [Google Scholar] [CrossRef]
- Yodsuwan, N.; Sawayama, S. Effect of Nitrogen Concentration on Growth, Lipid Production and Fatty Acid pro Fi Les of the Marine Diatom Phaeodactylum Tricornutum. Agric. Nat. Resour. 2017, 51, 190–197. [Google Scholar] [CrossRef]
- Ghazala, B.; Shameel, M. Phytochemistry and Bioactivity of Some Freshwater Green Algae from Pakistan. Pharm. Biol. 2005, 43, 358–369. [Google Scholar] [CrossRef]
- Ying, L.; Kangsen, M.A.I. Effect of Growth Phase on the Fatty Acid Compositions of Four Species of Marine Diatoms. J. Ocean Univ. China Ocean. Coast. Sea Res. 2005, 4, 157–162. [Google Scholar] [CrossRef]
- Guil-Guerrero, J.L.; Navarro-Juárez, R.; López-Martınez, J.C.; Campra-Madrid, P.; Rebolloso-Fuentes, M. Functional Properties of the Biomass of Three Microalgal Species. J. Food Eng. 2004, 65, 511–517. [Google Scholar] [CrossRef]
- Van Wychen, S.; Laurens, L.M.L. Determination of Total Carbohydrates in Algal Biomass Laboratory Analytical Procedure (LAP); NREL/TP-5100-60957. 2015. Available online: https://www.osti.gov/biblio/1118073 (accessed on 10 November 2023).
- Van Wychen, S.; Ramirez, K.; Laurens, L.M.L. Determination of Total Lipids as Fatty Acid Methyl Esters (FAME) by In Situ Transesterification Laboratory Analytical Procedure (LAP); NREL/TP-5100-60958. 2015. Available online: https://www.osti.gov/biblio/1118085 (accessed on 10 November 2023).
- Jeffrey, S.T.; Humphrey, G.F. New Spectrophotometric Equations for Determining Chlorophylls a, b, C1 and C2 in Higher Plants, Algae and Natural Phytoplankton. Biochem. Physiol. Pflanz. 1975, 167, 191–194. [Google Scholar] [CrossRef]


| Nutrient | C (mM) | Si:N:P (mol:mol:mol) | X (g L−1) | µ (day −1) | Prx (mg L−1day−1) | PrL (mg L−1day−1) |
|---|---|---|---|---|---|---|
| N | 0 | 3:0:1 | 0.10 ± 0.01 | 0.22 ± 0.01 | 8.53 ± 0.99 | 1.26 ± 0.14 |
| 0.88 | 3:24:1 | 0.20 ± 0.04 | 0.24 ± 0.03 | 16.87 ± 2.98 | 2.18 ± 0.39 | |
| 2 | 56:3::1 | 0.24 ± 0.01 | 0.26 ± 0.02 | 20.02 ± 0.78 | 2.14 ± 0.08 | |
| 3.5 | 97:3:1 | 0.23 ± 0.04 | 0.32 ± 0.04 | 19.31 ± 3.26 | 1.86 ± 0.31 | |
| 6 | 167:3:1 | 0.23 ± 0.03 | 0.29 ± 0.01 | 19.05 ± 0.22 | 1.51 ± 0.02 | |
| 8 | 222:3:1 | 0.13 ± 0.06 | 0.21 ± 0.002 | 19.79 ± 4.84 | 2.36 ± 0.58 | |
| Si | 0 * | 0:24:1 | 0.05 ± 0.07 | 0.04 ± 0.02 | 3.85 ± 0.77 | /* |
| 0 | 0:24:1 | 0.09 ± 0.048 | 0.26 ± 0.009 | 7.97 ± 0.73 | 0.69 ± 0.06 | |
| 0.1 | 3:24:1 | 0.31 ± 0.04 | 0.25 ± 0.011 | 23.34 ± 1.06 | 2.13 ± 0.09 | |
| 0.5 | 14:24:1 | 0.38 ± 0.08 | 0.22 ± 0.02 | 29.51 ± 2.08 | 4.12 ± 0.29 | |
| 1 | 28:24:1 | 0.49 ± 0.09 | 0.35 ± 0.02 | 37.61 ± 2.92 | 2.13 ± 0.17 | |
| 1.5 | 42:24:1 | 0.26 ± 0.08 | 0.26 ± 0.01 | 20.11 ± 1.62 | 0.46 ± 0.04 | |
| 2 | 56:24:1 | 0.27 ± 0.02 | 0.19 ± 0.04 | 20.8 ± 0.58 | 0.29 ± 0.01 | |
| P | 0 | - | 0.101 ± 0.04 | 0.24 ± 0.03 | 8.43 ± 0.69 | 1.56 ± 0.27 |
| 0.036 | 3:24:1 | 0.34 ± 0.06 | 0.25 ± 0.06 | 28.50 ± 1.56 | 4.01 ± 0.38 | |
| 0.15 | 0.7:6:1 | 0.27 ± 0.09 | 0.10 ± 0.02 | 22.7 ± 2.00 | 2.08 ± 0.03 | |
| 0.36 | 0.3:2.4:1 | 0.25 ± 0.02 | 0.12 ± 0.01 | 20.85 ± 0.43 | 2.59 ± 0.18 |
| Fatty Acid | Nitrogen (mM) | |||||
|---|---|---|---|---|---|---|
| (%) | 0 | 0.88 | 2 | 3.5 | 6 | 8 |
| C14:0 | 10.76 ± 0.49 | 11.91 ± 0.22 | 12.41 ± 0.47 | 10.29 ± 0.21 | 9.40 ± 0.21 | 9.22 ± 0.15 |
| C16:0 | 28.75 ± 0.55 | 27.03 ± 0.75 | 28.00 ± 0.03 | 33.25 ± 0.58 | 36.58 ± 0.52 | 32.22 ± 0.98 |
| C16:1, cis 9 | 57.22 ± 0.95 | 56.09 ± 0.46 | 56.88 ± 1.34 | 53.16 ± 0.49 | 52.33 ± 0.23 | 53.06 ± 0.14 |
| C17:1, cis 10 | 0.96 ± 0.45 | 1.05 ± 0.29 | 1.02 ± 0.37 | 1.45 ± 0.34 | 0.42 ± 0.05 | 1.21 ± 0.37 |
| C20:5, cis 5,8,11,14,17 | 2.39 ± 1.08 | 2.92 ± 0.81 | 2.72 ± 1.62 | 2.28 ± 0.74 | 3.19 ± 0.66 | 3.51 ± 0.44 |
| C24:0 | n.d. | 0.53 ± 0.13 | n.d. | n.d. | 1.59 ± 0.18 | n.d. |
| C24:1, cis 15 | n.d. | 0.28 ± 0.07 | n.d. | 1.68 ± 0.28 | n.d. | n.d. |
| SFA | 39.76 ± 0.58 | 39.79 ± 1.11 | 40.63 ± 0.59 | 43.80 ± 0.81 | 46.21 ± 0.65 | 42.21 ± 0.67 |
| MUFA | 57.86 ± 0.50 | 57.21 ± 0.58 | 57.55 ± 1.02 | 53.93 ± 0.46 | 52.37 ± 0.21 | 54.27 ± 0.23 |
| PUFA | 2.39 ± 1.08 | 2.99 ± 0.77 | 1.81 ± 1.62 | 2.28 ± 0.74 | 1.42 ± 0.66 | 3.51 ± 0.44 |
| Fatty Acid | Silicon (mM) | |||||
| (%) | 0 | 0.1 | 0.5 | 1.0 | 1.5 | 2.0 |
| C14:0 | 12.46 ± 1.18 | 12.88 ± 0.99 | 9.92 ± 0.60 | 10.35 ± 0.28 | 12.79 ± 0.25 | 12.50 ± 0.93 |
| C16:0 | 26.73 ± 2.43 | 25.45 ± 1.11 | 30.94 ± 2.89 | 24.50 ± 1.03 | 16.10 ± 0.23 | 8.94 ± 2.75 |
| C16:1, cis 9 | 53.49 ± 3.22 | 57.11 ± 0.66 | 54.96 ± 1.42 | 60.35 ± 1.02 | 65.20 ± 0.43 | 66.75 ± 4.78 |
| C17:0 | 1.03 ± 0.65 | 0.69 ± 0.27 | 0.04 ± 0.04 | 2.91 ± 0.42 | 4.18 ± 0.43 | 6.24 ± 4.26 |
| C17:1, cis 10 | 0.29 ± 0.19 | 1.67 ± 0.85 | 0.98 ± 0.50 | 0.05 ± 0.05 | n.d. | n.d. |
| C18:0 | 0.46 ± 0.26 | n.d. | 1.10 ± 1.10 | 0.28 ± 0.27 | n.d. | n.d. |
| C18:1, cis 9 | n.d. | n.d. | n.d. | n.d. | n.d. | n.d. |
| C18:2, cis 9,12 | 1.26 ± 0.77 | 0.48 ± 0.24 | 0.55 ± 0.30 | 0.10 ± 0.06 | n.d. | 0.34 ± 0.33 |
| C20:5, cis 5,8,11,14,17 | 1.45 ± 0.90 | 0.82 ± 0.42 | 0.74 ± 0.37 | n.d. | n.d. | 0.37 ± 0.37 |
| C24:0 | n.d. | 0.15 ± 0.09 | 0.05 ± 0.03 | 0.74 ± 0.69 | 0.36 ± 0.31 | 2.74 ± 2.33 |
| C24:1, cis 15 | n.d. | n.d. | n.d. | n.d. | n.d. | n.d. |
| SFA | 41.21 ± 2.19 | 39.45 ± 1.63 | 42.64 ± 2.60 | 39.09 ± 0.93 | 34.33 ± 0.44 | 30.41 ± 3.58 |
| MUFA | 55.99 ± 3.15 | 59.24 ± 1.10 | 56.07 ± 1.99 | 60.81 ± 0.95 | 65.32 ± 0.45 | 68.42 ± 4.09 |
| PUFA | 2.79 ± 1.69 | 1.30 ± 0.66 | 1.29 ± 0.65 | 0.09 ± 0.06 | 0.36 ± 0.35 | 1.17 ± 0.89 |
| Fatty Acid | Phosphate (mM) | |||||
| (%) | 0 | 0.036 mM | 0.15 mM | 0.36 mM | ||
| C14:0 | 9.10 ± 1.34 | 10.41 ± 0.85 | 11.81 ± 0.08 | 11.44 ± 1.01 | ||
| C16:0 | 32.02 ± 4.13 | 24.57 ± 1.32 | 21.07 ± 0.69 | 22.98 ± 0.43 | ||
| C16:1, cis 9 | 53.27 ± 5.28 | 61.09 ± 1.95 | 63.15 ± 2.79 | 61.65 ± 1.05 | ||
| C17:1, cis 10 | 1.24 ± 0.36 | 1.41 ± 0.51 | 2.31 ± 1.32 | 2.68 ± 0.49 | ||
| C18:1, cis 9 | n.d. | 1.95 ± 1.95 | n.d. | n.d. | ||
| C20:5, cis 5,8,11,14,17 | 3.72 ± 0.43 | 1.26 ± 0.16 | 1.25 ± 0.71 | 1.71 ± 0.42 | ||
| SFA | 41.64 ± 5.94 | 35.82 ± 1.48 | 33.69 ± 1.32 | 35.08 ± 0.91 | ||
| MUFA | 54.64 ± 5.51 | 65.08 ± 0.49 | 66.26 ± 1.15 | 65.09 ± 1.07 | ||
| PUFA | 3.72 ± 0.43 | 1.26 ± 0.16 | 1.25 ± 0.71 | 1.71 ± 0.42 | ||
| Si:N:P (mol:mol:mol) | X (g L−1) | Carbohydrates (%) | Proteins (%) | Total Lipids (%) | µ (day−1) | Prx (mg L−1 day−1) | PrL (mg L−1 day−1) |
|---|---|---|---|---|---|---|---|
| 14:56:1 3:13:1 7:23:1 7:40:1 5:16:1 4:12:1 control | 0.51 ± 0.06 0.56 ± 0.12 0.73 ± 0.07 0.66 ± 0.02 0.53 ± 0.10 0.51 ± 0.11 0.28 ± 0.14 | 11.53 7.08 8.04 9.58 3.11 4.19 19.73 | 19.14 ± 0.77 21.48 ± 1.10 21.00 ± 2.87 14.13 ± 1.00 18.25 ± 3.91 13.67 ± 2.57 15.34 ± 1.5 | 5.57 ± 0.57 5.20 ± 0.40 2.48 ± 0.19 2.27 ± 0.18 2.16 ± 0.24 1.99 ± 0.10 7.76 ± 0.32 | 0.18 ± 0.02 0.13 ± 0.001 0.14 ± 0.01 0.18 ± 0.02 0.18 ± 0.04 0.29 ± 0.07 0.15 ± 0.03 | 36.34 ± 5.31 39.86 ± 3.84 52.04 ± 2.52 45.15 ± 2.18 35.01 ± 3.55 38.67 ± 3.05 19.74 ± 3.25 | 2.02 ± 0.51 2.07 ± 0.35 1.29 ± 0.11 1.03 ± 0.09 0.76 ± 0.13 0.77 ± 0.11 1.02 ± 0.92 |
| Fatty Acid | Si:N:P (mol:mol:mol) | ||||||
|---|---|---|---|---|---|---|---|
| (%) | Control | 14:56:1 | 3:13:1 | 7:23:1 | 7:40:1 | 5:16:1 | 4:12:1 |
| C14:0 | 10.60 ± 0.32 | 10.76 ± 0.42 | 14.40 ± 0.05 | 14.55 ± 0.79 | 14.97 ± 0.74 | 15.90 ± 0.35 | 16.04 ± 0.84 |
| C14:1, cis 9 | 0.66 ± 0.02 | 0.89 ± 0.12 | 1.21 ± 0.02 | 1.65 ± 0.12 | 1.20 ± 0.19 | 0.88 ± 0.15 | 0.58 ± 0.17 |
| C16:0 | 23.19 ± 0.26 | 17.84 ± 0.93 | 22.64 ± 0.19 | 15.98 ± 0.88 | 12.58 ± 1.99 | 10.75 ± 1.16 | 11.39 ± 3.58 |
| C16:1, cis 9 | 56.12 ± 0.14 | 53.67 ± 1.45 | 53.81 ± 0.59 | 47.74 ± 0.61 | 54.41 ± 3.47 | 52.51 ± 3.73 | 49.14 ± 3.16 |
| C17:0 | 1.06 ± 0.003 | 2.66 ± 0.423 | 2.93 ± 0.09 | 8.81 ± 1.17 | 8.30 ± 0.45 | 4.97 ± 1.08 | 3.45 ± 1.12 |
| C17:1, cis 10 | 4.75 ± 0.15 | 7.76 ± 0.39 | n.d. | 3.02 ± 1.03 | 1.15 ± 0.58 | 5.68 ± 2.66 | 7.85 ± 2.31 |
| C18:0 | n.d. | n.d. | n.d. | n.d. | n.d. | n.d. | 1.54 ± 1.54 |
| C18:1, cis 9 | n.d. | n.d. | n.d. | 0.61 ± 0.38 | n.d. | n.d. | 1.84 ± 1.84 |
| C20:5, cis 5, 8,11,14,17 | 3.48 ± 0.19 | 5.76 ± 1.07 | 3.97 ± 0.38 | 6.35 ± 0.79 | 5.20 ± 0.60 | 9.31 ± 2.88 | 9.42 ± 0.93 |
| C24:0 | n.d. | n.d. | n.d. | 1.04 ± 0.80 | 1.92 ± 1.92 | n.d. | 0.26 ± 0.26 |
| Total fatty acids | 7.76 ± 0.32 | 5.57 ± 0.57 | 5.20 ± 0.40 | 2.48 ± 0.19 | 2.27 ± 0.18 | 2.16 ± 0.24 | 1.99 ± 0.10 |
| SFA | 34.84 ± 0.06 | 31.26 ± 0.59 | 40.16 ± 0.27 | 40.38 ± 0.61 | 37.77 ± 2.43 | 31.61 ± 2.46 | 32.68 ± 4.66 |
| MUFA | 61.68 ± 0.13 | 62.98 ± 1.07 | 55.87 ± 0.44 | 53.28 ± 1.04 | 57.03 ± 2.85 | 59.08 ± 1.70 | 57.90 ± 3.82 |
| PUFA | 3.48 ± 0.19 | 5.76 ± 1.07 | 3.97 ± 0.38 | 6.35 ± 0.79 | 5.19 ± 0.60 | 9.31 ± 2.88 | 9.42 ± 0.93 |
| Time (day) | X (g L−1) | µ (day−1) | Prx (mg L−1 day−1) | PrL (mg L−1 day−1) | Lipids (%) | Proteins (%) | Carbohydrates (%) |
|---|---|---|---|---|---|---|---|
| 13 | 0.73 ± 0.04 | 0.12 ± 0.02 | 60.71 ± 4.41 | 1.28 ± 0.08 | 2.10 ± 0.06 | 11.41 ± 1.12 | 8.04 ± 0.85 |
| 20 | 1.03 ± 0.07 | 0.13 ± 0.01 | 49.14 ± 3.20 | 0.96 ± 0.06 | 1.94 ± 0.05 | 25.69 ± 1.85 | 14.50 ± 3.19 |
| 26 | 1.23 ± 0.04 | 0.10 ± 0.01 | 45.41 ± 1.46 | 1.05 ± 0.03 | 2.31 ± 0.17 | 28.64 ± 0.16 | 9.51 ± 0.79 |
| 30 | 1.46 ± 0.04 | 0.09 ± 0.03 | 48.57 ± 1.37 | 1.18 ± 0.03 | 2.42 ± 0.12 | 29.06 ± 0.15 | 12.92 ± 1.10 |
| 35 | 1.63 ± 0.05 | 0.08 ± 0.05 | 46.69 ± 0.57 | 1.06 ± 0.01 | 2.28 ± 0.11 | 28.05 ± 1.57 | 12.92 ± 1.07 |
| Fatty Acid | Time (day) | ||||
|---|---|---|---|---|---|
| (%) | 13 | 20 | 26 | 30 | 35 |
| C14:0 | 19.50 ± 2.24 | 10.16 ± 3.22 | 11.48 ± 2.86 | 9.84 ± 3.09 | 2.91 ± 2.62 |
| C14:1, cis 9 | 0.85 ± 0.02 | 1.39 ± 0.17 | 1.38 ± 0.15 | 1.53 ± 0.16 | 1.64 ± 0.6 |
| C16:0 | 11.46 ± 1.08 | 8.55 ± 1.67 | 8.21 ± 1.99 | 9.00 ± 1.49 | 11.38 ± 1.65 |
| C16:1, cis 9 | 52.61 ± 4.65 | 54.84 ± 0.92 | 55.36 ± 1.50 | 56.82 ± 1.43 | 56.80 ± 1.84 |
| C17:0 | n.d. | 9.86 ± 0.61 | 5.77 ± 1.39 | 9.72 ± 1.03 | 11.48 ± 1.02 |
| C17:1, cis 10 | n.d. | 9.90 ± 2.12 | 7.82 ± 3.35 | n.d. | n.d. |
| C18:2, cis 9,12 | n.d. | n.d. | 0.05 ± 0.05 | 0.47 ± 0.29 | 1.49 ± 0.52 |
| C20:4, cis 5,8,11,14 | n.d. | 0.10 ± 0.10 | 0.65 ± 0.45 | 1.65 ± 0.55 | 2.91 ± 0.72 |
| C20:5, cis 5,8,11,14,17 | 15.59 ± 1.45 | 5.15 ± 1.22 | 9.13 ± 1.50 | 10.72 ± 2.18 | 10.50 ± 2.77 |
| Total fatty acid | 2.10 ± 0.08 | 1.94 ± 0.05 | 2.31 ± 0.17 | 2.42 ± 0.12 | 2.28 ± 0.11 |
| SFA | 30.95 ± 1.66 | 28.57 ± 1.58 | 25.52 ± 1.57 | 28.67 ± 1.67 | 26.31 ± 1.81 |
| MUFA | 53.46 ± 2.33 | 66.18 ± 2.40 | 64.65 ± 3.07 | 58.49 ± 1.36 | 58.79 ± 1.95 |
| PUFA | 15.59 ± 1.45 | 5.25 ± 1.26 | 9.84 ± 1.95 | 12.84 ± 2.21 | 14.91 ± 2.86 |
| Growth Medium | Silicon | Nitrogen | Phosphorus | Ratio Si:N:P- | ||||
|---|---|---|---|---|---|---|---|---|
| γSi (mg L−1) | CSi (mM) | γN-NO3− (mg L−1) | CN-NO3− (mM) | γP-PO43− (mg L−1) | CP-PO43− (mM) | (g:g:g) | (mol:mol:mol) | |
| M1 | 14.04 | 0.5 | 28.01 | 2 | 3.42 | 0.036 | 3:8:1 | 14:56:1 |
| M2 | 14.04 | 0.5 | 28.01 | 2 | 13.68 | 0.15 | 1:2:1 | 3:13:1 |
| M3 | 28.09 | 1 | 49.02 | 3.5 | 13.68 | 0.15 | 2.:4:1 | 7:23:1 |
| M4 | 28.09 | 1 | 84.04 | 6 | 13.68 | 0.15 | 2:6:1 | 7:40:1 |
| M5 | 28.09 | 1 | 49.02 | 3.5 | 20.51 | 0.22 | 1:2:1 | 5:16:1 |
| M6 | 28.09 | 1 | 49.02 | 3.5 | 27.35 | 0.29 | 1:2:1 | 4:12:1 |
| f/2 * | 2.81 | 0.1 | 12.32 | 0.88 | 3.42 | 0.036 | 1:4:1 | 3:24:1 |
| Analyte | Calibration Equation (g L−1) | Determination Coefficient |
|---|---|---|
| Glucuronic acid | y = 113,192x + 44.361 | 0.99 |
| Glucose | y = 135,278x − 3377 | 0.99 |
| Mannose | y = 128,302x − 5039.7 | 0.99 |
| Galactose | y = 132,077x + 987.09 | 0.99 |
| Xylose | y = 129,878x − 627.53 | 0.99 |
| Fructose | y = 125,211x + 3745.8 | 1.00 |
| Rhamnose | y = 113,900x + 479.24 | 0.99 |
| Arabinose | y = 128,443x − 3314.1 | 0.99 |
| Fucose | y = 136,441x − 2965.8 | 0.99 |
| Glucosamine hydrochloride | y = 128.54x + 279.1 | 0.98 |
Disclaimer/Publisher’s Note: The statements, opinions and data contained in all publications are solely those of the individual author(s) and contributor(s) and not of MDPI and/or the editor(s). MDPI and/or the editor(s) disclaim responsibility for any injury to people or property resulting from any ideas, methods, instructions or products referred to in the content. |
© 2024 by the authors. Licensee MDPI, Basel, Switzerland. This article is an open access article distributed under the terms and conditions of the Creative Commons Attribution (CC BY) license (https://creativecommons.org/licenses/by/4.0/).
Share and Cite
Grubišić, M.; Šantek, B.; Kuzmić, M.; Čož-Rakovac, R.; Ivančić Šantek, M. Enhancement of Biomass Production of Diatom Nitzschia sp. S5 through Optimisation of Growth Medium Composition and Fed-Batch Cultivation. Mar. Drugs 2024, 22, 46. https://doi.org/10.3390/md22010046
Grubišić M, Šantek B, Kuzmić M, Čož-Rakovac R, Ivančić Šantek M. Enhancement of Biomass Production of Diatom Nitzschia sp. S5 through Optimisation of Growth Medium Composition and Fed-Batch Cultivation. Marine Drugs. 2024; 22(1):46. https://doi.org/10.3390/md22010046
Chicago/Turabian StyleGrubišić, Marina, Božidar Šantek, Marija Kuzmić, Rozelindra Čož-Rakovac, and Mirela Ivančić Šantek. 2024. "Enhancement of Biomass Production of Diatom Nitzschia sp. S5 through Optimisation of Growth Medium Composition and Fed-Batch Cultivation" Marine Drugs 22, no. 1: 46. https://doi.org/10.3390/md22010046
APA StyleGrubišić, M., Šantek, B., Kuzmić, M., Čož-Rakovac, R., & Ivančić Šantek, M. (2024). Enhancement of Biomass Production of Diatom Nitzschia sp. S5 through Optimisation of Growth Medium Composition and Fed-Batch Cultivation. Marine Drugs, 22(1), 46. https://doi.org/10.3390/md22010046