
Improved Plasma Lipids, Anti-Inflammatory Activity, and Microbiome Shifts in Overweight Participants: Two Clinical Studies on Oral Supplementation with Algal Sulfated Polysaccharide


Abstract
:1. Introduction
2. Results
2.1. Participants Study 1
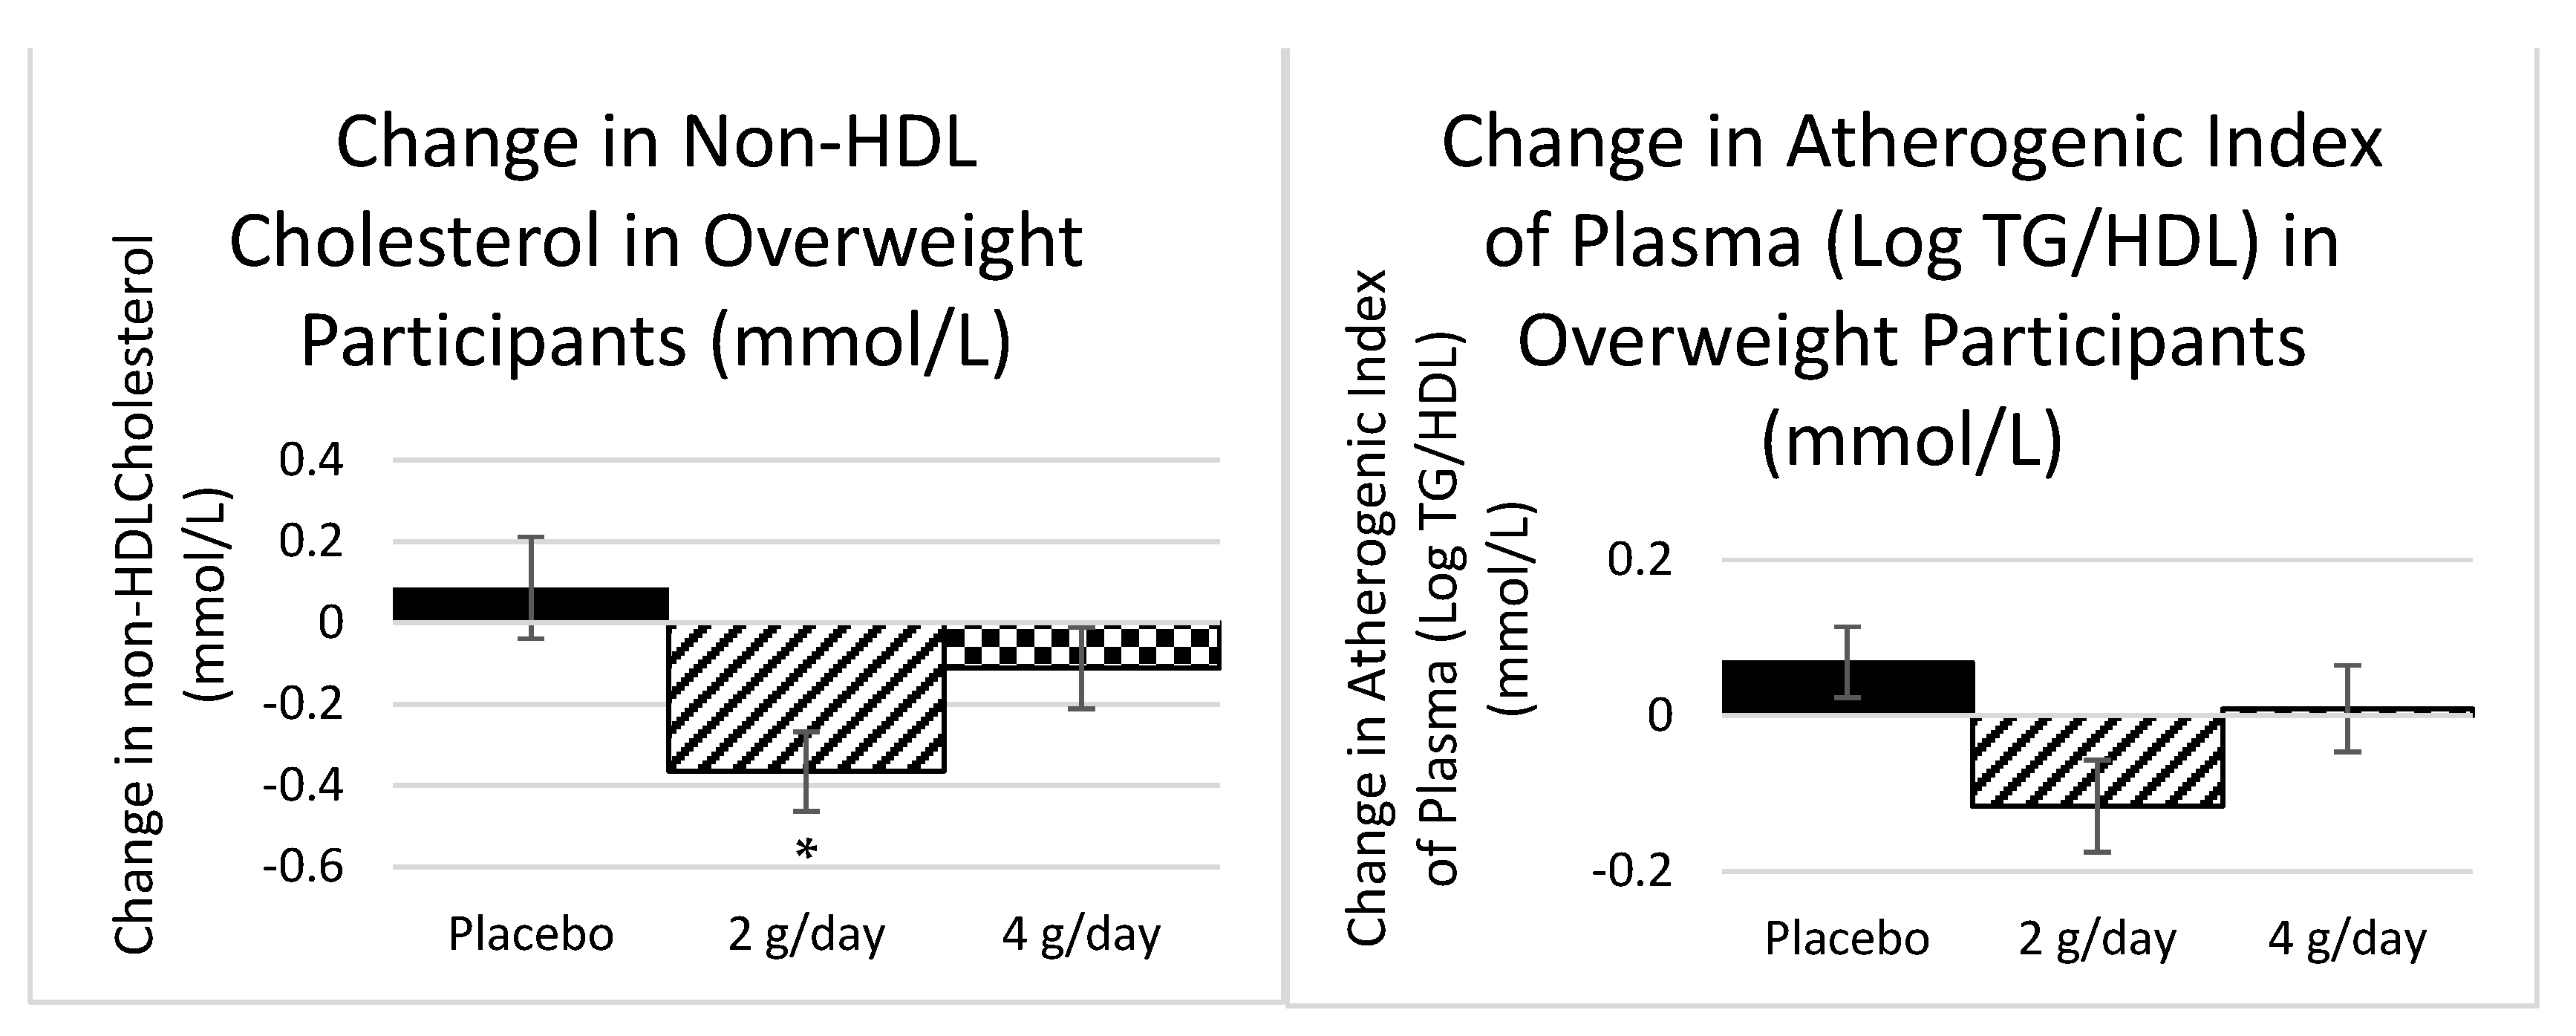
2.1.1. Plasma Lipids Study 1
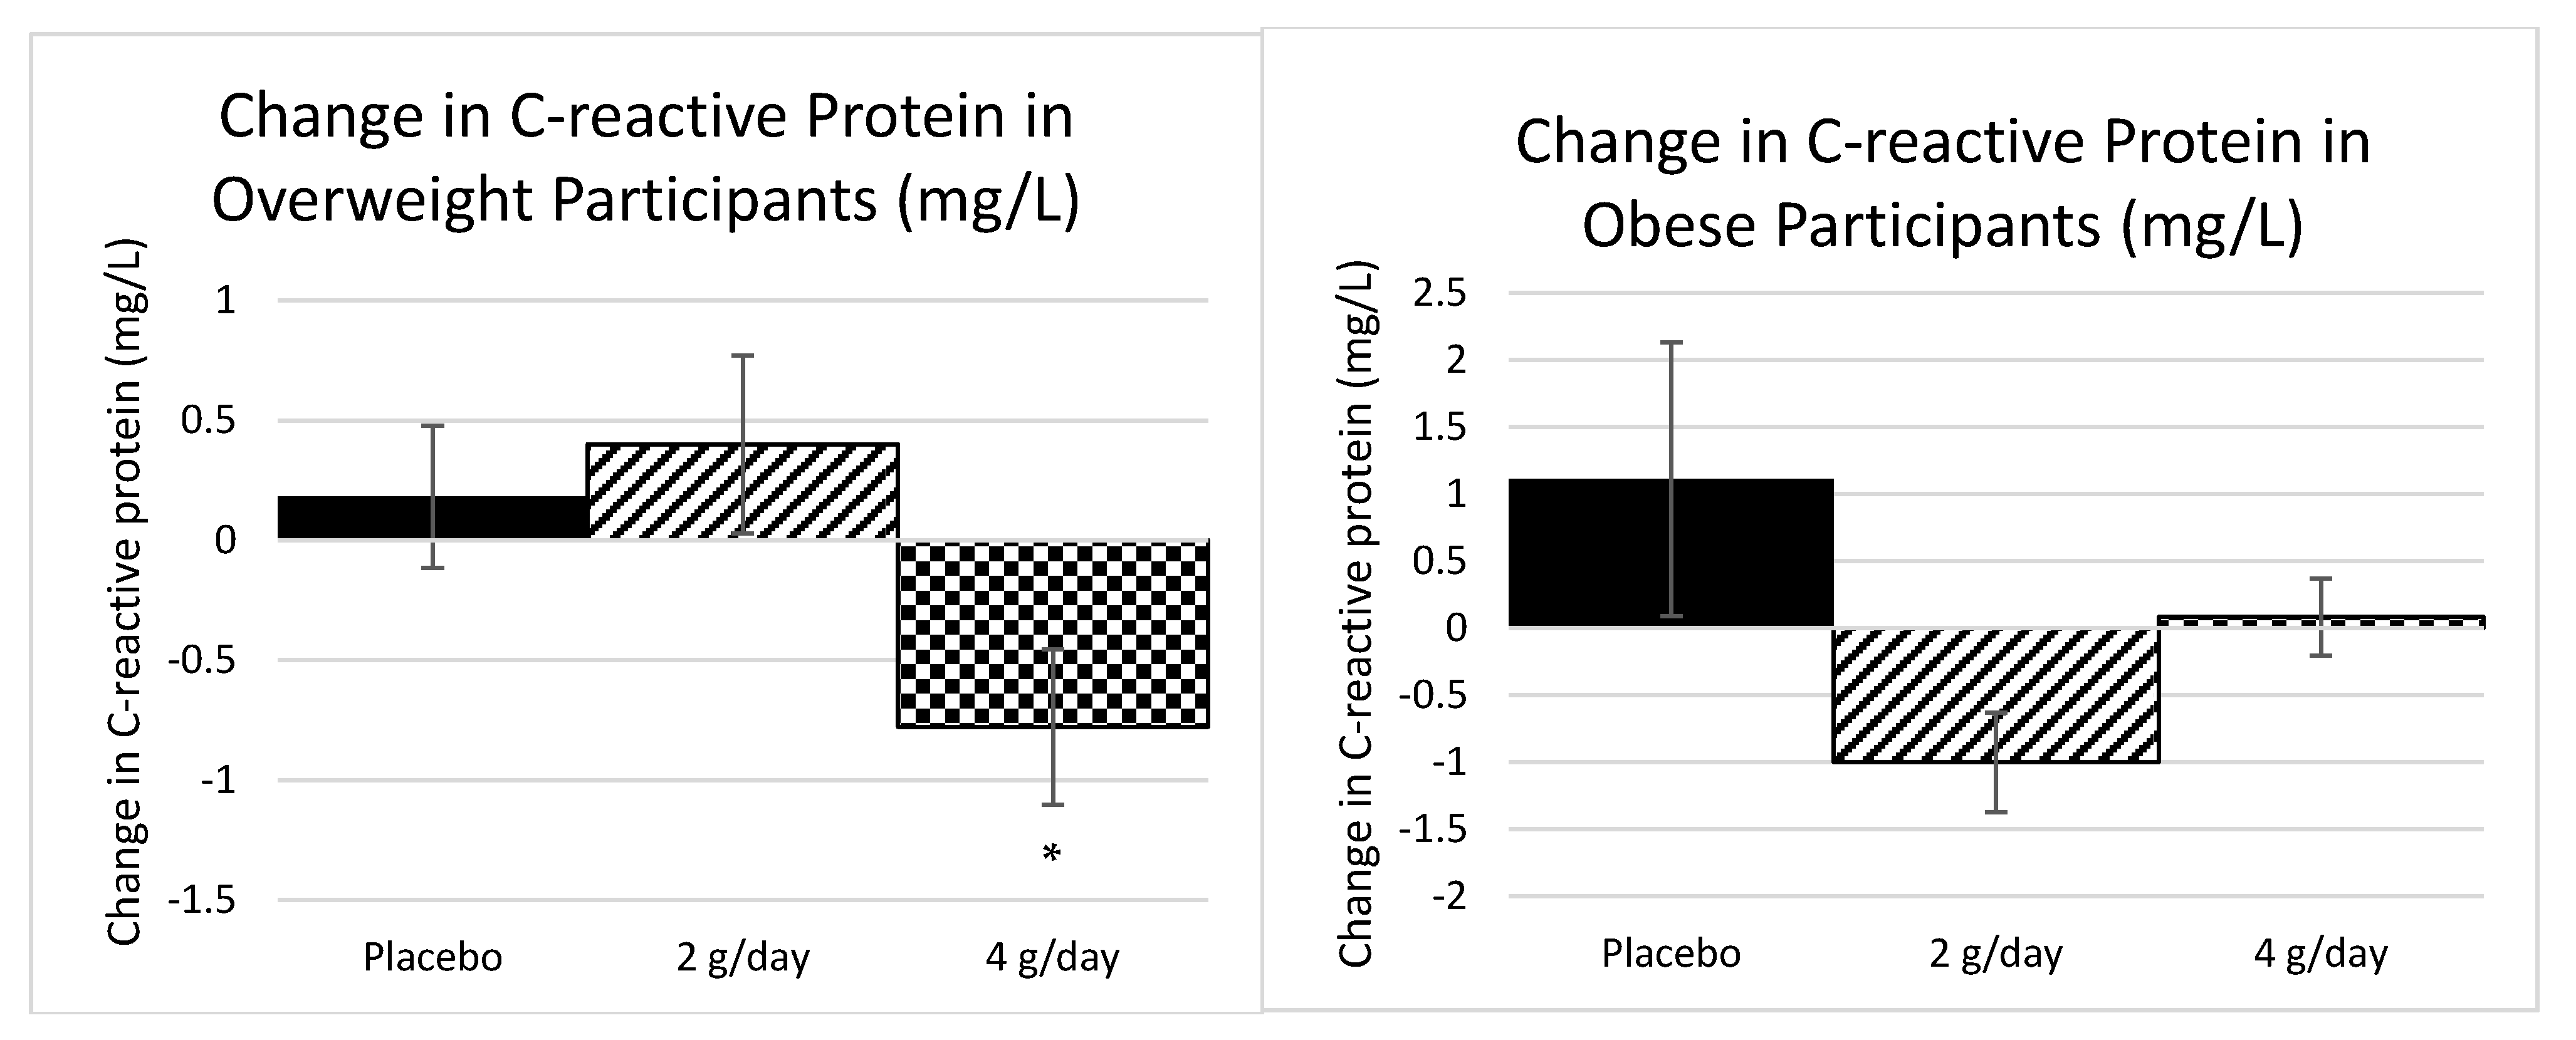
2.1.2. Inflammatory Markers Study 1
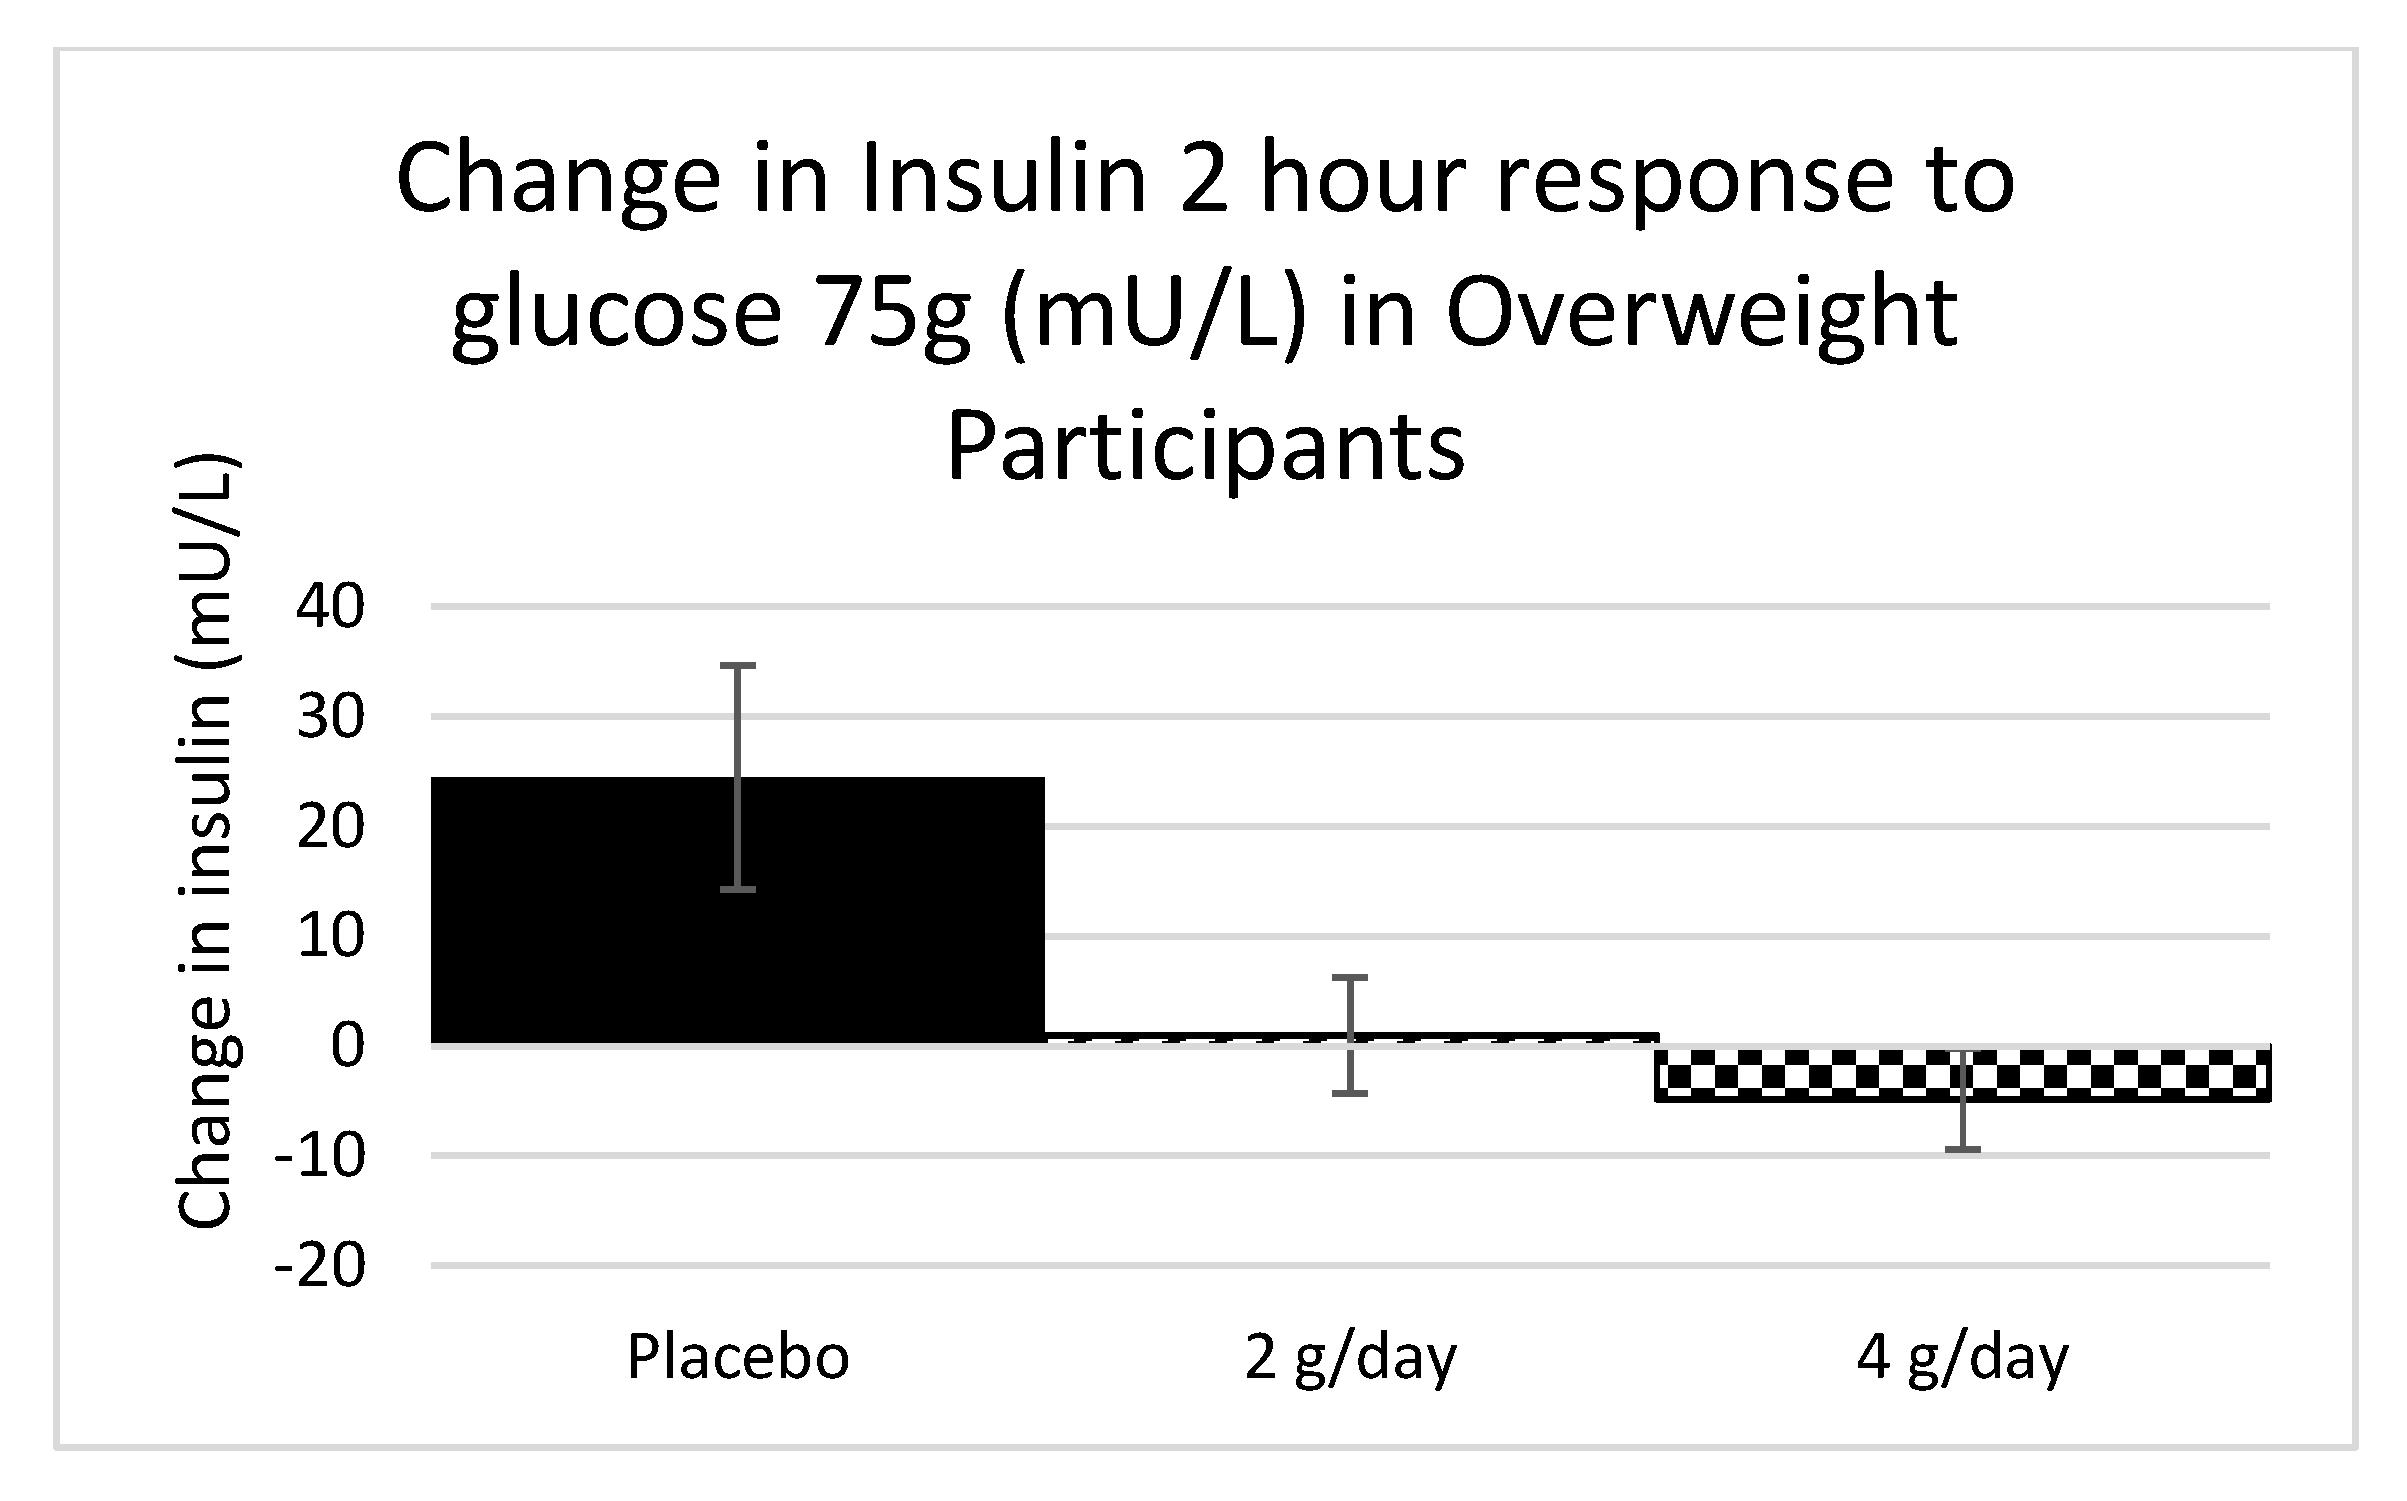
2.1.3. Carbohydrate Metabolism Study 1
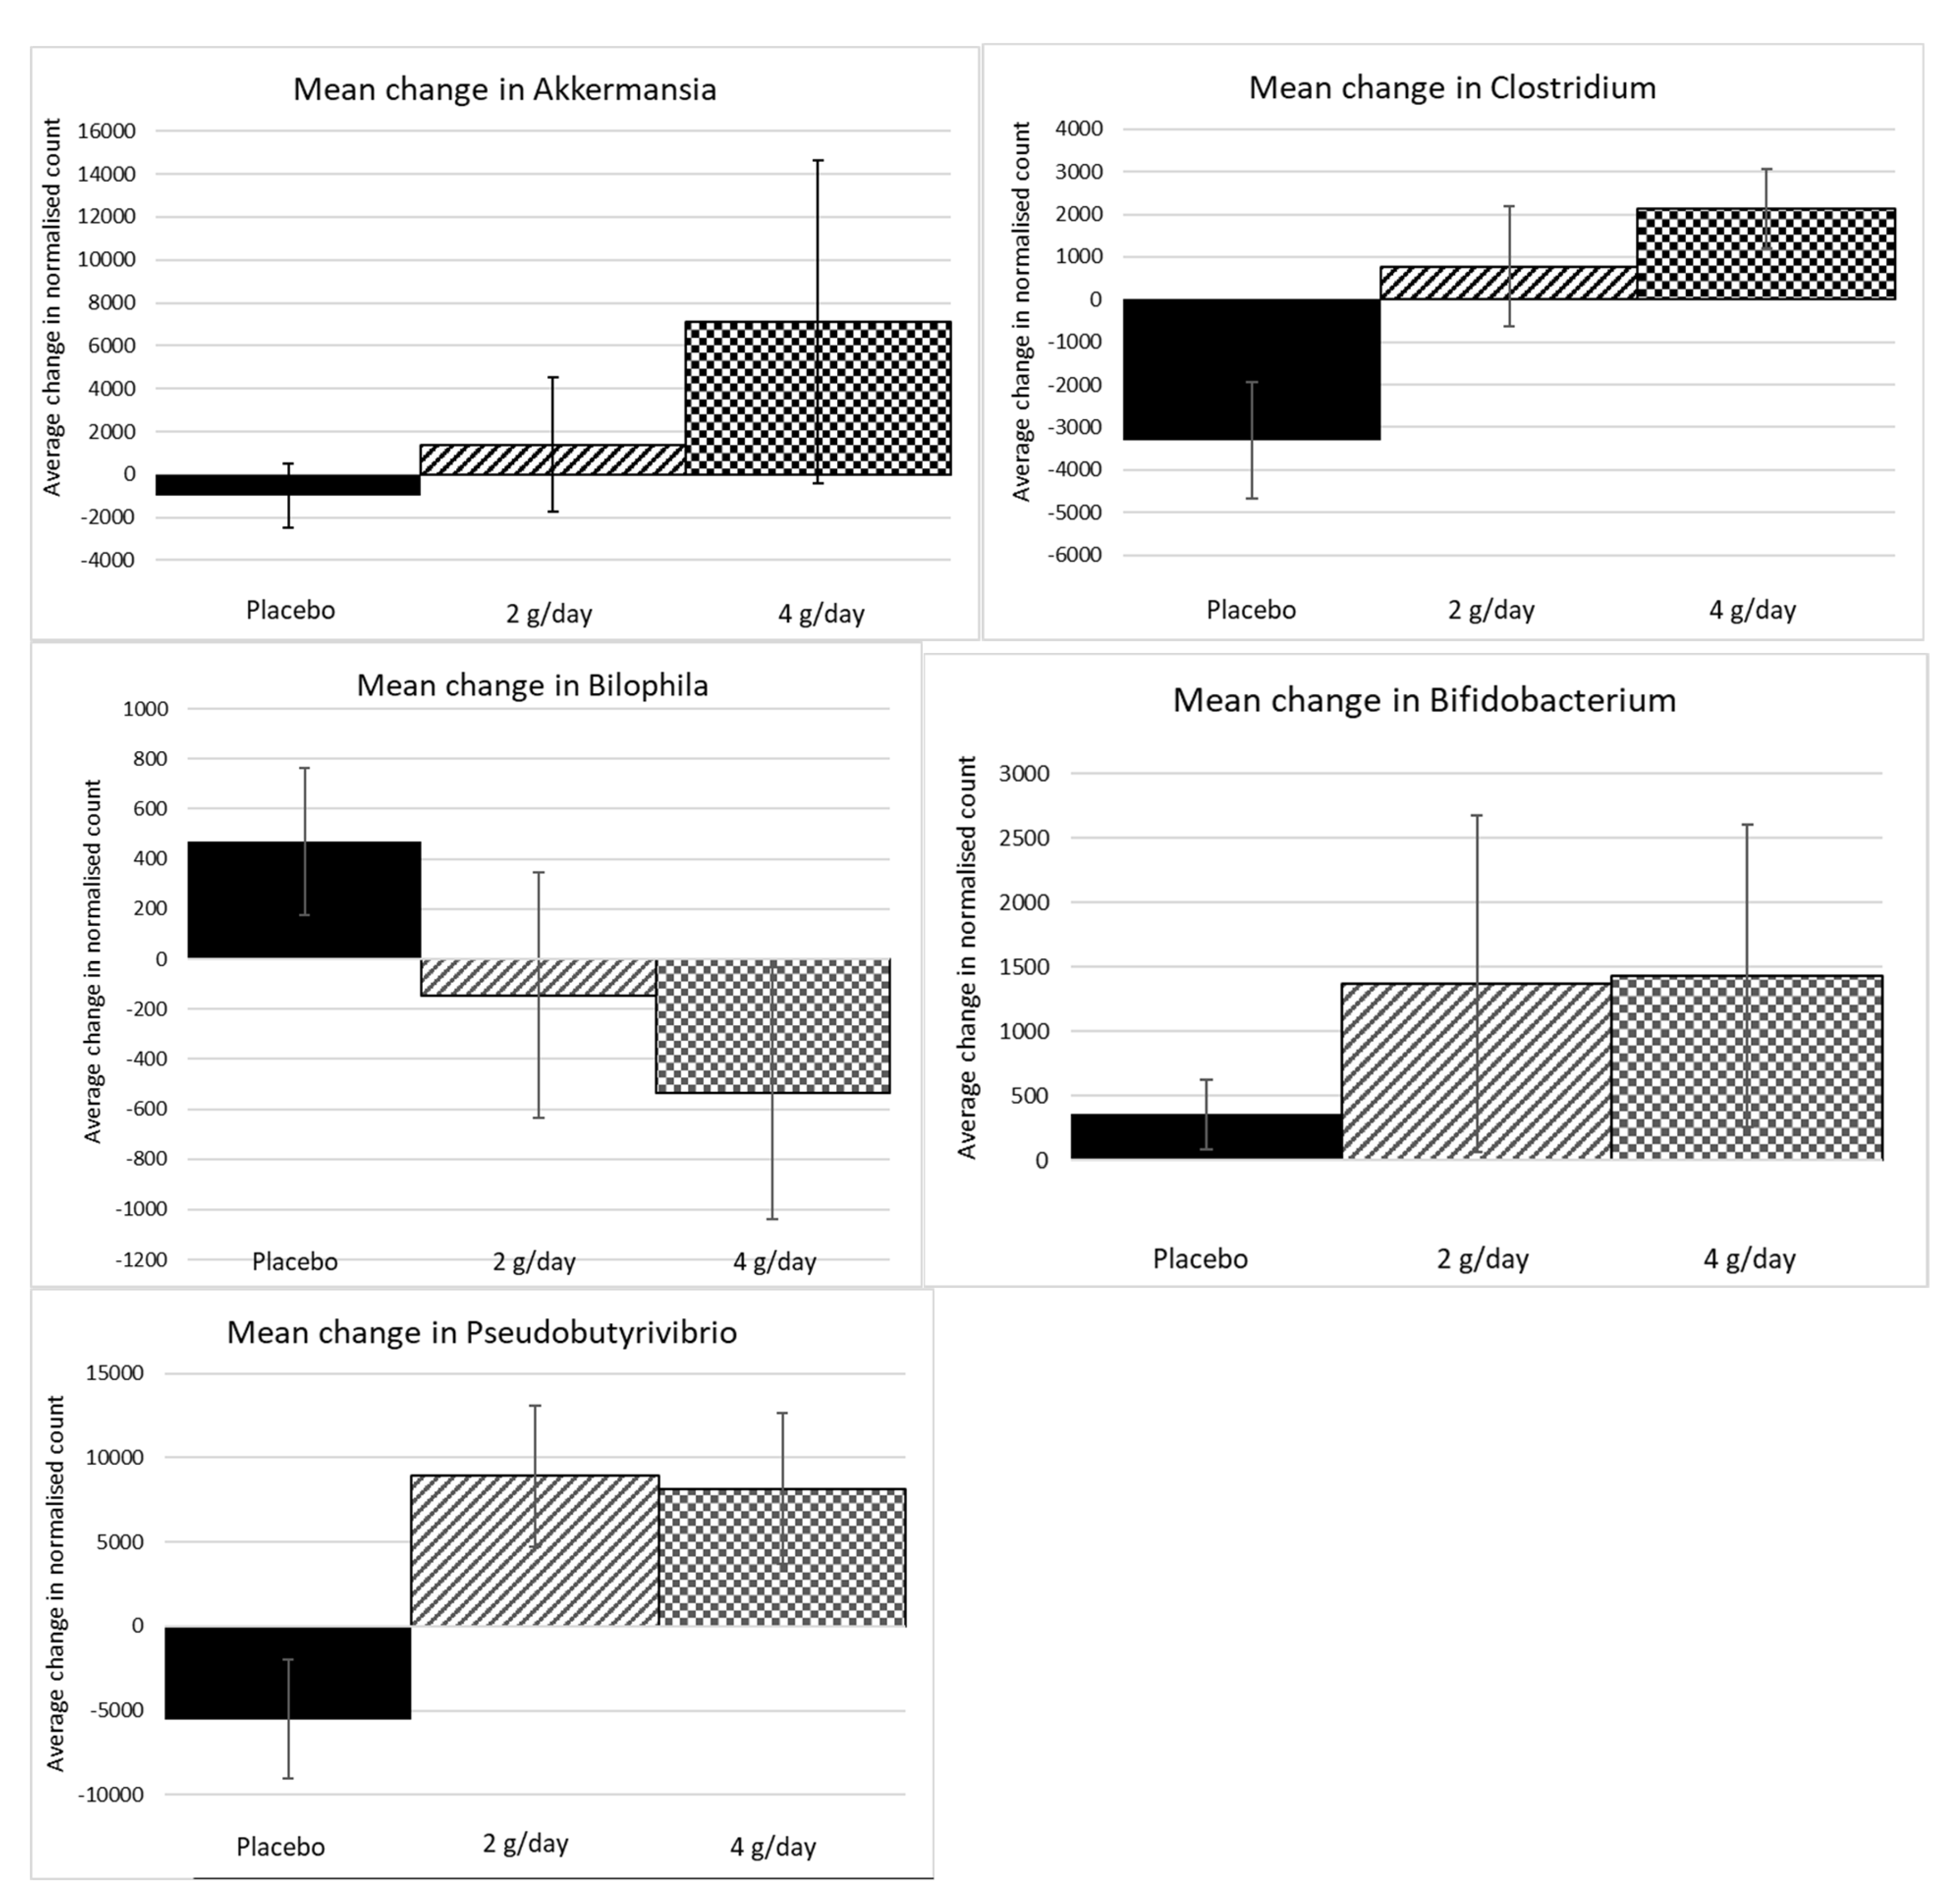
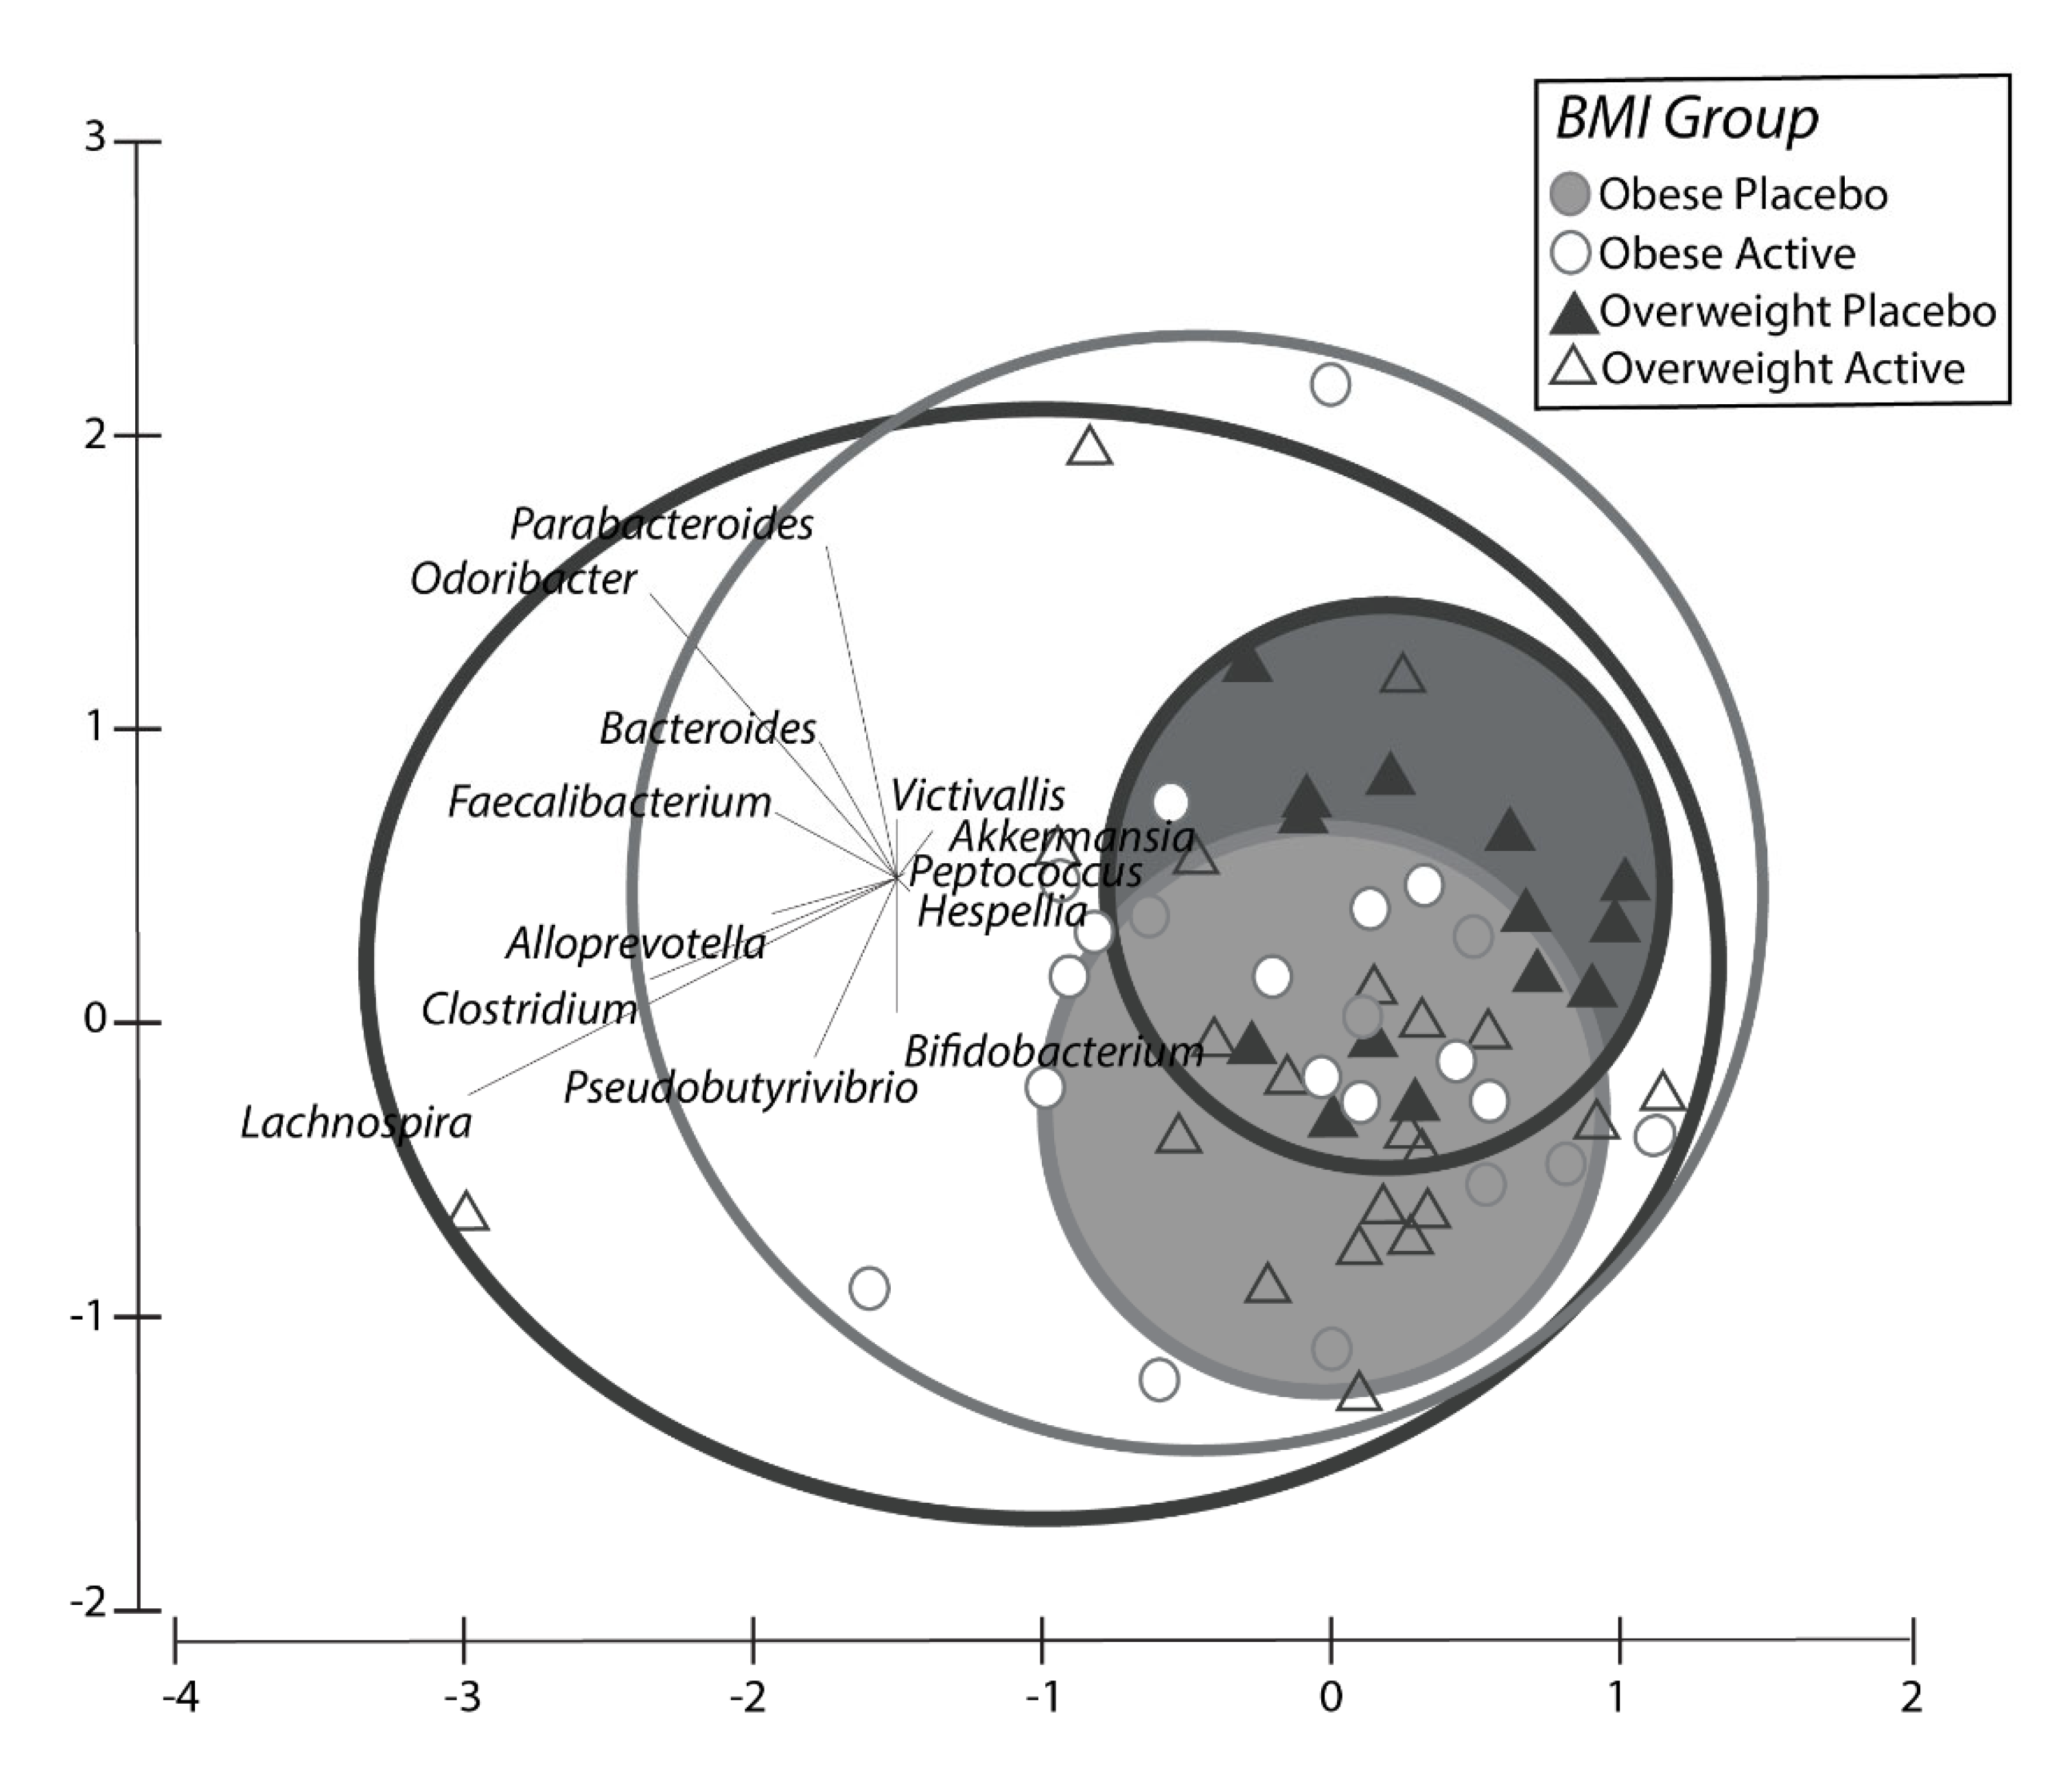
2.1.4. Microbiome Results Study 1
2.1.5. Dietary Data, Bowel Movements, Urinary F2-Isoprostanes—Blood Count Results Study 1
2.2. Study 2
2.2.1. Participants Study 2
2.2.2. Biochemical Analysis Study 2
2.2.3. Inflammatory Markers Study 2
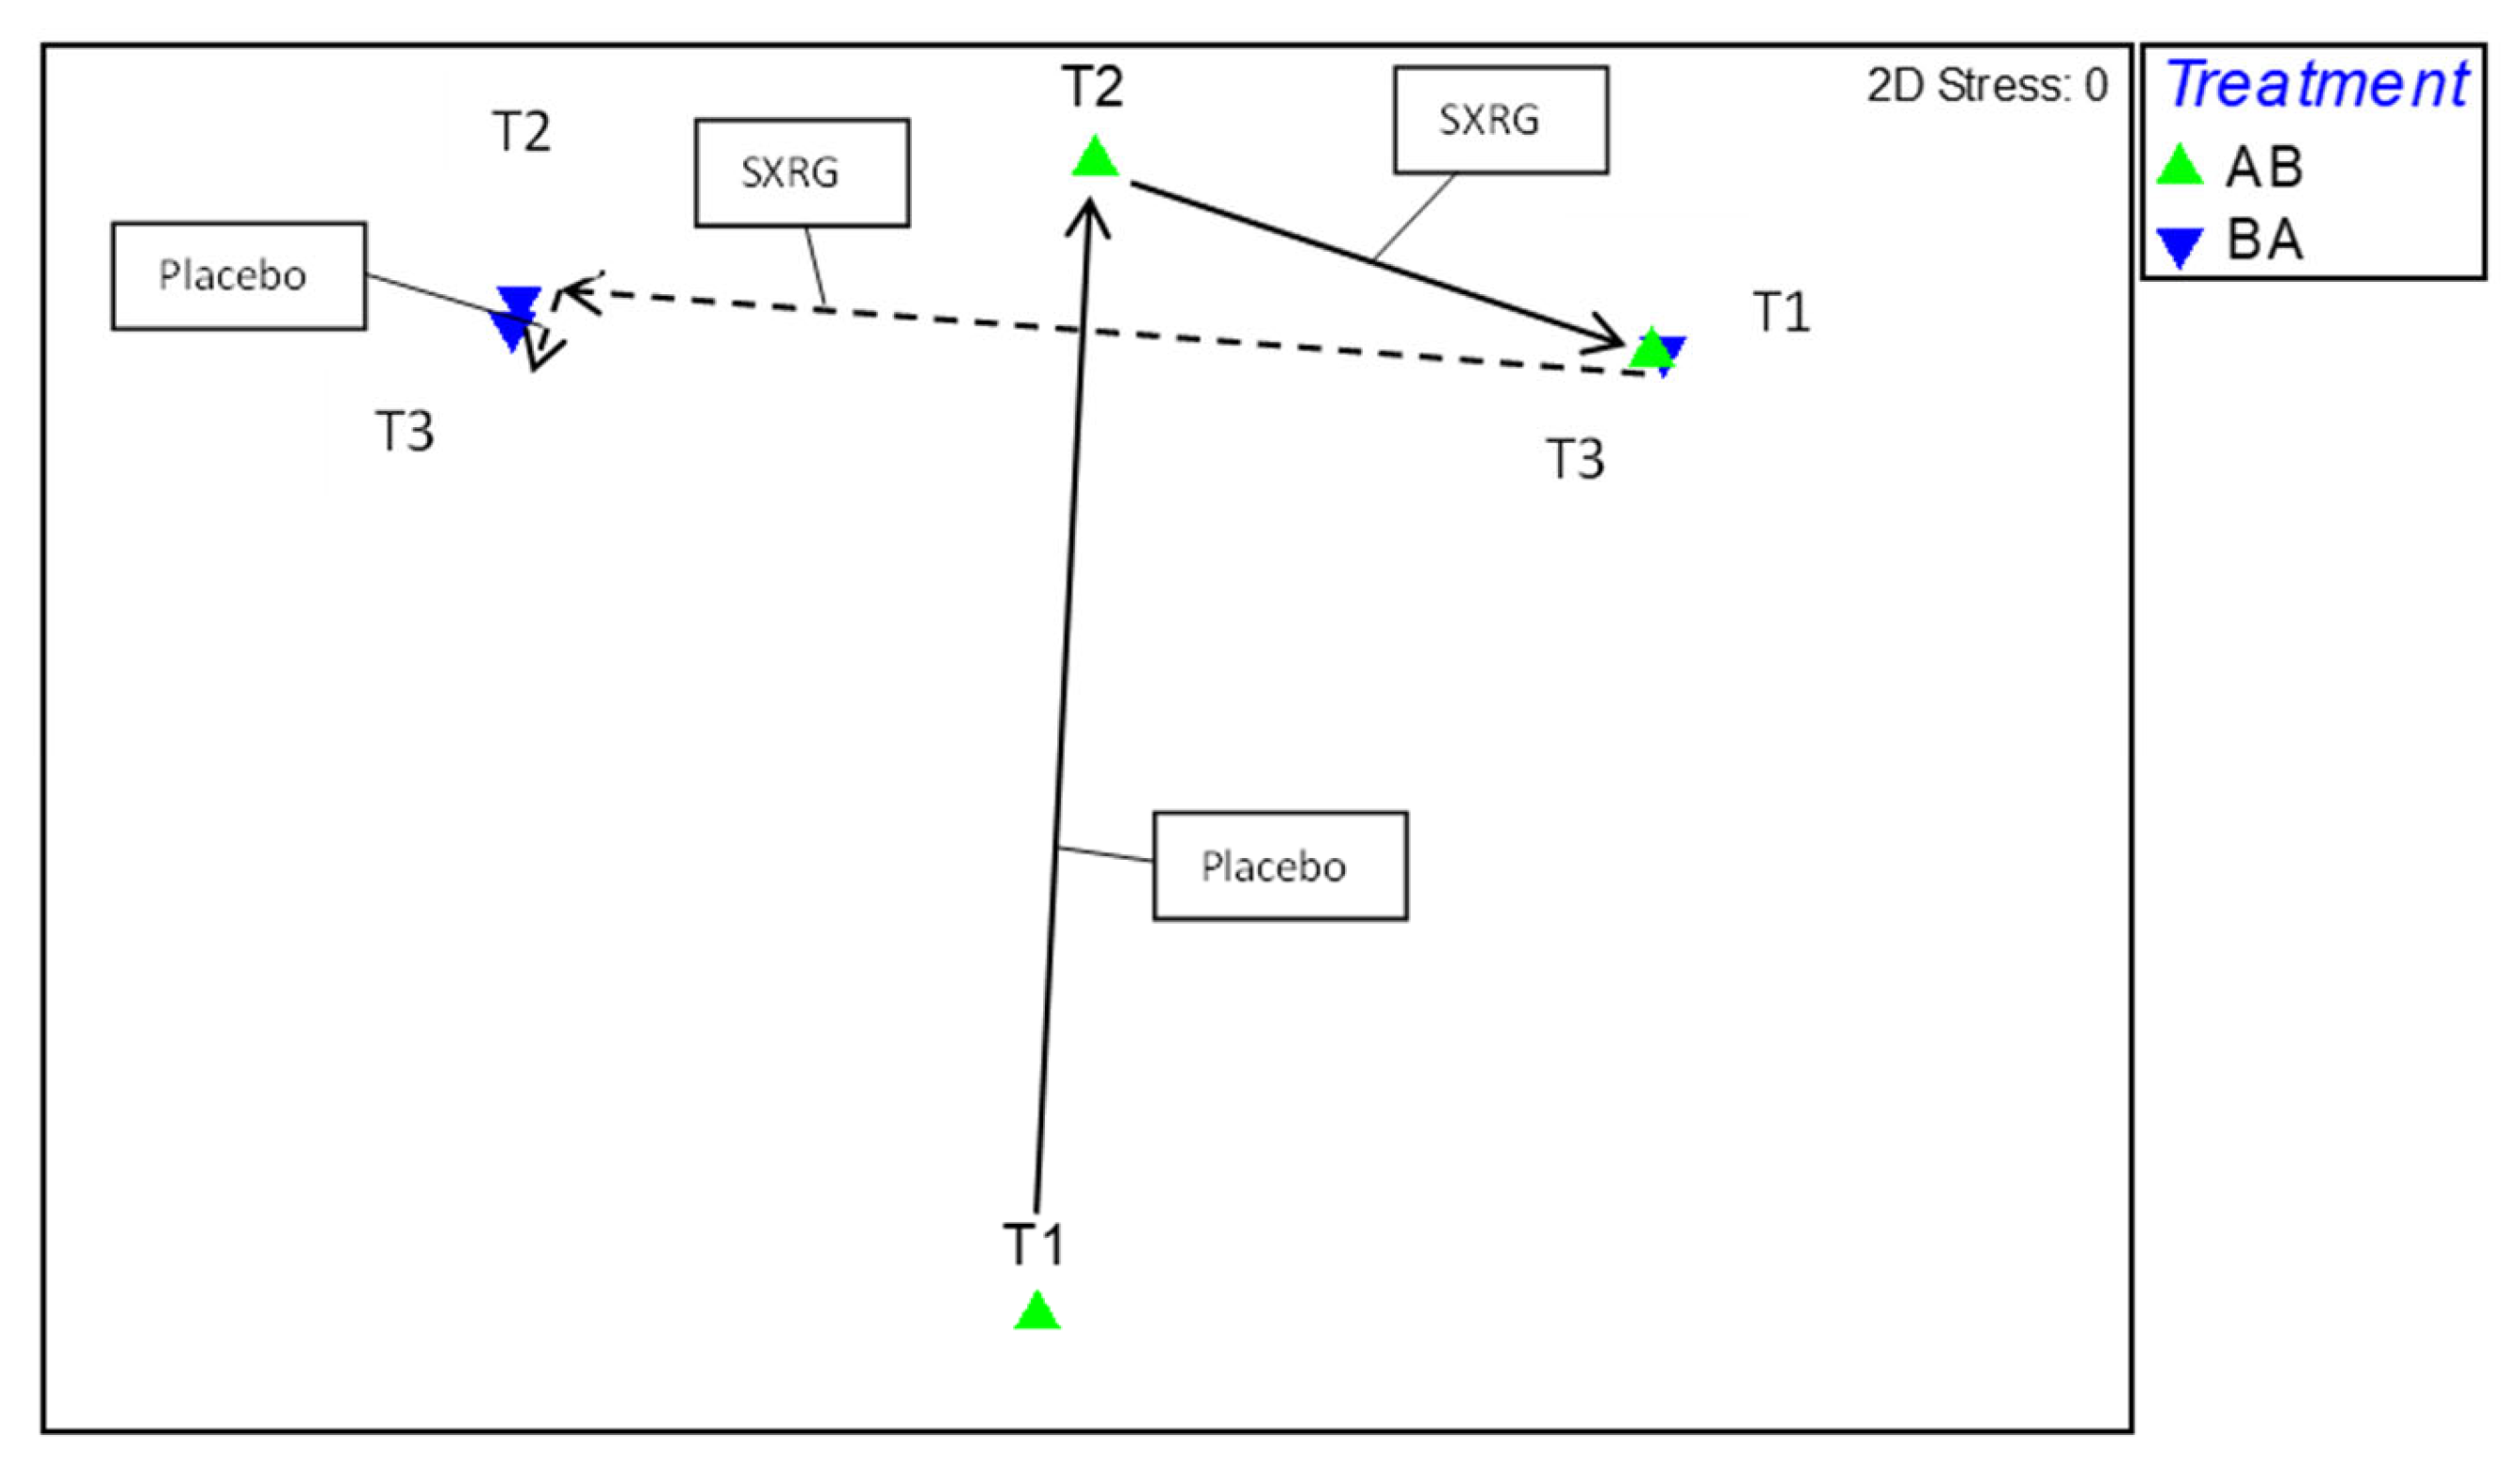
2.2.4. Gut Flora Results Study 2
3. Discussion
Limitations and Future Work
4. Materials and Methods
4.1. Study 1 Design
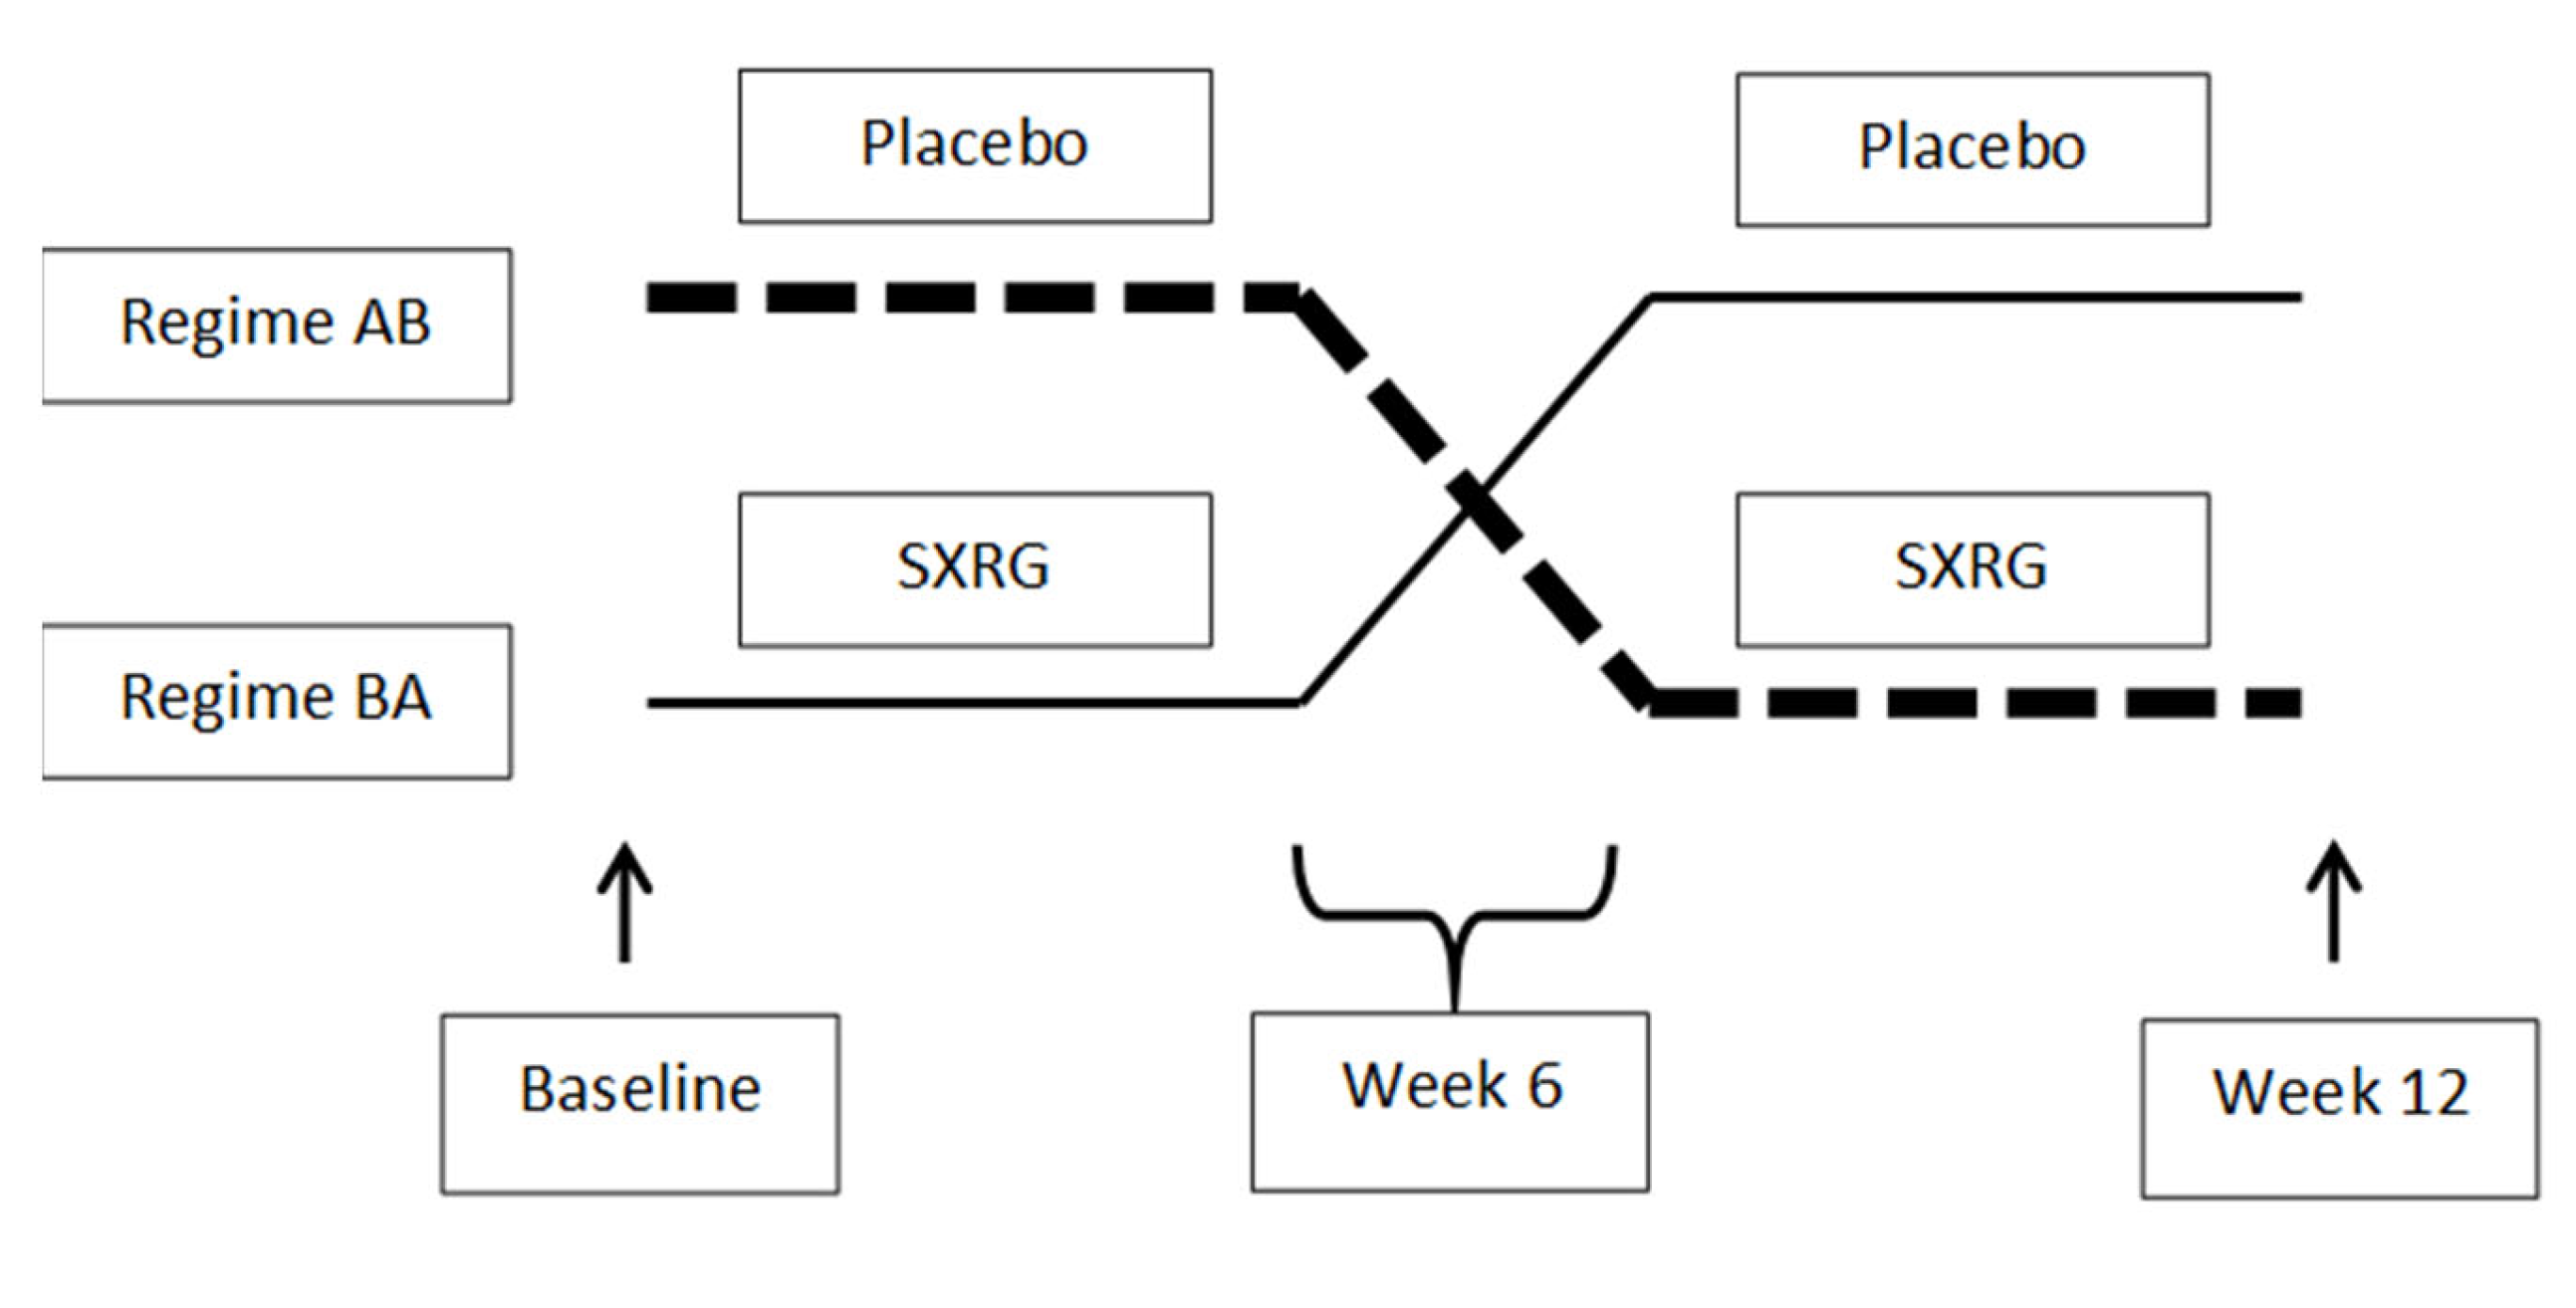
4.2. Study 2 Design
4.3. Seaweed Extract
4.4. Blood Analysis
Blood Analysis Study 1
Blood Analysis Study 2
4.5. Oral Glucose Tolerance Test (OGTT) in Both Studies
4.6. Study 1 Urine Analysis
4.7. Gut Flora Analysis
4.8. Dietary Intake
4.9. Bowel Movements
4.10. Statistical Analysis of Biochemical Data
5. Conclusions
Supplementary Materials
Author Contributions
Funding
Institutional Review Board Statement
Informed Consent Statement
Data Availability Statement
Acknowledgments
Conflicts of Interest
References
- Dabke, K.; Hendrick, G.; Devkota, S. The gut microbiome and metabolic syndrome. J. Clin. Investig. 2019, 129, 4050–4057. [Google Scholar] [CrossRef]
- McCracken, E.; Monaghan, M.; Sreenivasan, S. Pathophysiology of the metabolic syndrome. Clin. Dermatol. 2018, 36, 14–20. [Google Scholar] [CrossRef]
- Jardon, K.M.; Canfora, E.E.; Coossens, G.H.; Blaak, E.E. Dietary macronutrients and the gut microbiome: A precision nutrition approach to improve cardiometabolic health. Gut 2022, 71, 1214–1226. [Google Scholar] [CrossRef]
- Chan, K.L.; Cathomas, F.; Russo, S.J. Central and Peripheral Inflammation Link Metabolic Syndrome and Major Depressive Disorder. Physiology (Bethesda) 2019, 34, 123–133. [Google Scholar] [CrossRef]
- Zhang, C.; Ward, J.; Dauch, J.R.; Tanzi, R.E.; Cheng, H.T. Cytokine-mediated inflammation mediates painful neuropathy from metabolic syndrome. PLoS ONE 2018, 13, e0192333. [Google Scholar] [CrossRef] [Green Version]
- Ridker, P.M.; MacFadyen, J.G.; Glynn, R.J.; Bradwin, G.; Hasan, A.A. Comparison of interleukin-6, C-reactive protein, and low-density lipoprotein cholesterol as biomarkers of residual risk in contemporary practice: Secondary analyses from the Cardiovascular Inflammation Reduction Trial. Eur. Heart J. 2020, 41, 2952–2961. [Google Scholar] [CrossRef] [Green Version]
- Wong, J.M.; Jenkins, D.J. Carbohydrate digestibility and metabolic effects. J. Nutr. 2007, 137, 2539S–2546S. [Google Scholar] [CrossRef]
- Shannon, E.; Conlon, M.; Hayes, M. Seaweed Components as Potential Modulators of the Gut Microbiota. Mar. Drugs 2021, 19, 358. [Google Scholar] [CrossRef] [PubMed]
- Winberg, P.C.; Fitton, J.H.; Stringer, D.; Karpiniec, S.S.; Gardiner, V.A. Controlling seaweed biology, physiology and metabolic traits in production for commercially relevant bio-actives in glycobiology. Adv. Bot. Res. 2013, 71, 221–252. [Google Scholar]
- Cardoso, M.J.; Costa, R.R.; Mano, J.F. Marine Origin Polysaccharides in Drug Delivery Systems. Mar. Drugs 2016, 14, 34. [Google Scholar] [CrossRef] [PubMed] [Green Version]
- Ndeh, D.; Gilbert, H.J. Biochemistry of complex glycan depolymerisation by the human gut microbiota. FEMS Microbiol. Rev. 2018, 42, 146–164. [Google Scholar] [CrossRef] [Green Version]
- Andrieux, C.; Hibert, A.; Houari, A.-M.; Bensaada, M.; Popot, F.; Szylit, O. Ulva lactuca is poorly fermented but alters bacterial metabolism in rats inoculated with human faecal flora from methane and non-methane producers. J. Sci. Food Agricul. 1998, 77, 25–30. [Google Scholar] [CrossRef]
- Qi, H.; Liu, X.; Wang, K.; Liu, D.; Huang, L.; Liu, S.; Zhang, Q. Subchronic toxicity study of ulvan from Ulva pertusa (Chlorophyta) in Wistar rats. Food Chem. Toxicol. 2013, 62, 573–578. [Google Scholar] [CrossRef]
- Dvir, I.; Chayoth, R.; Sod-Moriah, U.; Shany, S.; Nyska, A.; Stark, A.H.; Madar, Z.; Arad, S.M. Soluble polysaccharide and biomass of red microalga Porphyridium sp. alter intestinal morphology and reduce serum cholesterol in rats. Br. J. Nutr. 2000, 84, 469–476. [Google Scholar] [CrossRef] [Green Version]
- Kumar, S.A.; Magnusson, M.; Ward, L.C.; Paul, N.A.; Brown, L. Seaweed supplements normalise metabolic, cardiovascular and liver responses in high-carbohydrate, high-fat fed rats. Mar. Drugs 2015, 13, 788–805. [Google Scholar] [CrossRef]
- Olsthoorn, S.E.M.; Wang, X.; Tillema, B.; Vanmierlo, T.; Kraan, S.; Leenen, P.J.M.; Mulder, M.T. Brown Seaweed Food Supplementation: Effects on Allergy and Inflammation and Its Consequences. Nutrients 2021, 13, 2613. [Google Scholar] [CrossRef]
- Cox, A.J.; Cripps, A.W.; Taylor, P.A.; Fitton, J.H.; West, N.P. Fucoidan Supplementation Restores Fecal Lysozyme Concentrations in High-Performance Athletes: A Pilot Study. Mar. Drugs 2020, 18, 412. [Google Scholar] [CrossRef]
- Wright, C.M.; Bezabhe, W.; Fitton, J.H.; Stringer, D.N.; Bereznicki, L.R.E.; Peterson, G.M. Effect of a Fucoidan Extract on Insulin Resistance and Cardiometabolic Markers in Obese, Nondiabetic Subjects: A Randomized, Controlled Trial. J. Altern. Complement. Med. 2019, 25, 346–352. [Google Scholar] [CrossRef]
- Li, Y.; Ye, H.; Wang, T.; Wang, P.; Liu, R.; Li, Y.; Tian, Y.; Zhang, J. Characterization of Low Molecular Weight Sulfate Ulva Polysaccharide and its Protective Effect against IBD in Mice. Mar. Drugs 2020, 18, 499. [Google Scholar] [CrossRef]
- Li, B.; Xu, H.; Wang, X.; Wan, Y.; Jiang, N.; Qi, H.; Liu, X. Antioxidant and antihyperlipidemic activities of high sulfate content purified polysaccharide from Ulva pertusa. Int. J. Biol. Macromol. 2020, 146, 756–762. [Google Scholar] [CrossRef]
- Pengzhan, Y.; Ning, L.; Xiguang, L.; Gefei, Z.; Quanbin, Z.; Pengcheng, L. Antihyperlipidemic effects of different molecular weight sulfated polysaccharides from Ulva pertusa (Chlorophyta). Pharmacol. Res. 2003, 48, 543–549. [Google Scholar] [CrossRef]
- Tas, S.; Celikler, S.; Ziyanok-Ayvalik, S.; Sarandol, E.; Dirican, M. Ulva rigida improves carbohydrate metabolism, hyperlipidemia and oxidative stress in streptozotocin-induced diabetic rats. Cell. Biochem. Funct. 2011, 29, 108–113. [Google Scholar] [CrossRef]
- Tang, Z.; Cao, H.; Wang, S.; Wen, S.; Qin, S. Hypolipidemic and antioxidant properties of a polysaccharide fraction from Enteromorpha prolifera. Int. J. Biol. Macromol. 2013, 58, 186–189. [Google Scholar] [CrossRef]
- Galgani, J.E.; Fernandez-Verdejo, R. Pathophysiological role of metabolic flexibility on metabolic health. Obes. Rev. 2021, 22, e13131. [Google Scholar] [CrossRef]
- Glaves, A.; Díaz-Castro, F.; Farías, J.; Ramírez-Romero, R.; Galgani, J.E.; Fernández-Verdejo, R. Association Between Adipose Tissue Characteristics and Metabolic Flexibility in Humans: A Systematic Review. Front. Nutr. 2021, 8, 744187. [Google Scholar] [CrossRef]
- Ballantyne, C.M.; Bertolami, M.; Hernandez Garcia, H.R.; Nul, D.; Stein, E.A.; Theroux, P.; Weiss, R.; Cain, V.A.; Raichlen, J.S. Achieving LDL cholesterol, non-HDL cholesterol, and apolipoprotein B target levels in high-risk patients: Measuring Effective Reductions in Cholesterol Using Rosuvastatin therapY (MERCURY) II. Am. Heart J. 2006, 151, 975.e1–975.e9. [Google Scholar] [CrossRef]
- Shouval, D.S.; Ouahed, J.; Biswas, A.; Goettel, J.A.; Horwitz, B.H.; Klein, C.; Muise, A.M.; Snapper, S.B. Interleukin 10 receptor signaling: Master regulator of intestinal mucosal homeostasis in mice and humans. Adv Immunol. 2014, 122, 177–210. [Google Scholar]
- Qi, H.; Liu, X.; Zhang, J.; Duan, Y.; Wang, X.; Zhang, Q. Synthesis and antihyperlipidemic activity of acetylated derivative of ulvan from Ulva pertusa. Int. J. Biol. Macromol. 2012, 50, 270–272. [Google Scholar] [CrossRef]
- BelHadj, S.; Hentati, O.; Elfeki, A.; Hamden, K. Inhibitory activities of Ulva lactuca polysaccharides on digestive enzymes related to diabetes and obesity. Arch. Physiol. Biochem. 2013, 119, 81–87. [Google Scholar] [CrossRef]
- Natividad, J.M.; Lamas, B.; Pham, H.P.; Michel, M.L.; Rainteau, D.; Bridonneau, C.; da Costa, G.; van Hylckama Vlieg, J.; Sovran, B.; Chamignon, C.; et al. Bilophila wadsworthia aggravates high fat diet induced metabolic dysfunctions in mice. Nat. Commun. 2018, 9, 2802. [Google Scholar] [CrossRef] [Green Version]
- Devkota, S.; Chang, E.B. Interactions between Diet, Bile Acid Metabolism, Gut Microbiota, and Inflammatory Bowel Diseases. Dig. Dis. 2015, 33, 351–356. [Google Scholar] [CrossRef] [PubMed] [Green Version]
- Rodríguez-Carrio, J.; Salazar, N.; Margolles, A.; González, S.; Gueimonde, M.; de Los Reyes-Gavilán, C.G.; Suárez, A. Free Fatty Acids Profiles Are Related to Gut Microbiota Signatures and Short-Chain Fatty Acids. Front. Immunol. 2017, 8, 823. [Google Scholar] [CrossRef] [PubMed]
- Vogt, J.A.; Pencharz, P.B.; Wolever, T.M. l-Rhamnose increases serum propionate in humans. Am. J. Clin. Nutr. 2004, 80, 89–94. [Google Scholar] [CrossRef] [PubMed] [Green Version]
- Łykowska-Szuber, L.; Rychter, A.M.; Dudek, M.; Ratajczak, A.E.; Szymczak-Tomczak, A.; Zawada, A.; Eder, P.; Lesiak, M.; Dobrowolska, A.; Krela-Kaźmierczak, I. What Links an Increased Cardiovascular Risk and Inflammatory Bowel Disease? A Narrative Review. Nutrients 2021, 13, 2661. [Google Scholar] [CrossRef] [PubMed]
- Elyasi, A.; Voloshyna, I.; Ahmed, S.; Kasselman, L.J.; Behbodikhah, J.; De Leon, J.; Reiss, A.B. The role of interferon-γ in cardiovascular disease: An update. Inflamm. Res. 2020, 69, 975–988. [Google Scholar] [CrossRef] [PubMed]
- Silveira Rossi, J.L.; Barbalho, S.M.; Reverete de Araujo, R.; Bechara, M.D.; Sloan, K.P.; Sloan, L.A. Metabolic syndrome and cardiovascular diseases: Going beyond traditional risk factors. Diabetes Metab. Res. Rev. 2021. [Google Scholar] [CrossRef] [PubMed]
- Cani, P.D.; Plovier, H.; Van Hul, M.; Geurts, L.; Delzenne, N.M.; Druart, C.; Everard, A. Endocannabinoids—At the crossroads between the gut microbiota and host metabolism. Nat. Rev. Endocrinol. 2016, 12, 133–143. [Google Scholar] [CrossRef]
- Thomassen, L.V.; Vigsnæs, L.K.; Licht, T.R.; Mikkelsen, J.D.; Meyer, A.S. Maximal release of highly bifidogenic soluble dietary fibers from industrial potato pulp by minimal enzymatic treatment. Appl. Microbiol. Biotechnol. 2011, 90, 873–884. [Google Scholar] [CrossRef]
- Everard, A.; Belzer, C.; Geurts, L.; Ouwerkerk, J.P.; Druart, C.; Bindels, L.B.; Guiot, Y.; Derrien, M.; Muccioli, G.G.; Delzenne, N.M.; et al. Cross-talk between Akkermansia muciniphila and intestinal epithelium controls diet-induced obesity. Proc. Natl. Acad. Sci. USA 2013, 110, 9066–9071. [Google Scholar] [CrossRef] [Green Version]
- Derrien, M.; Vaughan, E.E.; Plugge, C.M.; de Vos, W.M. Akkermansia muciniphila gen. nov., sp. nov., a human intestinal mucin-degrading bacterium. Int. J. Syst. Evol. Microbiol. 2004, 54, 1469–1476. [Google Scholar] [CrossRef] [Green Version]
- Chen, T.; Long, W.; Zhang, C.; Liu, S.; Zhao, L.; Hamaker, B.R. Fiber-utilizing capacity varies in Prevotella- versus Bacteroides-dominated gut microbiota. Sci. Rep. 2017, 7, 2594. [Google Scholar] [CrossRef]
- Nguyen, S.G.; Kim, J.; Guevarra, R.B.; Lee, J.H.; Kim, E.; Kim, S.I.; Unno, T. Laminarin favorably modulates gut microbiota in mice fed a high-fat diet. Food. Funct. 2016, 7, 4193–4201. [Google Scholar] [CrossRef]
- An, C.; Kuda, T.; Yazaki, T.; Takahashi, H.; Kimura, B. FLX pyrosequencing analysis of the effects of the brown-algal fermentable polysaccharides alginate and laminaran on rat cecal microbiotas. Appl. Environ. Microbiol. 2013, 79, 860–866. [Google Scholar] [CrossRef] [Green Version]
- Kverka, M.; Zakostelska, Z.; Klimesova, K.; Sokol, D.; Hudcovic, T.; Hrncir, T.; Rossmann, P.; Mrazek, J.; Kopecny, J.; Verdu, E.F.; et al. Oral administration of Parabacteroides distasonis antigens attenuates experimental murine colitis through modulation of immunity and microbiota composition. Clin. Exp. Immunol. 2010, 163, 250–259. [Google Scholar] [CrossRef]
- Ramnani, P.; Chitarrari, R.; Tuohy, K.; Grant, J.; Hotchkiss, S.; Philp, K.; Campbell, R.; Gill, C.; Rowland, I. In vitro fermentation and prebiotic potential of novel low molecular weight polysaccharides derived from agar and alginate seaweeds. Anaerobe 2012, 18, 1–6. [Google Scholar] [CrossRef]
- Mills, E.J.; Chan, A.-W.; Wu, P.; Vail, A.; Guyatt, G.H.; Altman, D.G. Design, analysis, and presentation of crossover trials. Trials 2009, 10, 27. [Google Scholar] [CrossRef] [Green Version]
- David, L.A.; Maurice, C.F.; Carmody, R.N.; Gootenberg, D.B.; Button, J.E.; Wolfe, B.E.; Ling, A.V.; Devlin, A.S.; Varma, Y.; Fischbach, M.A.; et al. Diet rapidly and reproducibly alters the human gut microbiome. Nature 2014, 505, 559–563. [Google Scholar] [CrossRef] [Green Version]
- Feise, R.J. Do multiple outcome measures require p-value adjustment? BMC Med. Res. Methodol. 2002, 2, 8. [Google Scholar] [CrossRef] [Green Version]
- Friedewald, W.T.; Levy, R.I.; Fredrickson, D.S. Estimation of the concentration of low-density lipoprotein cholesterol in plasma, without use of the preparative ultracentrifuge. Clin. Chem. 1972, 18, 499–502. [Google Scholar] [CrossRef]
- Mori, T.A.; Croft, K.D.; Puddey, I.B.; Beilin, L.J. An improved method for the measurement of urinary and plasma F2-isoprostanes using gas chromatography-mass spectrometry. Anal. Biochem. 1999, 268, 117–125. [Google Scholar] [CrossRef]
- Dobiášová, M.; Frohlich, J. The plasma parameter log (TG/HDL-C) as an atherogenic index: Correlation with lipoprotein particle size and esterification rate inapob-lipoprotein-depleted plasma (FERHDL). Clin. Biochem. 2001, 34, 583–588. [Google Scholar] [CrossRef]
- Matthews, D.R.; Hosker, J.P.; Rudenski, A.S.; Naylor, B.A.; Treacher, D.F.; Turner, R.C. Homeostasis model assessment: Insulin resistance and beta-cell function from fasting plasma glucose and insulin concentration in man. Diabetologia 1985, 28, 412–419. [Google Scholar] [CrossRef] [PubMed] [Green Version]


| Placebo n = 21 | 2 g SXRG84/day n = 21 | 4 g SXRG84/day n = 22 | p-Value | |
|---|---|---|---|---|
| Gender, F, n (%) | 16 (76) | 11 (52) | 13 (59) | 0.259 |
| Age (years) | 55.0 (47.0, 60.5) | 54.0 (51.0, 57.5) | 54.0 (46.8, 63.3) | 0.788 |
| BMI (kg/m2) | 29.0 (26.0, 36.0) | 29.0 (27.5, 31.0) | 30.0 (26.8, 33.3) | 0.625 |
| Plasma Lipids | ||||
| Total Cholesterol (mmol/L) | 5.21 (4.75, 5.96) | 5.05 (4.48, 5.60) | 5.46 (5.06, 6.07) | 0.254 |
| Triglyceride (mmol/L) 1 | 1.07 (0.75, 1.56) | 1.08 (0.76, 1.56) | 1.10 (0.76, 1.82) | 0.685 |
| HDL (mmol/L) 1 | 1.52 (1.34, 2.13) | 1.34 (1.20, 1.84) | 1.43 (1.14, 1.93) | 0.397 |
| Cholesterol/HDL (mmol/L) 1 | 3.10 (2.55, 3.95) | 3.60 (2.60, 4.10) | 3.70 (2.85, 4.83) | 0.265 |
| LDL (mmol/L) | 3.10 (2.35, 3.90) | 3.00 (2.40, 3.45) | 3.35 (2.78, 3.88) | 0.412 |
| Non-HDL (mmol/L) | 3.45 (2.76, 4.35) | 3.55 (3.01, 3.96) | 3.84 (3.01, 4.46) | 0.335 |
| Atherogenic Index of Plasma (Log TG/HDL) | −0.16 (−0.34, 0.02) | −0.14 (−0.36, 0.12) | −0.12 (−0.32, 0.15) | 0.539 |
| Inflammation | ||||
| CRP (mg/L) * | 2 (1, 4) | 2 (1, 3) | 3 (2, 4) | 0.273 |
| Carbohydrate Metabolism | ||||
| Fasting Glucose * (mmol/L) | 5.00 (4.80, 5.15) | 5.10 (4.75, 5.40) | 5.15 (4.80, 5.73) | 0.417 |
| HOMA IR 1 | 2.10 (1.20, 3.09) | 1.93 (1.25, 3.14) | 2.11 (1.63, 4.39) | 0.401 |
| Glucose After 75 g Glucose load and 2 h 1 (mmol/L) | 4.60 (3.55, 5.70) | 5.50 (4.35, 6.50) | 4.75 (4.15, 6.30) | 0.110 |
| C-Peptide 1 (nmol/L) | 0.87 (0.53, 1.16) | 0.75 (0.59, 0.98) | 0.81 (0.66, 1.31) | 0.492 |
| Fasting Insulin 1 (mU/L) | 9.30 (5.30, 14.75) | 8.40 (5.60, 13.75) | 9.20 (7.20, 17.78) | 0.448 |
| Insulin After 75 g Glucose load and 2 h 1,§ (mU/L) | 29.40 (14.70, 68.50) | 29.40 (20.60, 63.60) | 36.30 (30.80, 129.20) | 0.275 |
| Overweight n = 30 | Obese n = 30 | p-Value | |
|---|---|---|---|
| Sex F, n (%) | 18 (60%) | 19 (63%) | 0.791 |
| Age * | 55 (49, 59) | 55 (50, 63) | 0.819 |
| BMI 1 (kg/m2) | 28 (26, 29) | 33 (31, 38) | 0.0001 |
| Lipids | |||
| Total Cholesterol (mmol/L) | 5.5 (4.9, 6.2) | 5.1 (4.5, 5.7) | 0.061 |
| Triglyceride 1 (mmol/L) | 1.1 (0.7, 1.5) | 1.2 (1.0, 1.7) | 0.343 |
| HDL 1 (mmol/L) | 1.5 (1.3, 2.0) | 1.4 (1.2, 1.7) | 0.130 |
| Chol/HDL 1 (mmol/L) | 3.7 (2.6, 4.5) | 3.6 (3.0, 4.2) | 0.874 |
| LDL (mmol/L) | 3.3 (2.7, 4.1) | 2.8 (2.3, 3.5) | 0.115 |
| Non-HDL (mmol/L) | 3.9 (3.2, 4.7) | 3.6 (3.0, 4.0) | 0.210 |
| Atherogenic Index of Plasma (Log TG/HDL) | −0.14 (−0.40, 0.11) | −0.04 (−0.26, 0.12) | 0.207 |
| CRP (mg/L) * | 1 (1, 2) | 3 (2, 4) | 0.0001 |
| U-Creatinine 1 (mmol/L) | 6.3 (4.4, 8.1) | 7.9 (6.0, 12.2) | 0.041 |
| U-Creatinine Excretion (mmol/d) | 11.5 (8.9, 14.8) | 12.2 (9.7, 18.1) | 0.154 |
| Urine Sodium Excretion (mmol/day) | 104 (77, 142) | 115 (87, 133) | 0.586 |
| Urine Potassium Excretion (mmol/day) | 73 (60, 83) | 75 (57, 88) | 0.641 |
| Na/K 2 | 1.5 (1.1, 1.9) | 1.5 (1.3, 2.0) | 0.749 |
| Fasting Glucose * (mmol/L) | 5.0 (4.7, 5.2) | 5.3 (5.0, 5.8) | 0.099 |
| HOMA 1 | 1.7 (1.1, 2.1) | 3.2 (2.0, 5.1) | 0.0001 |
| Glucose After 75 g Glucose load and 2 h 1 | 4.7 (4.0, 5.6) | 5.4 (4.2, 6.5) | 0.098 |
| C-Peptide 1 (nmol/L) | 0.7 (0.5, 0.8) | 1.1 (0.9, 1.4) | 0.0001 |
| Fasting Insulin 1 (mU/L) | 7.5 (5.1, 9.6) | 14.8 (9.1, 18.1) | 0.0001 |
| Insulin After 75 g Glucose load and 2 h 1 (mU/L) § | 29.9 (24.7, 42.0) | 56.5 (30.8, 129.2) | 0.073 |
| Overweight | Placebo n = 11 | 2 g SXRG84/day n = 10 | 4 g SXRG84/day n = 9 | p-Value |
|---|---|---|---|---|
| Baseline Total Cholesterol (mmol/L) | 5.56 (4.76, 6.33) | 5.15 (4.79, 5.90) | 5.59 (5.28, 6.35) | 0.485 |
| Baseline LDL Cholesterol (mmol/L) | 3.10 (2.40, 4.20) | 3.00 (2.50, 3.65) | 3.50 (3.30, 4.10) | 0.347 |
| Baseline Non-HDL Cholesterol (mmol/L) | 3.41 (2.75, 4.89) | 3.89 (3.19, 4.20) | 4.08 (3.65, 4.82) | 0.463 |
| Baseline Triglycerides (mmol/L) 1 | 1.02 (0.62, 1.09) | 1.32 (0.79, 2.10) | 1.37 (0.66, 1.65) | 0.288 |
| Baseline Atherogenic Index of Plasma (Log TG/HDL) | –0.29 (–0.52, -0.10) | –0.06 (–0.37, 0.25) | –0.08 (–0.50, 0.16) | 0.269 |
| Baseline C-Reactive Protein (mg/L) * | 1 (1, 2) | 1 (1, 2) | 2 (1, 5) | 0.117 |
| Baseline Fasting Glucose (mmol/L) * | 5.00 (4.60, 5.10) | 5.00 (4.68, 5.30) | 4.90 (4.75, 5.15) | 0.902 |
| Baseline Glucose after 75 g Glucose Load and 2 h (mmol/L) 1 | 4.10 (3.50, 5.00) | 5.50 (4.13, 6.65) | 4.70 (4.20, 5.25) | 0.062 |
| Baseline Insulin 2-h Response to OGTT (mU/L) § | 28.30 (15.20, 30.40) | 27.90 (11.50, 64.10) | 36.10 (30.95, 53.48) | 0.531 |
| Baseline HOMA IR 1 | 1.30 (0.86, 2.10) | 1.83 (1.21, 2.42) | 1.71 (1.23, 2.11) | 0.504 |
| Obese | Placebo n = 9 | 2 g SXRG84/day n = 9 | 4 g SXRG84/day n = 12 | p-Value |
| Baseline Total Cholesterol (mmol/L) Baseline | 4.92 (4.36, 5.82) | 4.76 (4.01, 5.73) | 5.31 (4.75, 5.92) | 0.487 |
| Baseline LDL Cholesterol (mmol/L) | 2.80 (2.30, 3.50) | 2.60 (2.30, 3.45) | 3.00 (2.40, 3.75) | 0.646 |
| Baseline Non-HDL Cholesterol (mmol/L) | 3.56 (2.85, 4.10) | 3.46 (2.82, 3.93) | 3.74 (3.23, 4.23) | 0.442 |
| Baseline Triglycerides (mmol/L) 1 | 1.39 (1.00, 1.71) | 1.08 (0.69, 1.56) | 1.10 (0.98, 1.95) | 0.667 |
| Baseline Atherogenic Index of Plasma (Log TG/HDL) | −0.01 (−0.23, 0.10) | 0.00 (−0.32, 0.11) | −0.15 (−0.26, 0.22) | 0.871 |
| Baseline C-Reactive Protein (mg/L) * | 4 (2, 10) | 2 (2, 6) | 3 (2, 4) | 0.628 |
| Baseline Fasting Glucose (mmol/L) baseline * | 5.00 (4.80, 5.95) | 5.30 (5.00, 5.60) | 5.65 (5.15, 6.28) | 0.237 |
| Baseline Glucose After 75 g Glucose Load and 2 h (mmol/L) baseline 1 | 5.40 (4.20, 6.50) | 5.50 (4.35, 6.80) | 5.30 (3.83, 7.05) | 0.772 |
| Baseline Insulin 2-h Response to OGTT (mU/L) ‡ | 80.45 (56.50, 104.40) | 27.20 (23.60, 30.80) | 129.2 (30.8, 220.5) | 0.379 |
| Baseline HOMA IR 1 | 3.11 (2.52, 4.49) | 2.73 (1.34, 3.93) | 3.89 (2.16, 7.87) | 0.266 |
| Genera | Contribution% | Cum.% | |
|---|---|---|---|
| Odoribacter | 9.32 | 9.32 | Increased across all groups slightly—no treatment effect |
| * Akkermansia (muciniphila) | 9.08 | 18.39 | Variable effect in some people. |
| Lachnospira | 9.06 | 27.46 | Significant decrease in placebo—no treatment effect |
| * Clostridium | 7.95 | 35.40 | Slight decrease in placebo—limited treatment effect |
| Parabacteroides | 7.84 | 43.24 | Variable trends—no evident treatment effect |
| Faecalibacterium | 7.35 | 50.60 | Random nonsignificant effects |
| * Pseudobutyrivibrio | 6.73 | 57.32 | Significant increases in 2 and 4 g treatments but not in placebo. |
| Catenibacterium | 5.17 | 62.49 | Random increase and decrease across groups |
| * Bifidobacterium (longum) | 5.05 | 67.54 | Apparent shifts in all groups but much higher in 2 g and 4 g treatments. |
| Desulfovibrio | 5.05 | 72.59 | Random increase and decrease across groups |
| Bacteroides | 4.76 | 77.35 | Decreased in all groups |
| Victivallis | 4.28 | 81.64 | Random increase and decrease across groups |
| Hespellia | 4.11 | 85.75 | Random increase and decrease across groups |
| Acidaminococcus | 3.59 | 89.34 | |
| Alloprevotella | 2.29 | 91.63 |
| AA Baseline to 6 Weeks (Placebo) n = 30 | AB Baseline to 12 Weeks (Placebo then Active) n = 30 | BB Baseline to 6 Weeks (Active) n = 34 | BA Baseline to 12 Weeks (Active then Placebo) n = 34 | p-Value * | |
|---|---|---|---|---|---|
| Gender, F (%) | 15 (50%) | 15 (50%) | 18 (53%) | 18 (53%) | 0.814 |
| Age | 51.7 ± 15 | 51.7 ± 15 | 52.2 ± 11 | 52.2 ± 11 | 0.887 |
| BMI (kg/m2) | |||||
| Baseline § | 28 (26, 31) | 28. (26, 31) | 29 (27, 31) | 29 (27, 31) | 0.101 |
| Post | 29 (26, 31) | 29 (26, 31) | 29 (28, 31) | 29 (27, 31) | 0.363 |
| Change | 0 (0, 1) | 0 (0, 0) | 0 (0, 0) | 0 (−1, 0) | |
| Waist Circumference (cm) | |||||
| Baseline | 95 (85, 104) | 95 (85, 104) | 96 (92, 105) | 96 (92, 105) | 0.257 |
| Post | 97 (85, 106) | 99 (87, 107) | 100 (93, 106) | 99 (92, 107) | 0.660 |
| Change | 1 (−1, 4) | 2 (−1, 5) | 3 (−1, 5) | 1 (−3, 4) | |
| Systolic BP (mmHg) | |||||
| Baseline § | 132 (117, 142) | 132 (117, 142) | 130 (122, 139) | 130 (122, 139) | 0.850 |
| Post | 127 (114, 141) | 122 (114, 139) | 129 (119, 135) | 125 (114, 136) | 0.809 |
| Change | −5.0 (−10.8, 1.8) | −6.0 (−13.5, 1.0) | −4.0 (−14.5, 4.8) | −6.0 (−16.3, 0.5) | |
| Diastolic BP (mmHg) | |||||
| Baseline | 82 (71, 89) | 82 (71, 89) | 83 (75, 94) | 83 (75, 94) | 0.524 |
| Post | 79 (72, 87) | 76 (70, 85) | 80 (73, 87) | 79 (67, 87) | 0.653 |
| Change | −1.5 (−8.0, 2.8) | −4.0 (−8.0, 3.0) | −4.0 (−8.0, 4.0) | −3.0 (−10.8, 1.0) |
| AA Baseline to 6 weeks (Placebo) n = 30 | AB Baseline to 12 weeks (Placebo then Active) n = 30 | BB Baseline to 6 weeks (Active) n = 34 | BA Baseline to 12 weeks (Active then Placebo) n = 34 | p-Value * | |
|---|---|---|---|---|---|
| Total Cholesterol (mmol/L) | |||||
| Baseline | 5.2 (4.5, 5.9) | 5.2 (4.5, 5.9) | 5.2 (4.5, 6.1) | 5.2 (4.5, 6.1) | 0.697 |
| Post | 4.6 (3.9, 5.4) | 4.8 (4.2, 5.7) | 5.3 (4.2, 5.9) | 5.0 (4.4, 5.9) | 0.120 |
| Change | −0.3 (−1.0, 0.1) | −0.1 (−0.7, 0.6) | −0.1 (−0.6, 0.4) | −0.3 (−1.0, 0.2) | |
| HDL Cholesterol (mmol/L) | |||||
| Baseline § | 1.3 (1.0, 1.6) | 1.3 (1.0, 1.6) | 1.3 (0.9, 1.8) | 1.3 (0.9, 1.8) | 0.810 |
| Post | 1.1 (1.0, 1.7) | 1.2 (1.0, 1.7) | 1.3 (0.9, 1.9) | 1.2 (0.9, 1.6) | 0.493 |
| Change | −0.0 (−0.2, 0.1) | −0.1 (−0.3, 0.2) | −0.0 (−0.2, 0.1) | −0.2 (−0.3, 0.1) | |
| Triglycerides (mmol/L) | |||||
| Baseline § | 1.0 (0.7, 1.2) | 1.0 (0.7, 1.2) | 1.2 (0.8, 1.8) | 1.2 (0.8, 1.8) | 0.112 |
| Post | 0.8 (0.7, 1.3) | 1.1 (0.7, 1.3) | 1.0 (0.8, 1.4) | 1.0 (0.8, 1.8) | 0.663 |
| Change | −0.1 (−0.3, 0.2) | 0.0 (−0.2, 0.3) | −0.1 (−0.4, 0.2) | −0.1 (−0.4, 0.1) | |
| Non-HDL Cholesterol (mmol/L) | |||||
| Baseline | 3.7 (3.0, 4.5) | 3.7 (3.0, 4.5) | 4.0 (3.1, 4.4) | 4.0 (3.1, 4.4) | 0.651 |
| Post | 3.4 (2.6, 3.9) | 3.6 (2.7, 4.3) | 3.8 (3.0, 4.6) | 3.7 (3.3, 4.3) | 0.086 |
| Change | −0.3 (−0.9, 0.1) | −0.1 (−0.7, 0.6) | 0.0 (−0.4, 0.3) | −0.2 (−0.7, 0.4) | |
| LDL Cholesterol (mmol/L) | |||||
| Baseline | 3.3 (2.6, 3.9) | 3.3 (2.6, 3.9) | 3.3 (2.6, 3.9) | 3.3 (2.6, 3.9) | 0.906 |
| Post | 2.9 (2.2, 3.4) | 3.2 (2.2, 3.9) | 3.4 (2.4, 3.7) | 3.2 (2.6, 3.7) | 0.103 |
| Change | −0.3 (−0.8, 0.1) | −0.2 (−0.7, 0.5) | −0.1 (−0.5, 0.3) | −0.1 (−0.6, 0.3) | |
| Fasting Glucose (mmol/L) | |||||
| Baseline ¥ | 4.5 (4.1, 5.3) | 4.5 (4.1, 5.3) | 4.9 (4.6, 5.3) | 4.9 (4.6, 5.3) | 0.071 |
| Post | 4.5 (4.1, 5.0) | 4.8 (4.1, 5.7) | 5.0 (4.2, 5.5) | 4.8 (4.3, 5.5) | 0.369 |
| Change | −0.1 (−0.4, 0.4) | 0.2 (−0.4, 1.0) | −0.0 (−0.5, 0.4) | −0.1 (−0.8, 0.3) | |
| 2-h Glucose Response to OGTT (mmol/L) | |||||
| Baseline ¥ | 4.9 (4.1, 5.7) | 4.9 (4.1, 5.7) | 4.8 (4.0, 6.1) | 4.8 (4.0, 6.1) | 0.844 |
| Post | 4.5 (4.2, 5.7) | 5.1 (4.3, 5.8) | 4.5 (3.8, 5.9) | 5.2 (4.0, 6.8) | 0.629 |
| Change | 0.0 (−0.8, 0.5) | 0.0 (−0.5, 0.6) | −0.1 (−1.0, 1.0) | 0.1 (−1.1, 1.2) |
| AA Baseline to 6 Weeks (Placebo) n = 30 | AB Baseline to 12 Weeks (Placebo then Active) n = 30 | BB Baseline to 6 Weeks (Active) n = 34 | BA Baseline to 12 Weeks (Active then Placebo) n = 34 | p-Value * | |
|---|---|---|---|---|---|
| C-Reactive Protein (mg/L) | |||||
| Baseline ¥ | 0 (0, 4.5) | 0 (0, 4.5) | 0 (0, 0.6) | 0 (0, 0.6) | 0.409 |
| Post | 0 (0, 6.9) | 0.1 (0, 5.1) | 0 (0, 4.5) | 0 (0, 0.2) | 0.240 |
| Change | 0 (0, 1.4) | 0 (−0.5, 0.6) | 0 (0, 3.5) | 0 (0, 0) | |
| IFN-gamma (pg/mL) | |||||
| Baseline ¥ | 3.2 (1.8, 5.4) | 3.2 (1.8, 5.4) | 3.4 (1.8, 4.8) | 3.4 (1.8, 4.8) | 0.877 |
| Post | 3.0 (2.2, 5.8) a | 2.7 (1.9, 4.0) b | 3.6 (2.0, 4.2) a,b | 2.3 (1.3, 3.1) b | 0.014 |
| Change | 0.4 (−0.6, 1.6) | −0.4 (−2.2, 0.6) | 0.2 (−1.3, 0.8) | −1.0 (−2.0, 0.0) | |
| IL-1 beta (pg/mL) | |||||
| Baseline ‡ | 17.5 (9.4, 27.7) | 17.5 (9.4, 27.7) | 14.7 (9.9, 23.3) | 14.7 (9.9, 23.3) | 0.547 |
| Post | 17.6 (13.0, 25.1) a | 15.2 (9.9, 21.7) b | 16.4 (13.3, 21.3) a,b | 10.6 (8.0, 18.3) b | 0.005 |
| Change | −0.3 (−3.9, 8.9) | −1.1 (−9.0, 4.6) | 1.4 (−5.9, 5.9) | −3.7 (−11.0, 0.8) | |
| IL-6 (pg/mL) | |||||
| Baseline ‡ | 11.8 (8.3, 20.8) | 11.8 (8.3, 20.8) | 12.9 (7.9, 22.3) | 12.9 (7.9, 22.3) | 0.896 |
| Post | 14.8 (10.5, 19.5) | 12.0 (9.4, 16.5) | 13.8 (9.3, 17.1) | 10.3 (7.0, 16.1) | 0.226 |
| Change | 1.3 ± 8.1 | −2.0 ± 7.8 | −1.5 ± 8.7 | −2.3 ± 8.0 | |
| TNF-alpha (pg/mL) | |||||
| Baseline § | 7.7 (4.0, 12.1) | 7.7 (4.0, 12.1) | 5.4 (2.9, 10.0) | 5.4 (2.9, 10.0) | 0.528 |
| Post | 8.1 (6.3, 16.9) a | 8.0 (3.6, 13.1) b | 8.7 (6.1, 11.6) a,b | 4.5 (2.8, 10.1) b | 0.005 |
| Change | 1.7 (−1.4, 7.6) | 0.3 (−2.0, 3.3) | 1.3 (−2.3, 5.0) | −1.2 (−6.2, 2.4) | |
| IL-10 (pg/mL) | |||||
| Baseline ¥ | 1.3 (0.8, 2.4) | 1.3 (0.8, 2.4) | 1.1 (0.7, 2.1) | 1.1 (0.7, 2.1) | 0.780 |
| Post | 1.5 (1.2, 2.5) a | 1.3 (0.8, 2.2) b,c | 1.6 (1.2, 2.0) a,b | 1.0 (0.7, 1.9) c | 0.009 |
| Change | 0.3 (−0.3, 1.1) | 0.0 (−0.3, 0.5) | 0.1 (−0.4, 0.8) | −0.2 (−0.9, 0.3) | |
| IL-8 (pg/mL) | |||||
| Baseline § | 5.2 (3.5, 10.1) | 5.2 (3.5, 10.1) | 4.7 (2.7, 8.5) | 4.7 (2.7, 8.5) | 0.607 |
| Post | 5.7 (3.9, 8.8) | 3.9 (3.0, 6.9) | 5.2 (4.0, 7.0) | 3.9 (1.7, 9.2) | 0.254 |
| Change | 0.2 (−1.3, 3.0) | −1.1 (−2.8, 0.2) | −0.2 (−2.6, 2.6) | −0.5 (−2.1, 0.9) |
| Baseline Variable | Genus | Spearman’s Correlation Coefficient | p-Value |
|---|---|---|---|
| Weight (kg) | Flavonifractor | −0.282 | 0.039 |
| Intestinibacter | −0.413 | 0.002 | |
| Megasphaera | 0.587 | 0.001 | |
| Thalassospira | −0.538 | 0.001 | |
| BMI (kg/m2) | Anaerotruncus | −0.295 | 0.027 |
| Blautia | −0.289 | 0.028 | |
| Intestinibacter | −0.325 | 0.016 | |
| Megasphaera | −0.519 | 0.004 | |
| Ordoribacter | 0.290 | 0.048 | |
| Romboutsia | 0.288 | 0.047 | |
| Waist Circumference (cm) | Anaerotruncus | −0.360 | 0.007 |
| Bifidobacterium | −0.315 | 0.048 | |
| Flavobacterium | −0.333 | 0.044 | |
| Flavonifractor | −0.363 | 0.007 | |
| Intestinibacter | −0.479 | 0.000 | |
| Megasphaera | 0.476 | 0.009 | |
| Thalassospira | −0.464 | 0.005 | |
| CRP | Erysipelatoclostridium | 0.297 | 0.031 |
| Parasutterella | 0.398 | 0.010 | |
| Subdoligranulum | 0.317 | 0.017 | |
| Total Cholesterol | Megasphaera | −0.375 | 0.045 |
| Mogibacterium | −0.313 | 0.032 | |
| Parabacteroides | −0.303 | 0.025 | |
| HDL Cholesterol | Anaerotruncus | 0.318 | 0.017 |
| Intestinibacter | 0.308 | 0.024 | |
| Megasphaera | −0.482 | 0.008 | |
| Thalassospira | 0.519 | 0.001 | |
| Triglycerides | Anaerotruncus | −0.328 | 0.014 |
| Barnesiella | −0.365 | 0.015 | |
| Corynebacterium | 0.373 | 0.016 | |
| Flavobacterium | −0.362 | 0.025 | |
| Flavonifractor | −0.315 | 0.020 | |
| Intestinibacter | −0.433 | 0.001 | |
| Pseudoflavonifractor | −0.422 | 0.010 | |
| Sarcina | −0.360 | 0.006 | |
| Thalassospira | −0.380 | 0.022 | |
| Non-HDL Cholesterol | Parabacteroides | −0.330 | 0.014 |
| LDL Cholesterol | Collinsella | −0.272 | 0.045 |
| Parabacteroides | −0.325 | 0.015 | |
| Fasting Glucose | Alloprevotella | −0.529 | 0.043 |
| Bacteroides | 0.278 | 0.034 | |
| Erysipelatoclostridium | 0.289 | 0.036 | |
| Flavonifractor | −0.480 | 0.000 | |
| Haemophilus | −0.362 | 0.010 | |
| Intestinibacter | −0.277 | 0.043 | |
| Megamonas | −0.810 | 0.015 | |
| Pseudoflavonifractor | −0.504 | 0.002 | |
| Subdoligranulum | 0.280 | 0.036 | |
| Veillonella | −0.305 | 0.030 | |
| 2-h Glucose Post Oral Glucose Tolerance Test | Haemophilus | −0.374 | 0.014 |
| Intestinibacter | −0.284 | 0.048 | |
| IFNγ | Clostridium | −0.271 | 0.045 |
| Granulicatella | 0.467 | 0.012 | |
| IL-1β | Actinomyces | 0.301 | 0.034 |
| Clostridium | −0.351 | 0.008 | |
| Corynebacterium | 0.324 | 0.039 | |
| Granulicatella | 0.447 | 0.015 | |
| Prevotella | 0.330 | 0.028 | |
| IL-6 | Adlercreutzia | 0.300 | 0.048 |
| Corynebacterium | 0.348 | 0.028 | |
| Granulicatella | 0.386 | 0.042 | |
| TNF-α | Clostridium | −0.321 | 0.017 |
| Granulicatella | 0.428 | 0.023 | |
| Prevotella | 0.354 | 0.018 | |
| IL-10 | Clostridium | −0.321 | 0.016 |
| Corynebacterium | 0.370 | 0.017 | |
| Granulicatella | 0.428 | 0.020 | |
| Parabacteroides | −0.280 | 0.038 | |
| Prevotella | 0.361 | 0.016 | |
| Thalassospira | −0.446 | 0.006 | |
| IL-8 | Adlercreutzia | 0.311 | 0.042 |
| Alistipes | 0.296 | 0.035 | |
| Bifidobacterium | 0.317 | 0.049 | |
| Flavonifractor | 0.278 | 0.046 | |
| Granulicatella | 0.464 | 0.015 |
| Cytokine | Genus | Spearman Correlation Coefficient | p-Value |
|---|---|---|---|
| IFN-γ | Collinsella | −0.298 | 0.023 |
| Oscillibacter | −0.297 | 0.023 | |
| Romboutsia | −0.278 | 0.034 | |
| IL-1β | Collinsella | −0.299 | 0.023 |
| Lactobacillus | −0.289 | 0.028 | |
| TNF-α | Bacteroides | −0.332 | 0.011 |
| Dorea | −0.320 | 0.014 | |
| Peptococcus | 0.270 | 0.040 | |
| IL-10 | Bacteroides | −0.369 | 0.004 |
| Dorea | −0.300 | 0.022 |
| Study 1 n = 64 | Study 2 n = 64 | p-Value | |
|---|---|---|---|
| Gender, F, M (%) | 42, (63%) | 33, (52%) | 0.198 |
| Age (years) | 54 ± 10 | 52 ± 13 | 0.326 |
| Weight (kg) § | 85 (74, 101) | 84 (76, 95) | 0.584 |
| BMI ¥ (kg/m2) | 29 (26, 33) | 29 (27, 31) | 0.471 |
| Total Cholesterol (mmol/L) | 5.3 ± 0.9 | 5.3 ± 1.2 | 0.750 |
| HDL Cholesterol (mmol/L) ‡ | 1.4 (1.2, 2.0) | 1.3 (1.0, 1.7) | 0.007 |
| Non-HDL Cholesterol (mmol/L) ‡ | 3.6 (3.1, 4.1) | 3.9 (3.0, 4.4) | 0.180 |
| LDL Cholesterol (mmol/L) ‡ | 3.0 (2.4, 3.6) | 3.3 (2.6, 3.9) | 0.143 |
| Triglycerides (mmol/L) § | 1.1 (0.7, 1.6) | 1.1 (0.8, 1.6) | 0.898 |
| Fasting Glucose (mmol/L) ¥ | 5.1 (4.8, 5.4) | 4.8 (4.3, 5.2) | 0.004 |
| Glucose 2-h Post OGTT (mmol/L) ¥ | 4.7 (4.0, 6.3) | 4.8 (4.0, 5.8) | 0.837 |
| CRP (mg/L) ¥ | 2 (1, 4) | 0 (0, 3) | 0.000 |
| Untransformed | Square Root | Presence/Absence | |
|---|---|---|---|
| Phylum | |||
| Class | |||
| Order | General spread | General spread | none |
| Family | General spread but similar to Genus | ||
| Genus MOST DATA HIGHEST RESOLUTION | General spread—but most hopeful with just T4 visible | General spread | none |
| Select > 10% contribution general spread but similar to above = any change is linked to dominant taxa shifts | |||
| Species | Less pattern than lower taxonomic levels —potentially due to data loss |
| Row Labels | Number Categories | TOTAL Count |
|---|---|---|
| superkingdom | 3 | 6,377,013 |
| superphylum | 3 | 1,763,398 |
| phylum | 15 | 6,376,988 |
| class | 25 | 6,376,121 |
| order | 34 | 6,357,174 |
| family | 71 | 6,089,366 |
| genus | 191 | 5,601,385 |
| species | 221 | 2,107,685 |
| species_group | 3 | 444 |
| subclass | 8 | 462,343 |
| no_rank (total) | 13 | 6,518,503 |
Publisher’s Note: MDPI stays neutral with regard to jurisdictional claims in published maps and institutional affiliations. |
© 2022 by the authors. Licensee MDPI, Basel, Switzerland. This article is an open access article distributed under the terms and conditions of the Creative Commons Attribution (CC BY) license (https://creativecommons.org/licenses/by/4.0/).
Share and Cite
Roach, L.A.; Meyer, B.J.; Fitton, J.H.; Winberg, P. Improved Plasma Lipids, Anti-Inflammatory Activity, and Microbiome Shifts in Overweight Participants: Two Clinical Studies on Oral Supplementation with Algal Sulfated Polysaccharide. Mar. Drugs 2022, 20, 500. https://doi.org/10.3390/md20080500
Roach LA, Meyer BJ, Fitton JH, Winberg P. Improved Plasma Lipids, Anti-Inflammatory Activity, and Microbiome Shifts in Overweight Participants: Two Clinical Studies on Oral Supplementation with Algal Sulfated Polysaccharide. Marine Drugs. 2022; 20(8):500. https://doi.org/10.3390/md20080500
Chicago/Turabian StyleRoach, Lauren A., Barbara J. Meyer, J. Helen Fitton, and Pia Winberg. 2022. "Improved Plasma Lipids, Anti-Inflammatory Activity, and Microbiome Shifts in Overweight Participants: Two Clinical Studies on Oral Supplementation with Algal Sulfated Polysaccharide" Marine Drugs 20, no. 8: 500. https://doi.org/10.3390/md20080500
APA StyleRoach, L. A., Meyer, B. J., Fitton, J. H., & Winberg, P. (2022). Improved Plasma Lipids, Anti-Inflammatory Activity, and Microbiome Shifts in Overweight Participants: Two Clinical Studies on Oral Supplementation with Algal Sulfated Polysaccharide. Marine Drugs, 20(8), 500. https://doi.org/10.3390/md20080500