Article

Anti-Obesity and Gut Microbiota Regulation Effects of Phospholipids from the Eggs of Crab, Portunus Trituberculatus, in High Fat Diet-Fed Mice

1
College of Life and Environmental Science, Wenzhou University, Wenzhou 325035, China
2
Zhejiang Provincial Key Laboratory for Water Environment and Marine Biological Resources Protection, Wenzhou University, Wenzhou 325035, China
3
National Engineering Research Center for Maine Aquaculture, Zhejiang Ocean University, Zhoushan 316022, China
4
Wenzhou Academy of Agricultural Science, Wenzhou Characteristic Food Resources Engineering and Technology Research Center, Wenzhou 325006, China
*
Author to whom correspondence should be addressed.
Mar. Drugs 2022, 20(7), 411; https://doi.org/10.3390/md20070411
Submission received: 27 May 2022 / Revised: 16 June 2022 / Accepted: 17 June 2022 / Published: 23 June 2022

Abstract

:
There are resourceful phospholipids in the eggs of the crab, Portunus trituberculatus (Pt-PL). However, their components and bioactivities regarding obesity were unclear. Here, we investigated the composition of Pt-PL and their fatty acids. Moreover, its effects on obesity and gut microbiota were also evaluated in high fat diet (HFD)-fed mice. The results showed that Pt-PL contained 12 kinds of phospholipids, mainly including phosphatidylcholine (PC, 32.28%), phosphatidylserine (PS, 26.51%), phosphatidic acid (PA, 19.61%), phosphatidylethanolamine (PE, 8.81%), and phosphatidylinositol (PI, 7.96%). Polyunsaturated fatty acids (PUFAs) predominated in the fatty acids components of Pt-PL, especially eicosapentaenoic acid (EPA) and docosahexaenoic acid (DHA). Animal experiments demonstrated that Pt-PL significantly alleviated body weight gain, adipose gain, hepatic gain, fasting blood glucose, serum insulin, lipid levels in serum and the liver, and systematic inflammation in HFD-fed mice. Furthermore, Pt-PL regulated gut microbiota, especially in a dramatic reduction in the ratio of Firmicutes to Bacteroidetes at phylum level, as well as significant amelioration in their subordinate categories. Pt-PL reduced fecal lipopolysaccharide and total bile acids, and elevated fecal short chain fatty acid (SCFA) concentrations, particularly acetate and butyrate. These findings suggest that Pt-PL possesses anti-obesity effects and can alter gut microbiota owing to the abundance of PUFAs. Therefore, Pt-PL may be developed as an effective food supplement for anti-obesity and regulation of human gut health.

1. Introduction

Obesity is one of the most serious global health metabolic disorders, with an incidence that increases rapidly every year and is correlated with many chronic diseases, such as hyperlipidemia, hyperglycemia, low-grade inflammation, type 2 diabetes, cardiovascular disease, etc. [1,2]. Therefore, it has been a major challenge to learn how to curb the development of obesity and how to prevent obesity and its related symptoms. Several studies have proved that gut microbiota are major factors increasing incidence of obesity through affecting nutrient digestion, energy metabolism, chronic inflammation, or other metabolic diseases [3,4]. It has been reported that the increased ratio of Firmicutes to Bacteroidetes and disturbance of Akkermansia, Bifidobacterium, Desulfovibrionales, Lactobacillales or other bacteria could alter the development of obesity in humans and rodents [5,6,7]. However, other papers have exhibited the fact that the occurrence of obesity was unrelated to the abundances of Firmicutes and Bacteroidetes [8], suggesting that obesity may be affected by other factors. Moreover, obese mice tend to have a low concentration of short chain fatty acids (SCFAs) and high levels of lipopolysaccharide (LPS) and total bile acids [9,10]. Evidence suggests that treatment with LPS could promote adipocyte differentiation and insulin resistance in mice adipose cells [11], while dietary supplementation with SCFAs could alleviate obesity in HFD mice and regulate gut microbiota [12]. These studies suggested that gut microbiota could administer obesity and its related diseases.
The swimming crab, Portunus trituberculatus, is widely distributed in the Western Pacific coast and has been a prominent economic marine product because of its high nutritional value and great production. More than 500,000 tons were produced in China both in 2019 and 2020 [13]. There are several papers that have analyzed the gene sequence or aquaculture of P. trituberculatus [14,15], but little research has been conducted on its processing or utilization. Our previous studies showed that egg oil isolated from P. trituberculatus contains abundant phospholipids (Pt-PL), and the egg oil could improve insulin resistance and mitigate obesity through regulating gut microbiota [16,17]. Recently, we revealed that phosphatidylserine from P. trituberculatus eggs (Pt-PS) could improve insulin resistance by activation of the insulin signal pathway and amelioration of gut microbiota dysbiosis [18]. However, it is unclear what the components of the phospholipids in P. trituberculatus eggs are and their fatty acid composition. The bioactivity of Pt-PL has also not been investigated. Here, we isolated Pt-PLs and analyzed their fatty acids composition, and carried out research into their anti-obesity effects and their effects on gut microbiota, with a view to promoting the exploitation and utilization of this marine product.

2. Results

2.1. The Composition of Phospholipids of Pt-PL and Their Fatty Acids

As shown in Table 1, we detected 12 kinds of phospholipids in Pt-PL. The main phospholipids in Pt-PL contained phosphatidylcholine (PC, 32.28%), PS (26.51%), phosphatidic acid (PA, 19.61%), phosphatidylethanolamine (PE, 8.81%), and phosphatidylinositol (PI, 7.96%), in which PC accounted for the highest proportion. There were other phospholipids in Pt-PL, which all composed less than 1%, except lysophosphatidylcholine 2.87%, such as cardiolipin (CL), phosphatidylglycerol (PG), sphingomyelin (SM), and several lysophospholipids.
We subsequently measured fatty acids composition of the 5 main phospholipids in Pt-PL (Table 2). In PA, there were 6 kinds of fatty acids, in which unsaturated fatty acids (UFA) accounted for 95.70% and they were all polyunsaturated fatty acids (PUFA). Uppermost, EPA accounted for 51.84% in the fatty acids of Pt-PL, while DHA accounted for 8.95%.
There were 18 kinds of fatty acids in PC, in which UFA accounted for 97.55% and PUFA accounted for 78.66%. Importantly, the fatty acids in PC contained 28.86% EPA and 26.92% DHA.
We detected 13 kinds of fatty acids in PE, and PUFA accounted for 95.65%. The proportion of EPA and DHA was 53.76% and 19.48%, respectively.
In PI, there were only 4 kinds of fatty acids and they were all PUFAs. EPA and DHA accounted for 62.16% in total.
In our previous study, we separated PS from Pt-PL. The main composition of fatty acids in PS were UFA (69.29), in which 18.70% was EPA and 30.43% was DHA [18]. Especially notable was the fact that there were high concentrations of bacterial acids (C17:0 and C17:1, 12.50% in total).

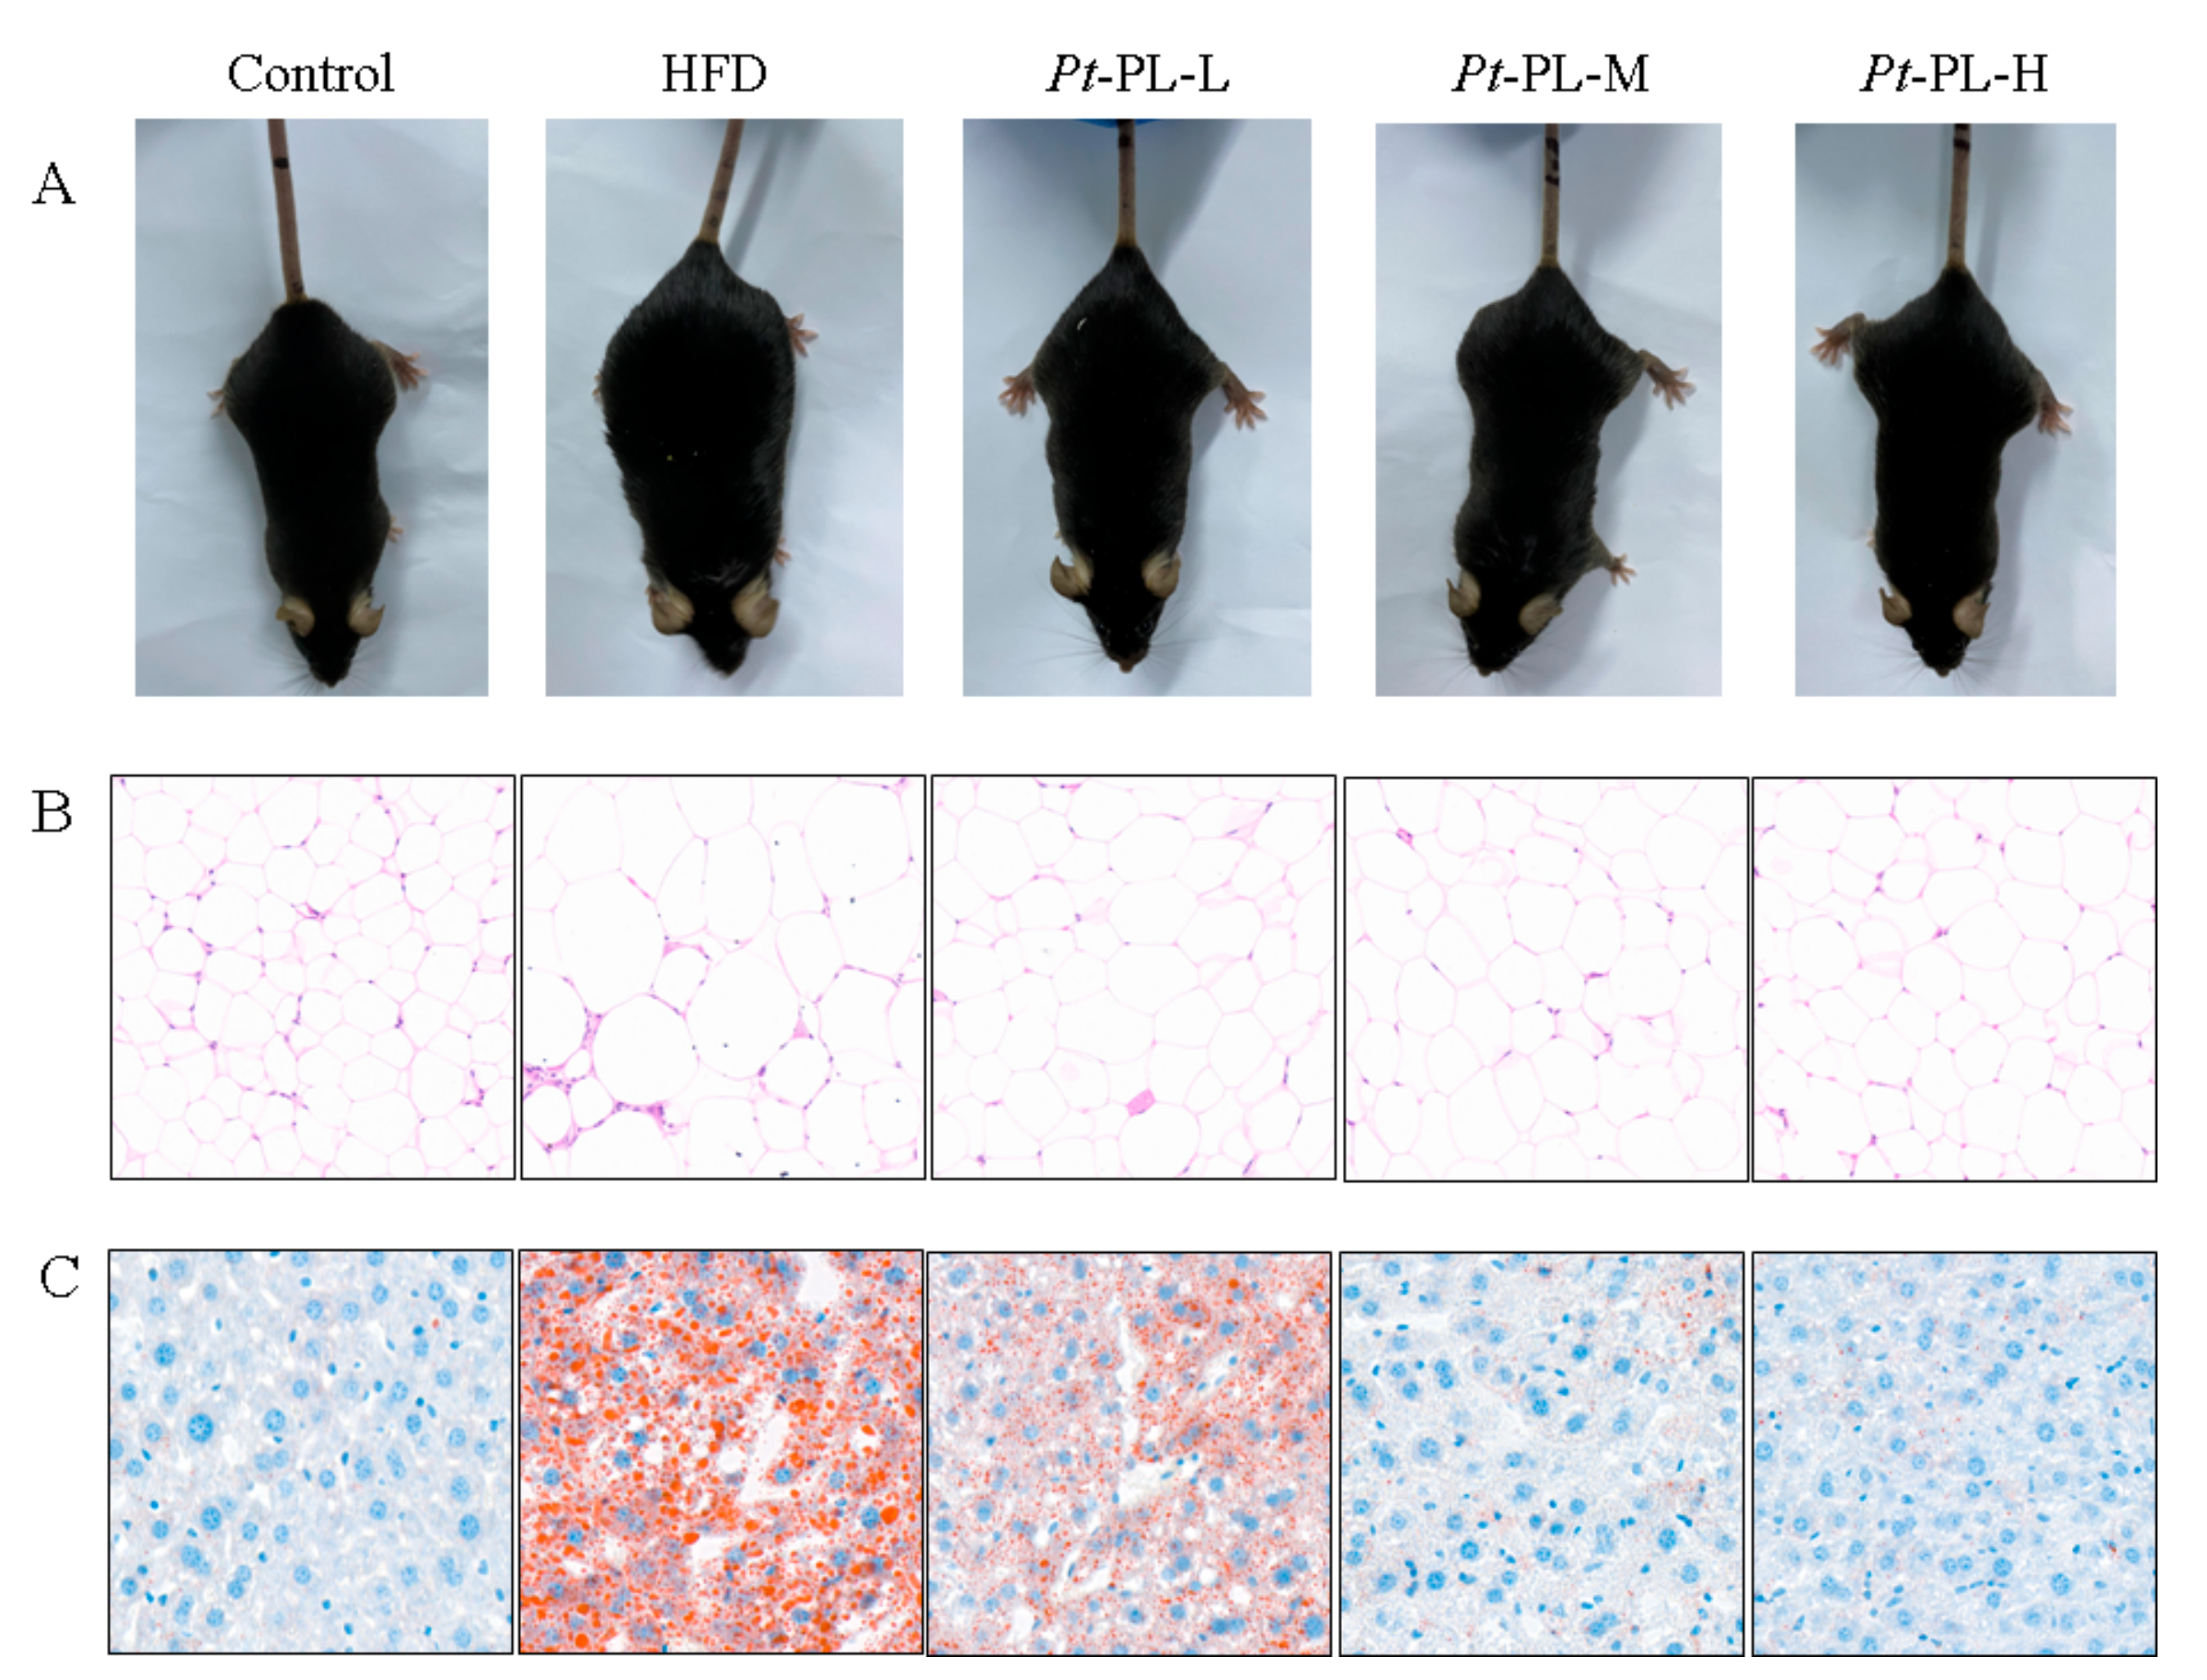
2.2. Effects of Pt-PL on Obesity

In the animal experiment, the food intake of HFD-fed mice was lower than that of control mice, while the calorie intake of HFD animals was higher than that of the control group (p < 0.05), which suggested that the HFD-fed mice ingested more calories than the control mice (Table 3). The HFD mice showed an 88.37% increase in body weight gain, compared with that in the control group. When treated with Pt-PL, the body weight gain was significantly reduced by 11.97%, 30.58%, and 22.48% in the low, middle, and high dosage groups of the Pt-PL groups, compared with the HFD group, respectively (p < 0.05). As compared with the control group, the HFD group displayed an evidently higher adipose weight (p < 0.05), including perirenal, epididymal, and abdominal subcutaneous adipose. After treatment with Pt-PL, the 3 aforementioned fat weights were all significantly decreased in the 3 dosage Pt-PL groups (p < 0.05). In addition, body weight gain and fat weights in the Pt-PL-H group were remarkably lowered compared with those in the Pt-PL-L group (p < 0.05). Figure 1 A and B show that HFD caused a remarkable increase in body form and epididymal adipose cell size, which were obviously decreased in the three Pt-PL groups compared with the HFD group. These results indicated that Pt-PL exhibited marked anti-obesity activity.

2.3. Effects of Pt-PL on Serum Lipids and Hepatic Lipids

As shown in Table 3, serum TC and TG contents were significantly reduced both in the Pt-PL-M and the Pt-PL-H groups, compared with the HFD group (p < 0.05), while no significant difference occurred between the HFD and Pt-PL-L groups. The mice in the 3 Pt-PL groups that received dosages all showed significant decreases in serum HDL-C level and increases in serum LDL-C level, compared with HFD-fed mice (p < 0.05). Additionally, compared with the Pt-PL-L group, serum TC and TG levels were significantly reduced in both the Pt-PL-M and Pt-PL-H groups (p < 0.05), while serum HDL-C concentration obviously increased (p < 0.05). However, there were no significant differences in serum LDL-C content among the 3 Pt-PL groups. These results indicate that Pt-PL can significantly inhibit hyperlipemia in obese mice.
Compared with the HFD group, hepatic weights were significantly reduced by 22.75%, 42.65%, and 46.45% in the 3 Pt-PL groups (Table 3, p < 0.05), respectively. Hepatic TG content was significantly reduced in the 3 Pt-PL groups compared with the HFD group (p < 0.05). The mice in the Pt-PL-M and Pt-PL-H groups displayed marked reduction in hepatic TC levels compared with the HFD group (p < 0.05), while there was no significant difference between the Pt-PL-L and HFD groups. Furthermore, as shown in Figure 1 C, the lipid droplet number in the liver significantly decreased in the 3 Pt-PL groups compared with the HFD group, and the decrease of lipid droplet number in Pt-PL-M and Pt-PL-H were more obvious than for the Pt-PL-L group. These results indicated that Pt-PL could decrease lipid accumulation in the liver of obese mice.

2.4. Effects of Pt-PL on Blood Glucose, Insulin, and Inflammatory Cytokines

As shown in Table 3, the mice in the 3 Pt-PL groups showed significant decreases in fasting blood glucose and serum insulin levels (p < 0.05). Interestingly, the reductions of the 2 parameters in the Pt-PL-M and Pt-PL-H groups were more remarkable than those in the Pt-PL-L group (p < 0.05).
We also detected inflammatory cytokines in the serum of HFD mice. Table 3 shows that middle and high dosages of Pt-PL could significantly lower serum TNF-α concentration (p < 0.05), but a low dosage of Pt-PL could not. Serum IL-6 level was markedly decreased in the 3 Pt-PL groups, compared with HFD mice (p < 0.05). Serum IL-1β and IL-10 levels were dramatically reduced and increased in the Pt-PL-H group compared with HFD mice, respectively (p < 0.05). However, there were no significant changes of the 2 parameters between the Pt-PL-L, Pt-PL-M, and HFD groups.

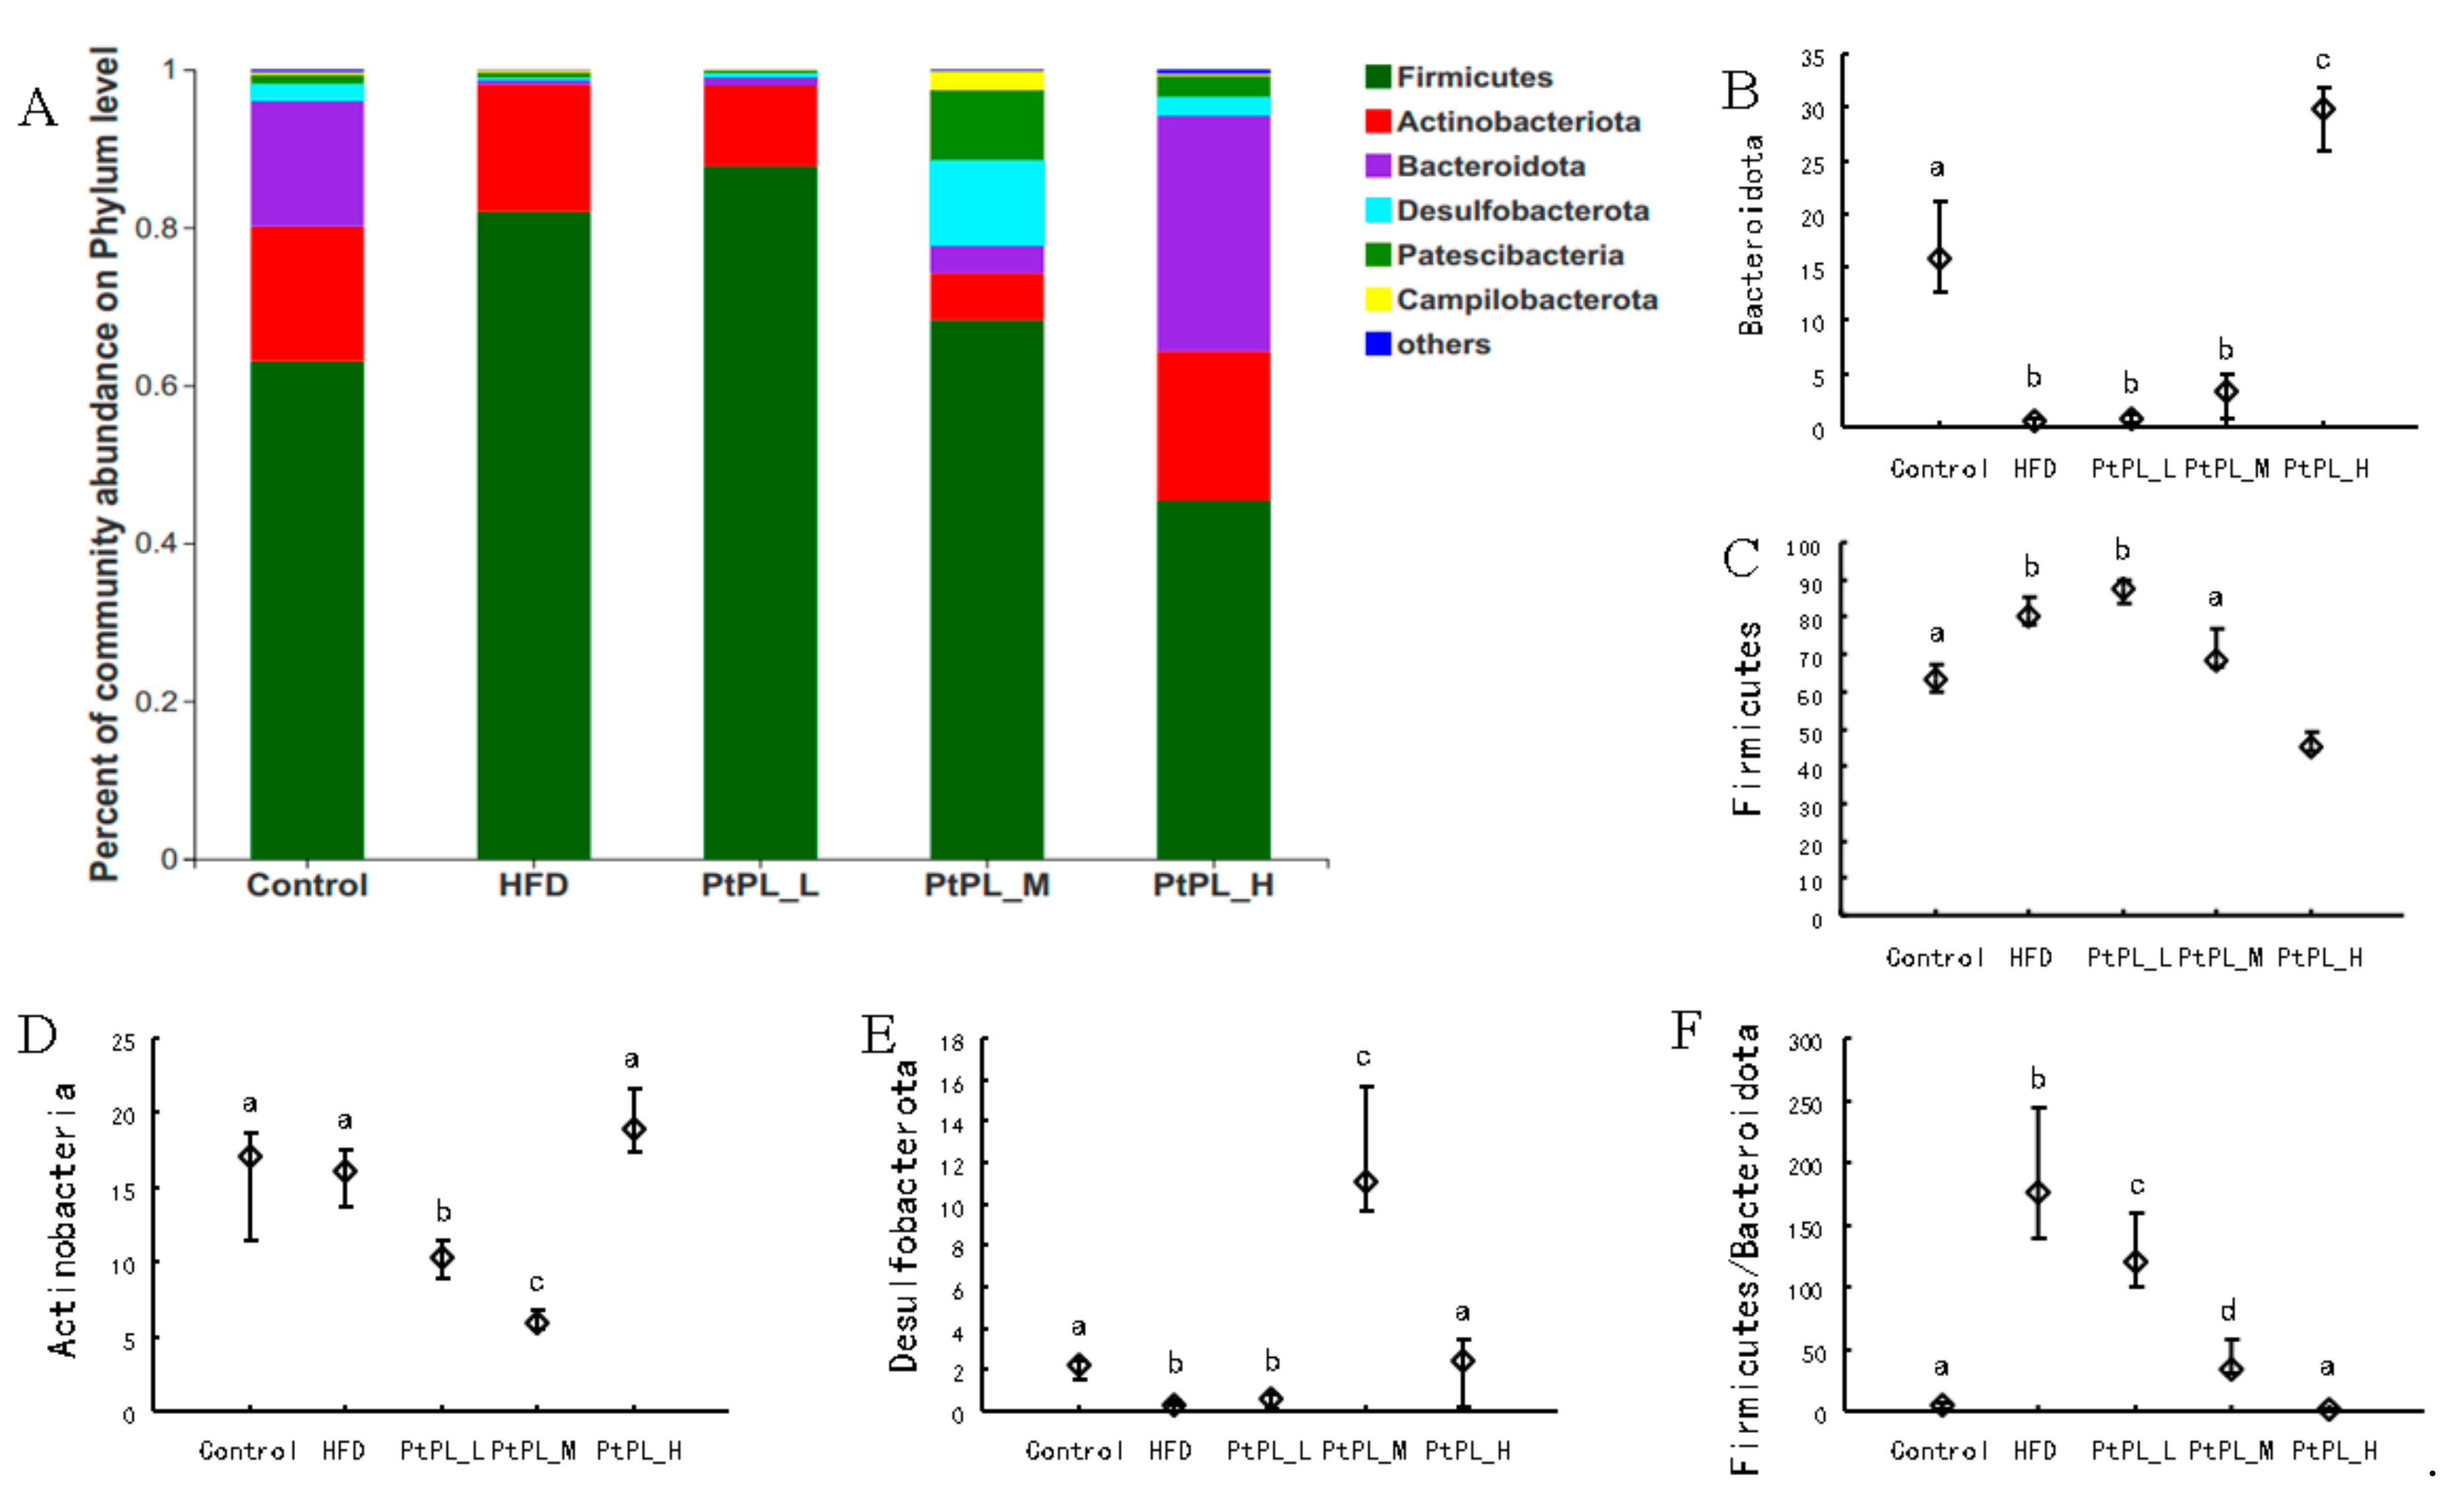
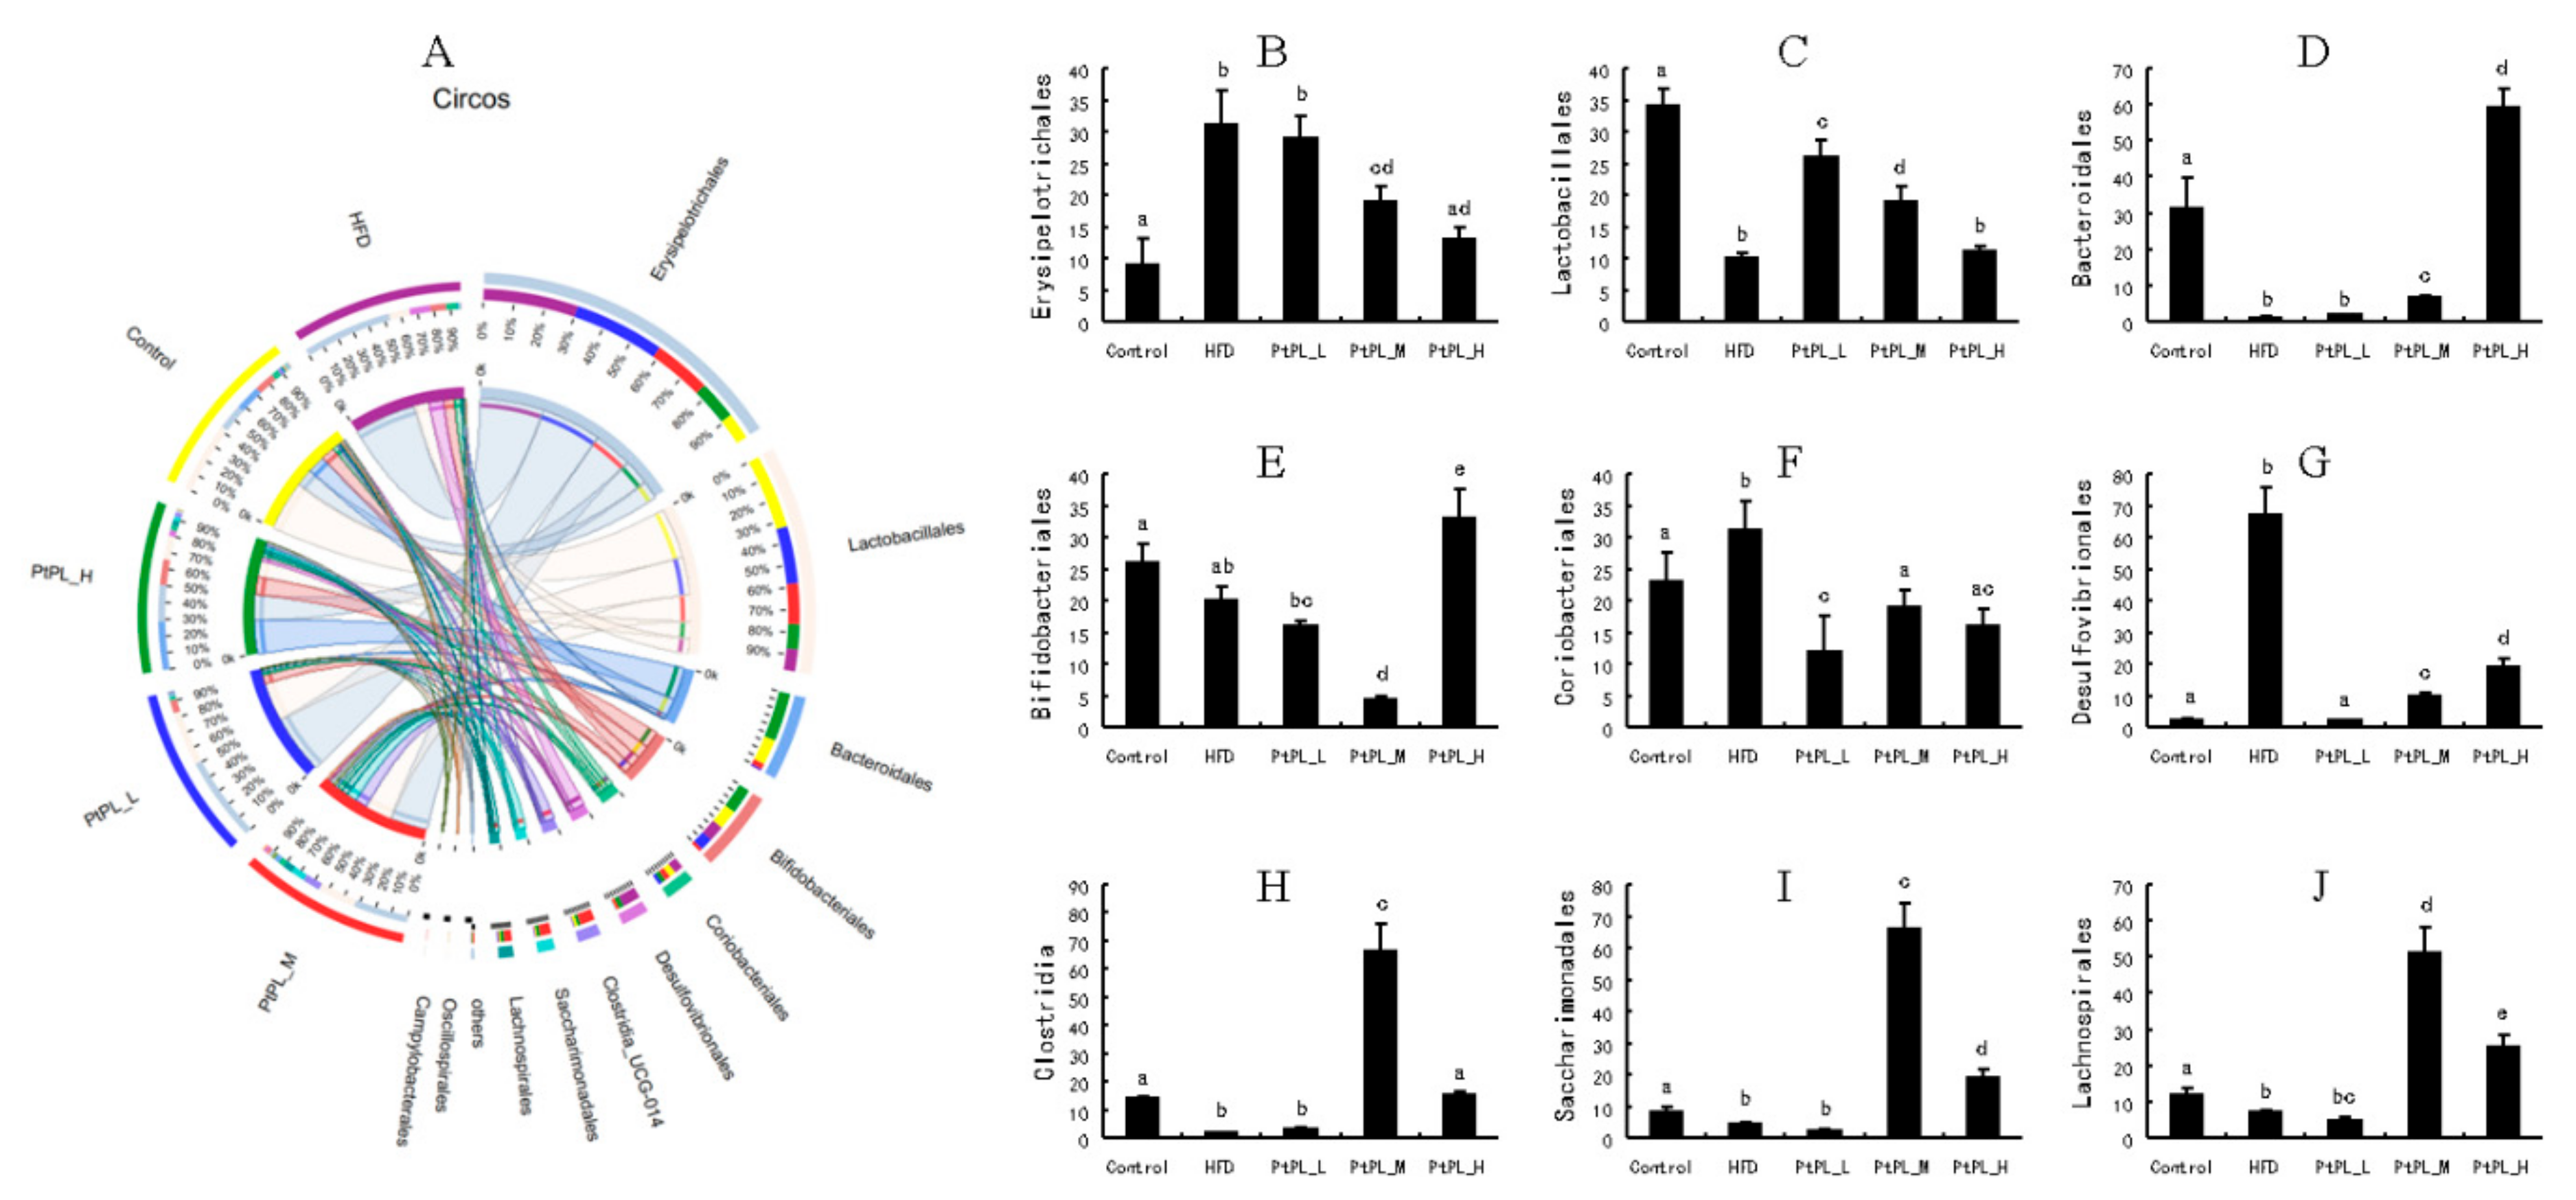
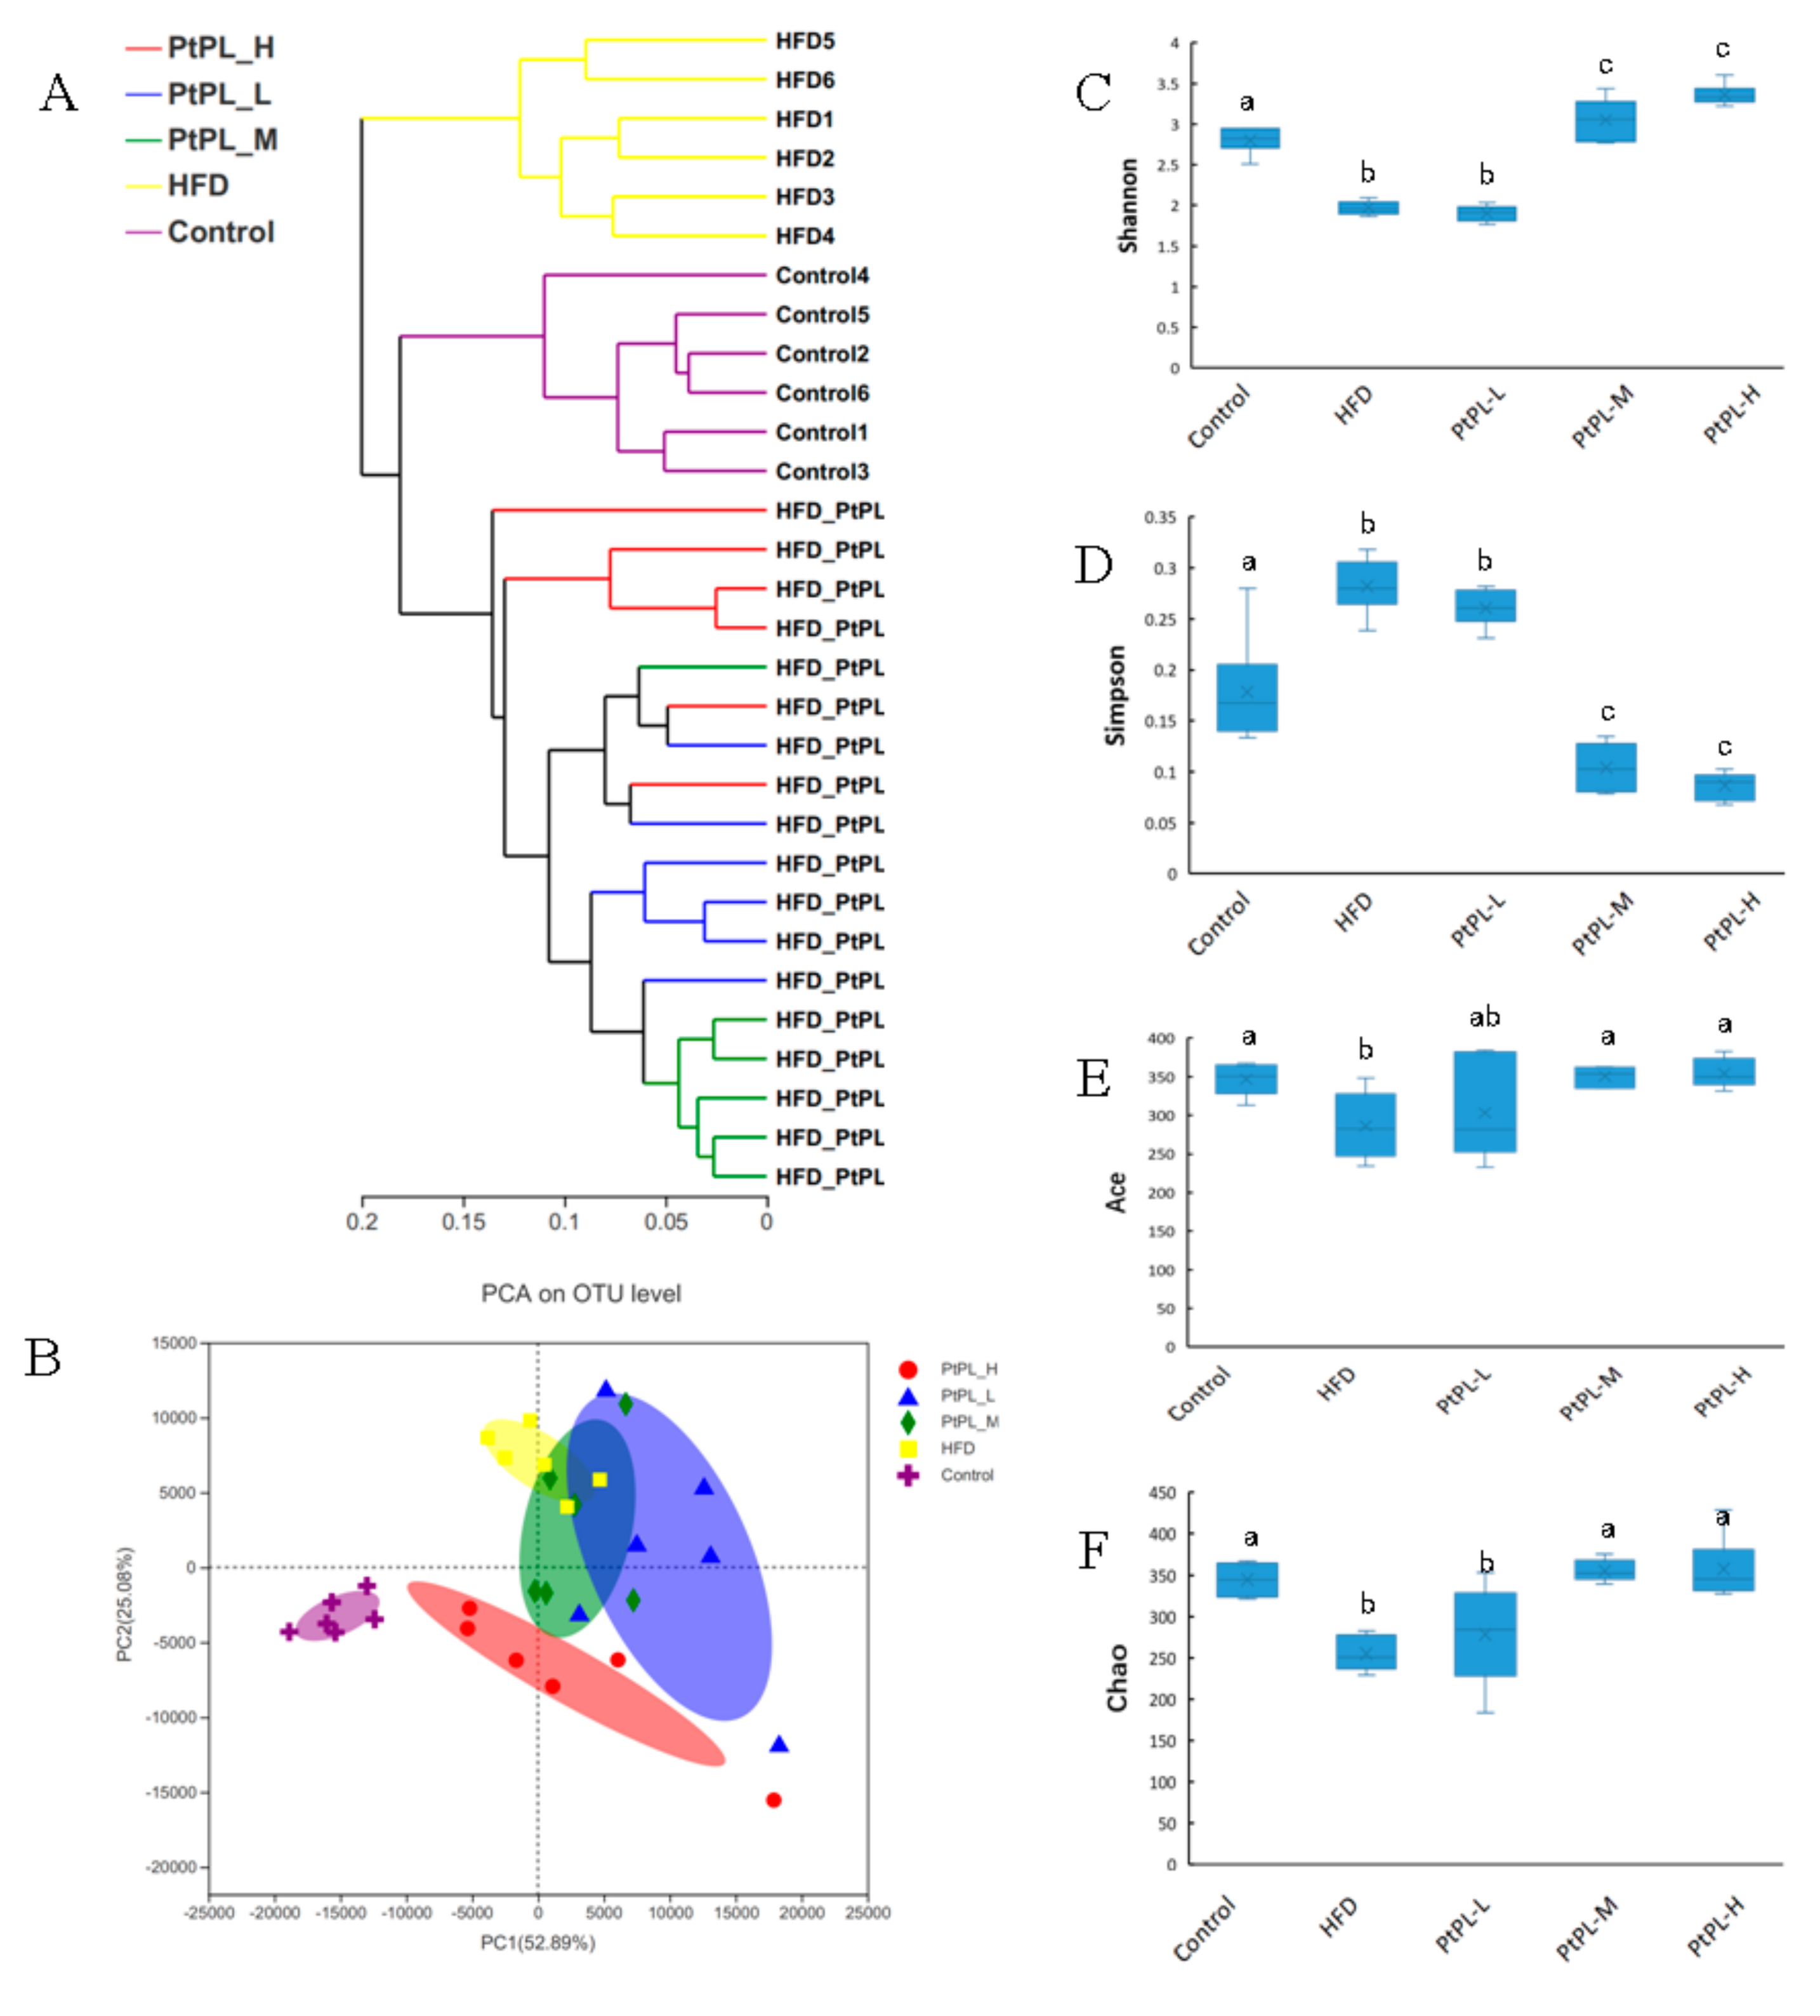
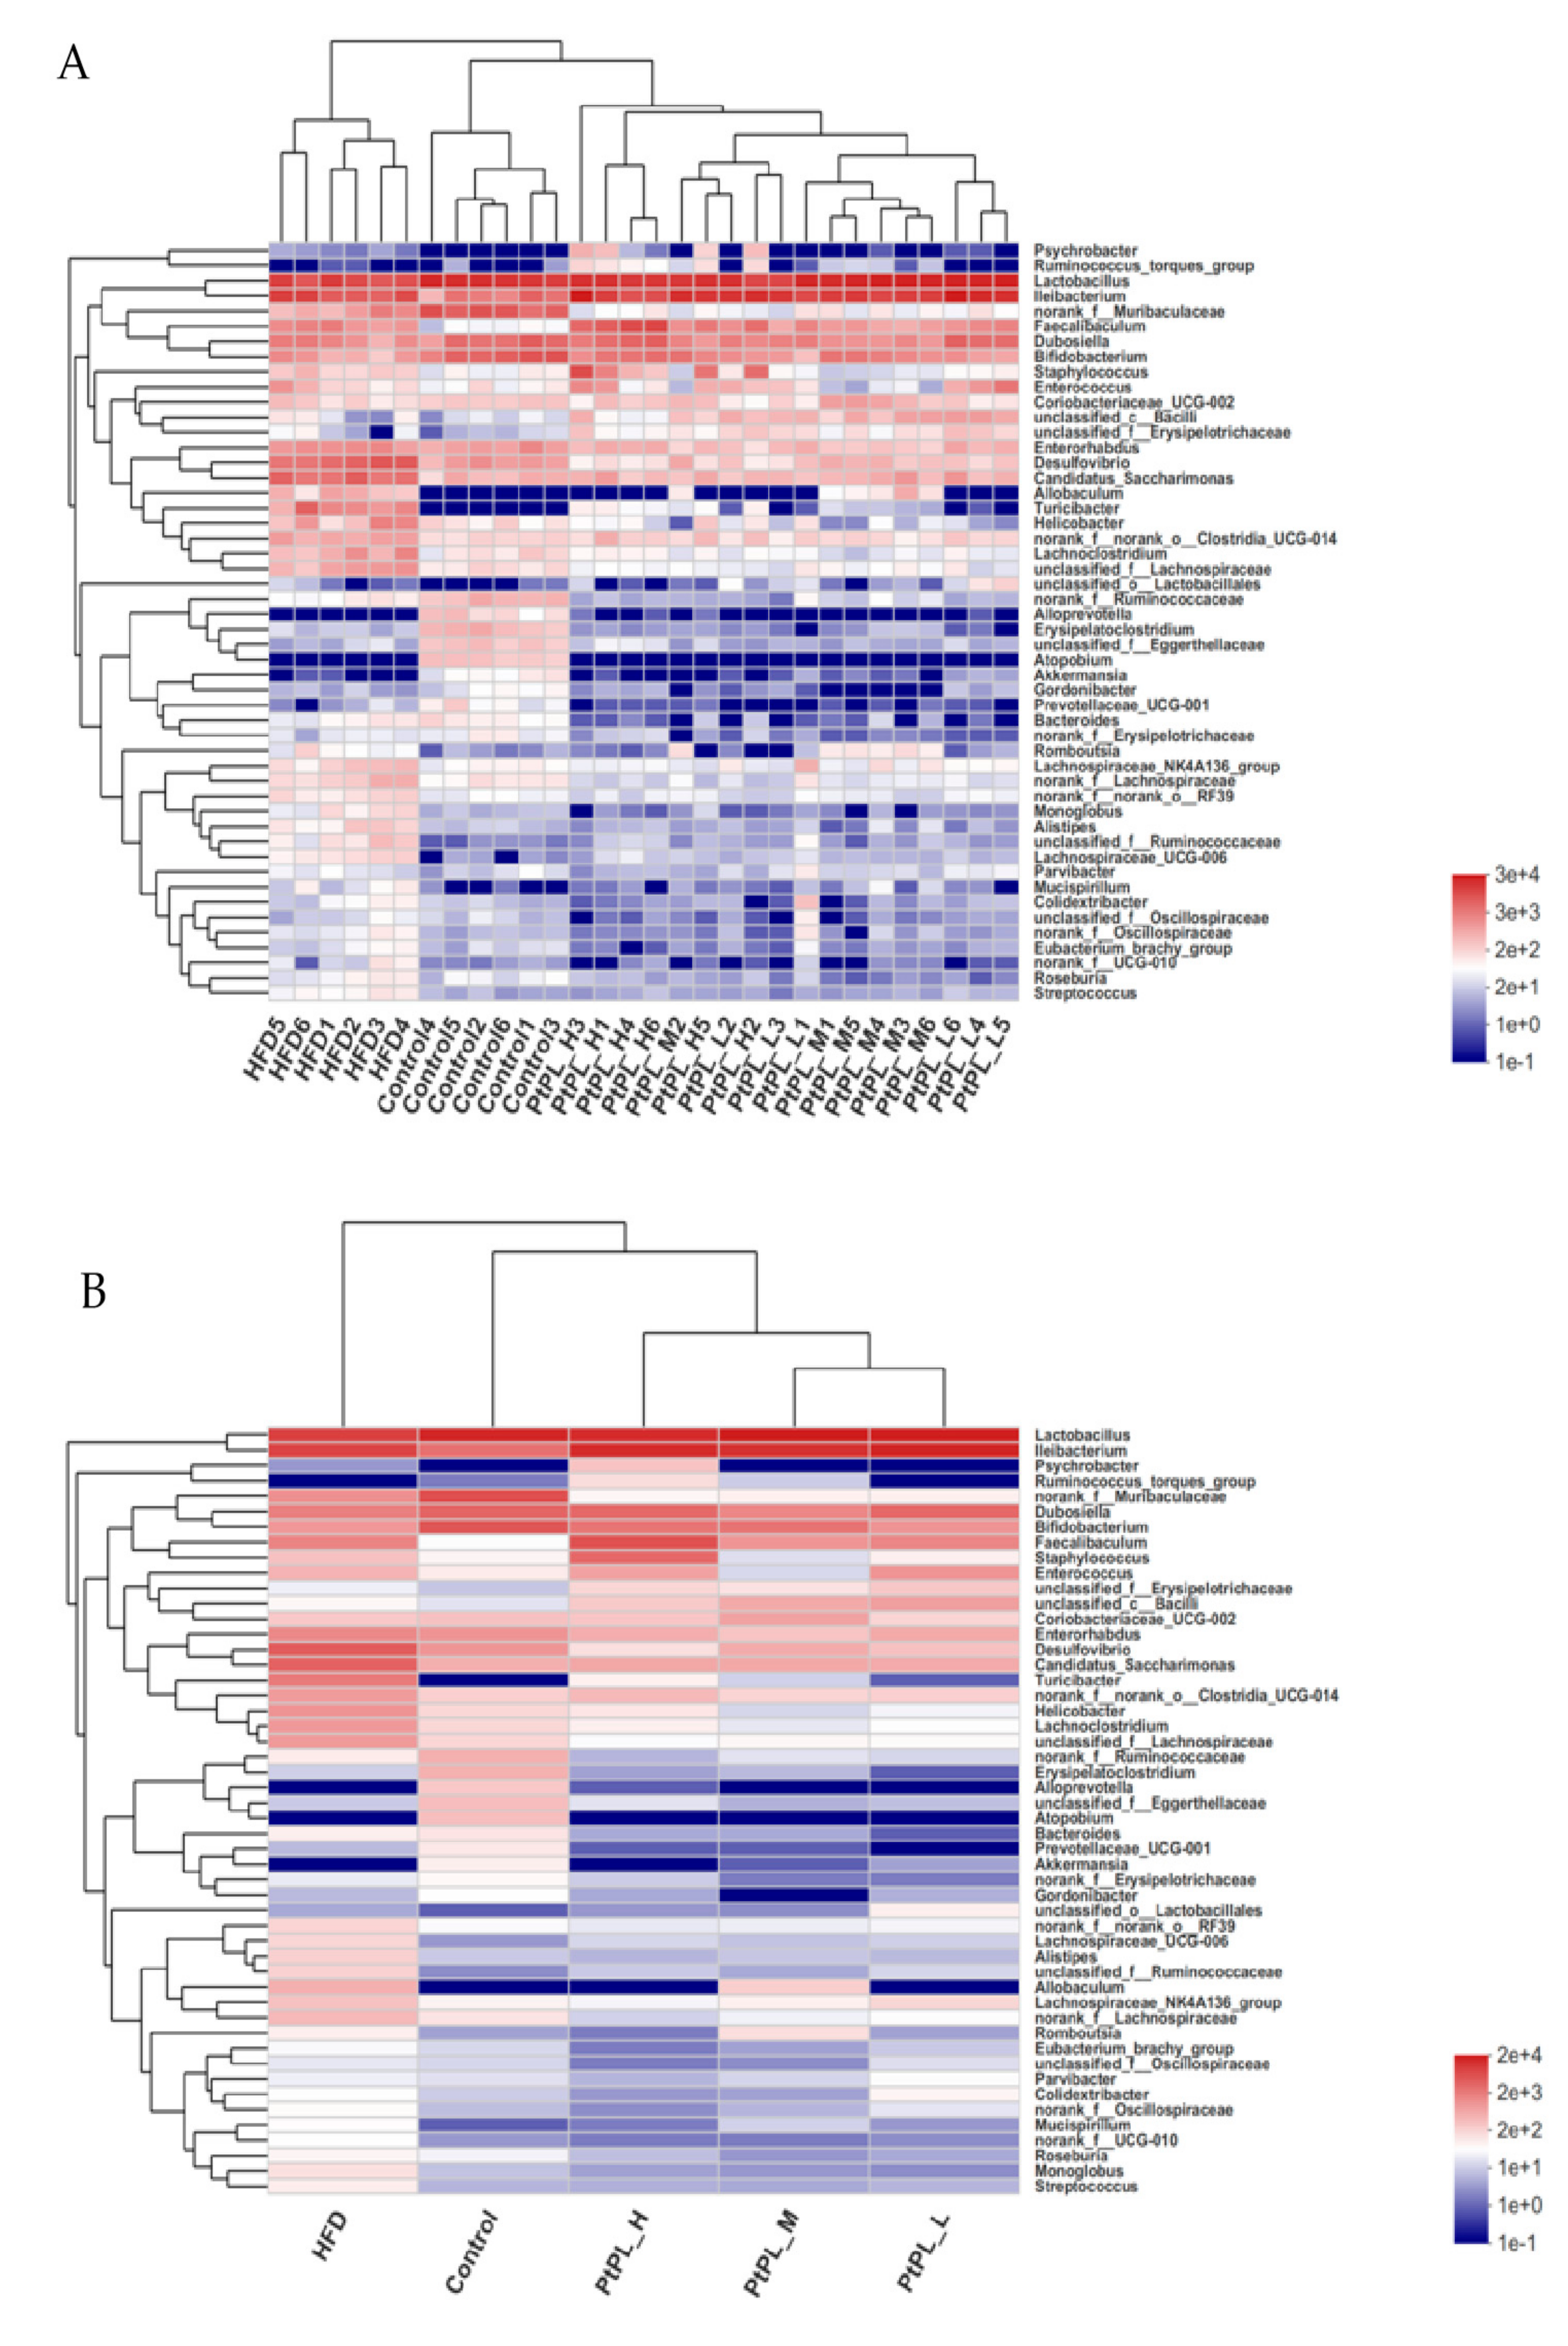
2.5. Effects of Pt-PL on Gut Microbiota

Obesity is developed and exacerbated once the intestinal bacteria experience dysbiosis in the host. To investigate the effects of Pt-PL on maintenance of the microbial community in obese mice, we conducted a V3-V4 of the 16S rRNA gene from the feces. As shown in Figure 2A, the Hierarchical clustering tree on OUT level exhibited distinct separation of the microbial composition between the five groups. The data of PCA methods on the OUT level also showed that the gut microbiota from each group were distinct. Alpha diversity was investigated to express the within-community richness and diversity. Figure 2C,D show significant increase in the Shannon index and decrease in the Simpson index were observed in the Pt-PL-M and Pt-PL-H groups, compared with the HFD group (p < 0.05), implying that the diversity of the gut microbiota obviously increased due to Pt-PL treatment. There were significant increases in Ace index and Chao index in Pt-PL-M and Pt-PL-H groups, compared with HFD group (p < 0.05), suggesting that the species richness of the bacteria in the mice was increased by Pt-PL treatment. Collectively, the results indicated that the gut microbiota in obese mice was modulated by Pt-PL treatment.
The microbial composition in the 5 groups was analyzed at various taxonomic levels. Figure 3 shows the changes of gut microbiota at the phylum level. HFD induced an obvious increase in Firmicutes abundance (p < 0.05), and a decrease in the abundances of Bacteroidota and Desulfobacterota (p < 0.05). A high dosage of Pt-PL could significantly recover these detrimental changes (p < 0.05). The middle dosage of Pt-PL also caused a significant reduction in Firmicutes abundance and an obvious increase in Desulfobacterota abundance (p < 0.05), but no marked changes in Bacteroidota, compared with HFD-fed mice. There were no remarkable differences in the 3 bacteria between Pt-PL-L and HFD groups. Interestingly, the mice in the 3 Pt-PL groups displayed significant decreases in the ratio of Firmicutues to Bacteroidota (p < 0.05). In addition, there was obvious reduction in Actinobacteriota abundance in Pt-PL-L and Pt-PL-M groups, compared with HFD group (p < 0.05), but no significant changes between Pt-PL-H and HFD groups. Actinobacterota is a large bacterial community. It contains both beneficial bacteria and harmful ones, such as Bifidobacterium and others. In the Pt-PL-L and Pt-PL-M groups, the Actinobcteriota abundance decreased, which may be associated with reductions of Bifidobacterium and other bacteria (Figure 4).
Figure 4 shows the community ternary phase diagram and the relative microbial abundances at the order level. Compared with HFD-fed mice, the animals treated with middle and high dosages of Pt-PL showed significant decreases in Erysipelotrichales, Coriobacterials, and Desulfovibrionales, but increases in Bacteroidales, Clostridia, Saccharimonadales, and Lachnospirales (p < 0.05). The abundance of Lactobacillales between HFD and Pt-PL-H groups did not show change. However, there was significant increase in the Pt-PL-L and Pt-PL-M groups, compared with the HFD group (p < 0.05). Bifdobacteriales abundance was significantly increased in the Pt-PL-H group, while it decreased in the Pt-PL-M group, compared with the HFD group (p < 0.05). Moreover, a low dosage of Pt-PL also obviously reduced the abundances of Coriobacteriales and Clostridia (p < 0.05).
Next, the relative abundances of bacteria genus were tabulated on a heat map to determine the relative microbial abundances of the gut microbiota (Figure 5). All 50 genera experienced significant difference between the control group and HFD group, while 45 genera different between the HFD group and Pt-PL-H, suggesting that the protective effects of Pt-PL on mice obesity may be mediated by bacterial subsets of different genera. The number of norank_f_Ruminococcaceae, Erysipelatoclostridium, and unclassified_f_Ruminococcaceae, belonging to Firmicutes, was lower in Pt-PL-H-treated mice compared with the HFD group. Moreover, bacteria from other genera, which are positively correlated with obesity, also decreased in the Pt-PL-H-treated obese mice, such as Coriobacteriaceae_UCG-002, Desulfovibro, Romboutsia, norank_f_norank_o_Clostridia_UCG-014, unclassified_f_Lachnospiraceae, norank_f_Oscillospiraceae, unclassified_f_Oscillospiraceae, Lachnospiraceae_UCG-006, Lachnoclostridium, Lachnospiraceae_NK4A136_group, and norank_f_Lachnospiraceae. SCFA-producing microbiota Lactobacillus, Dubosiella, Akkermansia, unclassified_c_Bacilli, and unclassified_o_Lactobacillales increased in HFD-mice supplemented with a high dosage of Pt-PL.
All these results provided strong evidence that Pt-PL could regulate gut microbiota in obese mice.

2.6. Effects of Pt-PL on LPS, Total Bile Acids, and SCFAs Concentrations

As shown in Table 4, HFD caused significant increase in fecal LPS and total bile acid levels compared with the control mice (p < 0.05), while supplementation of different dosages of Pt-PL lowered HFD-induced LPS and total bile acid appearance in the feces (p < 0.05). Interestingly, the Pt-PL-H group showed significant reduction in LPS and total bile acid levels compared with Pt-PL-L and Pt-PL-M groups (p < 0.05). Moreover, fecal acetate, propionate, butyrate, isobutyrate, valerate, isovalerate, and hexanoate concentrations were all significantly increased in both the Pt-PL-M and Pt-PL-H groups, compared with the HFD group (p < 0.05). Butyrate and isobutyrate concentrations were also increased in Pt-PL-L group, compared with the HFD group (p < 0.05), while other SCFAs had no significant changes. These results indicated that Pt-PL regulated secondary metabolites of gut microbiota in obese mice.

3. Discussion

Marine phospholipids have increasingly attracted attention on account of their abundant omega-3 fatty acid contents and high biological activities [19]. Previous studies have demonstrated that marine phospholipids could reduce body weight gain and improve hyperglycemia and hyperlipidemia in obese animals [20,21]. Our study analyzed the composition of phospholipids and their fatty acids, and also proved that Pt-PL prevented dietary-induced obesity and its associated disorders by modulating the gut microbiota.
It is reported that shrimp head phospholipids contain 53.62% of PC, 30.25% of LPC, 4.48% of PI, 5.06% of PE, and 0.73% of SM [22]. There were 85.24% of PC, 9.32% of PE, 4.75 of SM, 0.16% of PS, and 0.03% of PI in the phospholipids from the head of the shrimp, Penaeus vannamei [23]. Liang et al. reported that PC, LPC, PE, and PI accounted for 76.36%, 12.30%, 9.12%, and 1.09% in the total phospholipids from fish roe, Pseudosciaena crocea, respectively [24]. PC was the highest component in the phospholipids from marine species, which was alike our data (32.28% of PC in Pt-PL). Interestingly, our results showed that there were abundant PS and PA in Pt-PL (36.51% and 19.61%, respectively), while the two components were low in other marine phospholipids. On the other hand, the fatty acids compositions of Pt-PL were also advantageous, compared with those of several marine phospholipids. For example, the percentage of PUFA accounted for 43.00% of the phospholipids from Pseudosciaena crocea roe, among which considerable amounts of DHA and EPA were found 41.90% in total [24]. Saliu et al. reported that PUFA amount was 28.8–33.0% in the phospholipids from the roe of the fish, Silurus glanis, with DHA (14.4–15.9%) and EPA (5.8–7.0%) [25]. Ahmmed et al. reported that the phospholipids from the fish roe, Scomber australasicus, had 47.0% of PUFA, with 11.3% of EPA and 27.5% of DHA [26]. Our data exhibited that Pt-PL contained 75.78% of PUFA with 54.62% of DHA and EPA in total. These results suggested that Pt-PL was distinct and advantageous compared with the phospholipids from other marine animals.
Dietary supplementation of Pt-PL significantly decreased insulin resistance, lipid levels in serum and the liver, fat accumulation, and systematic inflammation, which are considered the four main pathological phenotypes of obesity, in HFD-fed mice [27]. This confirmed the beneficial activities of Pt-PL on obesity. However, energy uptake was not significantly changed between HFD and Pt-PL-treated mice, which implied that the anti-obesity activities of Pt-PL were not performed through altering energy efficiency. Some papers strongly support our conclusion [28]. Moreover, several studies have also proved that marine phospholipids exert anti-obesity effects. For example, Lu et al. reported that phospholipids from large yellow croaker roe could regulate lipid metabolism, and improve gut microbiota disorder in HFD-fed rats [29]. Phospholipids from krill oil were proved to lower body weight gain, mesenteric adipose tissue, and hepatic lipid content [30].
In light of the fact that obesity is associated with gut microbiota dysbiosis that disturbs the energy homeostasis and glucose metabolism of the host [31], gut microbiota has been considered an important environmental factor in the pathogenesis of obesity and its related diseases [32]. Microbial diversity and species richness are considered new biomarkers of health [33]. Pt-PL could manipulate the gut microbiota toward a healthy composition, since our results indicated remarkably improved gut bacterial diversity and richness in HFD-fed mice, was demonstrated by the correlation analysis in this study. The increased ratio of Firmicutes to Bacteroidetes, and modulating the abundances of these major phyla, has been recognized as an important indicator to potential prevention of obesity [34]. A similar result was found in our study, implying that Pt-PL may produce anti-obesity activities in HFD mice by reversing the ratio of Firmicutes to Bacteroidetes. Moreover, the abundance of the genus norank_f_Ruminococcaceae, Erysipelatoclostridium, and unclassified_f_Ruminococcaceae, which was highly positively correlated with obesity and obesity-related disease [35], was down-regulated by Pt-PL. Nevertheless, intriguingly, the levels of genus bacteria, which were previously reported to be negatively linked to weight reduction or a lean phenotype, were enriched by Pt-PL, such as and Akkermansia [7]. These findings indicate that Pt-PL can produce anti-obesity effects by modifying some specific bacterial phylotypes.
Apart from the above-mentioned specific gut microbiota, the SCFAs-producing bacteria phylotypes were also enriched by Pt-PL supplementations in HFD-fed mice, including Lactobacillus, Dubosiella, unclassified_c_Bacilli, and unclassified_o_Lactobacillales [36]. Significantly, the elevations of SCFAs-producing gut microbiota were positively correlated with increased concentrations of SCFAs in the feces of the mice treated with Pt-PL, particularly acetate and butyrate. SCFAs are hugely helpful to alleviate glucose tolerance and insulin resistance by beneficially modulating liver and adipose tissue function [37]. Furthermore, our study also proved that fecal LPS and total bile acid levels, which can lead to inflammation-dependent adiposity and insulin resistance in obese mice [38], were significantly reduced by Pt-PL treatment in HFD-fed mice. These changes were associated with a decrease in LPS-producing microbiota, such as order Desulfovibrionales and genus Desulfovibrio [39], and improvement in fat weight, lipid levels, inflammatory cytokine levels, and insulin resistance. Thus, the better anti-obesity effects of Pt-PL could be explained by the enrichment of beneficial bacteria with their metabolites and the attenuation of destructive bacteria abundance with their metabolites.

4. Materials and Methods

4.1. Preparation of Pt-PL and Their Fatty Acids Composition

Total lipids were extracted from Pt eggs according to our previous paper [18], and subsequently used to isolate phospholipids. Briefly, fresh Portunus trituberculatus eggs, early-stage embryos, were freeze dried, and subsequently homogenized in chloroform-methanol to gain total lipids.
Phospholipids were subsequently isolated using the lipids by column chromatography on silica gel. The composition of phospholipids was detected using high performance liquid chromatography (HPLC, 1200, Agilent, Santa Clara, CA, USA) with an ELSD evaporative light-scattering detector (ELSD2000, Alltech, Chicago, IL, USA). Briefly, gradient elution was used to analyze the phospholipids as: chloroform:methanol:ammonium hydroxide (eluant A, 80:19.5:0.5, v/v/v) for 6 min, chloroform:methanol:water:ammonium hydroxide (eluant B, 60:34:0.5:5.5, v/v/v/v) for 10 min, and eluant A for 20 min with a flow velocity 1.0 mL/min. ELSD conditions were: nitrogen, 4.5 MPa, flow rate 2.0 L/min, drift tube temperature 65 °C.
The phospholipids were esterified with 2 mol/L KOH in methanol at 80 °C for 1 h. After the esterification reaction, the upper organic layer was diluted with n-hexane after centrifugation at 4500× g for 15 min, and traces of water were subsequently removed with Na2SO4, filtered using a 0.22 µm filter, and preserved at −20 °C under the protection of nitrogen, before analysis for fatty acid composition [40]. The fatty acid composition was analyzed using gas chromatography (GC, 7820A, Agilent, Santa Clara, CA, USA) equipped with a hydrogen flame ionization detector (FID) and a FFAP-fused silica capillary column (30 m × 0.53 mm, 1 μm). GC conditions were: oven temperature, 50 to 100 °C (10 °C/min, 1 min), 100 to 150 °C (5 °C/min, 5 min), and 150 to 200 °C (20 °C/min); nitrogen (carrier gas), 1 mL/min; FID and injector temperature, 250 °C; injection volume, 2.0 μL. Fatty acids were identified by comparing the retention times of the sample peaks with those of a mixture of fatty acid methyl ester standards. The contents of the fatty acids were expressed as the weight percentage (% w/w) of the total fatty acids detected with chain lengths of 4–23 carbon atoms.

4.2. Animal Experiments

Male C57BL/6J mice (licensed ID: SCXK2019-0001), 16–18 g, were purchased from Vital River Laboratory Animal Center (Beijing, China). The mice were housed in individual cages under a 12-h light/dark cycle environment daily. The animals (50 mice in total and 10 per group) were stratified and randomized into 5 groups: control group (normal chow diet: 70% carbohydrate, 20% protein, and 10% fat), HFD group (HFD: 29% carbohydrates, 16% protein, and 55% fat), low dosage of Pt-PL group (Pt-PL-L, HFD + 1% Pt-PL), medium dosage of Pt-PL group (Pt-PL-M, HFD + 1.5% Pt-PL), and high dosage of Pt-PL group (Pt-PL-L, HFD + 2% Pt-PL). Body weight and food intake were recorded every week. After 18 weeks of feeding, each animal was housed in separated metabolic cages for 24 h to collect feces. Subsequently, the mice were sacrificed after fasting 5 h. Blood was collected to test glucose, lipid, and inflammatory parameters. The liver and adipose tissues were stripped for further study.

4.3. Blood Glucose, Lipids, Insulin, and Inflammatory Cytokines Test

At the end of the animal experiments, 5-h fasted mice were sacrificed to collect blood. Fasting blood glucose and serum lipids (including TG, TC, HDL-C, and LDL-C) levels were determined using commercial testing kits (Biosino, Beijing, China). Serum insulin and inflammatory cytokines (including TNF-α, IL-6, IL-1β, and IL-10) levels were determined using insulin ELISA kits (Invitrogen, Carlsbad, CA, USA).

4.4. Hepatic TG and TC Contents Detection

The liver tissues (0.25 g) were homogenized using chloroform-methanol (2:1, v/v) to gain total lipids. The lipids were suffered with water to remove water-soluble fraction, subsequently with light petroleum to remove water, and finally freeze-dried. The dried lipids were dissolved in isopropanol-polysorbate100 (9:1, v/m) and then measured TG and TC contents using commercial testing kits (Biosino, Beijing, China).

4.5. Hematoxylin and Eosin (H&E) and Oil Red O Staining

The epididymal adipose and liver tissues were peeled rapidly from the animals, subsequently fixed in 10% formalin, paraffin embedded, sectioned, and finally stained with H&E (epididymal adipose tissue) or oil red O (liver tissue). The epididymal adipose and liver microscopic structures were observed and photographed using a fluorescence microscope (Eclipse Ci, Nikon, Japan).

4.6. Gut Microbiota Analysis

Fecal DNA (n = 6 per group) was extracted using DNA gel extraction kit (Axygen, Silicon valley, CA, USA). DNA amplify, sequences analysis, taxonomic identification, alpha and beta diversities, and LEfSe analysis were performed according to our pervious stidies [18].

4.7. Fecal LPS, Total Bile Acids, and SCFAs Determination

Faeces were homogenized in ice-cold Millipore H2O and then centrifuged. The supernatant was heated to inactivated proteins. Fecal LPS and total bile acids were measured using ELISA kits (Invitrogen, Carlsbad, CA, USA).
Fecal SCFAs levels were evaluated using GC-MS (QP2010-Ultra, Shimadzu, Tokyo, Japan) according to our pervious study [18].

4.8. Statistical Analysis

Data were expressed as the means ± standard deviation and evaluated using a one-way analysis of variance followed by Duncan’s test using SPSS version 17.0 (SPSS Inc., Chicago, IL, USA). Statistically significance was set at p < 0.05.
For gut bacterial data, Shannon, Simpson, Ace, and Chao indexes were verified using Student’s t-test. Univariate differential abundance of OUT at phylum, order, and Genus levels was analyzed by incorporating Fisher’s test. Statistically significance was considered p < 0.05.

5. Conclusions

The results show Pt-PL contains 13 kinds of phospholipids, including PC, PS, PA, PE, and PI. PUFAs predominate in the fatty acid components of Pt-PL, especially EPA and DHA. Pt-PL significantly alleviated HFD-induced obesity and obesity-related disorders in mice, such as insulin resistance, lipid accumulation, and inflammation. These activities were directly related with the modulation of the gut microbiota community and their metabolites. Our findings offer new insights into the anti-obesity effect of dietary Pt-PL as an alternative novel marine functional ingredient.

Author Contributions

Conceptualization, S.H. and L.S.; methodology, S.C., H.Z., M.D, Y.L. and X.W.; software, H.Z. and Y.X.; validation, S.H., S.C., H.Z., M.D., L.S. and Y.X.; formal analysis, Y.X.; investigation, M.D.; resources, S.H. and L.S.; data curation, L.S.; writing—original draft preparation, S.H.; writing—review and editing, S.C., H.Z., M.D., Y.L., X.W., L.S. and Y.X.; visualization, M.D.; supervision, L.S.; project administration, S.H.; funding acquisition, S.H. and L.S.. All authors have read and agreed to the published version of the manuscript.

Funding

This research was supported by Science and Technology Project of Zhoushan (2020C21020), Zhejiang Provincial Universities and Research Institutes (2021JZ004), Public Projects of Zhejiang Province (LGN19D060001), Key Scientic and Technological Innovation Project of Wenzhou (ZS2019001 and ZD202003), Public Welfare Projects in Zhejiang Province (LGN20C200003), Wenzhou Science and Technology Commissioner Project (X20210015), and Zhejiang Fishery Industry Technology Project (2020–2022).

Conflicts of Interest

The authors declare no conflict of interest.

References

  1. Kahn, S.E.; Hull, R.L.; Utzschneider, K.M. Mechanisms linking obesity to insulin resistance and type 2 diabetes. Nature 2006, 444, 840–846. [Google Scholar] [CrossRef] [PubMed]
  2. Lin, X.; Li, H. Obesity: Epidemiology, pathophysiology, and therapeutics. Front. Endocrinol. 2021, 12, 706978. [Google Scholar] [CrossRef] [PubMed]
  3. Duca, F.A.; Waise, T.M.Z.; Peppler, W.T.; Lam, T.K.T. The metabolic impact of small intestinal nutrient sensing. Nat. Commun. 2021, 12, 903. [Google Scholar] [CrossRef] [PubMed]
  4. Régnier, M.; Van Hul, M.; Knauf, C.; Cani, P.D. Gut microbiome, endocrine control of gut barrier function and metabolic diseases. J. Endocrinol. 2021, 248, R67–R82. [Google Scholar] [CrossRef]
  5. Lu, J.F.; Zhu, M.Q.; Zhang, H.; Liu, H.; Xia, B.; Wang, Y.L.; Shi, X.; Peng, L.; Wu, J.W. Neohesperidin attenuates obesity by altering the composition of the gut microbiota in high-fat diet-fed mice. FASEB J. 2020, 34, 12053–12071. [Google Scholar] [CrossRef]
  6. Abenavoli, L.; Scarpellini, E.; Colica, C.; Boccuto, L.; Salehi, B.; Sharifi-Rad, J.; Aiello, V.; Romano, B.; De Lorenzo, A.; Izzo, A.A.; et al. Gut microbiota and obesity: A role for probiotics. Nutrients 2019, 11, 2690. [Google Scholar] [CrossRef] [Green Version]
  7. Gomes, A.C.; Hoffmann, C.; Mota, J.F. The human gut microbiota: Metabolism and perspective in obesity. Gut Microbes. 2018, 9, 308–325. [Google Scholar] [CrossRef] [Green Version]
  8. Schwiertz, A.; Taras, D.; Schäfer, K.; Beijer, S.; Bos, N.A.; Donus, C.; Hardt, P.D. Microbiota and SCFA in lean and overweight healthy subjects. Obesity 2010, 18, 190–195. [Google Scholar] [CrossRef]
  9. Saad, M.J.A.; Santos, A.; Prada, P.O. Linking gut microbiota and inflammation to obesity and insulin resistance. Physiology 2016, 31, 283–293. [Google Scholar] [CrossRef] [Green Version]
  10. Lin, H.; An, Y.; Tang, H.; Wang, Y. Alterations of bile acids and gut microbiota in obesity induced by high fat diet in rat model. J. Agric. Food Chem. 2019, 67, 3624–3632. [Google Scholar] [CrossRef]
  11. Yang, Y.; Zhang, Y.; Zhou, X.; Chen, D.; Ouyang, G.; Liu, Y.; Cui, D. Periostin deficiency attenuates lipopolysaccharide- and obesity-induced adipose tissue fibrosis. FEBS Lett. 2021, 595, 2099–2112. [Google Scholar] [CrossRef] [PubMed]
  12. Lu, Y.; Fan, C.; Li, P.; Lu, Y.; Chang, X.; Qi, K. Short chain fatty acids prevent high-fat-diet-induced obesity in mice by regulating G protein-coupled receptors and gut microbiota. Sci. Rep. 2016, 6, 37589. [Google Scholar] [CrossRef] [PubMed] [Green Version]
  13. National Bureau of Statistics of China. China Fishery Statistics Yearbook; National Bureau of Statistics of China: Beijing, China, 2021; pp. 22–38. (In Chinese) [Google Scholar]
  14. Ng’ambi, J.W.; Li, R.; Mu, C.; Song, W.; Liu, L.; Wang, C. Dietary administration of saponin stimulates growth of the swimming crab Portunus trituberculatus and enhances its resistance against Vibrio alginolyticus infection. Fish Shellfish Immunol. 2016, 59, 305–311. [Google Scholar] [CrossRef] [PubMed]
  15. Pan, L.; Hu, D.; Liu, M.; Hu, Y.; Liu, S. Molecular cloning and sequence analysis of two carbonic anhydrase in the swimming crab Portunus trituberculatus and its expression in response to salinity and pH stress. Gene 2016, 576, 347–357. [Google Scholar] [CrossRef]
  16. Hu, S.; Wang, J.; Yan, X.; Li, S.; Jiang, W.; Liu, Y. Egg oil from Portunus trituberculatus improves insulin resistance through activation of insulin signaling in mice. Appl. Physiol. Nutr. Metab. 2019, 44, 1081–1088. [Google Scholar] [CrossRef]
  17. Hu, S.; Yang, H.; Gao, X.; Li, S.; Jiang, W.; Liu, Y. Egg oil from Portunus trituberculatus alleviated obesity and regulated gut microbiota in mice. Sci. Rep. 2020, 10, 8454. [Google Scholar] [CrossRef]
  18. Hu, S.; Du, M.; Su, L.; Yang, H. Phosphatidylserine from Portunus trituberculatus eggs alleviates insulin resistance and alters the gut microbiota in high-fat-diet-fed mice. Mar. Drug. 2020, 18, 483. [Google Scholar] [CrossRef]
  19. Lordan, R.; Tsoupras, A.; Zabetakis, I. Phospholipids of animal and marine origin: Structure, function, and anti-Inflammatory properties. Molecules 2017, 22, 1964. [Google Scholar] [CrossRef] [Green Version]
  20. Han, X.Q.; Zhang, L.Y.; Ding, L.; Shi, H.H.; Xue, C.H.; Zhang, T.T.; Wang, Y.M. Synergistic effect of sea cucumber saponins and EPA-enriched phospholipids on insulin resistance in high-fat diet-induced obese mice. Food Funct. 2019, 10, 3955–3964. [Google Scholar] [CrossRef]
  21. Xiang, X.; Zhou, X.; Wang, W.; Zhou, Y.; Zhou, X.; Deng, S.; Zheng, B.; Wen, Z. Effect of Antarctic krill phospholipid (KOPL) on high fat diet-induced obesity in mice. Food Res. Int. 2021, 148, 110456. [Google Scholar] [CrossRef]
  22. Li, X.; He, Q.; Hou, H.; Zhang, S.; Zhang, X.; Zhang, Y.; Wang, X.; Han, L.; Liu, K. Targeted lipidomics profiling of marine phospholipids from different resources by UPLC-Q-Exactive Orbitrap/MS approach. J. Chromatogr. B Analyt. Technol. Biomed. Life Sci. 2018, 1096, 107–112. [Google Scholar] [CrossRef] [PubMed]
  23. Zhang, M.; Li, P.; Wang, F.; Zhang, S.; Li, H.; Zhang, Y.; Wang, X.; Liu, K.; Li, X. Separation, identification and cardiovascular activities of phospholipid classes from the head of Penaeus vannamei by lipidomics and zebrafish models. Food Funct. 2021, 12, 2282–2291. [Google Scholar] [CrossRef] [PubMed]
  24. Liang, P.; Li, R.; Sun, H.; Zhang, M.; Cheng, W.; Chen, L.; Cheng, X.; Akoh, C.C. Phospholipids composition and molecular species of large yellow croaker (Pseudosciaena crocea) roe. Food Chem. 2018, 245, 806–811. [Google Scholar] [CrossRef] [PubMed] [Green Version]
  25. Saliu, F.; Leoni, B.; Pergola, R.D. Lipid classes and fatty acids composition of the roe of wild Silurus glanis from subalpine freshwater. Food Chem. 2017, 232, 163–168. [Google Scholar] [CrossRef] [PubMed]
  26. Ahmmed, M.K.; Ahmmed, F.; Stewart, I.; Carne, A.; Tian, H.; Bekhit, A.E.A. Omega-3 phospholipids in Pacific blue mackerel (Scomber australasicus) processing by-products. Food Chem. 2021, 353, 129451. [Google Scholar] [CrossRef]
  27. Heymsfield, S.B.; Wadden, T.A. Mechanisms, pathophysiology, and management of obesity. N. Engl. J. Med. 2017, 376, 254. [Google Scholar] [CrossRef]
  28. Zhu, Z.; Zhu, B.; Sun, Y.; Ai, C.; Wang, L.; Wen, C.; Yang, J.; Song, S.; Liu, X. Sulfated polysaccharide from sea cucumber and its depolymerized derivative prevent obesity in association with modification of gut microbiota in high-fat diet-fed mice. Mol. Nutr. Food Res. 2018, 62, e1800446. [Google Scholar] [CrossRef]
  29. Lu, X.; Zhong, R.; Hu, L.; Huang, L.; Chen, L.; Cheng, W.; Zheng, B.; Liang, P. DHA-enriched phospholipids from large yellow croaker roe regulate lipid metabolic disorders and gut microbiota imbalance in SD rats with a high-fat diet. Food Funct. 2021, 12, 1825–4841. [Google Scholar] [CrossRef]
  30. Kroupova, P.; van Schothorst, E.M.; Keijer, J.; Bunschoten, A.; Vodicka, M.; Irodenko, I.; Oseeva, M.; Zacek, P.; Kopecky, J.; Rossmeisl, M.; et al. Omega-3 phospholipids from krill oil enhance intestinal fatty acid oxidation more effectively than omega-3 triacylglycerols in high-fat diet-fed obese mice. Nutritions 2020, 12, 2037. [Google Scholar] [CrossRef]
  31. de Vos, W.M.; Tilg, H.; Van Hul, M.; Cani, P.D. Gut microbiome and health: Mechanistic insights. Gut 2022, 71, 1020–1032. [Google Scholar] [CrossRef]
  32. Geng, J.; Ni, Q.; Sun, W.; Li, L.; Feng, X. The links between gut microbiota and obesity and obesity related diseases. Biomed. Pharmacother. 2022, 147, 112678. [Google Scholar] [CrossRef] [PubMed]
  33. Gasmi, A.; Mujawdiya, P.K.; Pivina, L.; Doşa, A.; Semenova, Y.; Benahmed, A.G.; Bjørklund, G. Relationship between gut microbiota, gut hyperpermeability and obesity. Curr. Med. Chem. 2021, 28, 827–839. [Google Scholar] [CrossRef] [PubMed]
  34. Magne, F.; Gotteland, M.; Gauthier, L.; Zazueta, A.; Pesoa, S.; Navarrete, P.; Balamurugan, R. The Firmicutes/Bacteroidetes ratio: A relevant marker of gut dysbiosis in obese patients? Nutritions 2020, 12, 1474. [Google Scholar] [CrossRef] [PubMed]
  35. Zhao, L.; Zhang, Q.; Ma, W.; Tian, F.; Shen, H.; Zhou, M. A combination of quercetin and resveratrol reduces obesity in high-fat diet-fed rats by modulation of gut microbiota. Food Funct. 2017, 8, 4644–4656. [Google Scholar] [CrossRef]
  36. Liu, J.; Yue, S.; Yang, Z.; Feng, W.; Meng, X.; Wang, A.; Peng, C.; Wang, C.; Yan, D. Oral hydroxysafflor yellow A reduces obesity in mice by modulating the gut microbiota and serum metabolism. Pharmacol. Res. 2018, 134, 40–50. [Google Scholar] [CrossRef]
  37. Zhang, Q.; Hu, N. Effects of metformin on the gut microbiota in obesity and type 2 diabetes mellitus. Diabetes Metab. Syndr. Obes. 2020, 13, 5003–5014. [Google Scholar] [CrossRef]
  38. Wang, Y.; Yao, W.; Li, B.; Qian, S.; Wei, B.; Gong, S.; Wang, J.; Liu, M.; Wei, M. Nuciferine modulates the gut microbiota and prevents obesity in high-fat diet-fed rats. Exp. Mol. Med. 2020, 52, 1959–1975. [Google Scholar] [CrossRef]
  39. Guo, J.; Han, X.; Zhan, J.; You, Y.; Huang, W. Vanillin alleviates high fat diet-induced obesity and improves the gut microbiota composition. Front. Microbiol. 2018, 9, 2733. [Google Scholar] [CrossRef] [Green Version]
  40. Karrar, E.; Ahmed, I.A.M.; Huppertz, T.; Wei, W.; Jin, J.; Wang, X. Fatty acid composition and stereospecificity and sterol composition of milk fat from different species. Int. Dairy J. 2022, 128, 105313. [Google Scholar] [CrossRef]
Figure 1. Effects of Pt-PL on obesity in HFD-fed mice. (A), Mice body type; (B), Hematoxylin & eosin strain on the epididymal adipose tissue; (C), Oil red O strain on the liver tissue.
Marinedrugs 20 00411 g001
Figure 2. Effects of Pt-PL on the composition of the gut microbiota in HFD mice (n = 6). (A), multivariate analysis of variance from matrix scores; (B), the weighted version of UniFrac-based Principal Component Analysis (PCA) on OUT level; (C), Shannon index; (D), Simpson index; (E), Ace index; (F), Chao index. Different lowercases represented significant difference (p < 0.05) compared between groups.
Marinedrugs 20 00411 g002
Figure 3. Effects of Pt-PL on gut microbiota on Phylum level (n = 6). (A), Percent of community abundance on Phylum level; (B, Bacteroidetes abundance; (C), Firmicutes abundance; (D), Actinobacteria abundance; (E), Desulfobacterota abundance; (F), the ratio of Firmicutes to Bacteroidetes. Different lowercases represent significant difference (p < 0.05) between groups.
Marinedrugs 20 00411 g003
Figure 4. Effects of Pt-PL on gut microbiota on order level, using community ternary phase diagram (n = 6). (A) Percent of community abundance on Order level; (B) Erysipelotrichales abundance; (C) Lactobacillales abundance; (D) Bacteroidales abundance; (E) Bifidobacteriales abundance; (F) Coriobacteriales abundance; (G) Desulfovibrionales abundance; (H) Clostridia abundance; (I) Saccharimonadales abundance; (J) Lachnospirales abundance. Different lowercases represent significant difference (p < 0.05) between groups.
Marinedrugs 20 00411 g004
Figure 5. Effects of Pt-PL on gut microbiota on the genus level (n = 6). Heatmap indicates relative contribution of the top 50 dominant genera in each sample (A) and different groups (B). The heatmap is color-coded based on row Z-scores.
Marinedrugs 20 00411 g005
Table 1. The composition of phospholipids in Pt-PL.
PhospholipidsProportion (%)PhospholipidsProportion (%)
LPC2.87 ± 0.15LPE0.27 ± 0.03
LPA0.19 ± 0.03LPS0.07 ± 0.01
PA19.61 ± 2.34PC32.28 ± 5.87
PE8.81 ± 1.04PG0.22 ± 0.04
PI7.96 ± 0.83PS26.51 ± 4.59
SM0.87 ± 0.06Others0.49 ± 0.07
CL0.07 ± 0.02
Data are presented as means ± SD (n = 6). CL, cardiolipin; LPC, lysophosphatidylcholine; LPE, lysophosphatidylethanolamine; LPA, lysophosphatidylinositol; LPS, lysophosphatidylserine; PA, phosphatidic acid; PC, phosphatidylcholine; PE, phosphatidylethanolamine; PG, phosphatidylglycerol; PI, phosphatidylinositol; PS, phosphatidylserine; SM, sphingomyelin.
Table 2. The composition of fatty acids of main phospholipids in Pt-PL.
Fatty acids Proportion (%)
PAPCPEPIPS [18]
C15:0------------0.59 ± 0.08
C16:0---0.62 ± 0.26------10.95 ± 1.57
C16:1 n-9---0.91 ± 0.68--- ---
C16:1 n-7------0.10 ± 0.06 0.83 ± 0.01
C17:0------0.03 ± 0.01---5.18 ± 0.84
C17:1 n-7------------7.32 ± 0.86
C17:3 n-9------------0.12 ± 0.01
C18:04.30 ± 1.03---------3.45 ± 0.61
C18:1 n-9---0.22 ± 0.031.77 ± 0.65---1.16 ± 0.22
C18:1 n-7---0.80 ± 0.161.05 ± 0.34---0.71 ± 0.14
C18:2 n-6---0.50 ± 0.010.11 ± 0.050.20 ± 0.070.59 ± 0.01
C18:3 n-3------------0.50 ± 0.02
C20:0---0.70 ± 0.130.12 ± 0.03---2.01 ± 0.54
C20:1 n-9---1.43 ± 0.391.07 ± 0.36---1.56 ± 0.39
C20:2 n-6---2.26 ± 0.190.34 ± 0.11------
C20:3 n-63.38 ± 1.011.01 ± 0.231.54 ± 0.99---2.49 ± 0.27
C20:4 n-620.11 ± 6.0713.14 ± 2.808.27 ± 1.3716.82 ± 3.360.44 ± 0.09
C20:4 n-33.52 ± 0.56------20.83 ± 4.401.16 ± 0.25
C20:5 n-351.84 ± 6.0428.86 ± 6.0153.76 ± 10.8324.46 ± 5.3118.70 ± 3.32
C22:0---0.58 ± 0.13---------
C22:1 n-9---15.53 ± 3.67---------
C22:2 n-67.90 ± 4.712.41 ± 0.46 2.70 ± 0.56
C22:3 n-6---0.60 ± 0.16---------
C22:4 n-6---2.14 ± 0.573.96 ± 1.13------
C22:5 n-6---0.82 ± 0.196.54 ± 0.95------
C22:5 n-3------1.66 ± 0.33------
C22:6 n-38.95 ± 5.3326.92 ± 5.6019.48 ± 3.2537.69 ± 4.7930.43 ± 2.08
C23:1 n-6------------0.60 ± 0.11
C23:3 n-6---0.02 ± 0.00---------
Others0.00 ± 0.000.55 ± 0.000.21 ± 0.060.00 ± 0.008.52 ± 1.40
∑SFA4.30 ± 1.031.90 ± 0.170.15 ± 0.020.00 ± 0.0022.19 ± 3.15
∑UFA95.70 ± 34.7697.55 ± 0.8499.64 ± 1.59100 ± 8.9669.29 ± 5.20
∑MUFA0.00 ± 0.0018.89 ± 1.233.99 ± 0.440.00 ± 0.0012.16 ± 2.24
∑PUFA95.70 ± 34.7678.66 ± 1.0795.65 ± 1.94100 ± 8.9657.13 ± 5.63
∑(EPA+DHA)60.79 ± 18.8955.78 ± 5.8173.24 ± 7.4562.16 ± 5.3550.13 ± 2.81
Data are presented as means ± SD (n = 6). Fatty acids were analyzed by gas chromatography. MUFA, monounsaturated fatty acids; PA, phosphatidic acid; PC, phosphatidylcholine; PE, phosphatidylethanolamine; PI, phosphatidylinositol; PS, phosphatidylserine; PUFA, polyunsaturated fatty acids; SFA, saturated fatty acids; UFA, unsaturated fatty acids.
Table 3. Effect of Pt-PL on body weight, blood glucose, insulin, serum lipids, hepatic lipids, and serum inflammatory cytokines in HFD-fed mice.
Control HFDPt-PL-L Pt-PL-M Pt-PL-H
Food intake (g/w)29.74 ± 2.37 a25.43 ± 2.19 b25.62 ± 2.30 b25.18 ± 3.21 b25.35 ± 2.82 b
Calorie intake (kcal/w)121.79 ± 10.08 a166.82 ± 11.55 b168.07 ± 12.43 b165.18 ± 15.26 b166.29 ± 14.04 b
Body weight gain (g)11.44 ± 0.48 a21.55 ± 1.18 b18.97 ± 0.64 c14.96 ± 1.09 d14.55 ± 0.18 d
Perirenal fat weight (g)0.17 ± 0.03 a0.95 ± 0.08 b0.49 ± 0.07 c0.40 ± 0.08 cd0.25 ± 0.04 ad
Epididymal fat weight (g)0.49 ± 0.10 a4.09 ± 0.54 b1.84 ± 0.50 c1.17 ± 0.62 cd0.99 ± 0.11 d
Abdominal subcutaneous fat weight (g)0.23 ± 0.05 a1.17 ± 0.38 b0.73 ± 0.17 c0.56 ± 0.11 cd0.44 ± 0.10 d
Hepatic weight (g)1.01 ± 0.07 a2.11 ± 0.29 b1.63 ± 0.15 c1.21 ± 0.10 cd1.13 ± 0.12 ad
Fasting blood glucose (mmol/L)7.84 ± 0.38 a15.19 ± 0.67 b11.08 ± 0.50 c8.56 ± 0.46 d7.74 ± 0.37 d
Serum insulin (mU/L)26.00 ± 0.99 a32.64 ± 1.09 b28.79 ± 0.30 c26.60 ± 1.38 ad25.95 ± 2.05 ad
Serum TG (mmol/L)1.38 ± 0.05 a2.66 ± 0.12 b2.30 ± 0.13 b2.09 ± 0.06 c1.46 ± 0.09 a
Serum TC (mmol/L)3.79 ± 0.07 a7.25 ± 0.31 b5.66 ± 0.47 b4.54 ± 0.28 c4.06 ± 0.24 ac
Serum HDL-C (mmol/L)1.19 ± 0.20 a0.32 ± 0.04 b0.52 ± 0.05 c0.71 ± 0.11 d1.15 ± 0.06 a
Serum LDL-C (mmol/L)2.50 ± 0.20 a5.26 ± 0.37 b3.56 ± 0.30 c3.28 ± 0.29 c3.01 ± 0.14 ac
Hepatic TG (mg/g)20.56 ± 2.14 a36.28 ± 2.87 b30.01 ± 2.35 c28.28 ± 1.98 cd25.37 ± 2.17 d
Hepatic TC (mg/g)3.55 ± 0.28 a5.62 ± 0.41 b5.05 ± 0.39 bc4.46 ± 0.40 c4.38 ± 0.36 c
Serum TNF-α (pg/mL)56.08 ± 2.87 a106.01 ± 13.82 b94.73 ± 6.03 b76.99 ± 6.43 c56.94 ± 2.46 d
Serum IL-6 (pg/mL)57.60 ± 5.45 a83.46 ± 6.32 b66.77 ± 4.17 c60.04 ± 5.86 ac56.49 ± 4.31 a
Serum IL-1β (pg/mL)49.28 ± 3.00 a81.20 ± 4.27 b80.78 ± 4.16 b75.31 ± 5.36 b65.52 ± 2.79 c
Serum IL-10 (pg/mL)271.86 ± 8.90 a240.43 ± 7.74b248.74 ± 7.28 b254.15 ± 10.12 b272.16 ± 8.51 a
Data are presented as mean ± S.D. (n = 10). Multiple comparisons were done using one way ANOVA. Different lowercases represented significant difference (p < 0.05) compared between groups.
Table 4. Effect of Pt-PL on fecal LPS, total bile acids, and SCFAs in HFD-fed mice.
ParametersControlHFDPt-PL-L Pt-PL-M Pt-PL-H
LPS (EU/g faeces)6.40 ± 0.67 a13.24 ± 0.98 b11.58 ± 1.04 c11.03 ± 0.75 c6.72 ± 0.54 a
Total bile acids (µmol/g faeces)6.57 ± 0.62 a13.34 ± 0.85 b9.14 ± 0.76 c8.24 ± 0.59 c6.89 ± 0.71 a
SCFAs
(mg/g faeces)
Acetate17.63 ± 1.44 a6.09 ± 0.89 b6.08 ± 0.77 b14.51 ± 1.14 c14.93 ± 1.34 c
Propionate5.03 ± 0.34 a0.62 ± 0.05 b0.67 ± 0.05 b1.40 ± 0.092.35 ± 0.21 d
Butyrate3.69 ± 0.31 a0.21 ± 0.01 b0.42 ± 0.02 c1.80 ± 0.12 c8.30 ± 0.87 d
Isobutyrate0.33 ± 0.02 a0.02 ± 0.00 b0.08 ± 0.01 c0.24 ± 0.02 c0.35 ± 0.03 a
Valerate0.61 ± 0.04 a0.04 ± 0.01 b0.04 ± 0.00 b0.08 ± 0.00 c0.25 ± 0.01 d
Isovalerate0.42 ± 0.03 a0.12 ± 0.00 b0.11 ± 0.01 b0.29 ± 0.02 c0.28 ± 0.01 c
Hexanoate0.10 ± 0.00 aNDND0.01 ± 0.00 b0.02 ± 0.00 c
Total SCFAs27.76 ± 2.04 a7.09 ± 0.63 b7.41 ± 0.65 b18.33 ± 1.70 c26.49 ± 2.18 a
Data are presented as mean ± S.D. (n = 6). Multiple comparisons were done using one way ANOVA. LPS, lipopolysaccharides; ND, no detection; SCFAs, short chain fat acids. Different lowercases represent significant difference (p < 0.05) between groups.
Publisher’s Note: MDPI stays neutral with regard to jurisdictional claims in published maps and institutional affiliations.

