
Exploring the Diversity of Red Microalgae for Exopolysaccharide Production


Abstract
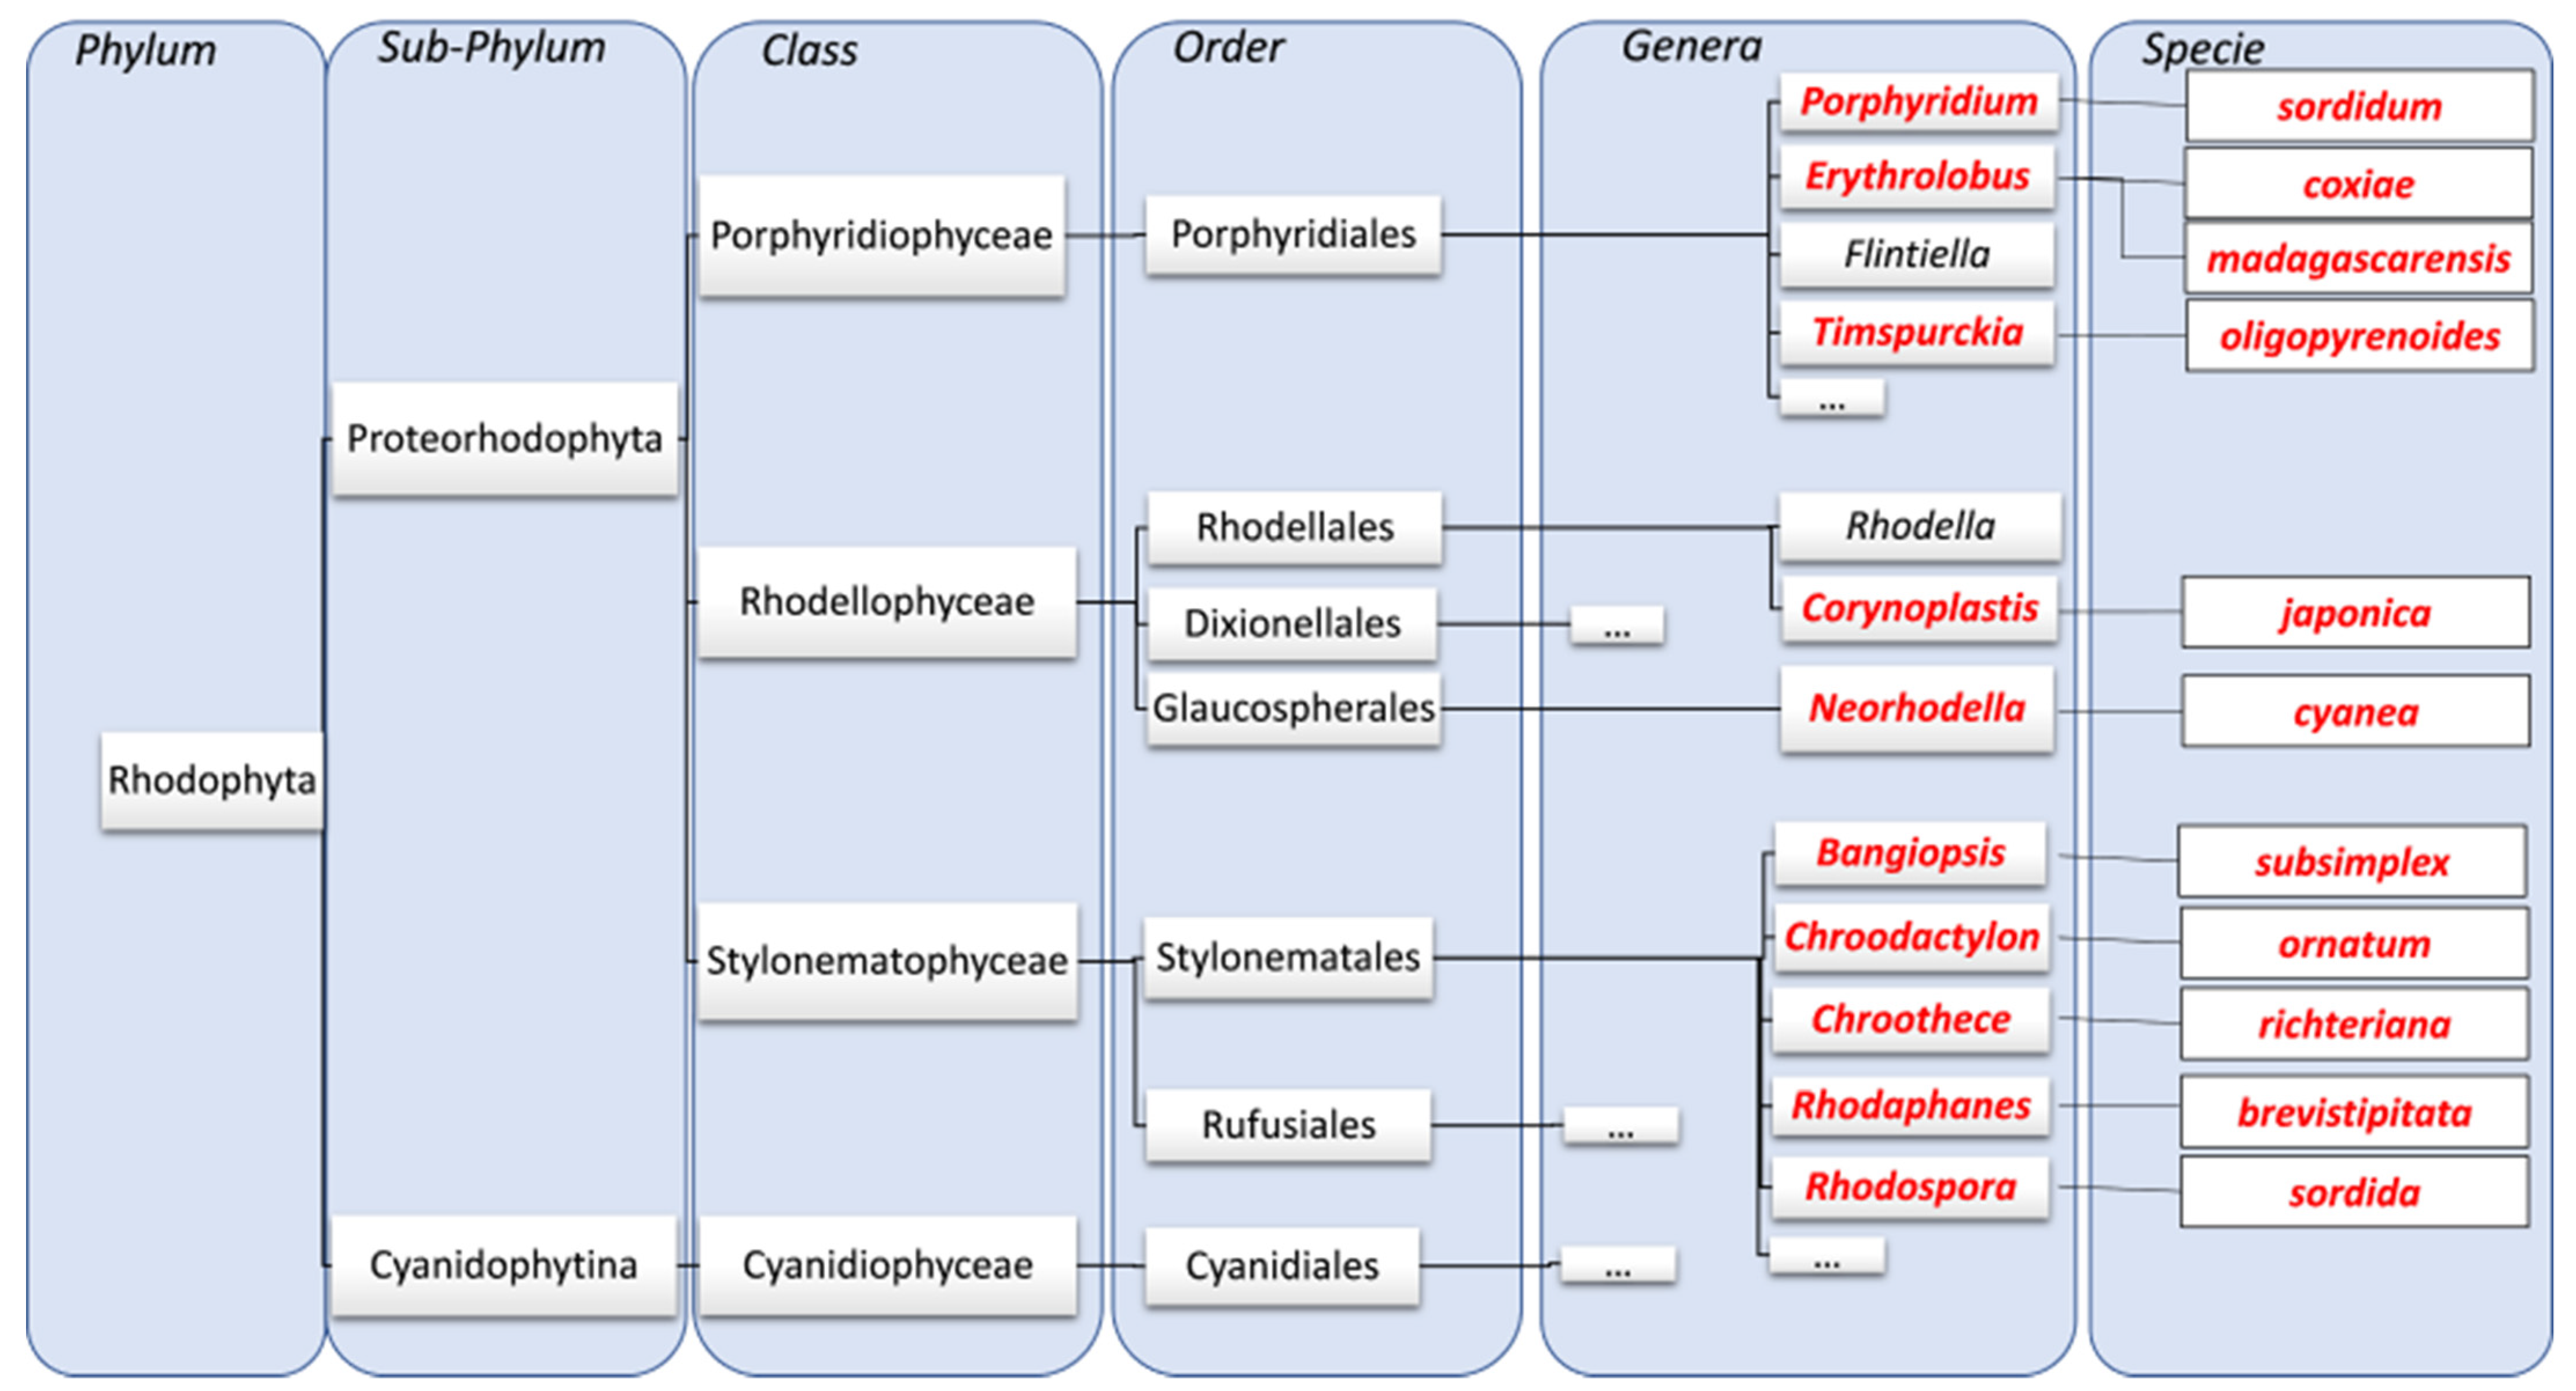
1. Introduction
2. Results
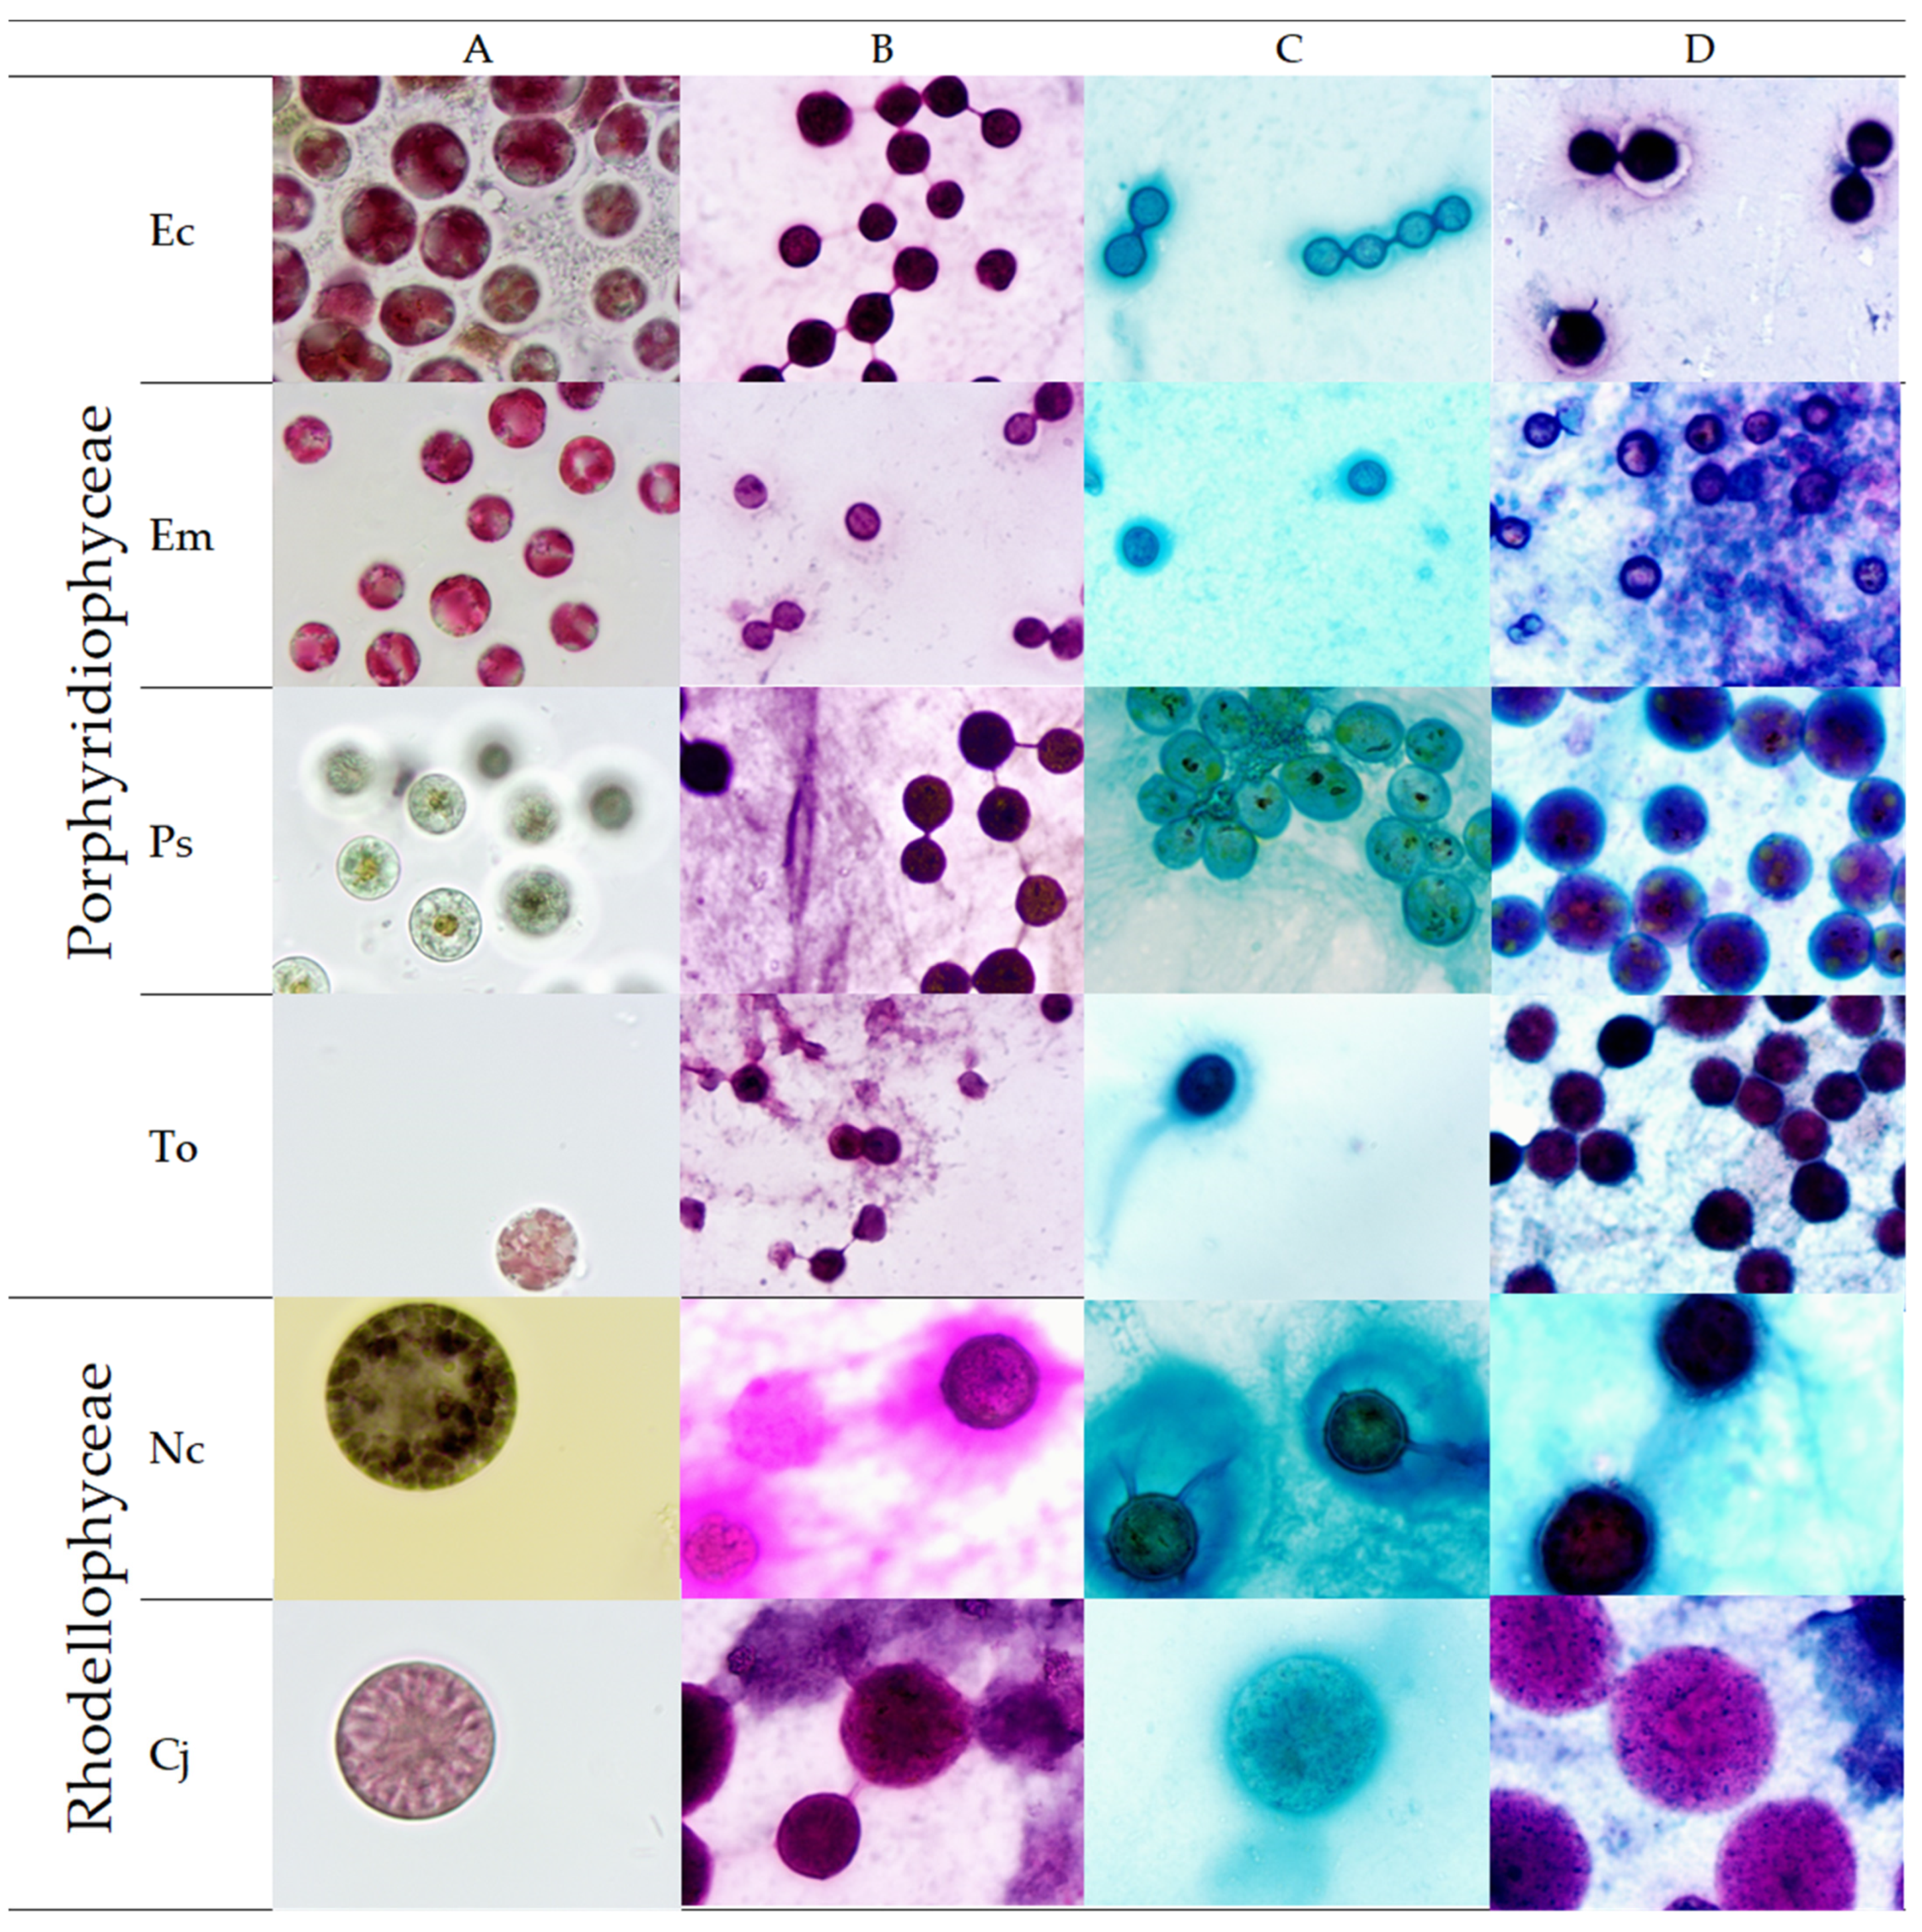
2.1. Microscopic Observations and Staining
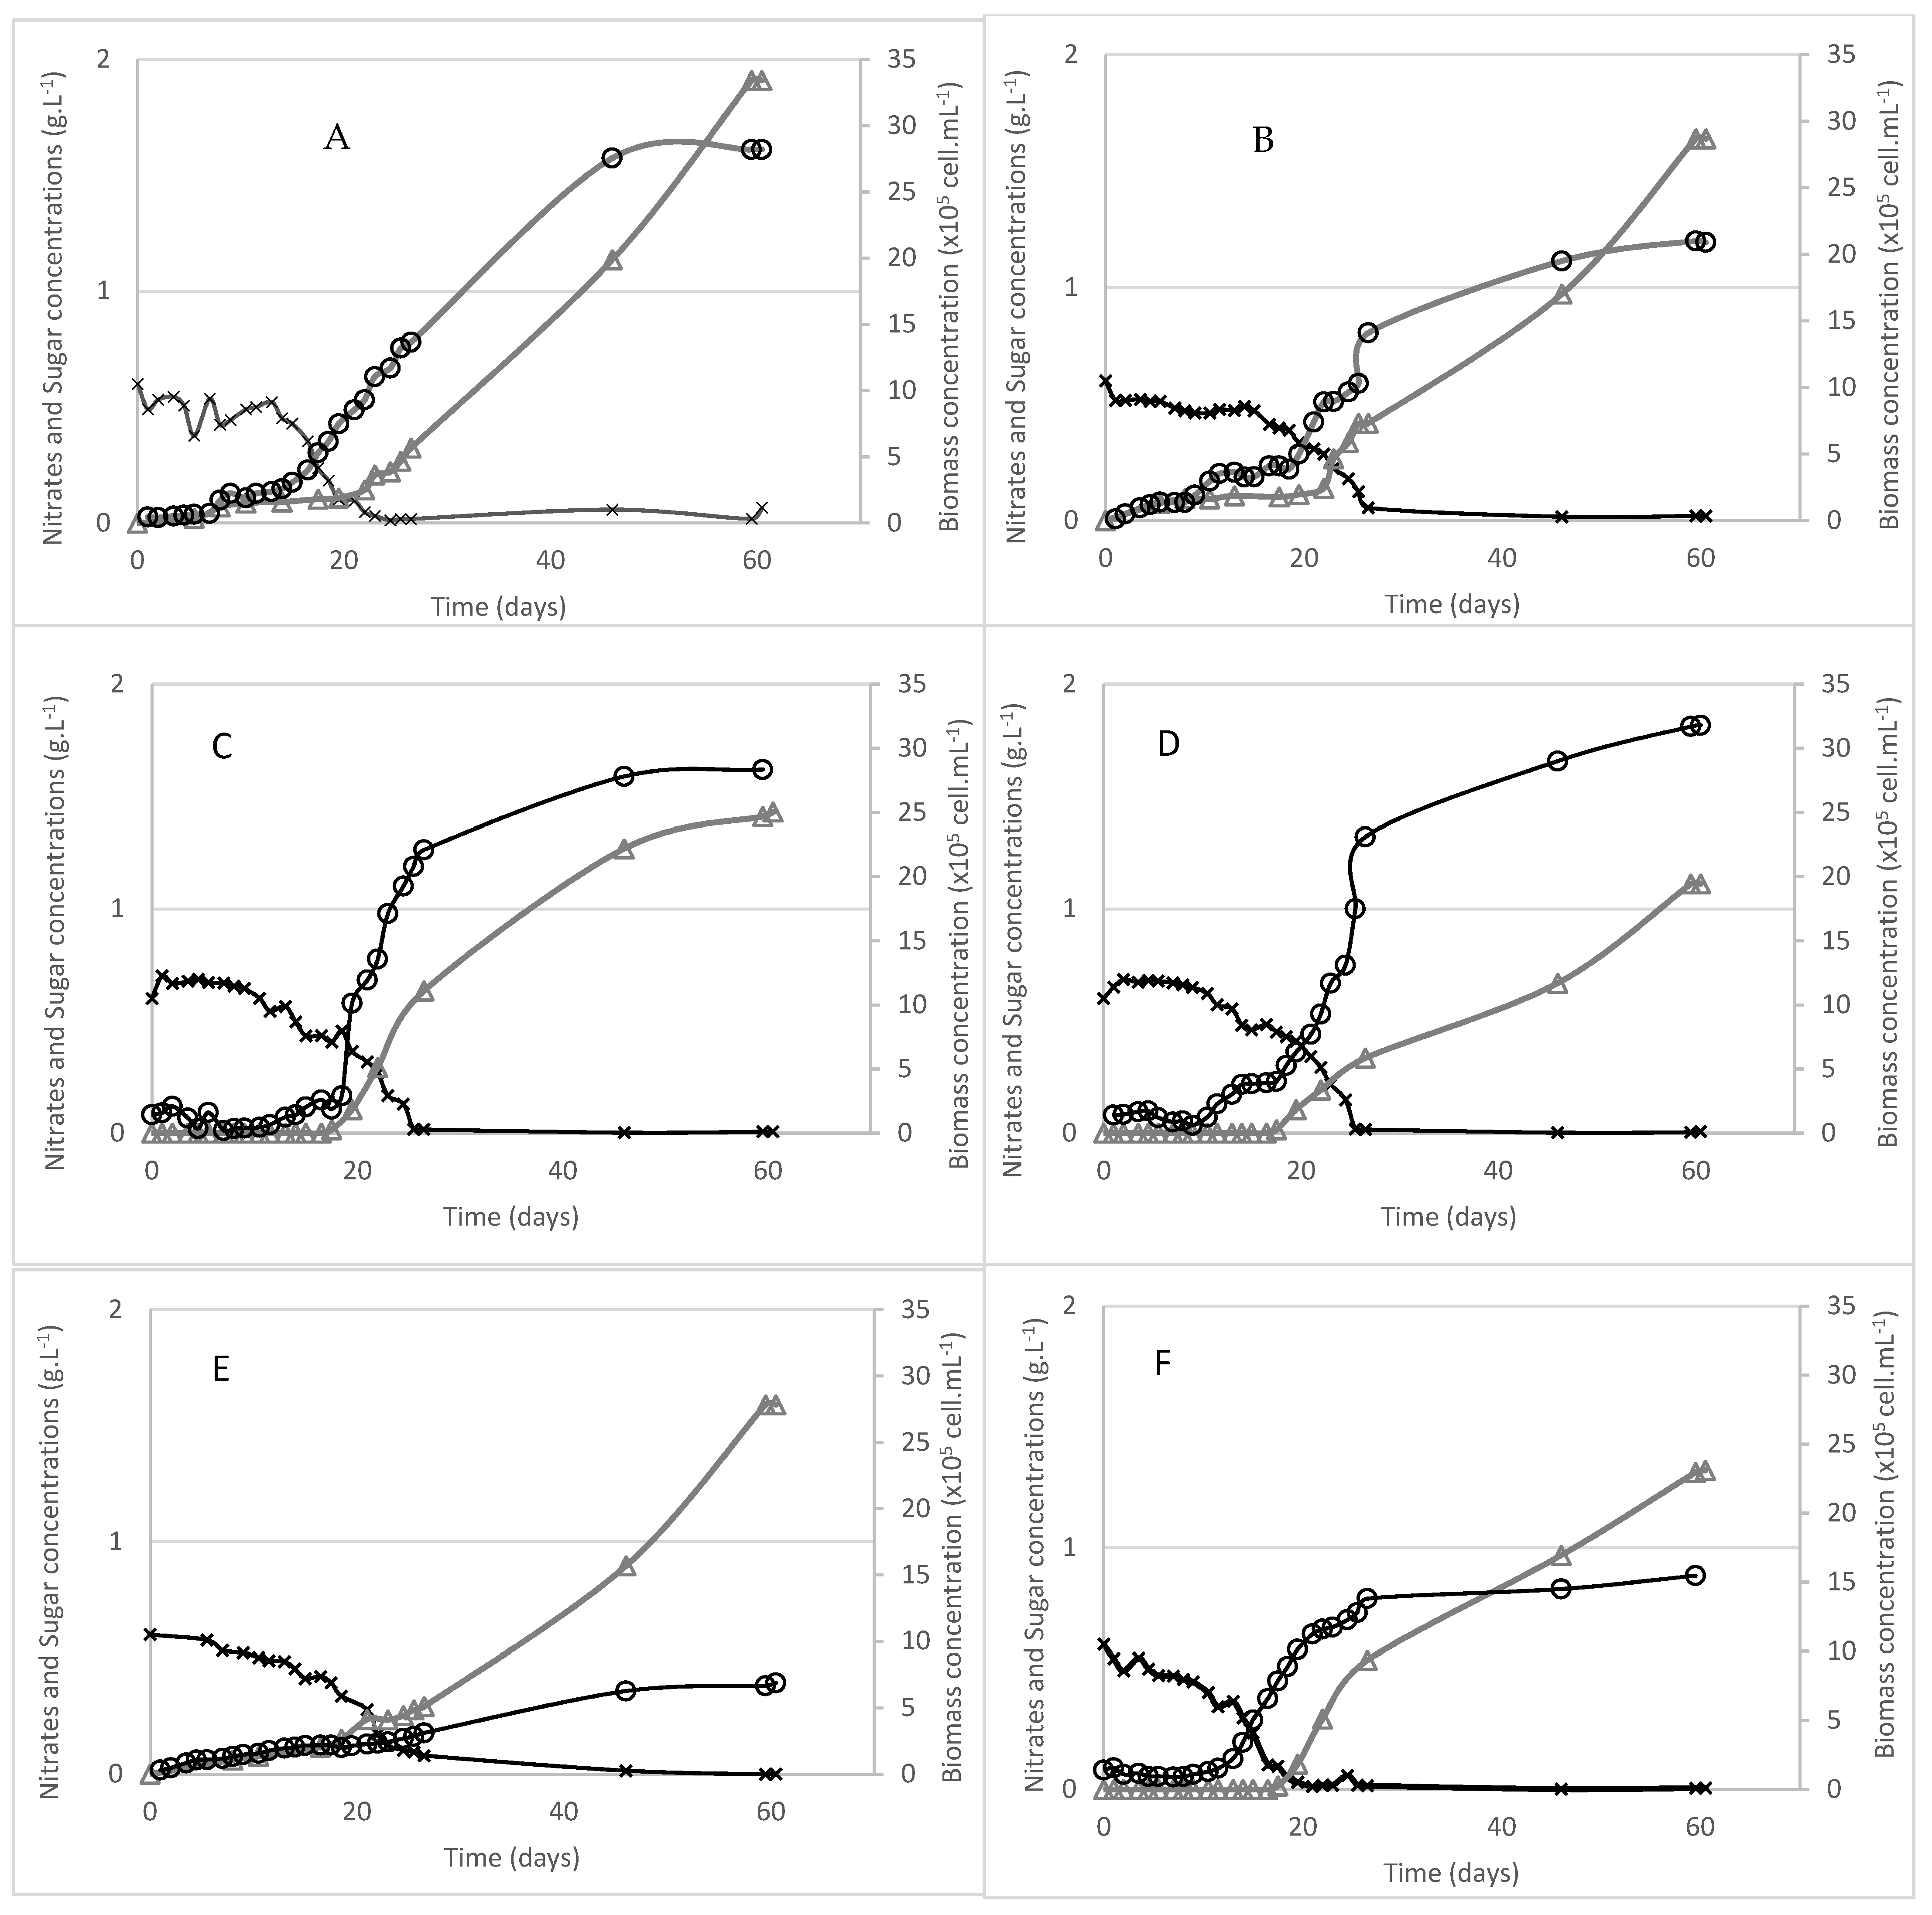
2.2. Growth and Exopolysaccharide Production
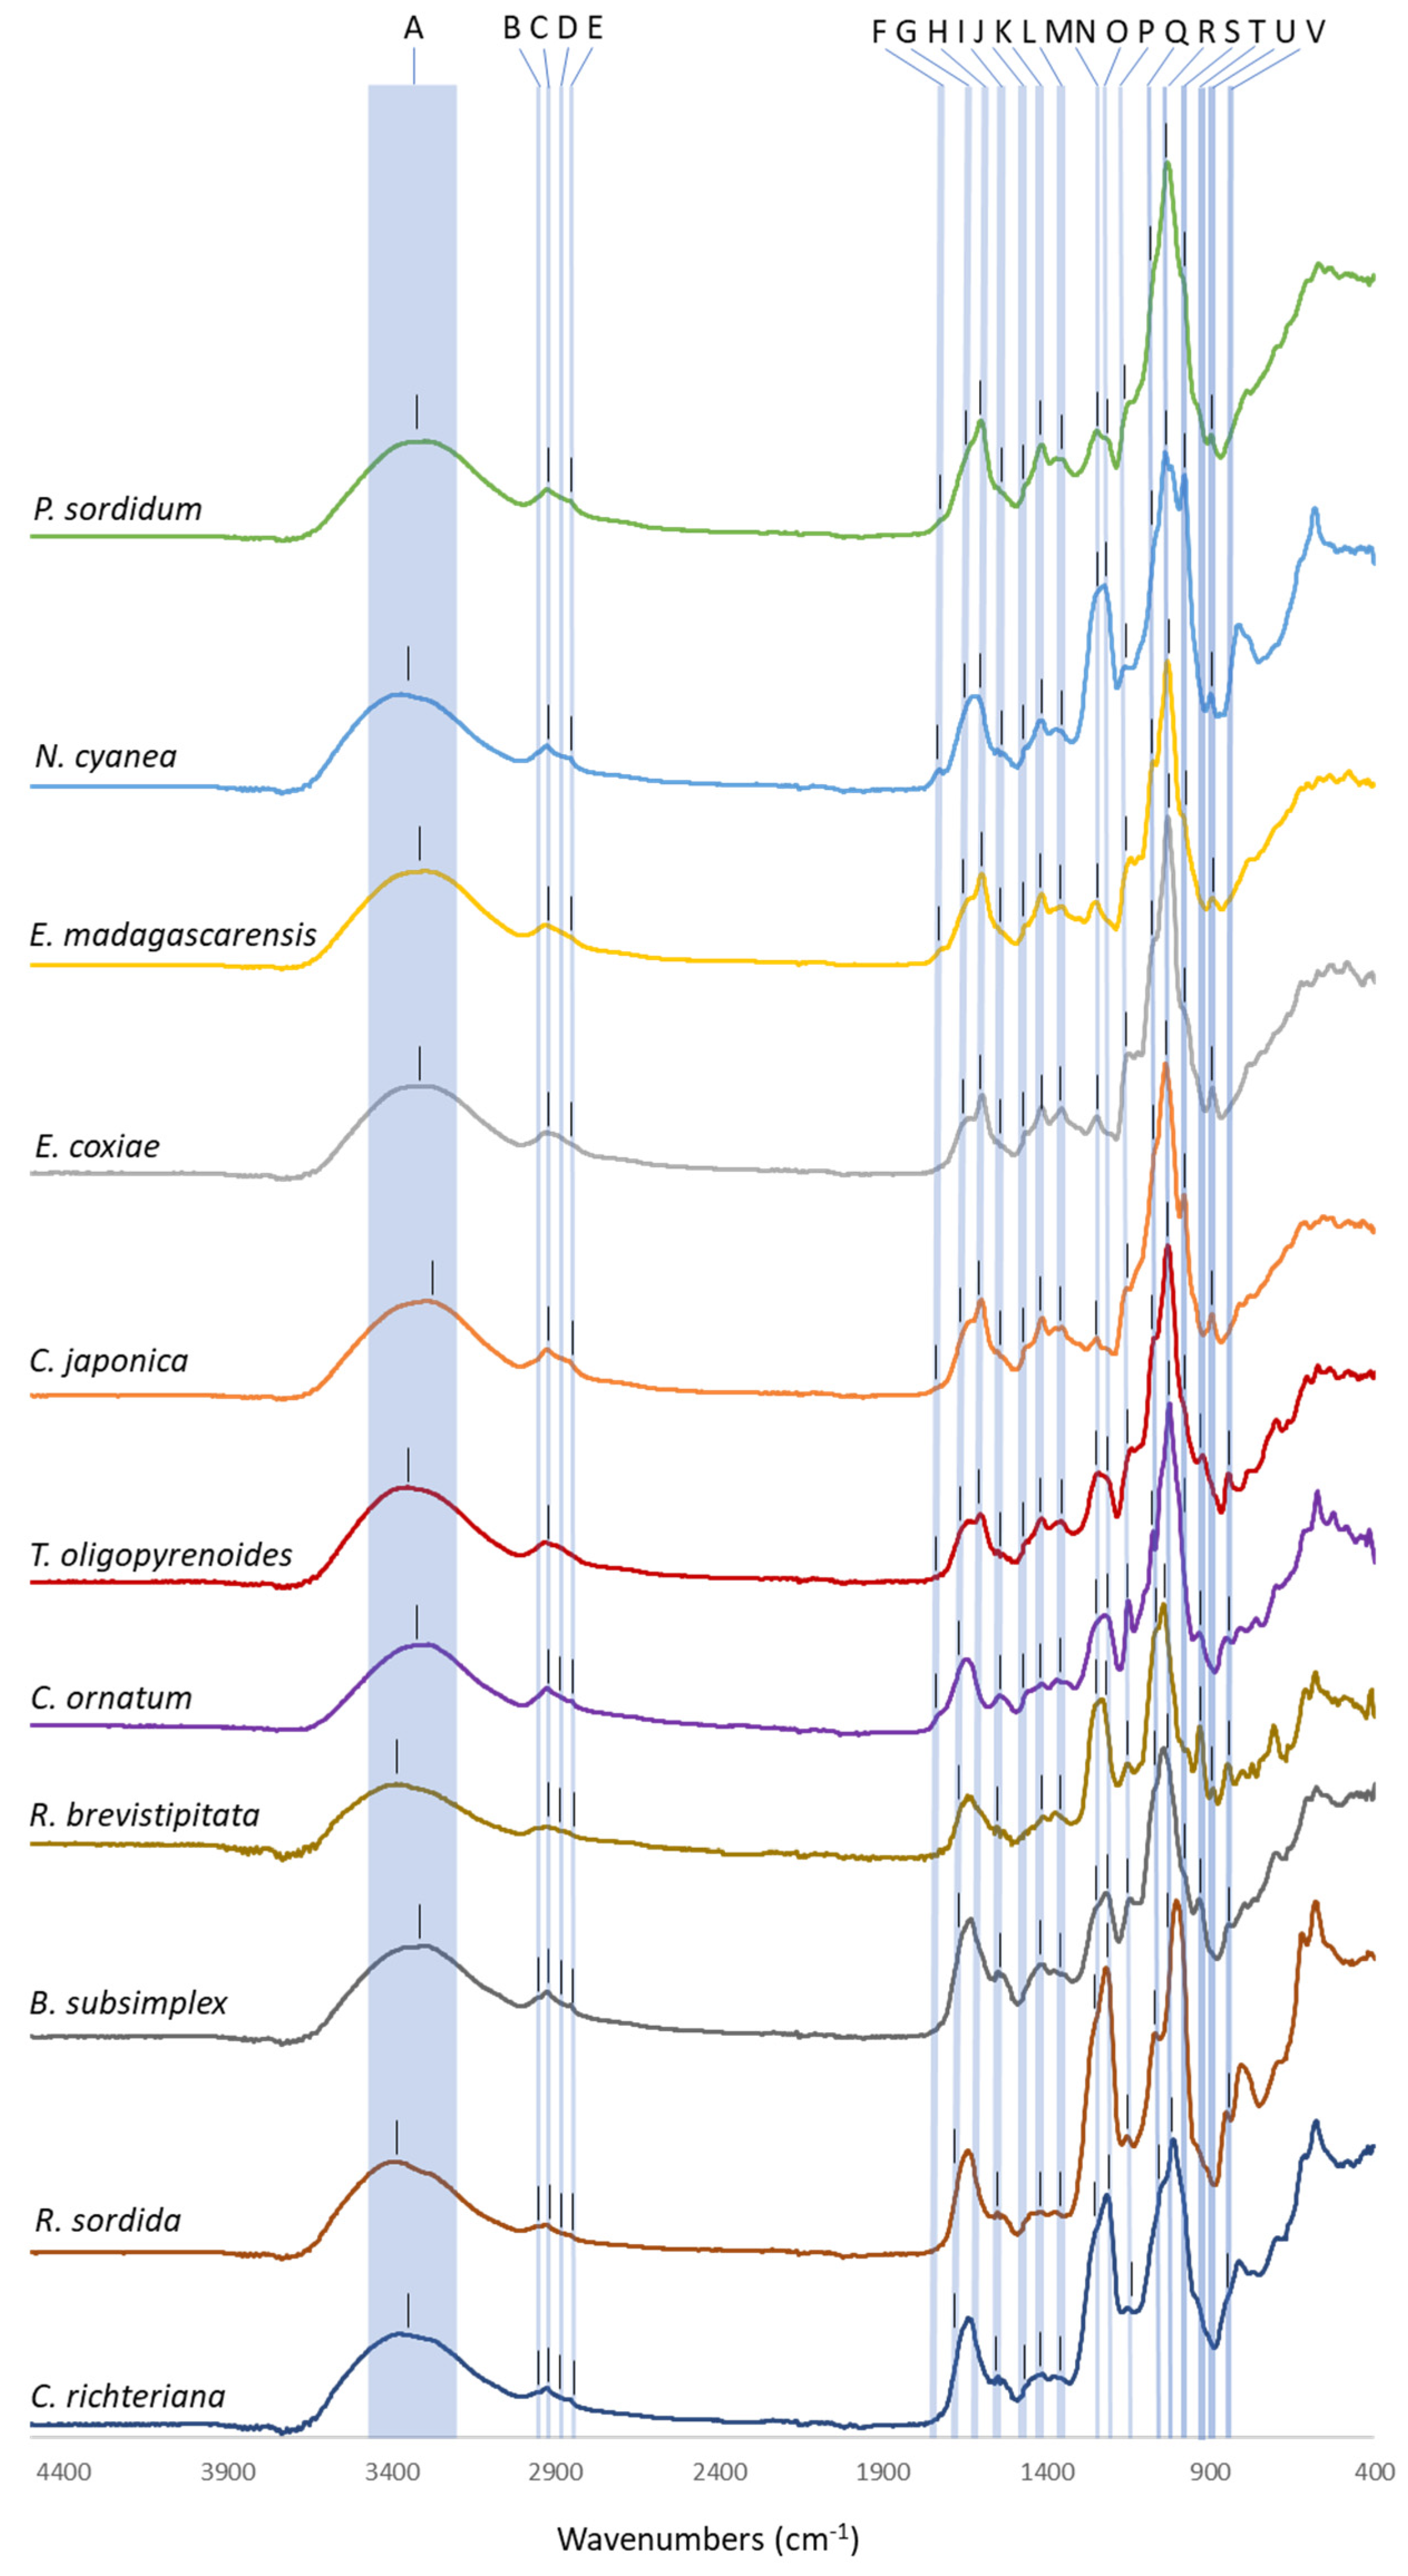
2.3. Exopolysaccharide Characterization
3. Discussion
4. Materials and Methods
4.1. Strains and Culture Conditions
4.1.1. Strains
4.1.2. Cultivation Conditions
4.2. Analysis during Growth
4.2.1. Biomass
4.2.2. Nitrates
4.2.3. Total Sugar Assay
4.3. Microscopic Observations
4.4. Extraction and Characterization of Polysaccharides
4.4.1. Extraction and Purification
4.4.2. Colorimetric Assays
4.4.3. Monosaccharides Composition
4.4.4. Fourier Transform Infrared Spectroscopy
Supplementary Materials
Author Contributions
Funding
Conflicts of Interest
References
- De Jesus Raposo, M.F.; de Morais, R.M.S.C.; de Morais, A.M.M.B. Bioactivity and applications of sulphated polysaccharides from marine microalgae. Mar. Drugs 2013, 11, 233–252. [Google Scholar] [CrossRef]
- Wolowski, K.; Kowalska, J.; Hindák, F. Chrodactylon ornatum (Rhodophyta, Porphyridiales) occurring in Poland and Slovakia. Biol. Bratisl. 2007, 62, 649. [Google Scholar] [CrossRef]
- Saunders, G.W.; Hommersand, M.H. Assessing red algal suprordinal diversity and taxonomy in the context of contemporary systematic data. Am. J. Bot. 2004, 91, 1494–1507. [Google Scholar] [CrossRef] [PubMed]
- Yoon, H.; Müller, K.; Sheat, R.; Ott, F.; Bhattacharya, D. Defining the major lineages of Red Algae (Rhodophyta). J. Phycol. 2006, 42, 482–492. [Google Scholar] [CrossRef]
- Muñoz Gómez, S.; Mejía Franco, F.; Dumin, K.; Colp, M.; Grisdale, C.; Archibald, J.; Slamovits, C. New Red Algal subphylum Proteorhodophytina comprises the largest and most divergent plastid genomes known. Curr. Biol. 2017, 27, 1677–1684. [Google Scholar] [CrossRef]
- Cabrera, J.M.; Stortz, C.A.; Rodríguez, M.C. A sulfated galactan from the mucilaginous sheath of the red filamentous alga Chroodactylon ornatum (Stylonematophyceae, Rhodophyta). J. Appl. Phycol. 2014, 26, 1801–1811. [Google Scholar] [CrossRef]
- Soanen, N.; Da Silva, E.; Gardarin, C.; Michaud, P.; Laroche, C. Improvement of exopolysaccharide production by Porphyridium marinum. Biores. Technol. 2016, 213, 231–238. [Google Scholar] [CrossRef]
- Villay, A.; Laroche, C.; Roriz, D.; El Alaoui, H.; Delbac, F.; Michaud, P. Optimisation of culture parameter for exopolysaccharides production by the microalgae Rhodella violacea. Biores. Technol. 2013, 146, 732–735. [Google Scholar] [CrossRef]
- Gaignard, C.; Macao, V.; Gardarin, C.; Rihouey, C.; Picton, L.; Michaud, P.; Laroche, C. The red microalga Flintiella sanguinaria as a new exopolysaccharide producer. J. Appl. Phycol. 2018, 30, 2803–2814. [Google Scholar] [CrossRef]
- Scott, J.; Baca, B.; Ott, F.; West, J. Light and electron microscopic observations on Erythrolobus coxiae gen. et sp. nov. (Porphyridiophyceae, Rhodophyta) from Texas, U.S.A. Algae 2006, 21, 407–416. [Google Scholar] [CrossRef]
- Yang, E.; Scott, J.; West, J.; Orlova, E.; Gauthier, D.; Küpper, F.; Yoon, H.-S.; Karsten, U. New taxa of the Prophyridiophyceae (Rhodophyta): Timspurckia oligopyrenoides gen. et sp. nov. and Erythrolobus madagascarensis sp. nov. Phycologia 2010, 49, 604–616. [Google Scholar] [CrossRef]
- Ott, F.D. A brief review of the species of Porphyridium with additional records for the rarely collected alga Porphyridium sordidum Geitler, 1932 (Rhodophycophyta, Porphyridiales). Arch. Prtotistenkd. 1987, 134, 35–41. [Google Scholar] [CrossRef]
- Patrone, L.M.; Broadwater, S.T.; Scott, J.L. Ultrastructure of vegetative and dividing cells of the unicellular red algae Rhodella violacea and Rhodella maculata. J. Phycol. 1991, 27, 742–753. [Google Scholar] [CrossRef]
- Scott, J.; Yokoyama, A.; Billard, C.; Fresne, L.J.; Hara, Y.; West, K.; West, A. Neorhodella cyanea, a new genus in the Rhodellophyceae (Rhodophyta). Phycologia 2008, 47, 560–572. [Google Scholar]
- Yokoyama, A.; Scott, J.; Zuccarello, G.C.; Kajikawa, M.; Hara, Y.; West, J. Corynoplastis japonica gen. et sp. nov. and Dioxoniellales ord. nov. (Rhodellophyceae, Rhodophyta) based on morphological and molecular evidence. Phycol. Res. 2009, 57, 278–289. [Google Scholar] [CrossRef]
- Singh, S.; Arad, S.M.; Richmond, A. Extracellular polysaccharide production in outdoor mass cultures of Porphyridium sp. in flat plate glass reactors. J. Appl. Phycol. 2000, 12, 269–275. [Google Scholar] [CrossRef]
- West, J.; Zucarello, G.; Scott, J.; Pickett-Heaps, J.; Kim, G. Observations on Purpureofilum apyrenoidigerum gen. et sp. nov. froma Australia and Bangiopsis subsimplex from India (Stylonematales, Bangiophyceae, Rhodophyta). Phycol. Res. 2005, 53, 46–66. [Google Scholar] [CrossRef]
- Aboal, M.; García-Fernández, M.; Roldán, M.; Whitton, B. Ecology, morphology and physiology of Chroothece richteriana (Rhodophyta, Stylonematophyceae) in the highly calcareus Río Chícamo, south-east Spain. Eur. J. Phycol. 2014, 49, 83–96. [Google Scholar] [CrossRef]
- Aboal, M.; Chapuis, I.; Paiano, M.O.; Sánchez, P.; West, J.A.; Whittone, B.A.; Necchi, O. Diversity of Chroothece (Rhodophyta, Stylonematales) including two new species. Eur. J. Phycol. 2018, 53, 189–197. [Google Scholar] [CrossRef]
- West, J.; Zucarrello, G.; Scott, J.; West, K.; Karsten, U. Rhodaphanes brevistipitata gen. et sp. nov., a new member of the Stylonematophyceae (Rhodophyta). Phycologia 2007, 46, 440–449. [Google Scholar] [CrossRef]
- Romualdo de Almeida, W.; Pita de Beauclair Guimarães, S.; do Nascimento Moura, C. Bangiopsis subsimplex (Mont.) F. Schmitz (Stylonematales, Rhodophyta) on the northeastern coast of Brazil. Acta Bot. Bras. 2013, 27, 231–236. [Google Scholar] [CrossRef]
- Johansen, J.; Fučíková, K.; Fitzpatrick, M. The red alga genus Rhodospora (Bangiophycidae, Rhodophyta): Report from North America. Phycol. Soc. Am. 2005, 41, 1281–1283. [Google Scholar] [CrossRef]
- You, T.; Barnett, S.M. Effect of light quality on production of extracellular polysaccharides and growth rate of Porphyridium cruentum. Biochem. Eng. J. 2004, 19, 251–258. [Google Scholar] [CrossRef]
- Medina-Cabrera, E.; Rühmann, B.; Schmid, J.; Sieber, V. Characterization and comparaison of Porphyridium sordidum and Porphyridium purpureum concerning groth characterisitics and polysaccharide production. Algal. Res. 2020, 49, 101931. [Google Scholar] [CrossRef]
- Pannard, A.; Pédrono, J.; Bormans, M.; Briand, E.; Claquin, P.; Lagadeue, Y. Production of exopolymers (EPS) by cyanobacteria: Impact on the carbon-to-nutrient ratio of the particulate organic matter. Aqu. Ecol. 2016, 50, 29–44. [Google Scholar] [CrossRef]
- Adda, M.; Merchuk, J.; Arad, S.M. Effect of nitrate on growth and production of cell-wall polysaccharide by the unicellular red alga Porphyridium. Biomass 1986, 10, 131–140. [Google Scholar] [CrossRef]
- Gaignard, C.; Laroche, C.; Pierre, G.; Dubessay, P.; Delattre, C.; Gardarin, C.; Gourvil, P.; Probert, I.; Dubuffet, A.; Michaud, P. Screening of microalgae: Investigation of new exopolysaccharide producers. Algal. Res. 2019, 44, 101711. [Google Scholar] [CrossRef]
- Underwood, G.J.C.; Boulcott, M.; Raines, C.A.; Waldron, K. Environmental effects on exoplymer production by marine benthic diatoms: Dynamics, changes in composition, and pathways of production. J. Phycol. 2004, 40, 293–304. [Google Scholar] [CrossRef]
- Filali-Mouhim, R.; Cornet, J.-F.; Fontane, T.; Fournet, B.; Dubertret, G. Production, isolation and preliminary characterization of the exopolysaccharide of the cyanobacterium Spirulina platensis. Biotechnol. Lett. 1993, 15, 567–572. [Google Scholar] [CrossRef]
- Maréchal, Y. Interaction configurations of H2O molecules in a protein (Stratum Corneum) by infrared spectrometry. J. Mol. Struct. 1997, 416, 133–143. [Google Scholar] [CrossRef]
- Kačuráková, M.; Capek, P.; Sasinkova, V.; Wellner, N.; Ebringerova, A. FT-IR study of plant cell wall model compounds: Pectic polysaccharides and hemicelluloses. Carbohyd. Pol. 2000, 43, 195–203. [Google Scholar] [CrossRef]
- Manrique, G.D.; Lajolo, F.M. FT-IR spectroscopy as a tool for measuring degree of methyl esterification in pectins isolated from ripening papaya fruit. Postharvest Biol. Tech. 2002, 25, 99–107. [Google Scholar] [CrossRef]
- Monsoor, M.A.; Kalapathy, U.; Proctor, A. Determination of polygalacturonic acid content in pectin extracts by diffuse reflectance Fourier transform infrared spectroscopy. Food Chem. 2001, 74, 233–238. [Google Scholar] [CrossRef]
- Gómez-Ordóñez, E.; Rupérez, P. FTIR-ATR spectroscopy as a tool for polysaccharide identification in edible brown and red seaweeds. Food Hydrocoll. 2011, 25, 1514–1520. [Google Scholar] [CrossRef]
- Chopin, T.; Kerin, B.F.; Mazerolle, R. Phycocolloid chemistry as a taxonomic indicator of phylogeny in the Gigartinales, Rhodophyceae: A review and current developments using Fourier transform infrared diffuse reflectance spectroscopy. Phycol. Res. 1999, 47, 167–188. [Google Scholar] [CrossRef]
- Liao, M.-L.; Chiovitti, A.; Munro, S.L.A.; Craik, D.J.; Kraft, G.T.; Bacic, A. Sulfated galactans from Australian specimens of the red alga Phacelocarpus peperocarpos (Gigartinales, Rhodophyta). Carbohyd. Res. 1996, 296, 237–247. [Google Scholar] [CrossRef]
- Lloyd, A.G.; Dodgson, K.S.; Price, R.G.; Rose, F.A.I. Infrared studies on sulphate esters. I. Polysaccharide sulphates. Biochim. Biophys. Acta 1961, 46, 108–115. [Google Scholar] [CrossRef]
- Garcia, R.B.; Vidal, R.R.L.; Rinaudo, M. Preparation and Structural Characterization of O-Acetyl Agarose with Low Degree of Substitution. Polímeros 2000, 10, 155–161. [Google Scholar] [CrossRef]
- Capek, P.; Matulová, M.; Combourieu, B. The extracellular proteoglycan produced by Rhodella grisea. Int. J. Biol. Macromol. 2008, 43, 390–393. [Google Scholar] [CrossRef]
- Geresh, S.; Lupescu, N.; Arad, S.M. Fractionation and partial characterization of the sulphated polysaccharide of Porphyridium. Phytochem 1992, 31, 4181–4186. [Google Scholar] [CrossRef]
- Arad, S.M.; Levy-Ontman, O. Red microalgal cell-wall polysaccharides: Biotechnological aspects. Curr. Op. Biotechnol. 2010, 21, 358–364. [Google Scholar] [CrossRef] [PubMed]
- Percival, E.; Foyle, R.A.J. The extracellular polysaccharides of Porphyridium cruentum and Porphyridium aerugineum. Carbohyd. Res. 1979, 72, 165–176. [Google Scholar] [CrossRef]
- De Philippis, R.; Margheri, M.C.; Materrasi, R.; Vincenzini, M. Potential of Unicellular Cyanobacteria from Saline Environments as Exopolysaccharide Producers. Appl. Environ. Microbiol. 1998, 64, 1130–1132. [Google Scholar] [CrossRef] [PubMed]
- Pereira, S.; Zille, A.; Micheletti, E.; Moradas-Ferraira, P.; De Philippis, R.; Tamagnini, P. Complexity of cyanobacterial exopolysaccharides: Composition, structures, inducing factors and putative genes involved in their biosynthesis and assembly. FEMS Microbiol. Rev. 2009, 33, 917–941. [Google Scholar] [CrossRef] [PubMed]
- Pereira, L.; Amado, A.M.; Critchley, A.T.; van de Velde, F.; Ribeiro-Claro, P.J.A. Identification of selected seaweed polysaccharides (phycocolloids) by vibrational spectroscopy (FTIR-ATR and FT-Raman). Food Hydrocoll. 2009, 23, 1903–1909. [Google Scholar] [CrossRef]
- Synytsya, A.; Mícková, K.; Synytsya, A.; Jablonský, I.; Spevácek, J.; Erban, V.; Kováríková, E.; Copíková, J. Glucans from fruit bodies of cultivated mushrooms Pleurotus ostreatus and Pleurotus eryngii: Structure and potential prebiotic activity. Carbohydr. Polym. 2009, 76, 548–556. [Google Scholar] [CrossRef]
- Horikawa, Y.; Hirano, S.; Mihashi, A.; Kobayashi, Y.; Zhai, S.; Sugiyama, J. Prediction of Lignin Contents from Infrared Spectroscopy: Chemical Digestion and Lignin/Biomass Ratios of Cryptomeria japonica. Appl. Biochem. Biotechnol. 2019, 188, 1066–1076. [Google Scholar] [CrossRef]
- Roussel, M.; Villay, A.; Delbac, F.; Michaud, P.; Laroche, C.; Roriz, D.; El Alaoui, H.; Diogon, M. Antimicrosporidian activity of sulphated polysaccharide from algae and their potential to control honeybee nosemis. Carbohydr. Polym. 2015, 133, 213–220. [Google Scholar] [CrossRef]
- Gaignard, C.; Gargouch, N.; Dubessay, P.; Delattre, C.; Pierre, G.; Laroche, C.; Fendri, I.; Abdelkafi, S.; Michaud, P. New horizons in culture and valorization of red microalgae. Biotechnol. Adv. 2019, 37, 193–222. [Google Scholar] [CrossRef]
- Allard, B.; Tazi, A. Influence of growth status on composition of extracellular polysaccharides from two Chlamydomonas species. Phytochem 1992, 32, 41–47. [Google Scholar] [CrossRef]
- Domozych, C.R.; Plante, K.; Blais, P.; Paliulis, L.; Domozych, D.S. Mucilage processing and secretion in the green alga Closterium. I. Cytology and Biochemistry. J. Phycol. 1993, 29, 650–659. [Google Scholar] [CrossRef]
- Volk, R.B.; Venzke, K.; Blaschek, W. Structural investigation of a polysaccharide released by the cyanobacterium Nostoc insulare. J. Appl. Phycol. 2007, 19, 255–262. [Google Scholar] [CrossRef]
- Jin, C.; Yu, Z.; Peng, S.; Feng, K.; Zhang, L.; Zhou, X. The characterization and comparison of exopolysaccharides from two benthic diatoms with different biofilm formation abilities. Ana. Acad Bras. Ciên. 2018, 90, 1503–1519. [Google Scholar] [CrossRef] [PubMed]
- Arad, S.M.; Adda, M.; Cohen, E. The potential of production of sulfated polysaccharides from Porphyridium. Plant Soil 1985, 89, 117–127. [Google Scholar] [CrossRef]
- Evans, L.V. Electron microscopical observations on a new red algal unicell, Rhodella maculata gen. nov., sp. nov. Br. Phycol J. 1970, 5, 1–13. [Google Scholar] [CrossRef]
- Rossi, F.; De Philippis, R. Exocellular polysaccharides in Microalgae and Cyanobacteria: Chemical Features, Role and Enzymes and Genes involved in their Biosynthesis. In Physiology of Microalgae; Chapter 6; Borowitzka, M.A., Beardall, J., Raven, J.A., Eds.; Springer International Publishing: Cham, Switzerland, 2016; pp. 565–590. [Google Scholar]
- Delattre, C.; Pierre, G.; Laroche, C.; Michaud, P. Production, extraction and characterization of microalgal and cyanobacterial exopolysaccharides. Biotechnol. Adv. 2016, 34, 1159–1179. [Google Scholar] [CrossRef]
- Phélippé, M.; Gonçalves, M.; Thouand, G.; Cogne, G.; Laroche, C. Characterization of the polysaccharides chemical diversity of the cyanobacteria Arthrospira platensis. Algal. Res. 2019, 33, 101426. [Google Scholar] [CrossRef]
- Sun, L.; Wang, C.; Shi, Q.; Ma, C. Preparation of different molecular weight polysaccharides from Porphyridium cruentum and their antioxidant activities. Int. J. Biol. Macromol. 2009, 45, 42–47. [Google Scholar] [CrossRef]
- Tannin-Spitz, T.; Bergman, M.; Van-Moppes, D.; Grossman, S.; Arad, S.M. Antioxidant activity of the polysaccharide of the red microalga Porphyridium sp. J. Appl. Phycol. 2005, 17, 215–222. [Google Scholar] [CrossRef]
- Chen, B.; You, W.; Huang, J.; Yu, Y.; Chen, W. Isolation and antioxidant property of the extracellular polysaccharide from Rhodella reticulata. W J. Microbiol. Biotechnol. 2010, 26, 833–840. [Google Scholar] [CrossRef]
- Wang, L.; Sun, L.Q.; Zhao, X.H. Physicochemical property analysis of polysaccharides from marine microalgae and their antioxidation, hygroscopicity and moisture retention activities. Fine Chem. 2012, 1, 20–25. [Google Scholar]
- Huheihel, M.; Ishanu, V.; Tal, J.; Arad, S.M. Antiviral effect of red microalgal polysaccharides on Herpes simplex and Varicella zoster viruses. J. Appl. Phycol. 2001, 13, 127–134. [Google Scholar] [CrossRef]
- Huheihel, M.; Ishanu, V.; Tal, J.; Arad, S.M. Activity of Porphyridium sp. polysaccharide against herpes simplex viruses in vitro and in vivo. J. Biochem. Biophys. Meth. 2002, 50, 189–200. [Google Scholar] [CrossRef]
- Gargouch, N.; Elleuch, F.; Karkouch, I.; Tabbene, O.; Pichon, C.; Gardarin, C.; Rihouey, C.; Picton, L.; Abdelkafi, S.; Fendri, I.; et al. Potential of Exopolysaccharide from Porphyridium marinum to Contend with Bacterial Proliferation, Biofilm Formation, and Breast Cancer. Mar. Drugs 2021, 19, 66–84. [Google Scholar] [CrossRef]
- Sun, L.; Wang, L.; Zhou, Y. Immunomodulation and antitumor activities of different-molecular-weight polysaccharides from Porphyridium cruentum. Carbohyd. Polym. 2012, 87, 1206–1210. [Google Scholar] [CrossRef]
- Gardeva, E.; Toshkova, R.; Minkova, K.; Gigova, L. Cancer Protective Action of Polysaccharide, Derived from Red Microalga Porphyridium cruentum—A Biological Background. Biotechnol. Biotech. Equip. 2009, 23, 783–787. [Google Scholar] [CrossRef]
- Matsui, M.S.; Muizzuddin, N.; Arad, S.M.; Marenus, K. Sulfated polysaccharides from red microalgae have antiinflammatory properties in vitro and in vivo. Appl. Biochem. Biotechnol. 2003, 104, 13–22. [Google Scholar] [CrossRef]
- Hayman, J.R.; Southern, T.R.; Nash, T.E. Role of sulfated glycans in adherence of the microsporidian Encephalitozoon intestinalis to host cells in vitro. Inf. Immun. 2005, 73, 841–848. [Google Scholar] [CrossRef]
- Hintze, V.; Miron, A.; Moeller, S.; Schnabelrauch, M.; Wiesmann, H.P.; Worch, H.; Scharnweber, D. Sulfated hyaluronan and chondroitin sulfate derivatives interact differently with human transforming growth factor-β1 (TGF-β1). Acta Biomat. 2012, 8, 2144–2152. [Google Scholar] [CrossRef]
- Corsuto, L.; Rother, S.; Koehler, L.; Bedini, E.; Moeller, S.; Schnabelrauch, M.; Hintze, V.; Schirald, I.C.; Scharnweber, D. Sulfation degree not origin of chondroitin sulfate derivatives modulates keratinocyte response. Carbohyd. Polym. 2018, 191, 53–64. [Google Scholar] [CrossRef]
- Kreuger, J.; Spillmann, D.; Li, J.P.; Lindahl, U. Interactions between heparan sulfate and proteins: The concept of specificity. J. Cell Biol. 2006, 174, 323–327. [Google Scholar] [CrossRef] [PubMed]
- Hidari, K.; Takahashi, N.; Arihara, M.; Nagaoka, M.; Morita, K.; Suzuki, T. Structure and anti-dengue virus activity of sulfated polysaccharide from a marine alga. Biochem. Biophys. Res. Commun. 2008, 376, 91–95. [Google Scholar] [CrossRef] [PubMed]
- Wagner, H.; Proksch, A.; Riess-Maurer, I.; Vollmar, A.; Odenthal, S.; Stuppner, H.; Jurcic, K.; Le Turdu, M.; Fang, J.N. Immunostimulating action of polysaccharides (heteroglycans) from higher plants. Drug Res. 1985, 35, 1069–1075. [Google Scholar]
- Guillard, R.R.L.; Rythe, J.H. Studies of marine planktonic diatoms. I Cyclotella nana Hustedt and Detonulaconfervaceae (Cleve) Gran. Can. J. Microbiol. 1962, 8, 229–239. [Google Scholar] [CrossRef]
- Cawse, P.A. The determination of nitrate in soil solutions by ultraviolet spectrometry. Analyst 1967, 62, 311–315. [Google Scholar] [CrossRef]
- A.P.H.A Ultraviolets Spectrometric Method in Standard Methods for the Examination of Water and Wastewater; American Public Health Association: Washington, DC, USA, 1971; pp. 237–239.
- Dubois, M.; Gilles, K.A.; Hamilton, J.K.; Rebers, P.A.; Smith, F. Colorimetric method for determination of sugars and related substances. Anal. Chem. 1956, 28, 350–356. [Google Scholar] [CrossRef]
- Hotchkiss, R.D. A microchemical reaction resulting in the staining of polysaccharide structures in fixed tissue preparation. Arch. Biochem. 1948, 16, 131–141. [Google Scholar]
- Passow, U.; Alldredge, A.L. A dye-binding assay for the spectrophotometric measurement of transparent exopolymer particles (TEP). Limnol. Ocean. 1995, 40, 1326–1335. [Google Scholar] [CrossRef]
- Patel, A.K.; Laroche, C.; Marcati, A.; Ursu, A.V.; Jubeau, S.; Marchal, L.; Petit, E.; Djelveh, G.; Michaud, P. Separation and fractionation of exopolysaccharides from Porphyridium cruentum. Biores. Technol. 2013, 145, 345–350. [Google Scholar] [CrossRef]
- Blumenkrantz, N.; Asboe-Hansen, G. New method for quantitative determination of uronic acids. Anal. Biochem. 1973, 54, 484–489. [Google Scholar] [CrossRef]
- Monsigny, M.; Petit, C.; Roche, A.C. Colorimetric determination of neutral sugars by a resorcinol sulphuric acid micromethod. Anal. Biochem. 1988, 175, 525–530. [Google Scholar] [CrossRef]
- Montreuil, J.; Spik, G.; Chosson, A.; Segard, E.; Scheppler, N. Methods of study of the structure of glycoproteins. J. Pharm. Belg. 1963, 18, 529–546. [Google Scholar] [PubMed]
- Dodgson, K.S.; Price, R.G. A note on the determination of the ester sulphate content of sulphated polysaccharides. Biochem. J. 1962, 84, 106–110. [Google Scholar] [CrossRef] [PubMed]
- Lowry, O.H.; Rosebrough, N.J.; Farr, A.L.; Randall, R.J. Protein measurement with the Folin phenol reagent. J. Biol. Chem. 1951, 193, 265–275. [Google Scholar] [CrossRef]
- Deamici, K.M.; de Morais, M.G.; Santos, L.O.; Muylaert, K.; Gardarin, C.; Costa, J.A.V.; Laroche, C. Static Magnetic Fields Effects on Polysaccharides Production by Different Microalgae Strains. Appl. Sci. 2021, 11, 5299–5310. [Google Scholar] [CrossRef]


| STRAINS | EPS Production Phase | Apparent µmax (d−1) | Dt (d) | Final Biomass Production (×106 cell·mL−1) | Final Biomass Production (g L−1) | Final RPS Production (g L−1) | Productivity RPS (g EPS/g DW Biomass) | Productivity RPS (mg EPS/106 cell) | Productivity BPS (g EPS/g DW Biomass) |
|---|---|---|---|---|---|---|---|---|---|
| T. oligopyrenoides | Stationary | 0.152 | 4.55 | 31.8 | 2.2 | 1.12 | 0.35 | 0.035 | nd |
| E. coxiae | End of Log/ Stationary | 0.2632 | 2.63 | 28.34 | 2.04 | 1.43 | 0.47 | 0.05 | nd |
| E. madagascarensis | End of Log/ Stationary | 0.1026 | 6.75 | 20.9 | 1.79 | 1.63 | 0.78 | 0.078 | nd |
| P. sordidum | Log/ Stationary | 0.151 | 4.58 | 28.2 | 1.81 | 1.91 | 0.68 | 0.068 | nd |
| N. cyanea | End of Log/ Stationary | 0.172 | 4.02 | 15.4 | 2.35 | 2.32 | 0.99 | 0.151 | nd |
| C. japonica | Log/ Stationary | 0.067 | 10.34 | 6 | 2.49 | 1.59 | 0.64 | 0.265 | nd |
| C. ornatum | nd | nd | nd | nd | 1.2 | 0.014 | 0.0086 | nd | 0.24 |
| C. richteriana | nd | nd | nd | nd | 0.64 | 0.023 | 0.0018 | nd | 0.19 |
| B. subsimplex | nd | nd | nd | nd | 0.46 | 0.011 | 0.0013 | nd | 0.08 |
| R. sordida | nd | nd | nd | nd | 0.72 | 0.021 | 0.0038 | nd | 0.14 |
| R. brevistipitata | nd | nd | nd | nd | 0.51 | 0.013 | 0.0021 | nd | 0.11 |
| Wavenumber (cm−1) | Assignment | Reference | Ps | Ec | Em | To | Nc | Cj | Co | Rb | Bs | Rs | Cr | |
|---|---|---|---|---|---|---|---|---|---|---|---|---|---|---|
| A | 3200–3400 | OH stretching | [30] | 3309 | 3305 | 3306 | 3350 | 3358 | 3290 | 3301 | 3329 | 3318 | 3340 | 3303 |
| B | 2950–2960 | CH3 stretching | [30] | nd | nd | nd | nd | nd | nd | nd | nd | 2954 | 2954 | 2953 |
| C | 2920–2930 | CH2 stretching | [30] | 2923 | 2927 | 2927 | 2928 | 2924 | 2923 | 2923 | 2925 | 2923 | 2925 | 2924 |
| D | 2870–2880 | CH3 stretching | [30] | nd | nd | nd | nd | nd | nd | 2873 | 2873 | 2871 | 2875 | 2875 |
| E | 2845–2855 | CH2 stretching | [30] | 2855 | nd | nd | nd | 2845 | 2852 | 2852 | 2848 | 2854 | 2854 | 2854 |
| F | 1725–1740 | O-Ac | [38] | 1730 | nd | 1725 | 1726 | 1730 | 1726 | nd | nd | nd | nd | nd |
| G | 1630–1660 | C=O | [47] | 1640 | 1640 | 1638 | 1650 | 1641 | 1638 | 1648 | 1641 | 1638 | 1633 | 1639 |
| H | 1585–1605 | COO− stretching | [32,33,34] | 1599 | 1596 | 1597 | 1605 | 1605 | 1599 | nd | nd | nd | nd | nd |
| I | 1525–1540 | amide II (proteins) | [30] | 1536 | 1536 | 1537 | 1535 | 1536 | 1536 | 1542 | 1531 | 1535 | 1536 | 1535 |
| J | 1455–1470 | CH3 bending | [30] | 1460 | 1461 | 1461 | 1458 | 1461 | 1461 | 1459 | nd | nd | nd | 1460 |
| K | 1400–1420 | COO− stretching | [31,32,33] | 1414 | 1414 | 1414 | 1413 | 1415 | 1413 | 1412 | 1409 | 1413 | 1414 | 1414 |
| L | 1340–1350 | CH bending | [30] | 1352 | 1354 | 1355 | 1355 | 1358 | 1353 | 1346 | 1353 | 1354 | 1353 | 1348 |
| M | 1245–1255 | S=O | [36,37] | 1242 | 1246 | 1251 | 1245 | 1247 | 1247 | 1252 | 1252 | 1255 | 1257 | 1257 |
| N | 1240–1250 | O-Ac | [9] | |||||||||||
| O | 1215–1225 | S=O | [35] | 1211 | nd | nd | 1213 | 1216 | nd | 1221 | 1221 | 1217 | 1217 | 1215 |
| P | 1135–1145 | C-O-C | [31] | 1143 | 1145 | 1143 | 1138 | 1144 | 1146 | 1149 | 1152 | 1144 | 1143 | 1142 |
| Q | 1165–1075 | C-OH | [31] | 1068 | 1076 | 1074 | 1075 | 1068 | 1080 | 1075 | 1072 | 1075 | 1068 | 1071 |
| R | 1020–1030 | C-C | [31] | 1031 | 1030 | 1031 | 1025 | 1020 | 1036 | 1025 | 1023 | 1030 | 1025 | 1020 |
| S | 980–985 | C-H | [30] | 980 | 975 | 977 | 977 | 979 | 980 | 985 | nd | 975 | nd | nd |
| T | 925–935 | C-O-C (AnGal) | [45] | nd | nd | nd | 923 | nd | nd | 933 | 932 | 934 | nd | nd |
| U | 890–900 | β linkage | [46] | 897 | 894 | 894 | nd | 898 | 895 | nd | 891 | nd | nd | nd |
| V | 840–850 | α linkage | [46] | nd | nd | nd | 845 | nd | nd | 850 | 847 | 843 | 851 | 852 |
| Strains | Samples Composition [% Mass] | EPS Composition [% Mass (g / 100g EPS)] | |||
|---|---|---|---|---|---|
| % Total Carbohydrates | % Proteins | % Neutral Sugars | % Uronic Acids | Sulphate Groups (%, eq. SO4) | |
| E. coxiae | 62 | 5.1 | 68.2 | 30.2 | 1.6 |
| E. madagascarensis | 68.1 | 5.7 | 67.1 | 31 | 1.9 |
| P. sordidum | 61.5 | 9.5 | 72.4 | 20.8 | 6.8 |
| T. oligopyrenoides | 63.6 | 6.4 | 67.5 | 18.1 | 14.4 |
| C. japonica | 78.4 | 11 | 61.3 | 37.5 | 1.2 |
| N. cyanea | 71.5 | 8.6 | 38.7 | 37.1 | 24.2 |
| C. ornatum | 64.3 | 5.3 | 69.1 | 11 | 19.9 |
| C. richteriana | 57.2 | 8.7 | 61.2 | 12.4 | 26.4 |
| B. subsimplex | 45.8 | 11.4 | 71.4 | 9.5 | 19.1 |
| R. sordida | 47.3 | 12.3 | 66.8 | 4.5 | 28.7 |
| R. brevistipitata | 51.2 | 9.4 | 79.7 | 2 | 18.3 |
| % Molar Ratio | E. coxiae | E. madagascarensis | T. oligopyrenoides | P. sordidum | P. sordidum | P. purpureum | P. marinum | F. sanguinaria |
|---|---|---|---|---|---|---|---|---|
| Fucose | 4.50% | 1.90% | 1.70% | 0.00% | 0.00% | 0.00% | 1.00% | 0.00% |
| Rhamnose | 0.40% | 0.50% | 0.00% | 0.30% | 0.00% | 0.00% | 0.00% | 10.00% |
| Arabinose | 2.20% | 2.80% | 0.20% | 0.00% | 0.00% | 0.00% | 0.00% | 2.00% |
| Galactose | 12.00% | 22.30% | 28.20% | 21.10% | 33.00% | 32.00% | 28.00% | 21.00% |
| Glucose | 1.00% | 1.70% | 1.50% | 12.80% | 23.00% | 21.00% | 18.00% | 6.00% |
| Xylose | 58.30% | 49.10% | 51.00% | 46.40% | 39.00% | 41.00% | 47.00% | 47.00% |
| Galacturonic acid | 0.60% | 0.50% | 0.20% | 1.10% | 0.00% | 0.00% | 0.00% | 0.00% |
| Glucuronic acid | 20.90% | 21.10% | 18.00% | 18.30% | 5.00% | 4.00% | 6.00% | 14.00% |
| References | This study | [24] | [24] | [6] | [9] | |||
| First major monosaccharide | 2nd major monosaccharide | 3rd major monosaccharide |
| % Molar Ratio | Corynoplastis japonica | Neorhodella cyanea | Rhodella violacea | Rhodella maculata |
|---|---|---|---|---|
| Fucose | 0.00% | 0.00% | 0.00% | 0.00% |
| Rhamnose | 14.10% | 0.20% | 2.00% | 5.00% |
| Arabinose | 0.00% | 0.00% | 1.00% | 2.00% |
| Galactose | 9.10% | 10.60% | 52.00% | 45.00% |
| Glucose | 0.80% | 1.70% | 7.00% | 1.00% |
| Xylose | 50.10% | 62.20% | 34.00% | 42.00% |
| Galacturonic acid | 0.00% | 0.00% | 0.00% | 0.00% |
| Glucuronic acid | 25.90% | 25.40% | 3.00% | 5.00% |
| References | This study | [7] | [47] | |
| First major monosaccharide | 2nd major monosaccharide | 3rd major monosaccharide |
| % Molar Ratio | Chroodactylum ornatum | Chroothece richteriana | Bangiopsis subsimplex | Rhodaphanes brevistipitata | Rhodospora sordida |
|---|---|---|---|---|---|
| BPS | BPS | BPS | BPS | BPS | |
| Fucose | 9.90% | 0.60% | 0.20% | 0.00% | 0.60% |
| Rhamnose | 4.50% | 0.40% | 0.20% | 0.80% | 0.30% |
| Arabinose | 2.00% | 0.00% | 0.30% | 0.40% | 1.00% |
| Galactose | 19.30% | 58.40% | 78.20% | 86.80% | 31.20% |
| Glucose | 30.10% | 6.30% | 5.40% | 3.30% | 6.40% |
| Xylose | 19.80% | 27.50% | 5.60% | 6.70% | 58.70% |
| Galacturonic acid | 5.80% | 1.50% | 0.80% | 0.00% | 0.70% |
| Glucuronic acid | 6.40% | 5.50% | 9.30% | 2.00% | 1.70% |
| First major monosaccharide | 2nd major monosaccharide | 3rd major monosaccharide |
Publisher’s Note: MDPI stays neutral with regard to jurisdictional claims in published maps and institutional affiliations. |
© 2022 by the authors. Licensee MDPI, Basel, Switzerland. This article is an open access article distributed under the terms and conditions of the Creative Commons Attribution (CC BY) license (https://creativecommons.org/licenses/by/4.0/).
Share and Cite
Borjas Esqueda, A.; Gardarin, C.; Laroche, C. Exploring the Diversity of Red Microalgae for Exopolysaccharide Production. Mar. Drugs 2022, 20, 246. https://doi.org/10.3390/md20040246
Borjas Esqueda A, Gardarin C, Laroche C. Exploring the Diversity of Red Microalgae for Exopolysaccharide Production. Marine Drugs. 2022; 20(4):246. https://doi.org/10.3390/md20040246
Chicago/Turabian StyleBorjas Esqueda, Aldo, Christine Gardarin, and Céline Laroche. 2022. "Exploring the Diversity of Red Microalgae for Exopolysaccharide Production" Marine Drugs 20, no. 4: 246. https://doi.org/10.3390/md20040246
APA StyleBorjas Esqueda, A., Gardarin, C., & Laroche, C. (2022). Exploring the Diversity of Red Microalgae for Exopolysaccharide Production. Marine Drugs, 20(4), 246. https://doi.org/10.3390/md20040246