Article

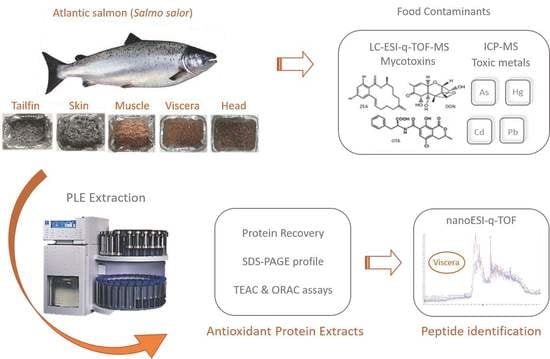
Salmon (Salmo salar) Side Streams as a Bioresource to Obtain Potential Antioxidant Peptides after Applying Pressurized Liquid Extraction (PLE)

Preventive Medicine and Public Health, Food Science, Toxicology and Forensic Medicine Department, Faculty of Pharmacy, Universitat de València, Avda. Vicent Andrés Estellés, 46100 València, Spain
*
Authors to whom correspondence should be addressed.
Mar. Drugs 2021, 19(6), 323; https://doi.org/10.3390/md19060323
Submission received: 28 April 2021 / Revised: 21 May 2021 / Accepted: 31 May 2021 / Published: 3 June 2021

Abstract

:
The pressurized liquid extraction (PLE) technique was used to obtain protein extracts with antioxidant capacity from salmon muscle remains, heads, viscera, skin, and tailfins. A protein recovery percentage ≈28% was obtained for all samples except for viscera, which was ≈92%. These values represented an increase of 1.5–4.8-fold compared to stirring extraction (control). Different SDS-PAGE profiles in control and PLE extracts revealed that extraction conditions affected the protein molecular weight distribution of the obtained extracts. Both TEAC (Trolox equivalent antioxidant capacity) and ORAC (oxygen radical antioxidant capacity) assays showed an outstanding antioxidant activity for viscera PLE extract. Through liquid chromatography coupled with electrospray ionization triple time-of-flight (nanoESI qQTOF) mass spectrometry, 137 and 67 peptides were identified in control and PLE extracts from salmon viscera, respectively None of these peptides was found among the antioxidant peptides inputted in the BIOPEP-UMP database. However, bioinformatics analysis showed several antioxidant small peptides encrypted in amino acid sequences of viscera extracts, especially GPP (glycine-proline-proline) and GAA (glycine-alanine-alanine) for PLE extracts. Further research on the relationship between antioxidant activity and specific peptides from salmon viscera PLE extracts is required. In addition, the salmon side streams studied presented non-toxic levels of As, Hg, Cd, and Pb, as well as the absence of mycotoxins or related metabolites. Overall, these results confirm the feasible use of farmed salmon processing side streams as alternative sources of protein and bioactive compounds for human consumption.

Graphical Abstract

1. Introduction

Salmon consumption has tripled since the 1980s, mainly because it is considered a healthy food due to its contents of polyunsaturated fatty acids, quality proteins, vitamins, and minerals [1,2]. The versatility of commercialized salmon products (i.e., fresh, frozen, smoked, fillet, canned, sushi, ready meals) is also related to a wide distribution, as well as an increased interest aroused by consumers and food industry [1,2]. At the same time, the salmon aquaculture sector has grown worldwide. In Europe, Atlantic salmon (Salmo salar) is currently the most important farmed species in volume and value, exceeding 1.3 million tons and 5 billion EUR in 2017 [3]. Since salmon has a great fillet yield, it is one of the most highly processed fishes [4]. As a result, 50% of complete fresh salmon has been estimated to correspond to side stream materials [5]. Therefore, a large amount of discards are available to develop high-added-value products, including those intended for human consumption. In this context, the nutritional characterization of several salmon processing side streams revealed that they are rich in protein (10–20%) and fat (20–30%) [5,6], which make them candidate substrates for protein and oil recovery. Salmon side streams also showed relevant levels of essential amino acids (21–35%) as well as oleic acid (39–42%) and omega-3 fatty acids (19–21%) [5,6]. In addition, peptides with functional and bioactive properties are also found in several marine side streams [7,8,9]. For instance, peptides from salmon trimmings and pectoral fins have exhibited antihypertensive and antioxidant activities [4,10]. Antioxidant peptides from the viscera of sardinella, black pomfret, and mackerel have also been reported [9]. Therefore, salmon side stream materials could be considered a promising source of valuable compounds from the European circular economy point of view [11].
The valorization of seafood discards has been gaining attention over the last years, as their nutritional and bioactive compounds can now be extracted more efficiently using green technologies [12,13]. Pressurized liquid extraction (PLE) is currently considered an environmentally friendly technique to recover bioactive compounds from food matrices, as water is the most preferred solvent for the extraction process [14]. PLE is based on the use of high pressure and temperature to improve the extraction performance [15,16]. The possibility of applying different extraction conditions has made PLE a useful tool to optimize the extraction of high-added-value compounds from a wide variety of matrices, including marine sources and related side streams. For instance, PLE-assisted extraction was recently used to obtain aqueous protein extracts with in vitro antioxidant capacity from several side streams of rainbow trout, sole, sea bass, and sea bream [17,18,19]. Protein extraction from macro- and micro-algae using PLE has been also investigated [20].
In addition to healthy nutritional properties, any starting material that can be used in the food industry must be free of potentially harmful substances. In this sense, farmed fishes can be exposed to mycotoxins from plant-based feed [21,22], as well as toxic metals from the aquaculture environment [23]. A wide range of ingredients is used in the formulation of Atlantic salmon feed [24]. Because an important protein fraction comes from soy, corn, canola, and pea meals, the occurrence of mycotoxins in fish tissues must be evaluated. In a similar way, heavy metals have been found in several side streams of different fish species [18,19,25]. Therefore, assessing the levels of toxic elements in all fish tissues is advisable.
The main objective of the present study was to apply, for the first time, PLE-assisted extraction as a sustainable technique to obtain antioxidant protein extracts from salmon processing side streams. Muscle remains, heads, viscera, skin, and tailfins of farmed salmon were selected in order to give added value to these underutilized raw materials. Protein recovery, SDS-PAGE profile, and antioxidant capacity were evaluated in extracts obtained from salmon discards. Peptide identification and bioinformatics analysis in terms of potential antioxidant activity were performed for salmon viscera extracts. In order to provide additional data on possible contaminants in farmed fish, the levels of As, Hg, Cd, and Pb, as well as the occurrence of mycotoxins, were also investigated. Overall, this study contributes to the current marine resources valorization approach, focusing on the possibilities of processing side streams from farmed salmon.

2. Results and Discussion

2.1. Total Antioxidant Capacity

The results of total antioxidant capacity, determined using the Trolox equivalent antioxidant capacity (TEAC) and oxygen radical antioxidant capacity (ORAC) methods in control and PLE extracts of salmon side streams, are shown in Figure 1. TEAC values in PLE extracts were 734 ± 38, 472 ± 7, 3739 ± 209, 147 ± 37, and 704 ± 42 µM Trolox Equivalents (Eq) for muscle, head, viscera, skin, and tailfins, respectively, whereas TEAC values in the corresponding control extracts were 776 ± 32, 322 ± 18, 778 ± 26, 206 ± 12, and 324 ± 22 µM Trolox Eq. Regarding the ORAC assay, the values of total antioxidant capacity were higher in PLE extracts than in control extracts for all samples. ORAC values (µM Trolox Eq) in PLE extracts were 4586 ± 241 (muscle), 3567 ± 63 (heads), 7772 ± 1174 (viscera), 1244 ± 94 (skin), and 2620 ± 78 (tailfins), whereas control ORAC values were 3005 ± 217, 797 ± 73, 2451 ± 139, 599 ± 19, and 736 ± 39, respectively. Therefore, PLE-assisted extraction improved the antioxidant capacity (ORAC) compared to conventional extraction for all salmon side streams. The increases were 1.5-, 4.5-, 3.2-, 2-, and 3.6-fold for muscle, head, viscera, skin, and tailfins, respectively. As for TEAC, the antioxidant capacity of PLE extracts also increased compared to the controls for head (1.5), viscera (4.8), and tails (2.2), whereas the muscle and skin values remained without significant changes. The highest antiradical activity was observed in PLE extracts of viscera for both antioxidant assays. These results are slightly different to those obtained for PLE extracts of sea bass and sea bream by-products, in which muscle PLE extracts showed the highest values of antioxidant capacity determined by both TEAC and ORAC methods [18,19]. The antioxidant capacity of viscera PLE extracts from sea bass and sea bream were similar to those of head PLE extracts. These differences may be due to the fact that seabass and sea bream are a more closely related species compared to salmon.
On the other hand, the different antioxidant capacity exhibited by the protein extracts obtained is probably related to both the size and the amino acid composition of the protein fragments of each salmon side stream. Several authors have suggested that hydrophobic amino acids could contribute to the total antioxidant activity of protein fragments [7,9]. In this way, glycine and glutamic acid have been reported as the most abundant polar amino acids in salmon heads, skin, and viscera [5]. Hydrophobic amino acids such as alanine, proline, leucine, and valine were also found in relevant quantities. In addition, the molecular weight of fish peptides (0.5–1.5 kDa) has been associated with antioxidant properties [7,26]. According to this, the outstanding antioxidant capacity shown by PLE viscera extracts could mean the presence of bioactive peptides with some of the aforementioned amino acids in their sequence.

2.2. Protein Recovery Percentage

The results of protein recovery in control and PLE extracts from side streams of gilthead sea bream are shown in Figure 2. The percentage of protein recovery in PLE extracts of salmon muscle, head, viscera, skin, and tailfins were 26.65 ± 1.57, 27.50 ± 3.83, 92.03 ± 4.80, 29.39 ± 0.05, and 28.29 ± 3.66, respectively, whereas those of their corresponding control extracts were 23.51 ± 0.31, 18.57 ± 1.14, 56.76 ± 1.87, 18.41 ± 0.64, and 5.82 ± 0.63. Therefore, PLE improved the protein recovery for all side streams. The improvement in protein recovery was close to 1.5-fold for heads, viscera, and skin extracts. The tailfin extracts experienced a 5-fold increase with the PLE technique, whereas salmon muscle results were similar for both conventional stirring and PLE extraction. The best protein recovery was observed in viscera, consistent with previously observed protein recoveries in extracts of sea bass and sea bream side streams after applying PLE-assisted extraction [18,19]. Few food matrices or related side streams have been used for protein extraction by means of PLE. For instance, different seaweeds, as well as seeds from red pepper, showed protein recovery percentages about 5% and 50%, respectively [20,27].

2.3. Protein Molecular Weight Distribution

The protein molecular weight distribution of salmon side stream extracts, obtained both through conventional stirring and PLE-assisted extraction, was provided by means of SDS-PAGE (Figure 3A). As can be seen in the images, the extracts presented different electrophoretic profiles. In general, these differences appeared to be related to both the type of side stream and the type of extraction process. In order to obtain the molecular weight of each band and also to group the areas of the bands by kDa ranges, the images of the gels were analyzed using ImageJ and GraphPad Prism Programs (Figure 3B). For muscle leftovers, clear bands from 9 to 108 kDa were observed in control and PLE extracts, which could be due to the fact that both extraction processes were carried out at room temperature. However, the differences in the width of the bands revealed that PLE extracts presented a greater amount of total protein fragments for all molecular weight groups. This behavior is in agreement with those previously reported for sea bass and sea bream muscle remains subjected to the same PLE and shaking extraction conditions [18,19]. Protein fragments of head control extracts showed several bands from 10 to 108 kDa, whereas the highest protein molecular weight for head PLE extracts was of 96 kDa. In addition, bands of 20–50 kDa in head control extracts were not found in head PLE extracts. In contrast, control and PLE extracts from salmon viscera exhibited the same protein molecular weight distribution (≤7–73 kDa) and few slight bands. The range of values was similar to that shown by sea bass and sea bream viscera extracts (8–61 kDa) [18,19].
Both skin and tailfin extracts presented wider molecular weight ranges (≈6–140 kDa) than muscle, heads, and viscera extracts. Furthermore, for both samples, several protein bands in control extracts did not appear in PLE extracts. According to the gel image analysis, bands in 25–50 and 75–125 kDa ranges from control skin extracts were not present in the corresponding PLE extracts. Similarly, the 10–30 kDa protein fragments in tailfin control extracts were not found in those of PLE. The protein molecular weight distribution of discards from Australian Atlantic salmon was evaluated previously [5]. The head and skin protein fragments were in the range of 25–250, whereas most of the viscera were below 10 kDa.
Based on these results, sodium dodecyl sulfate polyacrylamide gel electrophoresis (SDS-PAGE) revealed different protein profiles between the matrices studied. In addition, differences observed among control and PLE extracts for each side stream have shown that PLE-assisted extraction influenced the size of protein fragments obtained in the extracts. It should be noted that this electrophoretic technique provides additional information as to the total protein content. However, it does not allow the retention of peptides in the gel, which could be relevant to correlate the presence of peptides with the antioxidant capacity shown by the extracts.

2.4. Identification of Peptides in Viscera Extracts

As previously described, the salmon viscera extracts obtained through PLE-assisted extraction resulted the most interesting sample in terms of in vitro antioxidant capacity. Their TEAC and ORAC values not only stand out against the other salmon byproducts studied here, but also in comparison with previously investigated PLE protein extracts from sea bass and sea bream viscera. For this reason, PLE protein extracts from salmon viscera were selected for the identification of antioxidant peptides. Control viscera extracts were also screened in order to compare peptides extracted through PLE and under stirring conditions. Only peptides with a confidence percentage ≥ 90% have been reported.
A total of 137 peptides were identified in the PLE viscera extracts (Table 1). In contrast, 67 peptides were identified in the viscera control extracts (Table 2). Despite using the same viscera sample, only five peptides matched in both extracts (color marked in both tables). These data show that the extraction conditions used for PLE-assisted extraction influence the peptides obtained from salmon viscera.
A common method currently used to speculate about peptide function is through an amino acid homology alignment against a database of known functional peptide sequences. The antioxidant activity of the identified peptides was thus predicted using the BIOPEP-UWM database, which is a bioinformatics tool for searching among bioactive peptides, mainly derived from foods [28]. None of the peptides identified in salmon viscera extracts were found among the antioxidant peptides inputted in the BIOPEP-UMP database. Therefore, a new search based on the profiles of the potential biological activity of peptides was performed. BIOPEP-UWM analysis results exhibited several antioxidant small peptides encrypted in amino acid sequences of PLE (Table 3) and control (Table 4) viscera extracts, with some of them known to be derived from marine species. Throughout the entire structure of peptides, 19 different sequences of peptides with antioxidant activity were found in the PLE extract, whereas there were 12 in the control extract. Most of these potential antioxidant peptides were di- and tri-peptides. The sequence GPP was found in 15 peptides of the PLE extract, followed by GAA, which was found in five peptides. These sequences could be responsible for antioxidant activity, since antioxidant peptides from marine resources have been described to contain hydrophobic acids such as glycine (G), proline (P), and alanine (A) [8,9,29]. Furthermore, salmon antioxidant peptides from the pectoral fin (FLNEFLHV) and trimmings (GGPAGPAV, GPVA, PP, GP) have been reported [10,30]. Several antioxidant peptide sequences from the viscera of sardinella (LHT, LARL, GGE), black pomfret (AMT6GLEA), and mackerel (ACFL) have also been identified [9].
In addition to specific amino acids, peptides derived from fish sources, especially in the range of 0.5–1.5 kDa, have been assumed to be a key factor in terms of antioxidant activity [26]. The molecular weight of peptides in control viscera extracts ranged from 0.63 to 2.44 kDa (Table 4), whereas for viscera PLE extracts, the molecular weight of peptides was 0.67–2.60 kDa (Table 2). However, there was a greater amount of small peptides in the PLE extract. As can be seen in Figure 4, a higher intensity of analytes with shorter retention times was observed for the viscera PLE extract, which in the case of peptides usually corresponds to more polar and/or smaller compounds.
According to these results, both the specific amino acid sequences encrypted in the identified peptides and a molecular weight below 1.5 kDa could be related to the antioxidant capacity exhibited by the PLE extract obtained from salmon viscera.

2.5. Determination of Heavy Metals and Mycotoxins in Salmon Side Streams

The concentrations of As, Hg, Cd, and Pb in salmon muscle, heads, viscera, skin, and tailfins are shown in Table 5. Mean concentration ranges, expressed as µg/g of wet weight (ww), were 0.4186–0.6922, 0.0095–0.0408, 0.0004–0.0104, and 0.0071–0.0859 for As, Hg, Cd, and Pb, respectively. For all salmon side streams, the most abundant element was As, whereas the lowest concentration was observed for Cd. There is a lack of information in the literature on heavy metal contents in salmon discards. For instance, one study reported liver Hg accumulations in four wild species of Pacific salmon [31]. The results (0.120–0.192 µg/g, ww) were higher than those found in the present study for viscera samples, which include more organs than the liver. The contents of As, Hg, Cd, and Pb in several fish side streams of sea bass, sea bream, and meager have also been described [18,19,23,25]. The arsenic levels in the viscera (1.867–2.587 µg/g, ww) of these fish species were higher than those in the salmon viscera.
The data available on toxic elements in fish usually refer to edible muscle due to the potential health risk for consumers. In this sense, levels of Cd and Pb in 21 samples of smoked salmon from a Polish market were determined [32]. The results were on the order of 0.0040–0.0196 µg/g (ww) for Cd and 0.0109–0.1559 µg/g (ww) for Pb, both of which are considered safe for consumers. In addition, As, Hg, Cd, and Pb contents in fresh salmon muscle were evaluated [33,34]. It should be noted that the limits for heavy metals in fish side streams are not currently regulated. Therefore, the safety assessment could be based on the limit values established for edible muscles of fish (µg/g): 13.5 for As, 0.5 for Hg, 0.05 for Cd, and 0.30 for Pb [23,25,35]. According to this, the toxic elements analyzed in all salmon side streams in this study are below the limits set by authorities and could be considered safe for consumers in terms of As, Hg, Cd, and Pb content.
Nostbakken et al. [33] showed a trend towards a decrease in As and Hg content in farmed Atlantic salmon, which was related to the decline in the use of fish meal and fish oil in commercial fish feed. However, the replacement of marine ingredients by others of plant origin can lead to the presence of contaminants such as mycotoxins in both aquafeeds and fish tissues. In this way, Bernhoft et al. [36] conducted a toxicokinetic study of deoxynivalenol (DON) and ochratoxin A (OTA) mycotoxins in farmed salmon fed with contaminated feeds for 8 weeks. The authors observed an even distribution in the liver, kidney, brain, skin, and muscle for DON, as well as a distribution mainly in the liver and kidney for OTA. According to this, the possible occurrence of mycotoxins in the muscle, head, viscera, skin, and tailfin of farmed salmon was investigated in the present study. Through a simultaneous multi-mycotoxin evaluation using a non-targeted screening approach, no mycotoxins or related metabolites were identified in salmon side streams. These results are in agreement with those found by Nácher-Mestre et al. [37,38] on the carry-over of common and emerging mycotoxins from feeds to edible parts of farmed Atlantic salmon fed with high plant-based diets. In addition, there was no presence detected of several mycotoxins, such as aflatoxins, fumonisins, enniatins, or ochratoxin A, in smoked salmon and raw salmon sushi commercial products [39].

3. Materials and Methods

3.1. Reagents

AAPH (2,2′-azobis (2-amidinopropane)) (Acros Organics), sodium phosphate dibasic, sodium chloride, potassium dihydrogen phosphate, potassium sulphate, TRIS (ultrapure), glycine (proteomics grade), ortho-boric acid, and methanol (HPLC grade) were obtained from VWR International Eurolab S.L. (Barcelona, Spain). Trizma® base, ABTS (2,2′-azinobis (3-ethylbenzothiazoline 6-sulfonic acid)), DTT (DL-Dithiothreitol), Trolox® (6-hydroxy-2,5,7,8-tetramethylchroman-2-carboxylic acid), fluorescein sodium salt, formic acid (reagent grade ≥ 95%), and diatomaceous earth (Hyflo® Super Cel®) were provided by Sigma-Aldrich (Steinheim, Germany). Sodium hydroxide, glacial acetic acid, and sulfuric acid were supplied by Fisher Scientific (Madrid, Spain). SDS (sodium dodecyl sulfate) and nitric acid (65% p/p) were purchased from Panreac (Barcelona, Spain). Bromophenol blue indicator (ACS reagent), acetonitrile (HPLC grade), trifluoroacetic acid, acetone, and glycerol were provided by Merck (Darmstadt, Germany). Absolute ethanol was obtained from J.T. Baker (Deventer, The Netherlands), Octadecyl C18 sorbent was obtained from Phenomenex (Madrid, Spain), and anhydrous magnesium sulfate (99.5% min powder) was obtained from Alfa Aesar (Karlsruhe, Germany). Deionized water with a resistivity of >18 MΩ/cm was obtained through a Milli-Q SP® Reagent Water System (Millipore Corporation Bedford, MA, USA).

3.2. Raw Material and Sample Preparation

Whole salmon fish (Salmo salar) from Norwegian aquaculture were purchased in a local market in Valencia (Spain) during different weeks of June 2019. They were immediately transported to the laboratories of the University of Valencia under refrigerated conditions. Individual salmon were dissected as a simulation of fish processing for human consumption. Then, muscle leftovers, complete heads, viscera, flesh-free skin, and tailfins were placed separately inside aluminum containers and frozen at −80 °C for 48 h. Next, they were freeze-dried (LABCONCO, 2.5. FREE ZONE, USA) for 72 h, and keep in a desiccator until reaching a constant weight. Then, water content was determined gravimetrically. The moisture percentages were 67.61% ± 1.04%, 61.66% ± 2.52%, 52.31% ± 1.98%, 45.04% ± 1.60%, and 45.63% ± 0.71% for muscle remains, heads, viscera, skin, and tailfins, respectively. Similar values for salmon head, viscera, and skin were reported by Aspevik et al. [6] and He et al. [5]. Each type of sample was ground in an analytical mill (A11 basic IKA® WERKE, Staufen, Germany) and stored at −25 °C until the extraction process and the determination of possible food contaminants.

3.3. Pressurized Liquid Extraction (PLE) Process

Antioxidant protein extracts from salmon side stream materials were obtained using an accelerated solvent extractor ASE 200 Dionex (Sunnyvale, CA, USA) equipped with a solvent controller. Dried samples were mixed with diatomaceous earth before being introduced into 22-mL stainless steel cells with a glass fiber filter placed in the end part. The standard operation parameters were as follows: preheating period (1 min), heating period (5 min), and flush volume (60%), and nitrogen purge (145 psi for 1 min). The extractions were performed under a pressure of 1500 psi with distilled water as a solvent. The pH, temperature, and time conditions for PLE-assisted extraction were selected based on the optimization of the extraction conditions to obtain antioxidant protein extracts from sea bass side streams [18]: pH 7, 20 °C, 5 min for muscle; pH 4, 60 °C, 15 min for heads; pH 7, 50 °C, 15 min for viscera; pH 7, 55 °C, 5 min for skin; and pH 7, 60 °C, 15 min for tailfins. For all samples, control extracts were also carried out in parallel by stirring for 30 min with distilled water at room temperature. Both types of extractions were performed at least in duplicate. The extracts obtained were homogenized individually, divided into several replicates and stored at −25 °C for subsequent analyses. Protein recovery, protein molecular weight distribution, and total antioxidant capacity were evaluated and compared (PLE vs control extracts).

3.4. Evaluation of Total Antioxidant Capacity

3.4.1. Trolox Equivalent Antioxidant Capacity Assay (TEAC)

The TEAC assay measures the inhibition of the radical cation ABTS+ by antioxidant compounds, which is compared to the activity of a reference antioxidant standard (Trolox). The spectrophotometric method proposed by de la Fuente et al. [18] was used. ABTS reagent (7 mM) and K2S2O8 (140 mM) were mixed and maintained at room temperature in darkness for 16 h to generate the ABTS+ stock solution. Then, it was diluted in ethanol until an absorbance of 0.700 ± 0.020 at 734 nm and 30 °C to obtain the ABTS+ working solution. Proper dilution of each fish extract to achieve a percentage of absorbance inhibition of approximately 50% was required. A range of Trolox standard solutions (0–300 μM) were prepared. The absorbance of 2 mL of ABTS+ working solution was considered the initial point of reaction (A0). Then, 100 μL of diluted extracts or Trolox standards were added immediately. After 3 min of reaction, the absorbance was measured and considered the final point (Af). All measures were conducted in a thermostatized UV–vis spectrophotometer. The percentages of absorbance inhibition were calculated using the following equation: 1 − (Af/A0) × 100 and were compared to the Trolox standard curve. The results were expressed as μM Trolox Equivalents.

3.4.2. Oxygen Radical Absorbance Capacity Assay (ORAC)

The ORAC assay measures the scavenging of the peroxyl radical AAPH by antioxidant compounds. The fluorometric method described by de la Fuente et al. [18] was applied. Sodium fluorescein (0.015 mg/mL), AAPH radical solution (120 mg/mL), and Trolox standard solution (100 μM) were prepared with phosphate buffer (75 mM, pH 7). Adequate diluted extracts were required. The operating conditions for the final reaction consisted of 50 μL of diluted extract, Trolox standard or phosphate buffer (blank), 50 μL of fluorescein, and 25 μL of AAPH incubated at 37 °C in a Multilabel Plate Counter VICTOR3 1420 (PerkinElmer, Turku, Finland). Fluorescence filters for an excitation wavelength (485 nm) and an emission wavelength (535 nm) were selected. The fluorescence was recorded every 5 min over 60 min, where the fluorescence in the assay was less than 5% of the initial value. Differences of areas under the fluorescence decay curve (AUC) between the blank and the sample over time were compared and the results were expressed as μM Trolox Equivalents.

3.5. Determination of Protein Recovery

The total nitrogen content in salmon side stream materials and extracts obtained by conventional stirring and PLE-assisted extraction was determined using the Kjeldahl method [40]. The total protein content was calculated based on the total nitrogen values and the protein–nitrogen conversion factor (6.25) for fish and fish side streams. Then, the following formula was applied for protein recovery: (protein in extract/protein in side stream) × 100.

3.6. Molecular Weight Distribution of Protein Fragments

SDS-PAGE was used to investigate the protein molecular weight distribution of both control (stirring) and optimal (PLE) extracts from salmon side stream materials. Acetone was added to the extracts at a 4:1 ratio (v/v) and they were mixed by means of a vortex. For protein precipitation, the mixture was centrifuged at 11,000 rpm, 4 °C, and 10 min. The supernatant was then removed and the pellet was dissolved and distilled. Afterwards, equal volumes of SDS-PAGE sample buffer solution (62.5 mM Tris-HCl (pH 6.8), 2% SDS, 20% glycerol, 0.01% bromophenol blue, and 50 mM dithiothreitol) and protein solution were mixed and heated in a thermoblock (95 °C, 5 min). Next, 10 μL were loaded onto 8–16% Mini-PROTEAN® TGX™ Precast gels (Bio-Rad). The electrophoresis was performed using a Mini-PROTEAN® Tetra Cell (Bio-Rad) under a constant voltage of 80 V for 120 min. The running buffer consisted of Trizma® base (25 mM), glycine (192 mM), and SDS (0.1%). The gels obtained were stained in Coomassie brilliant blue R-250 (0.125%) and destained through a solution of water:methanol:acetic acid (70:20:10) until the background was as clear as possible. In order to estimate the molecular weight of protein bands obtained in the electrophoretic gels, a standard molecular weight of protein bands (5–250 kDa, Precision Plus Protein™, Bio-Rad) was used. The images of the gels were also evaluated using ImageJ® software, a public domain digital image processing program developed at the National Institutes of Health (NIH). For a better visualization of protein bands, background subtraction and 8-bit format were selected.

3.7. Identification of Peptides in Viscera Extracts

3.7.1. Sample Preparation

The salmon viscera extracts obtained through shaking and PLE were frozen and lyophilized. Freeze-dried samples (100 mg) were resuspended in MilliQ water (200 µL). Then, 200 µL of acetonitrile (ACN) were added and the mixture was kept overnight at 4 °C for protein precipitation. Next, samples were centrifuged at 5000 rpm for 5 min and the supernatants, which contained soluble peptides, were dried in a speed vacuum (Eppendorf, Hamburg, Germany). The resulting pellets were dissolved in 27 µL of aqueous solution, containing 2% ACN and 0.1% trifluoroacetic acid (TFA), and sonicated for 5 min. Afterwards, 0.5 µL of sample solution was diluted with 6 µL water with ACN (0.2%) and TFA (0.1%).

3.7.2. Mass Spectrometry Analysis

Peptides were analyzed in a nanoESI qTOF mass spectrometer (6600plus TripleTOF, ABSCIEX, Framingham, MA, USA). A total of 5 µL of sample was loaded onto a trap column (ChromXP C18, 3 μm 120 Å, 350 μm, 0.5 mm; Eksigent) and desalted with 0.1% TFA at a flow rate of 5 µL/min for 5 min. The peptides were then loaded onto an analytical column (3µ C18-CL 120, 0.075 × 150 mm; Eksigent) equilibrated in 5% ACN and 0.1% TFA. Elution was carried out with a linear gradient from 7% to 40% B in A for 45 min. (A: 0.1% formic acid (FA); B: ACN, 0.1% FA) at a flow rate of 300 nL/min.
Sample was ionized by applying 3.0 kV to the spray emitter at 175 °C. Analysis was performed in a data-dependent mode. Survey MS1 scans were acquired from 350–1400 m/z for 250 ms. The quadrupole resolution was set to ‘LOW’ for MS2 experiments, which were acquired 100–1500 m/z for 25 ms in ‘high sensitivity’ mode. The following switch criteria were used: charge: 2+ to 4+; minimum intensity; 250 counts per second (cps). Up to 100 ions were selected for fragmentation after each survey scan. Dynamic exclusion was set to 15 s. The system sensitivity was controlled by analyzing 0.5 µg of K562 trypsin digestion (Sciex). In these conditions, 2230 proteins were identified (FDR <1%) in a 45 min gradient.

3.7.3. Data Analysis

After LC-MS/MS, the identification of peptides was carried out with the software ProteinPilot v5.0 search engine (AB SCIEX). ProteinPilot default parameters were used to generate the peak list directly from 6600 plus TripleTOF wiff files. The Paragon algorithm [41] in ProteinPilot v 5.0 was used to search against the Swiss Prot (Inr 200602) and Uniprot Chordata (Inr 2007721) protein sequence databases with the following parameters: none digestion, none cys-alkylation, taxonomy non restricted, and the search effort set to thorough.
The BIOPEP-UWM database was used in the search for similar previously identified sequences showing antioxidant activity (http://www.uwm.edu.pl/biochemia/index.php/pl/biopep accessed on 28 April 2021). The search option “profiles of potential biological activity” was then employed, in which antioxidant activity was selected.

3.8. Analysis of Heavy Metals in Salmon Side Stream Materials

The presence of As, Hg, Cd, and Pb in side stream materials of farmed salmon was studied. Muscle, heads, viscera, skin, and tailfins were mineralized in a microwave oven (MARS, CEM, Vertex, Spain). Approximately 0.30 g of sample was placed in a Teflon reactor vessel. Next, 1 mL of H2O2 (30% v/v) and 4 mL of HNO3 (14M) were added and the digestion was conducted under a microwave irradiation power of 800 W at 180 °C for 15 min. The digested samples were left to cool at room temperature. After eliminating the nitrogenous vapor, they were filtered and brought up to volume with distilled water.
The identification and quantification of toxic metals was carried out using an inductively coupled plasma spectrometer mass detector (ICP-MS, Agilent model 7900). The analytical conditions were as follows: carrier gas (1.07 L/min), Ar gas flow (15.0 L/min), reaction gas (He), RF power (1550 W), nebulizer pump speed (0.10 rps), and RF matching (1.80 V). To correct matrix-induced signal fluctuations and instrumental drift, internal standard solutions of 72Ge, 103Rh, and 193Ir (ISC Science) at 20 µg/g were used. For the quantification of As, Cd, and Pb, standard calibration curves from 0 to 1000 µg/L were used. As for the quantification of Hg, a standard calibration curve from 0 to 100 µg/L was utilized. Limits of detection (LODs) were calculated according to the following equation: LOD = 3sB/a where “3sB” is 3 times the standard deviation at zero concentration and “a” is the slope of the calibration curve. LOD values obtained for As, Hg, Cd, and Pb were 0.012, 0.0015, 0.004, and 0.0015 µg/L, respectively. The concentrations of heavy metals in the digested blank (distilled water) were subtracted from the values of samples. The results were expressed as µg of element/g of side stream material in wet weight. To confirm the accuracy of the method, the fish protein powder DORM-3 was used as the Certified Reference Material for Trace Metals. It was prepared and analyzed simultaneously to the salmon samples. The recovery percentages were 98%, 86%, 76%, and 77% for As, Hg, Cd, and Pb, respectively.

3.9. Analysis of Mycotoxins in Salmon Side Stream Materials

High-performance liquid chromatography coupled with electrospray ionization-quadrupole-time of flight-mass spectrometry (LC-ESI-qTOF-MS) was employed to investigate the occurrence of mycotoxins in salmon side stream materials. An Agilent 1200-LC system (Agilent Technologies, Palo Alto, CA, USA) equipped with a Gemini® column NX-C18 (3 µM, 150 × 2 mm ID) (Phenomenex), as well as a vacuum degasser, binary pump, and autosampler, were used to achieve the chromatographic separations The mobile phases consisted of acidified (0.1% of formic acid) water (A) and acetonitrile (B). A gradient program of 50% B (0–6 min); 100% B (7–12 min); and 50% B (13–20 min) was applied. Samples (5 µL) were injected at a flow rate of 0.2 mL/min. Mass spectrometry (MS) analysis was carried out using a 6540 Agilent Ultra-High-Definition-Accurate-Mass-q-TOF-MS coupled to the HPLC, equipped with an Agilent Dual Jet Stream electrospray ionization (Dual AJS ESI) interface in positive and negative ionization modes. The operational conditions were as follows: nebulizer pressure (50 psi); capillary voltage (3500 V); fragmenter voltage (160 V); scan range (m/z 50–1500); drying gas temperature (370 °C); and nitrogen drying gas flow (12.0 L/min). Automatic MS/MS experiments were performed under the following collision energy values: m/z 100, 30 eV; m/z 500, 35 eV; m/z 1000, 40 eV; and m/z 1500, 45 eV. For data acquisition and integration, Mass Hunter Workstation software was used.
The QuEChERS procedure to extract mycotoxins from fish discards, previously reported by de la Fuente et al. [18], was applied. Approximately 3 g of salmon samples were mixed with 30 mL of acidified water (2% formic acid) in an orbital shaker (IKA KS 260) for 30 min. Then, 10 mL of acetonitrile were added and the mixture was stirring again for 30 min. Next, 8 g of MgSO4 and 2 g of NaCl were added to the mixture, vortexed for 30 s and centrifuged at 4000 rpm for 10 min. Afterward, 0.1 g of Octadecyl C18 sorbent and 0.3 g of MgSO4 were mixed with 2 mL of supernatant. Additional shaking and centrifugation under the same conditions as reported previously were performed. The supernatant was then filtered (13 mm/0.22 μm nylon filter) and 20 μL were injected into the LC-ESI-qTOF-MS system.

3.10. Statistical Analysis

Experimental data were subjected to one-way analysis of variance (ANOVA) to determine the significant differences among samples. Tukey’s honestly significant difference (HSD) multiple range test, at a significance level of p < 0.05 was applied. Statistical analyses were performed with Statgraphics Centurion XVI.I software (Statpoint Technologies, Inc., The Plains, VA, USA).

4. Conclusions

The Pressurized Liquid Extraction (PLE) technique allowed us to obtain, for the first time, protein extracts with in vitro antioxidant capacity from Atlantic salmon processing side streams. PLE-assisted extraction influenced the size of the protein fragments obtained in the extracts, since extracts from muscle leftovers, heads, viscera, skin, and tailfins showed different SDS-PAGE profiles.
Both the highest protein recovery percentage (92%) and the highest antioxidant capacity were observed in the viscera PLE extract. As 40% of the peptides identified in the PLE extract contained small peptide sequences with known antioxidant activity, salmon viscera could be considered an interesting source of antioxidant peptides. Further research on the relationship between antioxidant activity and specific peptides from salmon viscera PLE extract is required.
The levels of toxic metals (As, Hg, Cd, and Pb) and the absence of mycotoxins in salmon processing side streams contribute not only to increasing the limited data in the literature about these contaminants in farmed fish, but also provide information about their safety as candidates for use in the food industry.

Author Contributions

Conceptualization, B.d.l.F., F.J.B. and H.B.; methodology, B.d.l.F. and N.P.; formal analysis, B.d.l.F. and N.P.; software, B.d.l.F. and N.P.; investigation, B.d.l.F., F.J.B. and H.B.; resources, F.J.B. and H.B.; data curation, B.d.l.F. and N.P.; writing—original draft preparation, B.d.l.F., F.J.B. and H.B; writing—review and editing, B.d.l.F., F.J.B. and H.B.; supervision, F.J.B. and H.B.; funding acquisition, F.J.B. and H.B. All authors have read and agreed to the published version of the manuscript.

Funding

This research was funded by BBI-JU through the H2020 Project AQUABIOPRO-FIT “Aquaculture and agriculture biomass side stream proteins and bioactives for feed, fitness, and health promoting nutritional supplements” (Grant number 790956).

Institutional Review Board Statement

Not applicable.

Informed Consent Statement

Not applicable.

Data Availability Statement

Not applicable.

Acknowledgments

The authors thank the Proteomics and Atomic Spectroscopy Laboratories of Central Support Service for Experimental Research (SCSIE)—University of Valencia for technical support in peptide identification and ICP-MS analysis.

Conflicts of Interest

The authors declare no conflict of interest.

References

  1. Badiola, M.; Gartzia, I.; Basurko, O.C.; Mendiola, D. Land-based growth of Atlantic salmon (Salmo salar) and consumers’ acceptance. Aquac. Res. 2017, 48, 4666–4683. [Google Scholar] [CrossRef]
  2. Haq, M.; Ahmed, R.; Cho, Y.J.; Chun, B.S. Quality properties and bio-potentiality of edible oils from Atlantic salmon by-products extracted by supercritial carbon dioxide and conventional methods. Waste Biomass Valorization 2017, 8, 1953–1967. [Google Scholar] [CrossRef]
  3. Anonymous. The EU Fish Market 2020 Edition Is Now Online|Fisheries. Available online: https://ec.europa.eu/fisheries/press/eu-fish-market-2020-edition-now-online_en (accessed on 24 March 2021).
  4. Neves, A.C.; Harnedy, P.A.; O’Keeffe, M.B.; FitzGerald, R.J. Bioactive peptides from Atlantic salmon (Salmo salar) with angiotensin converting enzyme and dipeptidyl peptidase IV inhibitory, and antioxidant activities. Food Chem. 2017, 218, 396–405. [Google Scholar] [CrossRef]
  5. He, S.; Franco, C.; Zhang, W. Characterisation of processing wastes of Atlantic salmon (Salmo salar) and Yellowtail kingfish (Seriola lalandi) harvested in Australia. Int. J. Food Sci. Technol. 2011, 46, 1898–1904. [Google Scholar] [CrossRef]
  6. Aspevik, T.; Thoresen, L.; Steinsholm, S.; Carlehög, M.; Kousoulaki, K. Sensory and chemical properties of protein hydrolysates based on mackerel (Scomber scombrus) and salmon (Salmo salar) side stream materials. J. Aquat. Food Prod. Technol. 2021, 30, 1–12. [Google Scholar] [CrossRef]
  7. Ucak, I.; Afreen, M.; Montesano, D.; Carrillo, C.; Tomasevic, I.; Simal-Gandara, J.; Barba, F.J. Functional and bioactive properties of peptides derived from marine side streams. Mar. Drugs. 2021, 19, 71. [Google Scholar] [CrossRef]
  8. Zamora-Sillero, J.; Gharsallaoui, A.; Prentice, C. Peptides from fish by-product protein hydrolysates and its functional properties: An Overview. Mar. Biotechnol. 2018, 20, 118–130. [Google Scholar] [CrossRef]
  9. Sila, A.; Bougatef, A. Antioxidant peptides from marine by-products: Isolation, identification and application in food systems. Rev. J. Funct. Foods 2016, 21, 10–26. [Google Scholar] [CrossRef]
  10. Ahn, C.-B.; Kim, J.-G.; Je, J.-Y. Purification and antioxidant properties of octapeptide from salmon byproduct protein hydrolysate by gastrointestinal digestion. Food Chem. 2014, 147, 78–83. [Google Scholar] [CrossRef]
  11. Preventing Food Waste, Promoting Circular Economy. Available online: https://ec.europa.eu/commission/presscorner/detail/en/IP_19_2391 (accessed on 1 February 2021).
  12. Al Khawli, F.; Pateiro, M.; Domínguez, R.; Lorenzo, J.M.; Gullón, P.; Kousoulaki, K.; Ferrer, E.; Berrada, H.; Barba, F.J. Innovative green technologies of intensification for valorization of seafood and their by-products. Mar. Drugs 2019, 17, 689. [Google Scholar] [CrossRef] [Green Version]
  13. Bruno, S.F.; Ekorong, F.J.A.A.; Karkal, S.S.; Cathrine, M.S.B.; Kudre, T.G. Green and innovative techniques for recovery of valuable compounds from seafood by-products and discards: A review. Trends Food Sci. Technol. 2019, 85, 10–22. [Google Scholar] [CrossRef]
  14. Zia, S.; Khan, M.R.; Shabbir, M.A.; Aslam Maan, A.; Khan, M.K.I.; Nadeem, M.; Khalil, A.A.; Din, A.; Aadil, R.M. An inclusive overview of advanced thermal and nonthermal extraction techniques for bioactive compounds in food and food-related matrices. Food Rev. Int. 2020. [Google Scholar] [CrossRef]
  15. Alvarez-Rivera, G.; Bueno, M.; Ballesteros-Vivas, D.; Mendiola, J.A.; Ibañez, E. Pressurized liquid extraction. In Liquid-Phase Extraction; Elsevier: Amsterdam, The Netherlands, 2019; pp. 375–398. ISBN 9780128169117. [Google Scholar]
  16. Andreu, V.; Picó, Y. Pressurized liquid extraction of organic contaminants in environmental and food samples. TrAC-Trends Anal. Chem. 2019, 118, 709–721. [Google Scholar] [CrossRef]
  17. Wang, M.; Zhou, J.; Collado, M.C.; Barba, F.J. accelerated solvent extraction and pulsed electric fields for valorization of rainbow trout (Oncorhynchus mykiss) and sole (Dover sole) by-products: Protein content, molecular weight distribution and antioxidant potential of the extracts. Mar. Drugs 2021, 19, 207. [Google Scholar] [CrossRef] [PubMed]
  18. de la Fuente, B.; Pallarés, N.; Barba, F.J.; Berrada, H. An integrated approach for the valorization of sea bass (Dicentrarchus labrax) side streams: Evaluation of contaminants and development of antioxidant protein extracts by pressurized liquid extraction. Foods 2021, 10, 546. [Google Scholar] [CrossRef]
  19. de la Fuente, B.; Pallarés, N.; Berrada, H.; Barba, F.J. Development of antioxidant protein extracts from gilthead sea bream (Sparus aurata) side streams assisted by Pressurized Liquid Extraction (PLE). Mar. Drugs 2021, 19, 199. [Google Scholar] [CrossRef] [PubMed]
  20. Harrysson, H.; Hayes, M.; Eimer, F.; Carlsson, N.G.; Toth, G.B.; Undeland, I. Production of protein extracts from Swedish red, green, and brown seaweeds, Porphyra umbilicalis Kützing, Ulva lactuca Linnaeus, and Saccharina latissima (Linnaeus) J. V. Lamouroux using three different methods. J. Appl. Phycol. 2018, 30, 3565–3580. [Google Scholar] [CrossRef] [Green Version]
  21. Tolosa, J.; Barba, F.J.; Pallarés, N.; Ferrer, E. Mycotoxin identification and in silico toxicity assessment prediction in Atlantic salmon. Mar. Drugs 2020, 18, 629. [Google Scholar] [CrossRef]
  22. Gonçalves, R.A.; Schatzmayr, D.; Albalat, A.; Mackenzie, S. Mycotoxins in aquaculture: Feed and food. Rev. Aquac. 2020, 12, 145–175. [Google Scholar] [CrossRef]
  23. Kalantzi, I.; Pergantis, S.A.; Black, K.D.; Shimmield, T.M.; Papageorgiou, N.; Tsapakis, M.; Karakassis, I. Metals in tissues of seabass and seabream reared in sites with oxic and anoxic substrata and risk assessment for consumers. Food Chem. 2016, 194, 659–670. [Google Scholar] [CrossRef]
  24. Anonymous. Food and Agriculture Organization. Feed Production. Available online: http://www.fao.org/fishery/affris/species-profiles/atlantic-salmon/feed-production/en/ (accessed on 24 March 2021).
  25. Kandyliari, A.; Karavoltsos, S.; Sakellari, A.; Anastasiadis, P.; Asderis, M.; Papandroulakis, N.; Kapsofefalou, M. Trace metals in six fish by-products of two farmed fishes, the gilthead sea bream (Sparus aurata) and the meager (Argyrosomus regius): Interactions with the environment and feed. Hum. Ecol. Risk Assess. Int. J. 2020, 27, 1–21. [Google Scholar] [CrossRef]
  26. Sae-Leaw, T.; Karnjanapratum, S.; O’Callaghan, Y.C.; O’Keeffe, M.B.; FitzGerald, R.J.; O’Brien, N.M.; Benjakul, S. Purification and identification of antioxidant peptides from gelatin hydrolysate of seabass skin. J. Food Biochem. 2017, 41, e12350. [Google Scholar] [CrossRef]
  27. Firatligil-Durmus, E.; Evranuz, O. Response surface methodology for protein extraction optimization of red pepper seed (Capsicum frutescens). LWT-Food Sci. Technol. 2010, 43, 226–231. [Google Scholar] [CrossRef]
  28. Minkiewicz, P.; Iwaniak, A.; Darewicz, M. BIOPEP-UWM database of bioactive peptides: Current opportunities. Int. J. Mol. Sci. 2019, 20, 5978. [Google Scholar] [CrossRef] [Green Version]
  29. Cheung, R.C.F.; Ng, T.B.; Wong, J.H. Marine peptides: Bioactivities and applications. Mar. Drugs 2015, 13, 4006–4043. [Google Scholar] [CrossRef]
  30. Neves, A.C.; Harnedy, P.A.; O’Keeffe, M.B.; Alashi, M.A.; Aluko, R.E.; FitzGerald, R.J. Peptide identification in a salmon gelatin hydrolysate with antihypertensive, dipeptidyl peptidase IV inhibitory and antioxidant activities. Food Res. Int. 2017, 100, 112–120. [Google Scholar] [CrossRef]
  31. Khristoforova, N.K.; Tsygankov, V.Y.; Lukyanova, O.N.; Boyarova, M.D. High mercury bioaccumulation in Pacific salmons from the Sea of Okhotsk and the Bering Sea. Environ. Chem. Lett. 2018, 16, 575–579. [Google Scholar] [CrossRef]
  32. Winiarska-Mieczan, A.; Florek, M.; Kwiecień, M.; Kwiatkowska, K.; Krusiński, R. Cadmium and lead content in chosen commercial fishery products consumed in Poland and risk estimations on fish consumption. Biol. Trace Elem. Res. 2018, 182, 373–380. [Google Scholar] [CrossRef] [PubMed]
  33. Nøstbakken, O.J.; Hove, H.T.; Duinker, A.; Lundebye, A.K.; Berntssen, M.H.G.; Hannisdal, R.; Lunestad, B.T.; Maage, A.; Madsen, L.; Torstensen, B.E.; et al. Contaminant levels in Norwegian farmed Atlantic salmon (Salmo salar) in the 13-year period from 1999 to 2011. Environ. Int. 2015, 74, 274–280. [Google Scholar] [CrossRef] [PubMed] [Green Version]
  34. Olmedo, P.; Pla, A.; Hernández, A.F.; Barbier, F.; Ayouni, L.; Gil, F. Determination of toxic elements (mercury, cadmium, lead, tin and arsenic) in fish and shellfish samples. Risk assessment for the consumers. Environ. Int. 2013, 59, 63–72. [Google Scholar] [CrossRef] [PubMed]
  35. Anonymous. Setting Maximum Levels for Certain Contaminants in Food Stuffs (Text with EEA Relevance). 2006. Available online: https://eur-lex.europa.eu/legal-content/EN/ALL/?uri=celex%3A32006R1881 (accessed on 24 March 2021).
  36. Bernhoft, A.; Høgåsen, H.R.; Rosenlund, G.; Ivanova, L.; Berntssen, M.H.G.; Alexander, J.; Eriksen, G.S.; Fæste, C.K. Tissue distribution and elimination of deoxynivalenol and ochratoxin A in dietary-exposed Atlantic salmon (Salmo salar). Food Addit. Contam. Part A 2017, 34, 1211–1224. [Google Scholar] [CrossRef] [PubMed]
  37. Nácher-Mestre, J.; Ballester-Lozano, G.F.; Garlito, B.; Portolés, T.; Calduch-Giner, J.; Serrano, R.; Hernández, F.; Berntssen, M.H.G.; Pérez-Sánchez, J. Comprehensive overview of feed-to-fillet transfer of new and traditional contaminants in Atlantic salmon and gilthead sea bream fed plant-based diets. Aquac. Nutr. 2018, 24, 1782–1795. [Google Scholar] [CrossRef]
  38. Nácher-Mestre, J.; Serrano, R.; Beltrán, E.; Pérez-Sánchez, J.; Silva, J.; Karalazos, V.; Hernández, F.; Berntssen, M.H.G. Occurrence and potential transfer of mycotoxins in gilthead sea bream and Atlantic salmon by use of novel alternative feed ingredients. Chemosphere 2015, 128, 314–320. [Google Scholar] [CrossRef] [PubMed] [Green Version]
  39. Tolosa, J.; Barba, F.J.; Font, G.; Ferrer, E. Mycotoxin incidence in some fish products: QuEChERS methodology and liquid chromatography linear ion trap tandem mass spectrometry approach. Molecules 2019, 24, 527. [Google Scholar] [CrossRef] [PubMed] [Green Version]
  40. Horwitz, W. Official Methods of Analysis, 17th ed.; AOAC International: Gaithersburg, MD, USA, 2000. [Google Scholar]
  41. Shilov, I.V.; Seymourt, S.L.; Patel, A.A.; Loboda, A.; Tang, W.H.; Keating, S.P.; Hunter, C.L.; Nuwaysir, L.M.; Schaeffer, D.A. The paragon algorithm, a next generation search engine that uses sequence temperature values sequence temperature values and feature probabilities to identify peptides from tandem mass spectra. Mol. Cell. Proteomics 2007, 6, 1638–1655. [Google Scholar] [CrossRef] [Green Version]
Figure 1. Total antioxidant capacity determined by TEAC and ORAC in control and PLE extracts from salmon muscle, head, viscera, skin, and tailfin. TEAC: trolox equivalent antioxidant capacity. ORAC: oxygen radical absorbance capacity. PLE: pressurized liquid extraction. µM Trolox Eq (micromolar trolox equivalent). Results of TEAC (n = 3) and ORAC (n =6) are expressed as mean ± standard deviation. Different lowercase letters in the bars indicate statistically significant differences (p < 0.05) among samples.
Marinedrugs 19 00323 g001
Figure 2. Percentage of protein recovery in control and PLE extracts from salmon muscle, heads, viscera, skin, and tailfin. PLE: pressurized liquid extraction. Results are expressed as mean ± standard deviation (n = 2). Different lowercase letters in bars indicate statistically significant differences (p < 0.05) among samples.
Marinedrugs 19 00323 g002
Figure 3. Protein molecular weight distribution of control and PLE extracts from salmon side streams. SDS-PAGE protein profiles (A) and molecular weight ranges for band areas (B). MW: molecular weight standard. C: control extract. PLE: extract obtained by means of pressurized liquid extraction.
Marinedrugs 19 00323 g003
Figure 4. Chromatogram of total ion counts of salmon viscera protein extracts, obtained through conventional stirring and pressurized liquid extraction (PLE).
Marinedrugs 19 00323 g004
Table 1. Peptides identified in salmon viscera extract obtained through pressurized liquid extraction.
Protein of Origin of the Identified PeptideSequenceObs MWObs m/zTheor z
Collagen alpha-2(I) chainGESGPTGNGGPVGA1155.52578.772
Collagen alpha-2(I) chainGPAGPHGPPG842.4422.212
Collagen alpha-2(I) chainSGETGSAGITGPAGPR1413.68707.852
Uncharacterized PE-PGRS family proteinGGNGGAGGAGGNGGAGGLGG1370.62686.322
Collagen alpha-3(V) chainGIPGPLGPL819.45410.732
Collagen alpha-3(V) chainGIPGPLGPLGP973.52487.772
Collagen alpha-3(V) chainGPAGHPGPPG842.4422.212
Collagen alpha-1(I) chainGETGPAGPAG812.4407.212
Collagen alpha-1(I) chainGLPGSPGPAGEAGK1193.6597.812
Glycine-rich protein DOT1GGGGGHGGGAGGGGGGGPGG1292.58647.32
Collagen alpha-4(IV) chainGPIGPLGPLGP973.52487.772
Probable heat shock protein ssa1PGGAPGGMPGGAP1021.47511.742
WAG22 antigenPAGTAAGGAGGAGGAPGL1308.6655.312
Collagen alpha-1(I) chainGETGPAGPAG812.4407.212
Histone H2AAQGGVLPNIQ995.54498.782
60 kDa heat shock protein, mitochondrialVGGTSDVEVNEK1232.58617.32
Collagen alpha-1(XXII) chainGYAKDGLPGIPGPQGET1655.76828.892
Filamin-AVITPEEIVDPNVDEH1704.81569.283
Glycine-rich cell wall structural proteinGGGEGYGGGGANGGGY1285.6643.812
FumarylacetoacetaseIGVAIGDQILDLSVIK1652.97827.492
Pulmonary surfactant-associated protein AGPLGPPGGMPGH1072.53537.272
Collagen alpha-1(I) chainGETGPAGPAG812.4407.212
Collagen alpha-4(IV) chainGPPGLPGPPGPPGHKGF1607.77804.892
WAS/WASL-interacting protein family memberGGGGGGGGGGGGSGGNFGGGGPP1586.64794.332
Adenylate cyclase type 10GRVNIQDLQKNKFLMRANT2245.16749.43
Forkhead box protein K1QPPPGPPPPPP1076.55539.282
Exocyst complex component SEC5ALMILIVVHSECFR1629.91815.962
tRNA dimethylallyltransferaseEAARDGWPAL1084.53543.272
Orotidine 5’-phosphate decarboxylaseRPAGAEAGDQK1098.54550.282
Homogentisate 1,2-dioxygenaseGPIGSNGLANPR1152.52577.272
WolframinNTAPLGPSCPQPPPAP1508.68755.352
Keratin, type II cytoskeletal ITALGGAAGGMGGGGGMGGGM1538.63770.322
Integrin-linked-kinase-associated- serine/
threonine phosphatase 2CGLPPAGSGNSGSLATSGS1515.64758.832
Collagen alpha-4(IV) chainACAGMIGPPGPQGFP1399.63467.552
Collagen alpha-3(V) chainGIPGPLGPLGP973.52487.772
Fatty acid-binding protein, liverAIGLPDDLIQK1181.67591.842
Actin-related protein 3VIDSGDGVTH998.47500.242
Collagen alpha-1(I) chainGAPGPVGPAGKGETGPAGPAGPAG1925.86963.942
Chaperone protein DnaKQAGEGGAGAGAGAAG1100.52551.272
Collagen alpha-2(V) chainGNPGPLGPIGP974.52488.272
Collagen alpha-1(XVIII) chainLPGPPGPPGPPGPRGYPG1665.79833.92
POTE ankyrin domain family member EVMDSGDGVTH1016.43509.222
Uncharacterized protein SE_1560GPLVLVDTDDL1155.61578.812
Serum albumin 1AIQPDTEFTPPELDASS1816.84909.432
Phosphoenolpyruvate guanylyltransferaseSLAMLNDVLVAL1257.73629.872
Collagen alpha-1(I) chainAGPPGADGQPGAK1164.55583.282
DNA (cytosine-5)-methyltransferase 3ADPASPNVATTP1068.5535.262
Protein Shroom4SQAPESHESRTGL1397.61699.812
Ataxin-2 homologPAGGGPQPAFTPP1192.56597.292
Magnesium-chelatase 38 kDa subunitQSGENVVERDGL1301.6651.812
Uroporphyrinogen decarboxylaseDVAVQGNLDPL1139.61570.812
Collagen alpha-1(I) chainAGAQGAPGPAGPA1021.47511.742
Collagen alpha-3(V) chainGIPGPLGPLGP973.53487.772
Actin-related protein 3DSGDGVTH786.32394.172
tRNA-N6-adenosine-threonylcarbamoy
ltransferaseLSLVVSGGHTELVL1422.69712.352
Calpain-12AGTGAGGPQ714.2358.112
Collagen alpha-1(XVII) chainQNLVGPPGPPGPPGVSGD1623.77812.892
FumarylacetoacetaseIGVAIGDQILDLSVIK1652.975523
Probable aquaporin PIP2-6DINAGGGACASVGLL1316.67659.342
60 kDa chaperoninAAVEEGIVAGGGTAF1347.58674.82
Arginine kinaseKGDRFLEAAGVNKLWPE1928.92965.472
Collagen alpha-2(I) chainGETGSAGITGPAGPR1326.65664.332
Cytoplasmic dynein 1 light intermediate chain 1TGSPGGPGVSGGSPAGGAG1425.64713.832
Collagen alpha-2(I) chainRGDGGPPGVTGFPGAA1411.63706.822
Collagen alpha-1(I) chainAKGDTGAPGAPGSQGAP1437.68719.852
Zinc finger protein 831ESEGEGGPGPGPGVAGAEP1649.78550.933
Collagen alpha-2(IV) chainPGEKGDAGLPGLSGK1363.64682.832
Collagen alpha-2(I) chainGPTGNGGPVGA882.42442.222
Translation initiation factor IF-2GGGGGAPGRPGGGGGGGGAP1405.65703.832
Collagen alpha-2(I) chainGPAGPHGPP785.38393.72
Serine/threonine-protein kinase ATG1ESNMFVSEYL1217.56609.792
ATP-dependent RNA helicase DBP7REGKWDIHATT1312.67657.342
Nucleoside diphosphate kinase BETNPADSKPGSI1214.58608.32
Glucosyl-3-phosphoglycerate synthaseVAGDLAGGRAPGALP1320.64661.332
Collagen alpha-6(IV) chainVGPLGPSG682.33342.172
Collagen alpha-3(V) chainGIPGPLGPLGP973.53487.772
5’-3’ exoribonuclease 2NNGGGGGGYGGQP1090.51546.262
PE-PGRS family protein PE_PGRS30NGGAAGLIGNGGAGGAGGAGGAG1639.72820.872
Protein FAM81BDTNVNKSASPTATAEEQPVEP2184.091093.052
E3 ubiquitin-protein ligase TOPORSDQGLFMGPSTSGAAANR1679.7560.913
(R)-2-hydroxyglutaryl-CoA-dehydratase
activating ATPaseGIADKQMSELSCHA1488.7745.362
Uncharacterized TPR repeat-containing
protein At1g05150DALGLELNADE1158.57580.292
Collagen alpha-1(I) chainDGNPGLPGPPGPPGPPG1492.69747.352
Golgin subfamily A member 6AGNHEGHG706.28354.152
Collagen alpha-2(IV) chainEVLGAQPGTRGDAGLPGQPG1875.93626.323
MTOR-associated protein MEAK7DVDGLFDTLSGSSSSAAAKNGK2126.051064.032
Transforming protein MafGSAAAVVSAVIAAA1156.53579.272
Glycine dehydrogenase (decarboxylating)PGAMGADIAIG971.4486.712
L-lactate dehydrogenase A-like 6BSVADLTESILK1174.65392.563
CTP synthasePDGKLVEICEVTGHPF1739.83870.922
Collagen alpha-3(V) chainGIPGPLGPL819.45410.732
T-related proteinVSGGGGGGGAGGGAGSGSPQ1429.68715.852
Glyceraldehyde-3-phosphate dehydrogenase 1TVDGPSGK759.37380.692
UDP-3-O-acylglucosamine N-acyltransferaseADGFGFAPDFGPQGGEW1753.78877.92
Protein prickleGGGAGGSSGGPGGADAAAAPAAGQ1767.76884.892
Histone H2AAQGGVLPNIQ995.54498.782
Putative cuticle collagen 155GPSGPNGNPGAPGAPGQ1430.71716.362
BTB/POZ domain and ankyrin repeat-
containing protein NH5.1GGAGGGGGAP656.34329.182
PE-PGRS family protein PE_PGRS5GAGGKGGNGGTGGAGGPGG1341.64671.832
Collagen alpha-5(IV) chainPGIPGIGLPGPPGPKGFPGIP1947974.512
Glutamate dehydrogenase 1, mitochondrialIGPGIDVPAPDMSTGE1554.73778.372
Collagen alpha-2(IV) chainSGPSGIPGLPGPKGEPGY1665.76833.892
Collagen alpha-1(I) chainGLPGSPGPAGEAGK1193.6597.812
TRPM8 channel-associated factor homologSEAVQTNLVPFFEAWGWPI2190.11096.062
Collagen alpha-4(IV) chainGPPGIPGPNGEDGLPGLP1639.76820.892
ElastinVPGAVPGGVP848.44425.232
Multidrug resistance protein PE_PGR46IMVVVQPFVLVAI1426.82714.422
Uncharacterized PE-PGRS family protein PE_PGRS46GDGAPGGDGGAGPLLIGNG1550.68776.352
POTE ankyrin domain family member ESGDGVTH671.29336.652
Actin-related protein 3SEVVDEVIQN1130.54566.282
Actin-related protein 3SGDGVTH671.29336.652
Protein WizGPERLPGPAPRENIEGGAE1944.94973.482
DNA-directed RNA polymerase subunit betaGKPIPESGLPE1122.53562.272
Histone H2AAQGGVLPNIQ995.54498.782
Ribulose bisphosphate carboxylase/oxygenase activase 2, chloroplasticTLMNIADNPTNVQLP1639.72820.872
FT-interacting protein 1PEVFVKAQVGNQILK1668.86835.432
Collagen alpha-2(I) chainGAVGPVGPVG808.44405.232
Collagen alpha-2(I) chainGPIGPPGNPGA932.47467.242
Polyribonucleotide nucleotidyltransferaseTEAVVAEGLEAAKP1383.75692.882
Putative cuticle collagen 145EGPAGPAGPAGPDGQPGA1501.64751.832
Contactin-3VSGGGGSRSELVITWDPVP1911.97956.992
Collagen alpha-1(III) chainEPGQAGPAGPPGPPG1285.61286.611
Collagen alpha-2(I) chainSIGEPGPIGIAG1066.51534.262
Collagen alpha-2(I) chain isoform X3GDPGPGGPQGEPGAVGPAGITGDKGPSGES2601.2868.083
Uncharacterized proteinDIKPVTEIQQNGNDFVITSK2245.16749.43
CalmodulinIDQLTEEQIAEF1434.65718.332
Mitochondrial fission regulatorHLSLPRFFPSRTGE1643.18548.733
Collagen, type V, alpha 3aLIDVLRVLELSEDMEGVSV2114.921058.472
Si:dkey-237h12.3ELDASNMGGWSLDK1521.81761.912
Uncharacterized protein Salmo trutaAGAEGFDDIK1021.47511.742
Fatty acid-binding protein, liverAIGLPDDLIQK1181.67591.842
Uncharacterized protein Sinocyclocheilus
anshuiensisDVFRDGFTMDT1302.61652.312
Collagen alpha-4(IV) chainGSSPIGPPGSPGSPGASGQ1592.74797.382
Mucin-5AC-likeGGPTSGSEGGDNESIK1490.65746.332
D-dopachrome decarboxylaseMIVVVKPGLPMLM1426.82714.422
Uncharacterized protein OS = Echeneis naucratesPKPLPFFGTMLSYR1653827.512
FumarylacetoacetaseIGVAIGDQILDLSVIK1652.97827.492
Table 2. Peptides identified in salmon viscera extract obtained by conventional stirring.
Protein of Origin of the Identified PeptideSequenceObs MWObs m/zTheor z
Adenosylhomocysteinase GVSEETTTGVH1115.51558.762
Hemoglobin subunit alphaAIHFPADFTPEVH1479.71494.243
Forkhead box protein K1 PQPPPGPPPPP1076.57539.292
40S ribosomal protein ADGYEPPIQET1218.54610.282
WW domain-binding protein 11 PGPPPGPPPP908.48455.242
Filamin-A VITPEEIVDPNVDEH1704.81569.283
Collagen alpha-1(X) chain ISVPGKPGPQ978.47490.242
Fatty acid-binding protein 10-A, liver basicAQENYEEFLR1297.59649.82
Methionine import ATP-binding protein MetNIDEIGGQHVGSLVLGVP1688.81845.412
Probable tRNA pseudouridine synthaseENNVDFVNRKIKEGEAMVSGPI2445.24816.093
Mediator of RNA polymerase II transcription subunit 30LAASGMAPGPFAGPQ1370.71686.362
1-(5-phosphoribosyl)-5-[(5-phosphoribosylamino)- methylideneamino] imidazole-4-
carboxamide isomeraseHWVDQGGKRLHL1444.89723.452
Quinolinate synthase AEGADEVHVDPGI1236.58619.292
40S ribosomal protein S17DQEIIEVDPDT1272.58637.32
Uncharacterized PE-PGRS family protein NGGNGGDGGNGGDGGNGAP1627.66814.842
PE_PGRS54GPPPPGPPPEVVI1251.65626.832
Prostaglandin reductase 1LVGAGNNGGDALLAAAELAR1851.87926.942
NAD(P)H-hydrate epimeraseVLRFFMATTQYR1531.9766.962
Cysteine--tRNA ligaseDSGDGVTH786.32787.331
Actin, cytoplasmic 1LDRMKNSCIVCNIGH1701.92851.972
Putative adenosylhomocysteinase 3SSSSILVVIATL1188.79595.42
Spore membrane assembly protein 2IPAINVNDSVT1141.6571.812
AdenosylhomocysteinaseIHFPADFTPEVH1408.68470.573
Hemoglobin subunit alphaVFASYPQPLG1077.53539.772
Uncharacterized protein y4iR
2-C-methyl-D-erythritol 4-phosphate-
cytidylyltransferaseLQSVIAVVPAAGV1222.84612.432
Zinc finger C2HC domain-containing
protein 1ANQVIKDGGPLPPPPPP1621.8811.912
Trichodiene synthaseVSEGITLNQALE1272.58637.32
60 kDa heat shock protein, mitochondrialGTSDVEVNEK1076.5539.252
pH-response regulator protein palF/RIM8PIRITHLTVAL1232.8617.412
Leucine-rich repeat-containing protein 56LEQLEVLDLEGNS1457.65729.832
Tungsten-containing formylmethanofuran-
dehydrogenase 2 subunit CDVDVRVGGEMKAG1331.66666.842
Cyclic pyranopterin monophosphate synthaseNTNGEANMVDVSMKQ1636.8819.412
AcetylcholinesteraseFRHPRPAEKWTGV1579.88790.952
Uncharacterized PE-PGRS family protein PENGGNGGIGGP798.43400.222
SulfocyaninSPSASSSTGTSTGP1222.59612.32
Actin, cytoplasmicVMDSGDGVTH1016.42509.222
40S ribosomal protein S3aGEGGGSSAAKPSG1060.47531.242
DNA repair protein crb2DSLYDRLLARKGPLFGK1948.23975.122
Argininosuccinate synthaseIEGGRLEDPSFVPP1511.82756.922
Collagen alpha-2(I) chainGAVGPVGPVG808.44405.232
Thiazole synthaseGVLLNTAVSGAKDP1340.73671.372
Histone-lysine N-methyltransferase 2DPLSPPPEDSPLSPPP1525.79509.613
Probable transcriptional regulatory
protein Ecaj_0351NFDSLFNIAI1152.59577.32
50S ribosomal protein L29HAKKAELFELRVK1567.85784.932
Forkhead box protein K1QPPPGPPPPPP1076.57539.292
Probable GPI-anchored adhesin-like
protein PGA32ATAAGTEVQGFTPI1361.6681.812
Replicase polyprotein 1abMAKMGKYGLGFK1329.9665.962
Stonin-2VVDGGSQDHS999.35500.682
SLAIN motif-containing proteinAGGGGPEPGGAGTPPGAAAAP1615.84808.932
Structural maintenance of chromosomes
protein 4EIQNSILNVGGPQ1367.67684.842
Golgin-84TPEIH595.3298.662
Keratin, type II cytoskeletal 5LGGGAGFGGGYGGP1122.54562.282
Translation initiation factor IF-2VEEGLTSDEPDLE1431.6716.812
Genome polyproteinIDLSANAAGSDPP1226.61614.312
Collagen alpha-1(X) chainISVPGKPGPQ978.47490.242
Transcription-associated protein 1VASVQPYAMPP1158.53580.272
MAM and LDL-receptor class A domain-
containing- protein 2LDDSPCPPE971.37972.381
Coiled-coil domain-containing protein CG32809SSSKKKRKGRE1289.85645.932
Large tegument protein deneddylaseSVPAPPTLPP974.52488.272
Adenylyl cyclase-associated proteinGPPPPGPPPPP1004.53503.272
Neuroblast differentiation-associated protein AHNAKVDIEGPDVDIEGSGG1457.65729.832
Mediator of RNA polymerase II transcription subunit 28QPPGPPPPPPP1076.56539.292
Protein S100DLDANSDGSVDFQ1381.56691.792
LisH domain-containing proteinVISYALDLIEVKHDSARVH2164.321083.162
Adenylyl cyclase-associated proteinDGDYTEIPVPEQ1361.59681.82
Guanylate cyclase domain-containing proteinLISPGDAL784.35393.182
Insulin receptor substrate 2VCGGSGPG632.26317.142
Table 3. Comparison of peptides identified in salmon viscera extracts obtained through pressurized liquid extraction with potential antioxidant sequences contained in the BIOPEP-UWM database.
Sequence_ModificationSequence in
BIOPEP-UWM Database
Identity of Sequences with
Antioxidant Potential
GPAGPHGPPGPHGID 8026 synthetic peptide
GPPID 8987
GPAGHPGPPGGPPID 8987
GYAKDGLPGIPGPQGETKDID 8134 peptide from dried bonito
GGGEGYGGGGANGGGYGGEID 8114 peptide from sardinella byproducts
GPLGPPGGMPGHGPPID 8987
GPPGLPGPPGPPGHKGF_ Carbamyl(K)@15GPPID 8987
GGGGGGGGGGGGSGGNFGGGGPPGPPID 8987
QPPPGPPPPPPGPPID 8987
TALGGAAGGMGGGGGMGGGM_ Oxidation(M)@20GAAID 8983
ACAGMIGPPGPQGFP_ Deamidated(Q)@12GPPID 8987
ACAID 10038
QAGEGGAGAGAGAAGGAAID 8983
LPGPPGPPGPPGPRGYPGGPPID 8987
AIQPDTEFTPPELDASSELID 7888
PELID 8139 synthetic peptide
GPPID 8987
LSLVVSGGHTELVLEL ID 7888
QNLVGPPGPPGPPGVSGD_ Gln->pyro-Glu@N-termGPPID 8987
DINAGGGACASVGLLACAID 10038
KGDRFLEAAGVNKLWPELWID 8462 peptide from marine bivalve
RGDGGPPGVTGFPGAAGAAID 8983
GPPID 8987
GPAGPHGPPPHGID 8026
GPPID 8987
ETNPADSKPGSIKPID 8218
NGGAAGLIGNGGAGGAGGAGGAGGAAID 8983
DQGLFMGPSTSGAAANR_ Deamidated(N)@16GAAID 8983
GIADKQMSELSCHAELID 7888
DALGLELNADEELID 7888
DGNPGLPGPPGPPGPPG_ Pro->pyro-Glu(P)@16GPPID 8987
SVADLTESILKLKID 8217
ADGFGFAPDFGPQGGEWGGEID 8114 peptide from sardinella by-products
ADGFID 9328
PGIPGIGLPGPPGPKGFPGIP_ Delta:H(2)C(2)(K)@15GPPID 8987
SEAVQTNLVPFFEAWGWPIWGID 9082
EAVQID 9881
GPPGIPGPNGEDGLPGLPGPPID 8987
GKPIPESGLPEKPID 8218
PEVFVKAQVGNQILKLKID 8217
GPIGPPGNPGAGPPID 8987
TEAVVAEGLEAAKPKPID 8218
VSGGGGSRSELVITWDPVPELID 7888
TWID 8459 peptide from marine bivalve
EPGQAGPAGPPGPPG_ Deamidated(Q)@4GPPID 8987
DIKPVTEIQQNGNDFVITSKKPID 8218
HLSLPRFFPSRTGEHLID 3317
LIDVLRVLELSEDMEGVSVELID 7888
ELDASNMGGWSLDKELID 7888
GGPTSGSEGGDNESIKGPPID 8987
MIVVVKPGLPMLMKPID 8218
VKPID 8434 peptide from jellyfish
PKPLPFFGTMLSYRLPMID 9360
IGVAIGDQILDLSVIKKPID 8218
Table 4. Comparison of peptides identified in salmon viscera extract obtained through conventional stirring with potential antioxidant sequences contained in the BIOPEP-UWM database.
Sequence_ModificationSequence in
BIOPEP-UWM Database
Identity of Sequences with
Antioxidant Potential
AIHFPADFTPEVHADFID 7868 peptide from Okara protein
PQPPPGPPPPPGPPID 8987
PGPPPGPPPPGPPID 8987
ISVPGKPGPQKPID 8218
HWVDQGGKRLHLLHID 3305
HLID 3317
LHLID 7995 synthetic peptide
GPPPPGPPPEVVIGPPID 8987
LVGAGNNGGDALLAAAELARELID 7888
IHFPADFTPEVHADFID 7868 peptide from Okara protein
NQVIKDGGPLPPPPPPKDID 8134 peptide from dried bonito
PIRITHLTVALHLID 3317
IRID 8215
DVDVRVGGEMKAGGGEID 8114 peptide from sardinella by-products
GEGGGSSAAKPSGKPID 8217
GVLLNTAVSGAKDPKDID 8134 peptide from dried bonito
HAKKAELFELRVKELID 7888
QPPPGPPPPPPGPPID 8987
AGGGGPEPGGAGTPPGAAAAPGAAID 8983
Table 5. Concentration of heavy metals in salmon side streams.
Salmon
Side Streams
Heavy Metals (µg/g of Wet Weight)
AsHgCdPb
Muscle0.5413 ± 0.00680.0238 ± 0.00050.0004 ± 0.00010.0269 ± 0.0002
Head0.6922 ± 0.00720.0157 ± 0.00050.0011 ± 0.00010.0190 ± 0.0001
Viscera0.4617 ± 0.00550.0095 ± 0.00020.0044 ± 0.00020.0071 ± 0.0001
Skin0.4504 ± 0.00320.0077 ± 0.00030.0019 ± 0.00010.0247 ± 0.0001
Tailfin0.4186 ± 0.00540.0408 ± 0.00150.0104 ± 0.00030.0859 ± 0.0016
(Legislation *)<13.5<0.50<0.05<0.30
* values refer to fish muscle tissue [23,25,35].
Publisher’s Note: MDPI stays neutral with regard to jurisdictional claims in published maps and institutional affiliations.

