
The Kinetics of Chitosan Degradation in Organic Acid Solutions


Abstract
1. Introduction
2. Results
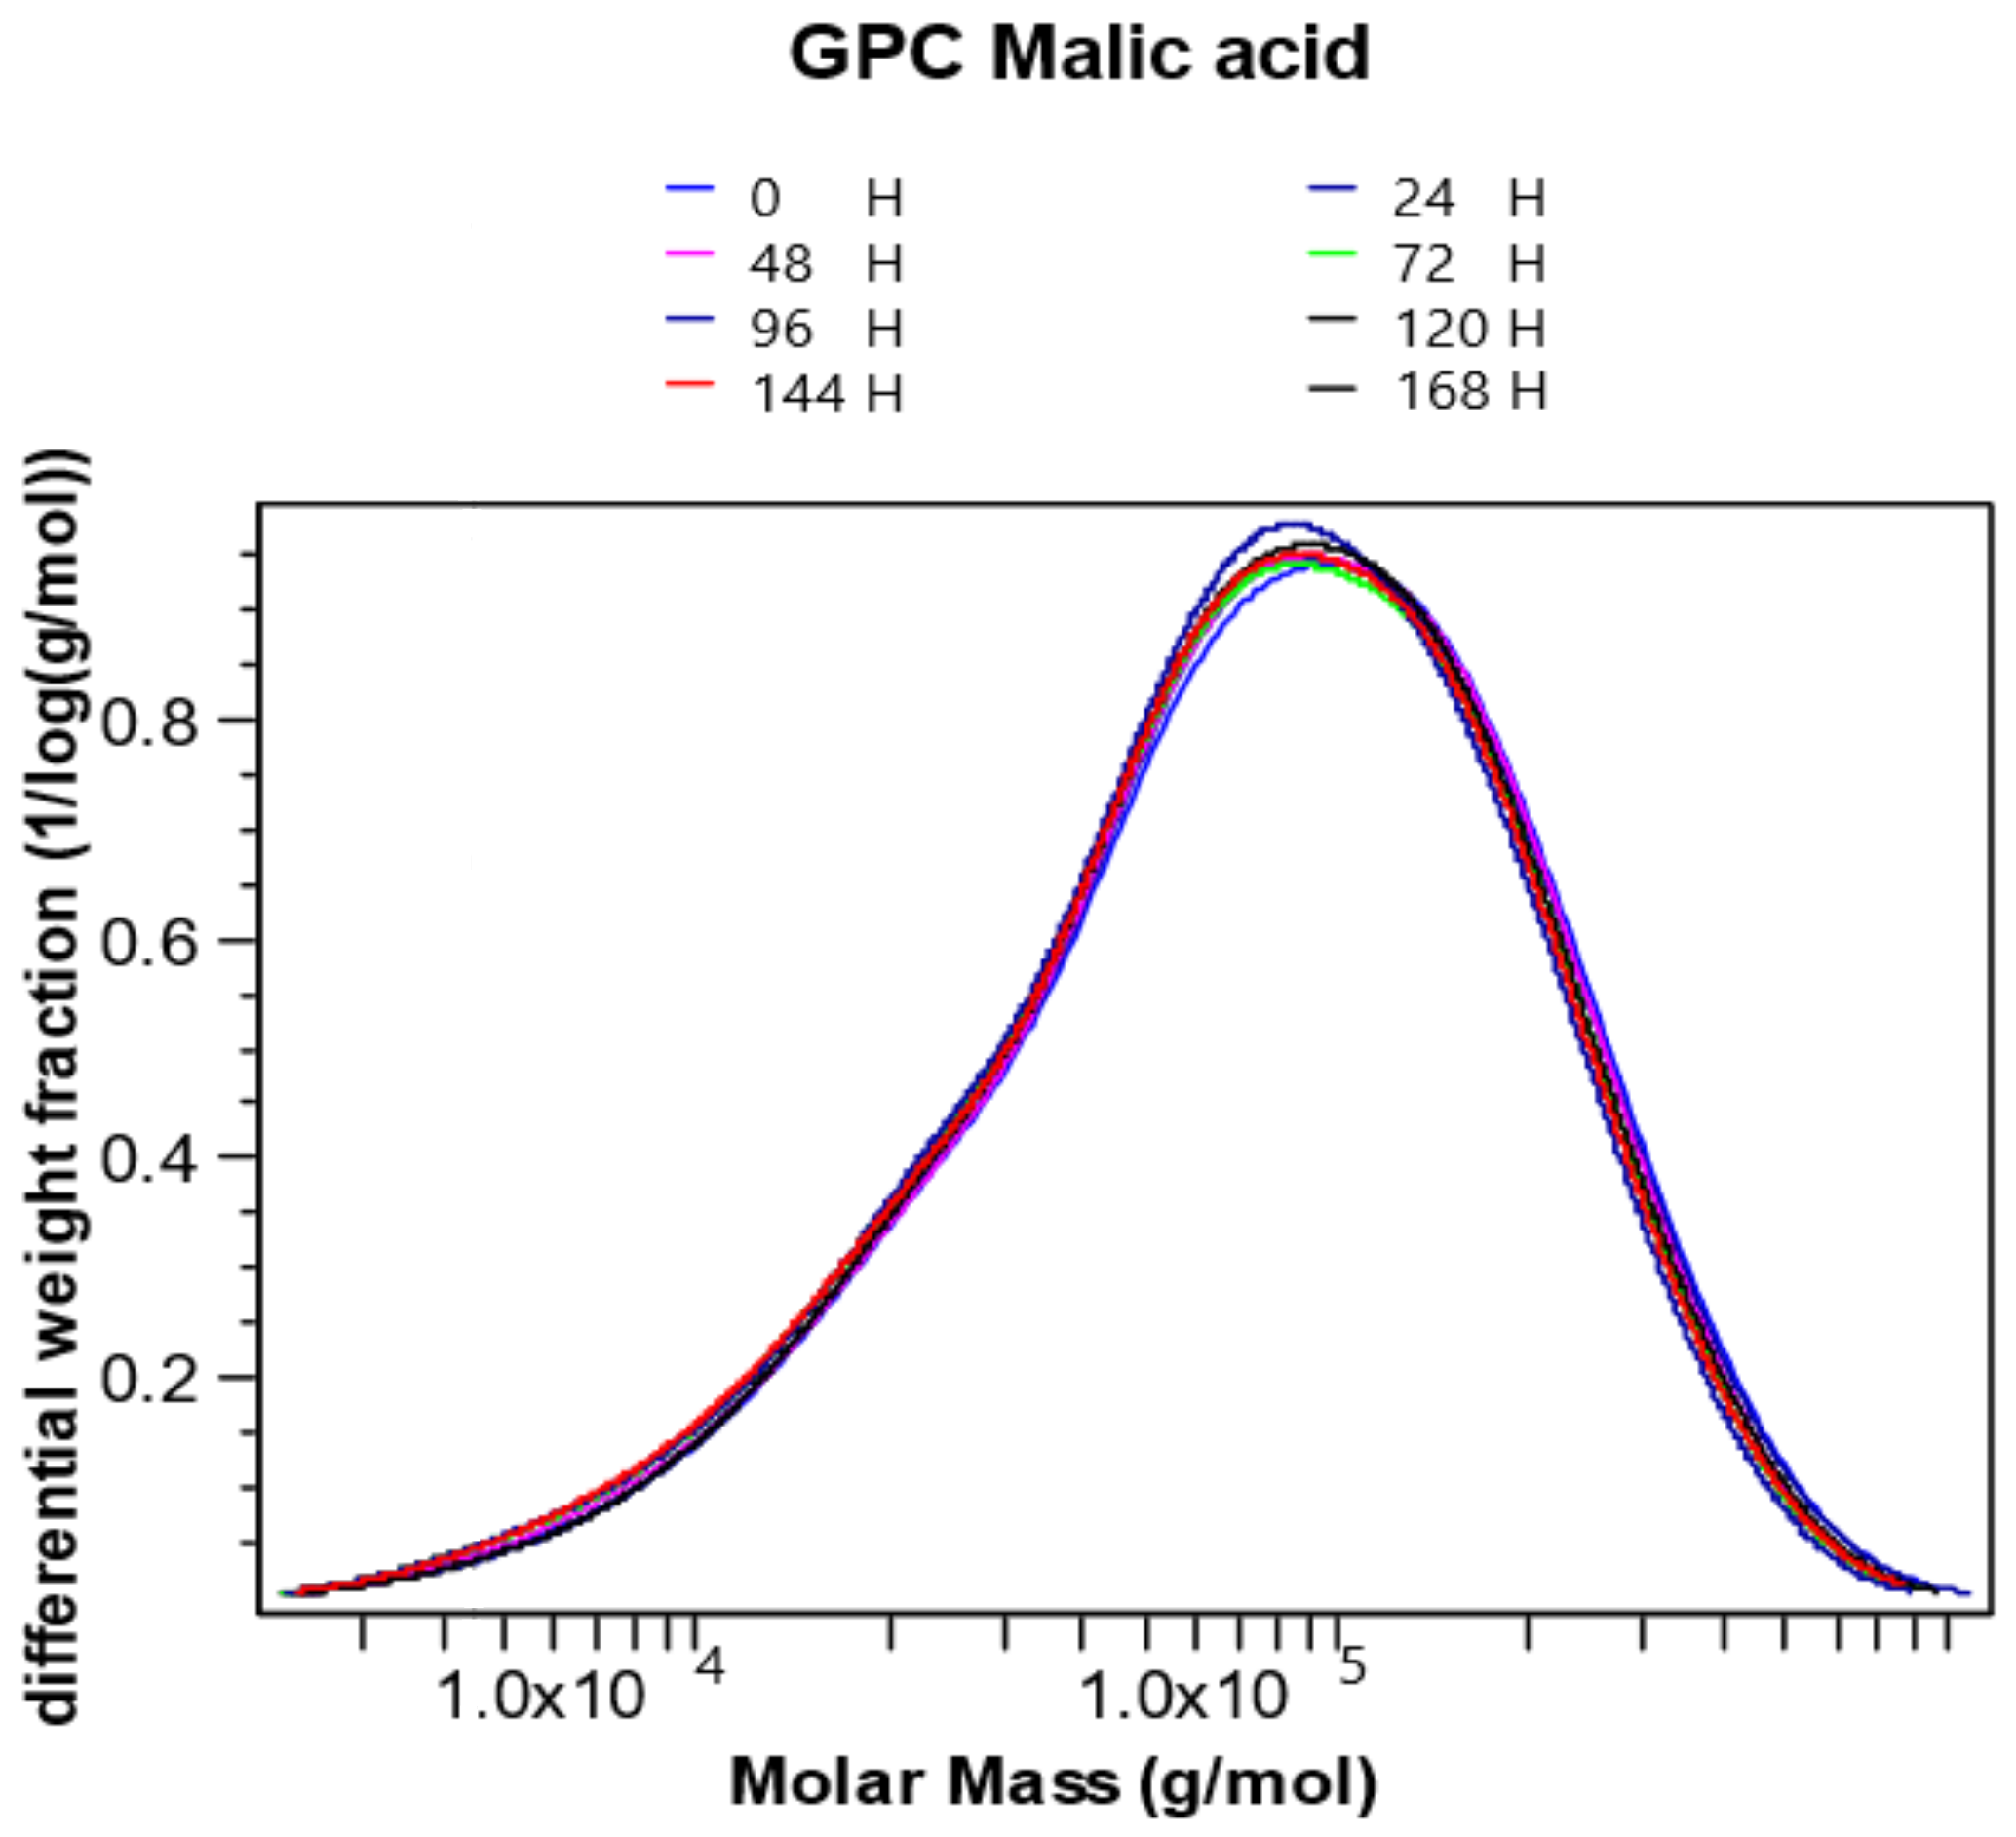
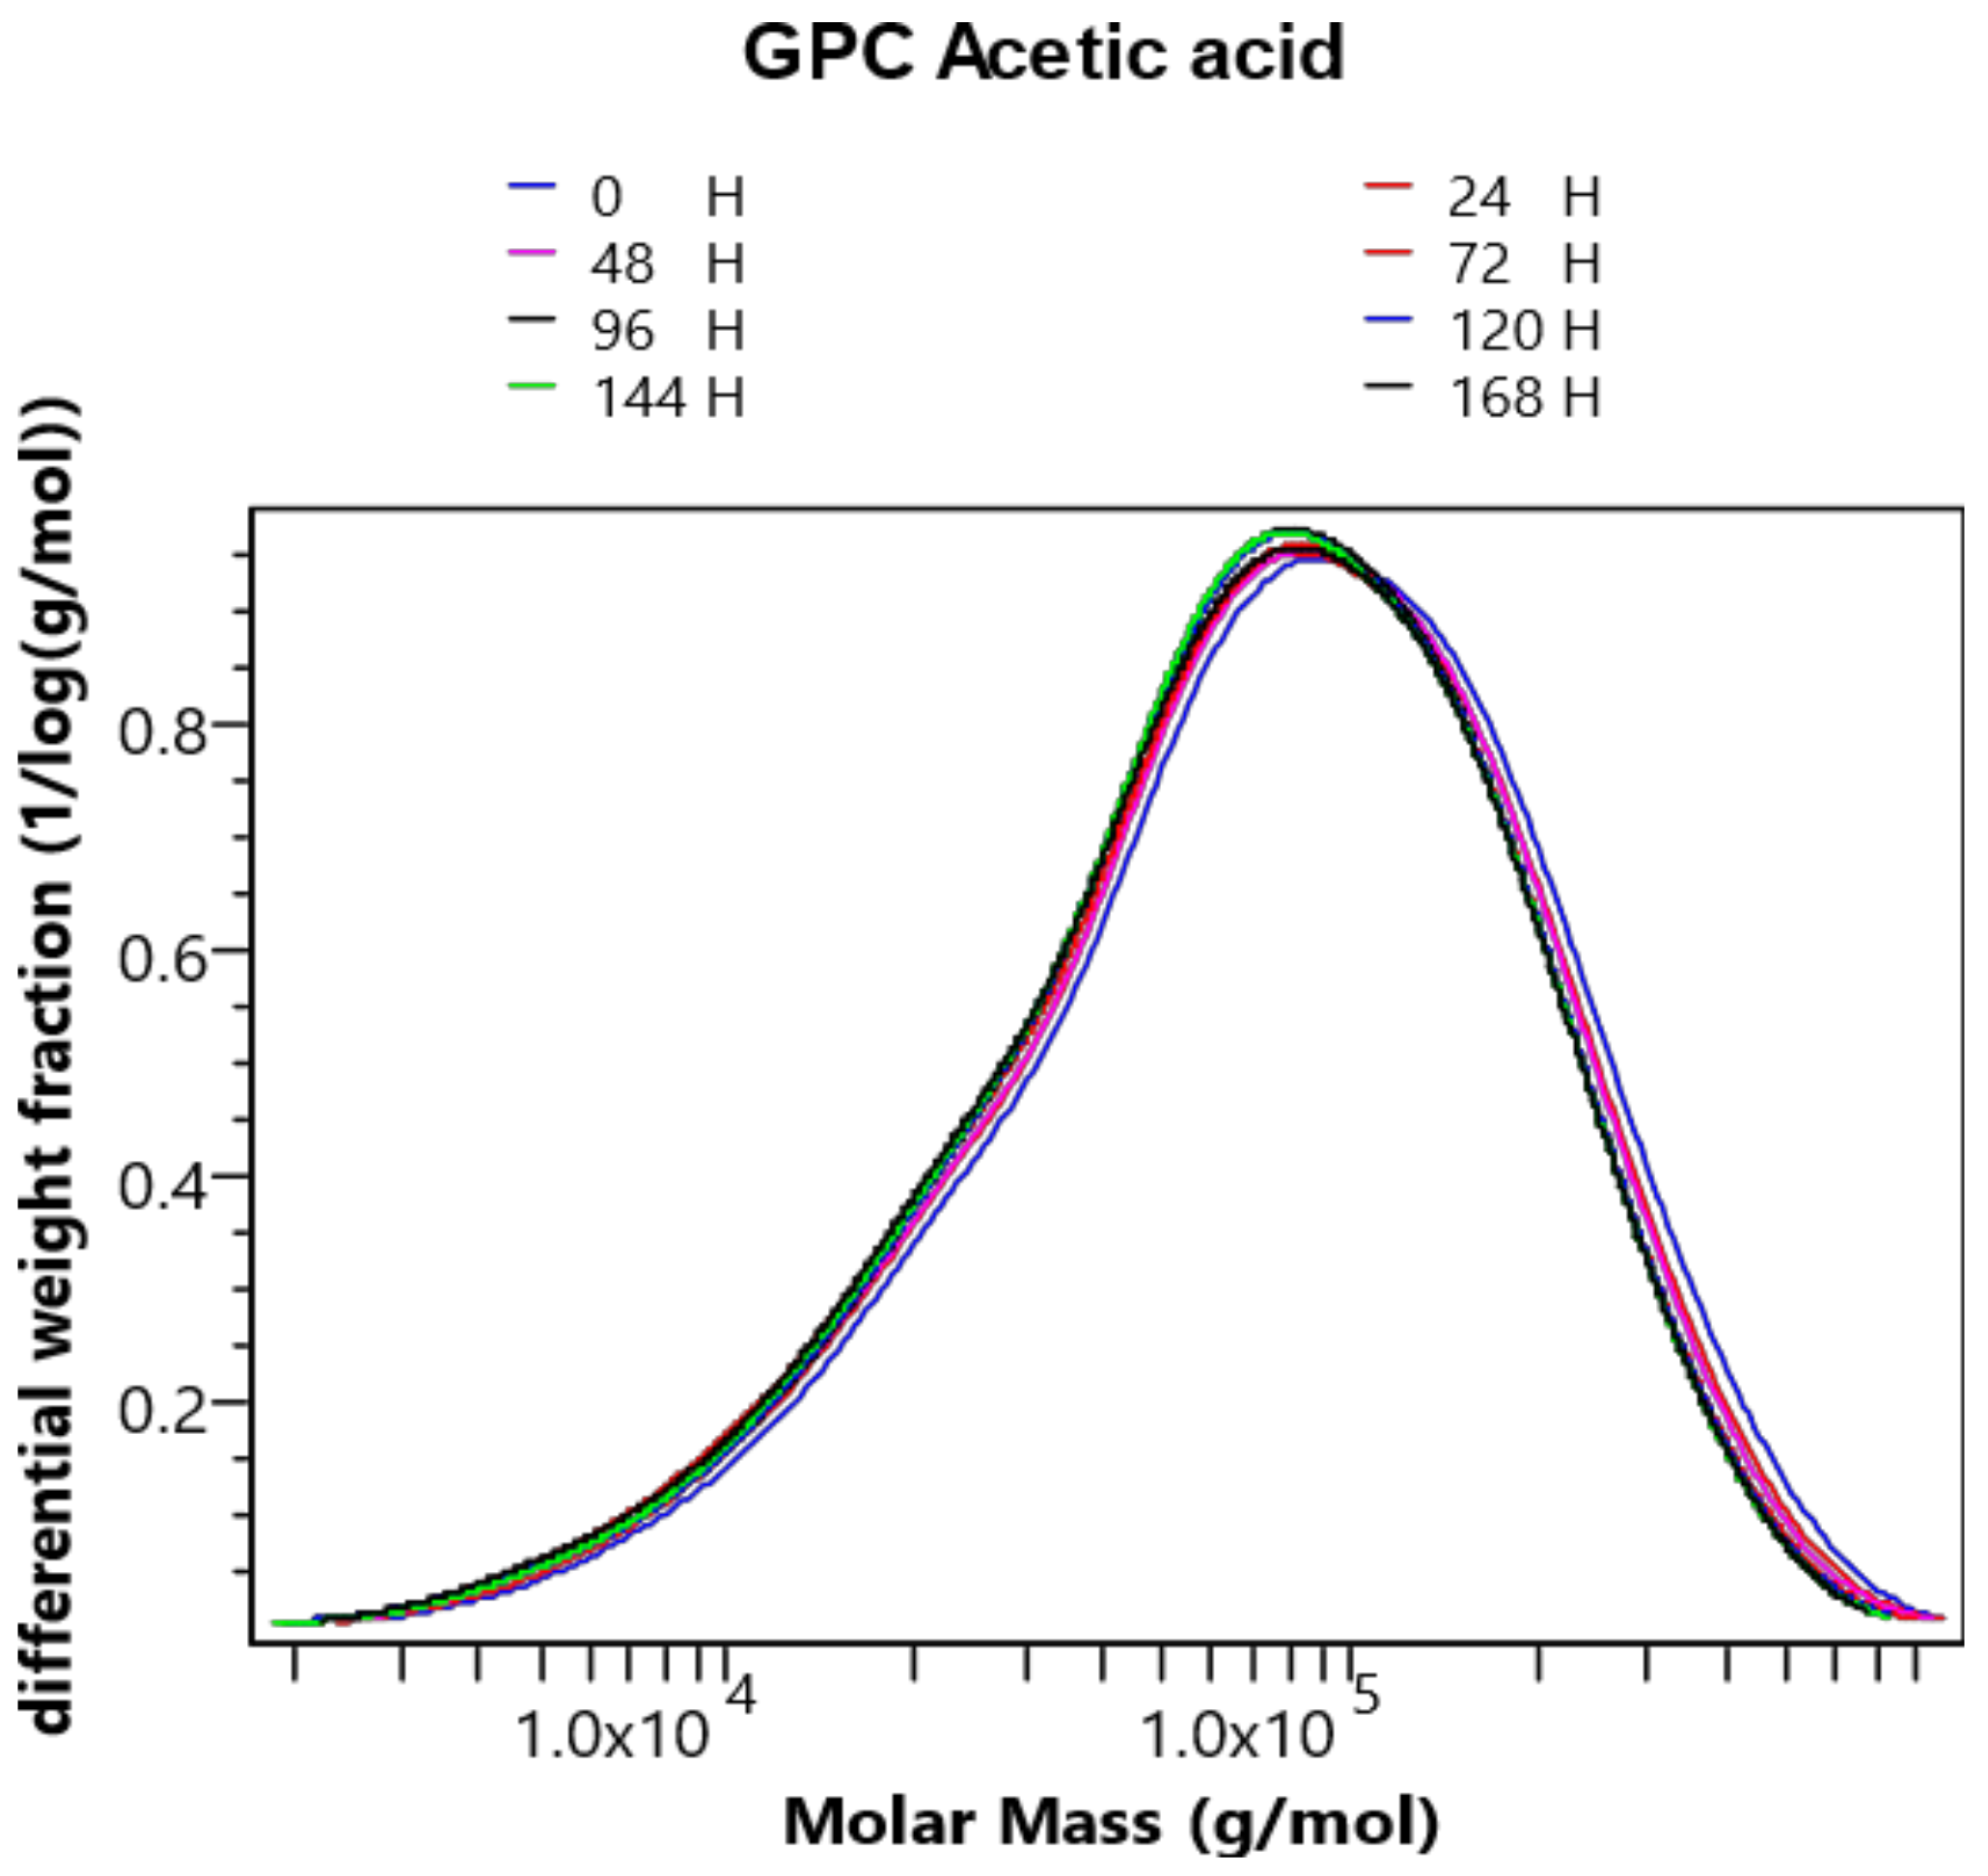
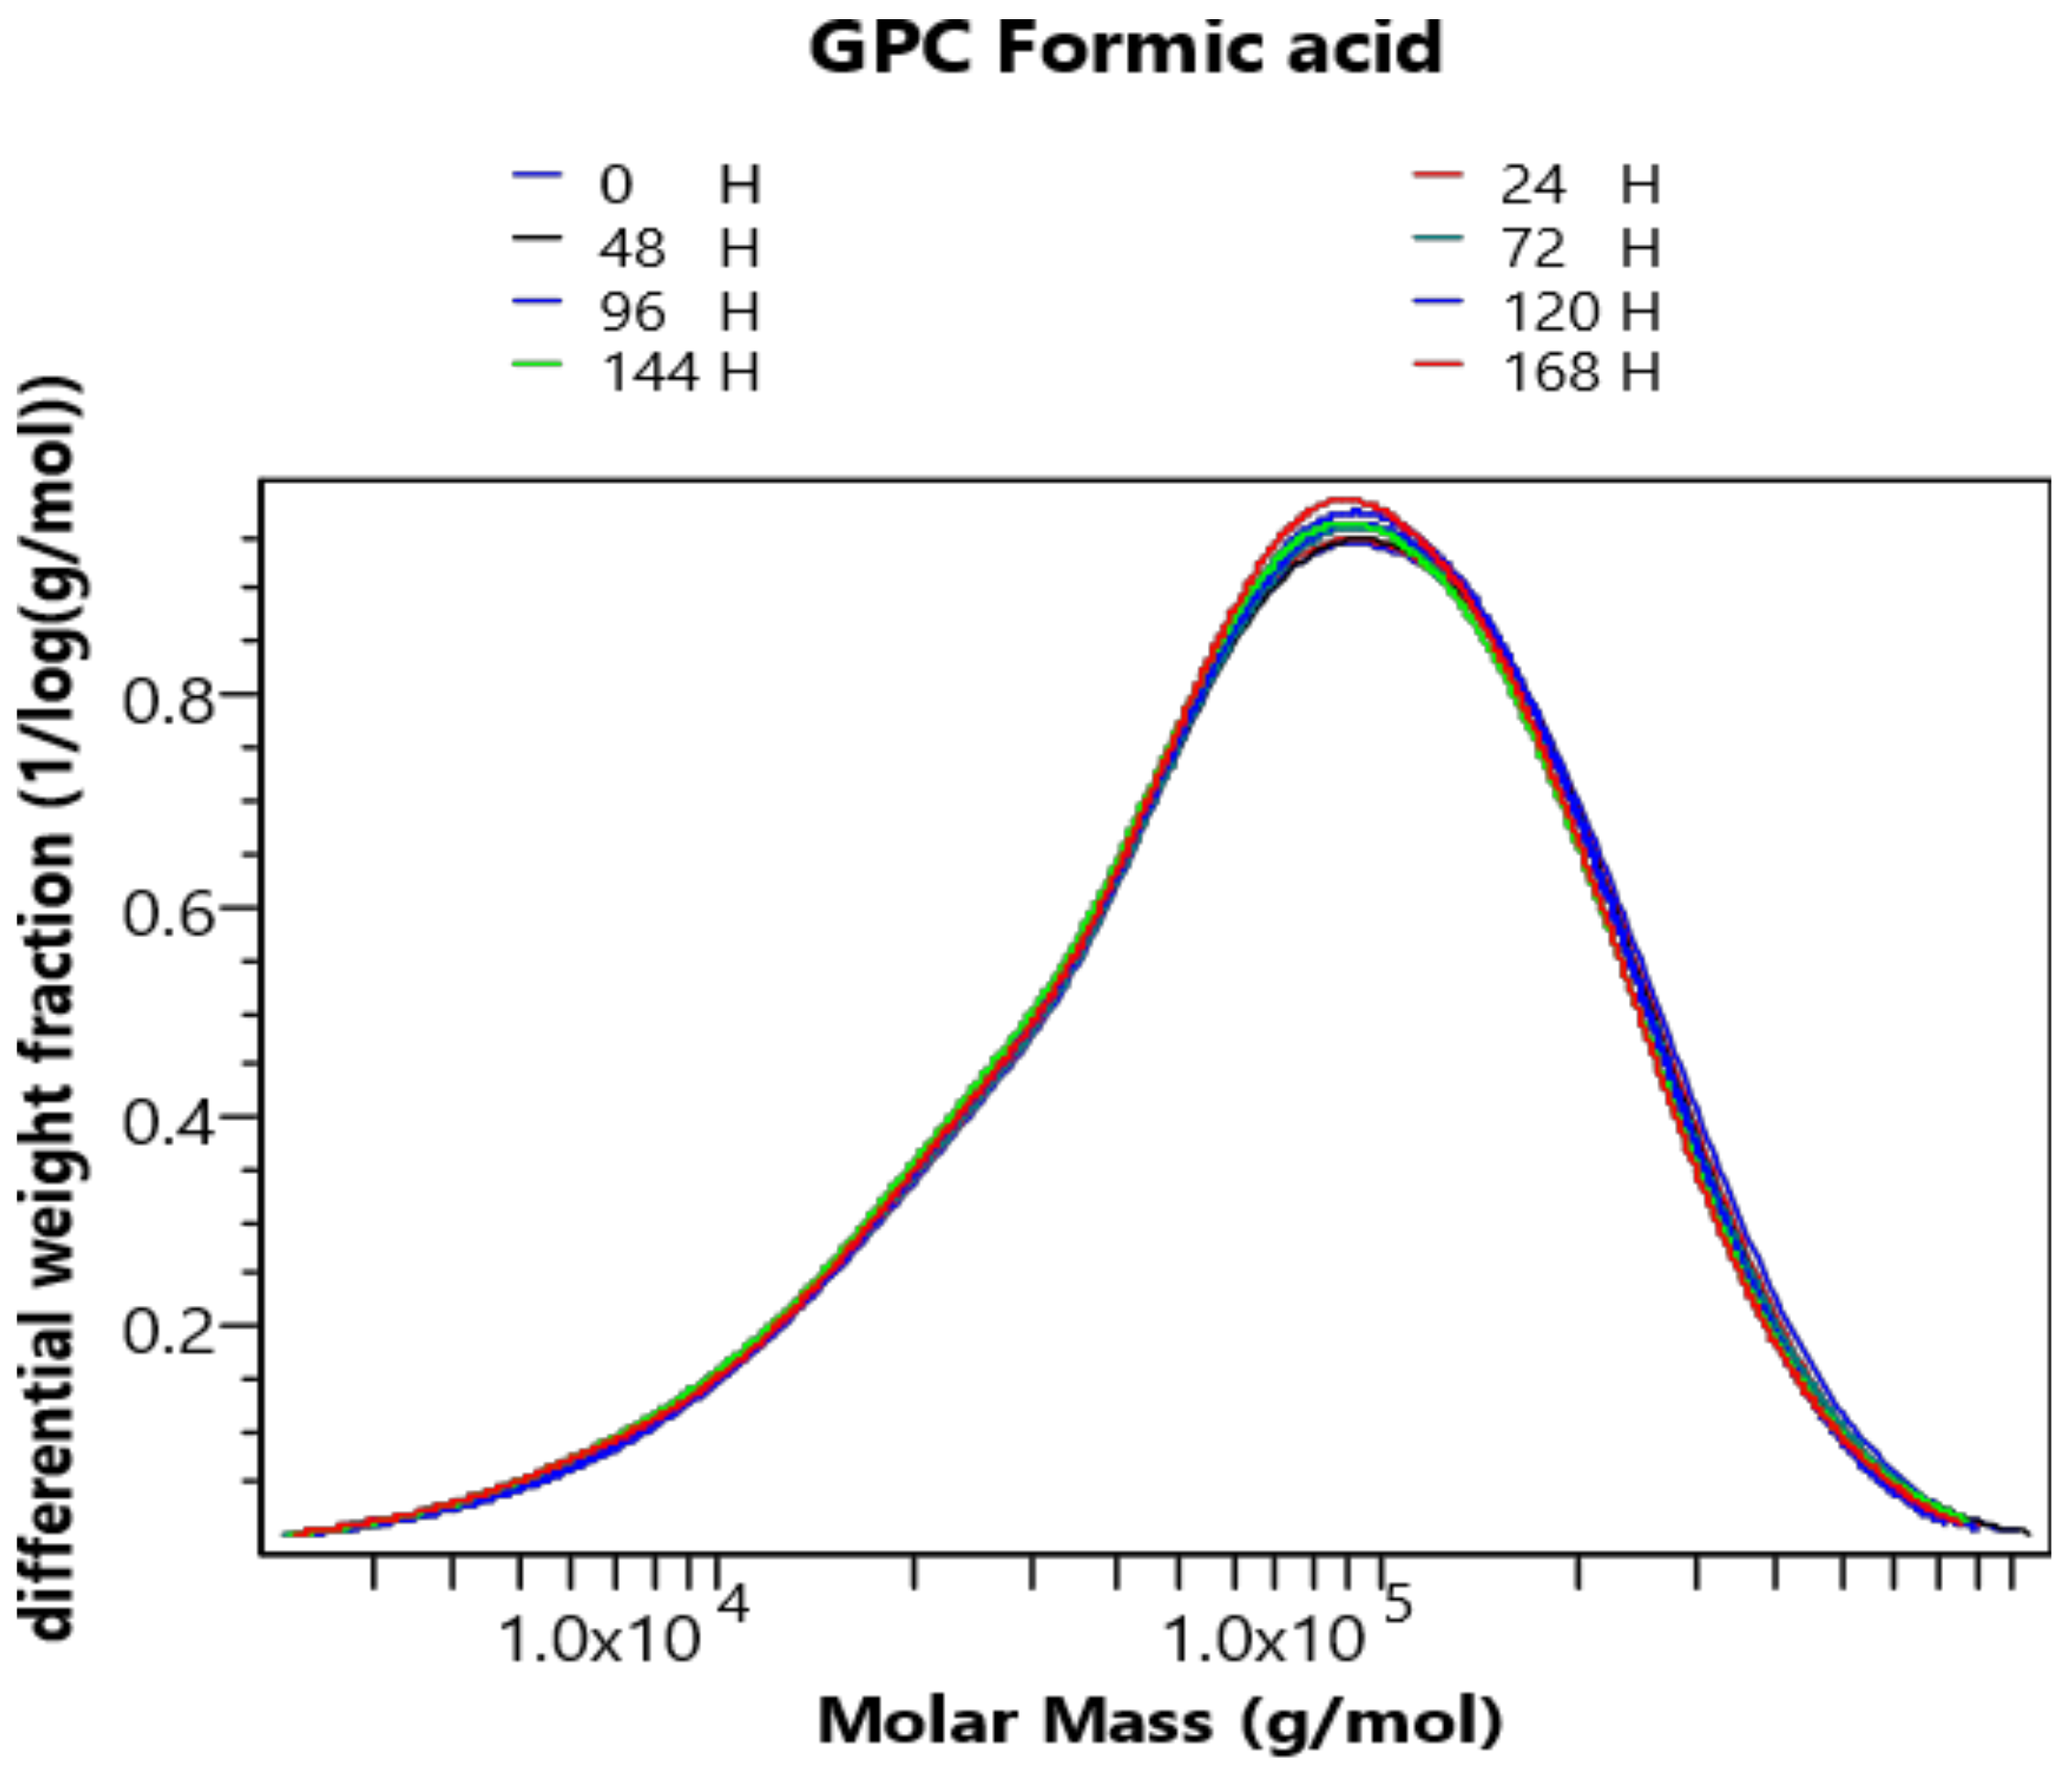
2.1. Analysis of GPC/SEC Results
2.2. Kinetics of Chitosan Degradation
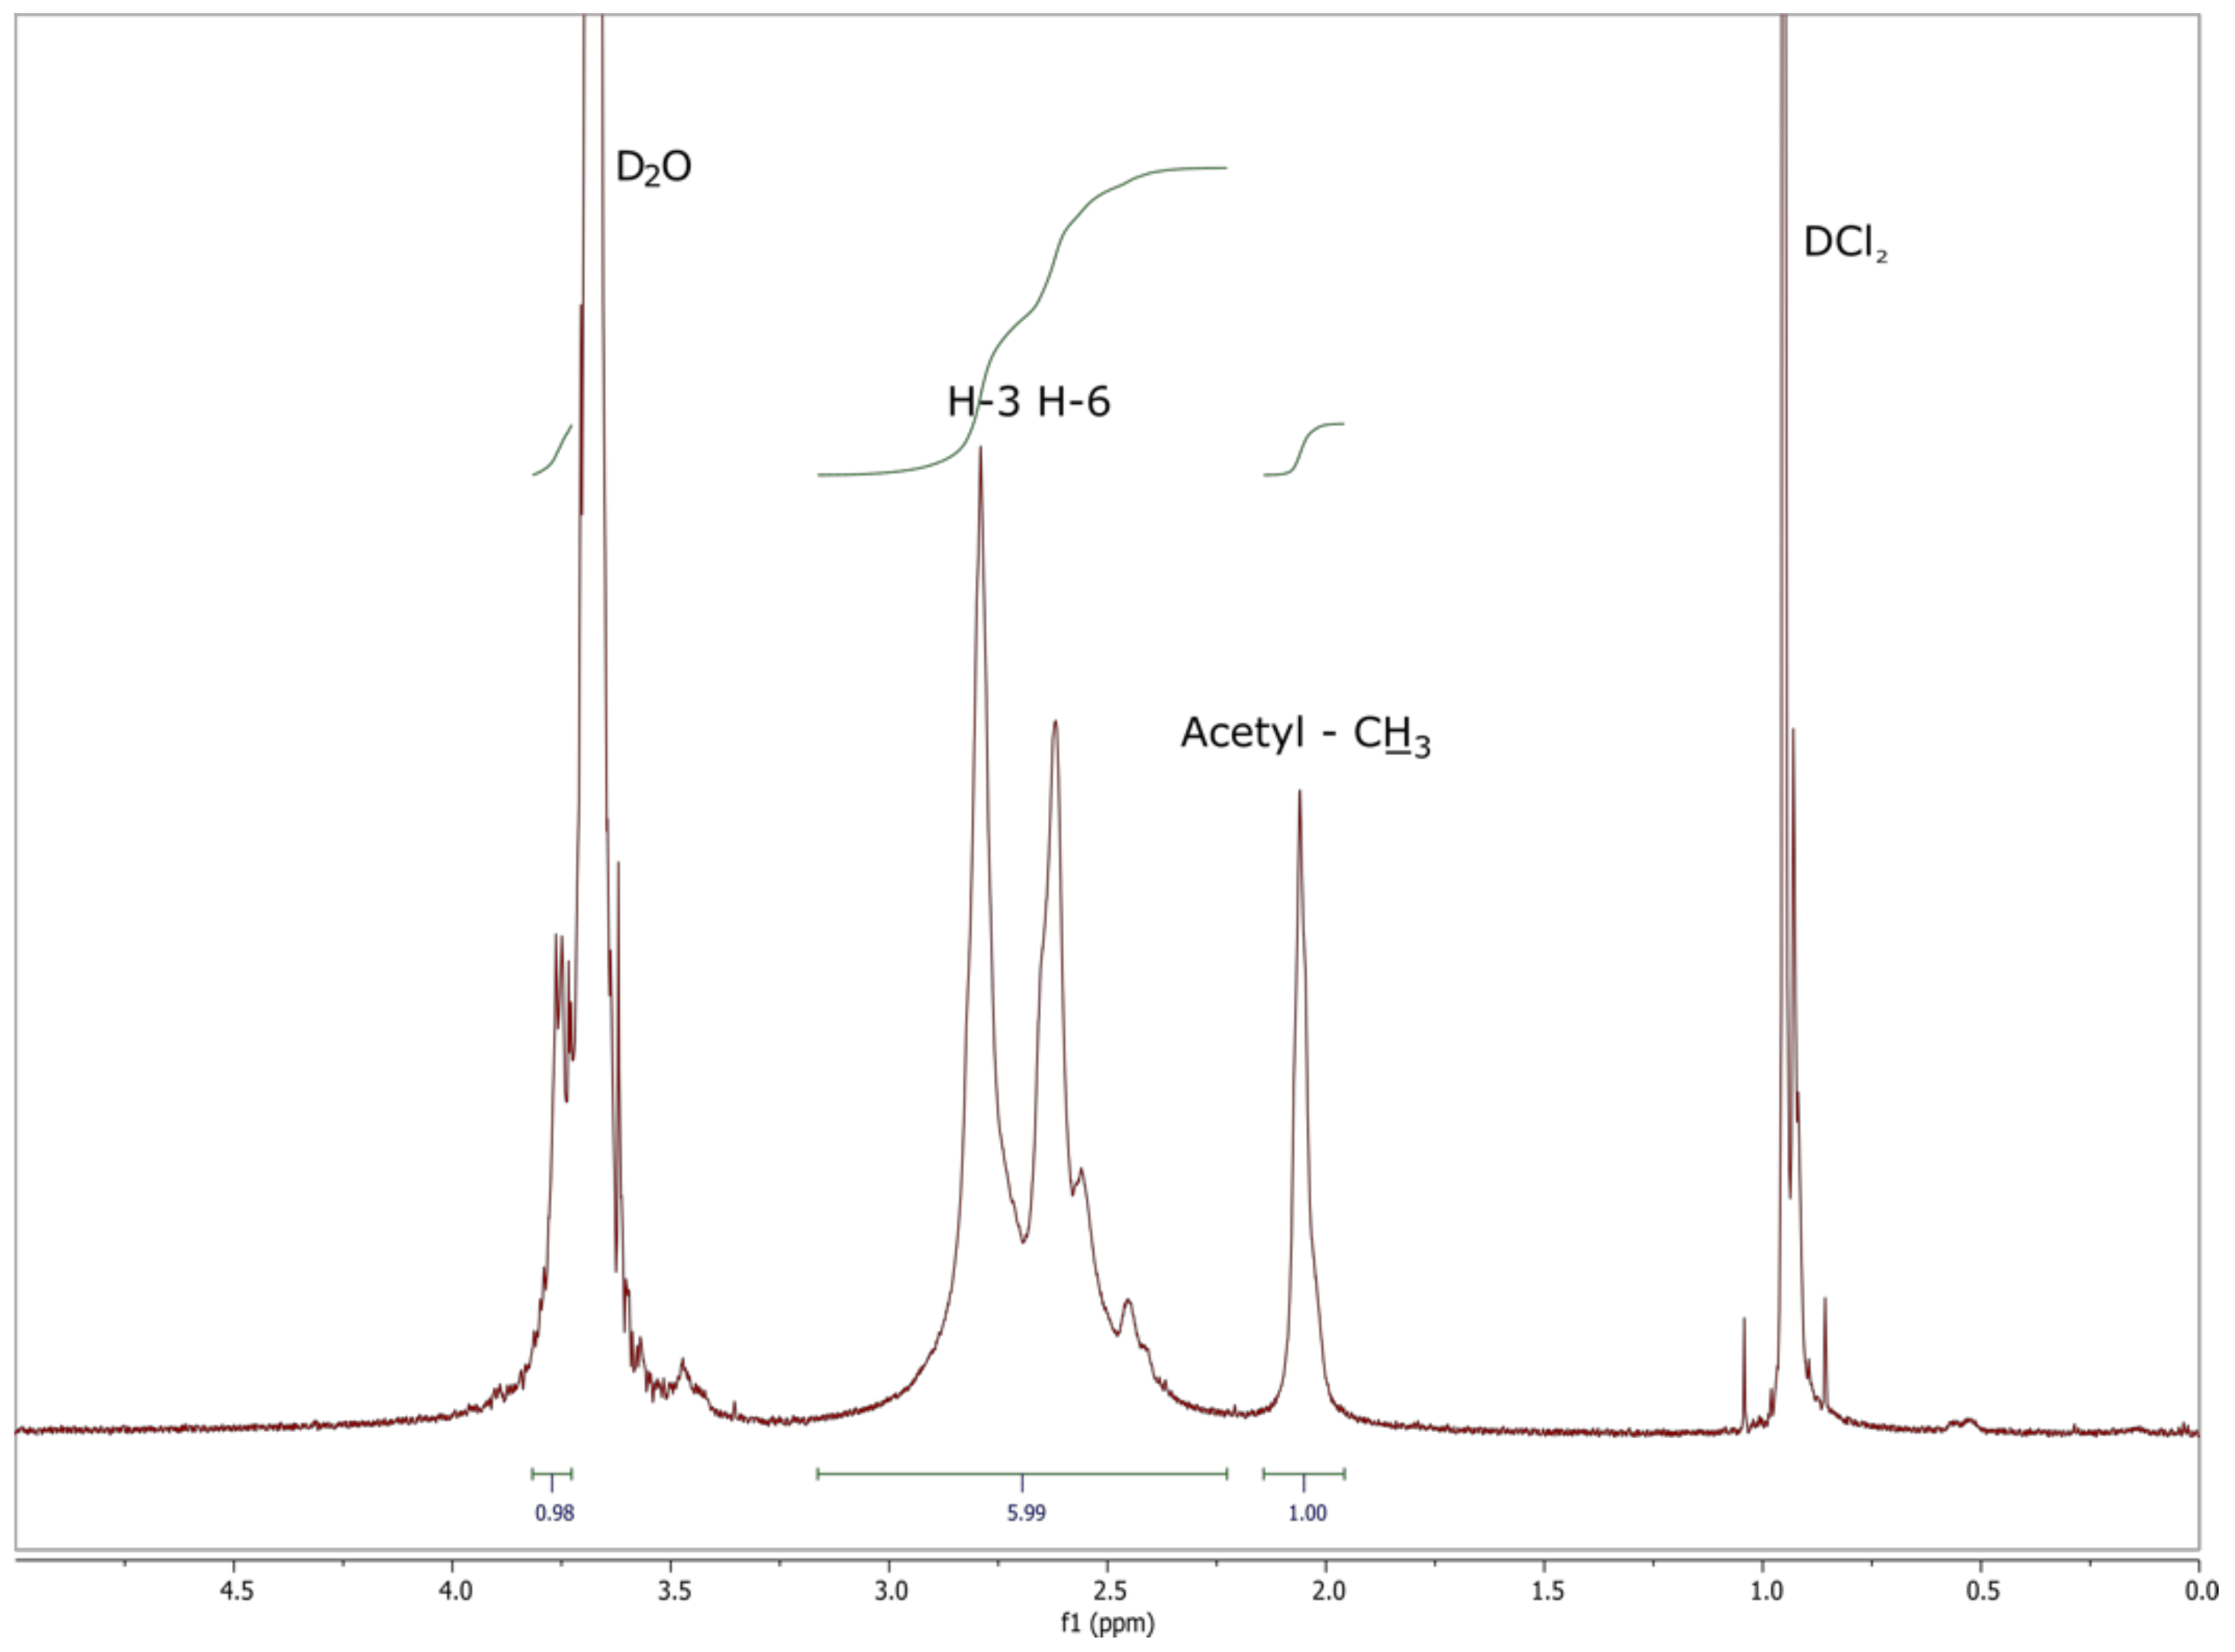
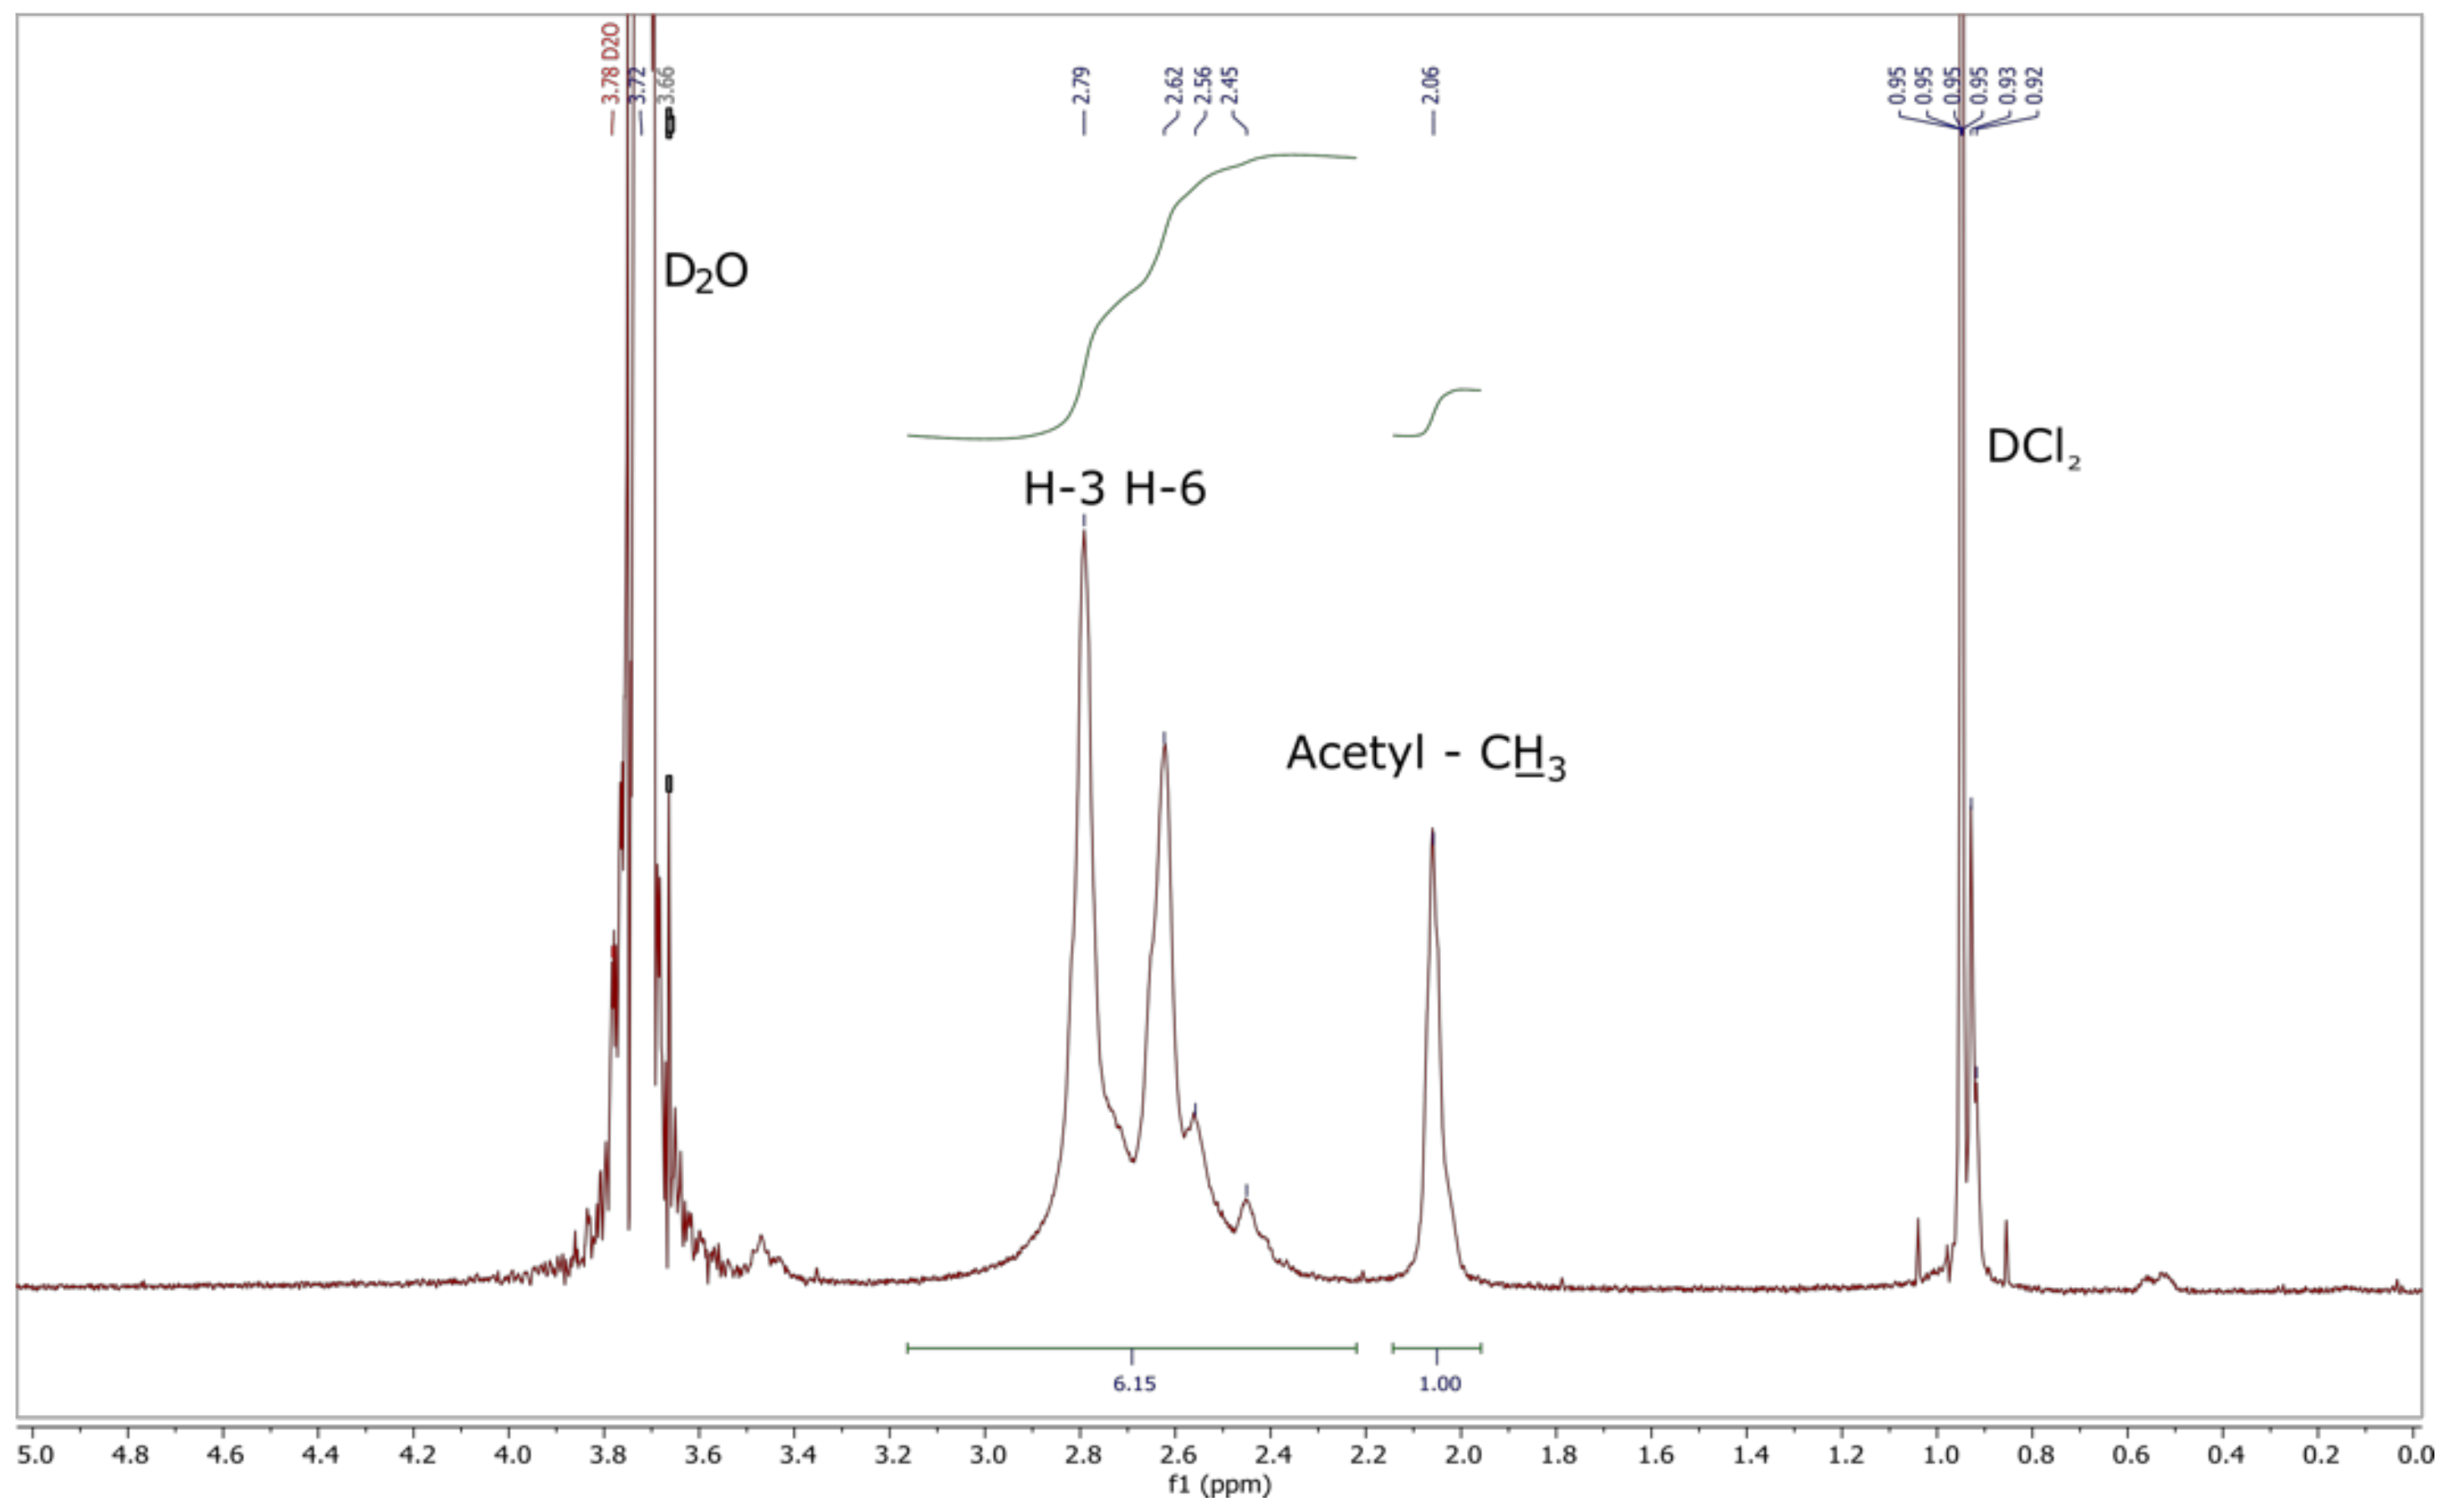
H NMR Analysis
3. Discussion
4. Materials and Methods
4.1. Intrinsic Viscosity Measurements
4.2. GPC/SEC Analysis
4.3. NMR Spectroscopy
4.4. Determination of the Kinetics of Chitosan Degradation
5. Conclusions
Author Contributions
Funding
Acknowledgments
Conflicts of Interest
References
- Tyliszczak, B. Animal-derived chitosans. Characteristics, comparison, application Chitozany zwierzęce. Charakterystyka, porównanie, wykorzystanie. Przemysł Chem. 2016, 1, 205–208. [Google Scholar] [CrossRef]
- Filipe, C.; Jo, C.; Silva, J.C. Chitin-Based Nanocomposites: Biomedical Applications. In Eco-Friendly Polymer Nanocomposites; Springer: New Delhi, India, 2016; pp. 439–457. [Google Scholar] [CrossRef]
- Draczynski, Z. Honeybee corpses as an available source of chitin. J. Appl. Polym. Sci. 2008, 109, 1974–1981. [Google Scholar] [CrossRef]
- Khayrova, A.; Lopatin, S.; Varlamov, V. Obtaining chitin, chitosan and their melanin complexes from insects. Int. J. Biol. Macromol. 2021, 167, 1319–1328. [Google Scholar] [CrossRef]
- Ehrlich, H. Chitin and collagen as universal and alternative templates in biomineralization. Int. Geol. Rev. 2010, 52, 661–699. [Google Scholar] [CrossRef]
- La Rosa, B.A.J.-D.; Quintana, P.; Ardisson, P.; Yáñez-Limón, J.M.; Alvarado-Gil, J.J. Effects of thermal treatments on the structure of two black coral species chitinous exoskeleton. J. Mater. Sci. 2012, 47, 990–998. [Google Scholar] [CrossRef]
- Khoushab, F.; Yamabhai, M. Chitin Research Revisited. Mar. Drugs 2010, 8, 1988–2012. [Google Scholar] [CrossRef] [PubMed]
- Pillai, C.; Paul, W.; Sharma, C.P. Chitin and chitosan polymers: Chemistry, solubility and fiber formation. Prog. Polym. Sci. 2009, 34, 641–678. [Google Scholar] [CrossRef]
- Draczynski, Z.; Boguń, M.; Sujka, W.; Kolesińska, B. An industrial-scale synthesis of biodegradable soluble in organic solvents butyric-acetic chitin co polyesters. Adv. Polym. Technol. 2018, 37, 3210–3221. [Google Scholar] [CrossRef]
- Draczyński, Z. Synthesis and solubility properties of chitin acetate/butyrate copolymers. J. Appl. Polym. Sci. 2011, 122, 175–182. [Google Scholar] [CrossRef]
- Romanazzi, G.; Gabler, F.M.; Margosan, D.; Mackey, B.E.; Smilanick, J.L. Effect of Chitosan Dissolved in Different Acids on Its Ability to Control Postharvest Gray Mold of Table Grape. Phytopathology 2009, 99, 1028–1036. [Google Scholar] [CrossRef] [PubMed]
- Furuike, T.; Komoto, D.; Hashimoto, H.; Tamura, H. Preparation of chitosan hydrogel and its solubility in organic acids. Int. J. Biol. Macromol. 2017, 104, 1620–1625. [Google Scholar] [CrossRef]
- Venkatesan, J.; Kim, S.-K. Chitosan Composites for Bone Tissue Engineering—An Overview. Mar. Drugs 2010, 8, 2252–2266. [Google Scholar] [CrossRef]
- Aranaz, I.; Mengibar, M.; Harris, R.; Panos, I.; Miralles, B.; Acosta, N.; Galed, G.; Heras, A. Functional Characterization of Chitin and Chitosan. Curr. Chem. Biol. 2009, 3, 203–230. [Google Scholar] [CrossRef]
- Croisier, F.; Jérôme, C. Chitosan-based biomaterials for tissue engineering. Eur. Polym. J. 2013, 49, 780–792. [Google Scholar] [CrossRef]
- Gonil, P.; Sajomsang, W. Applications of magnetic resonance spectroscopy to chitin from insect cuticles. Int. J. Biol. Macromol. 2012, 51, 514–522. [Google Scholar] [CrossRef] [PubMed]
- Roy, J.C.; Salaün, F.; Giraud, S.; Ferri, G.C.A.; Chen, G.; Guan, J. Solubility of Chitin: Solvents, Solution Behaviors and Their Related Mechanisms. Solubility Polysacch. 2017. [Google Scholar] [CrossRef]
- Rinaudo, M. Chitin and chitosan: Properties and applications. Prog. Polym. Sci. 2006, 31, 603–632. [Google Scholar] [CrossRef]
- Ostrowska-Czubenko, J.; Pieróg, M.; Gierszewska, M. Modyfikacja Chitozanu Krótki Przegląd Modification of Chi-tosan a Concise Overview. Wiadomości Chem. 2016, 70, 9–10. [Google Scholar]
- Nagahama, H.; Nwe, N.; Jayakumar, R.; Koiwa, S.; Furuike, T.; Tamura, H. Novel biodegradable chitin membranes for tissue engineering applications. Carbohydr. Polym. 2008, 73, 295–302. [Google Scholar] [CrossRef]
- Le Goff, R.; Mahé, O.; Le Coz-Botrel, R.; Malo, S.; Goupil, J.-M.; Brière, J.-F.; Dez, I. Insight in chitosan aerogels derivatives -Application in catalysis. React. Funct. Polym. 2020, 146, 104393. [Google Scholar] [CrossRef]
- Madhumathi, K.; Shalumon, K.; Rani, V.D.; Tamura, H.; Furuike, T.; Selvamurugan, N.; Nair, S.; Jayakumar, R. Wet chemical synthesis of chitosan hydrogel–hydroxyapatite composite membranes for tissue engineering applications. Int. J. Biol. Macromol. 2009, 45, 12–15. [Google Scholar] [CrossRef] [PubMed]
- Shalumon, K.; Binulal, N.; Selvamurugan, N.; Nair, S.; Menon, D.; Furuike, T.; Tamura, H.; Jayakumar, R. Electrospinning of carboxymethyl chitin/poly(vinyl alcohol) nanofibrous scaffolds for tissue engineering applications. Carbohydr. Polym. 2009, 77, 863–869. [Google Scholar] [CrossRef]
- Anitha, A.; Rani, V.D.; Krishna, R.; Sreeja, V.; Selvamurugan, N.; Nair, S.; Tamura, H.; Jayakumar, R. Synthesis, characterization, cytotoxicity and antibacterial studies of chitosan, O-carboxymethyl and N,O-carboxymethyl chitosan nanoparticles. Carbohydr. Polym. 2009, 78, 672–677. [Google Scholar] [CrossRef]
- Azhar, F.F.; Olad, A.; Salehi, R. Fabrication and characterization of chitosan–gelatin/nanohydroxyapatite–polyaniline composite with potential application in tissue engineering scaffolds. Des. Monomers Polym. 2014, 17, 654–667. [Google Scholar] [CrossRef]
- Jayakumar, R.; Prabaharan, M.; Nair, S.; Tamura, H. Novel chitin and chitosan nanofibers in biomedical applications. Biotechnol. Adv. 2010, 28, 142–150. [Google Scholar] [CrossRef] [PubMed]
- Cavallaro, G.; Micciulla, S.; Chiappisi, L.; Lazzara, G. Chitosan-based smart hybrid materials: A physico-chemical perspec-tive. J. Mater. Chem. B 2021, 9, 594–611. [Google Scholar] [CrossRef]
- Bertolino, V.; Cavallaro, G.; Milioto, S.; Lazzara, G. Polysaccharides/Halloysite nanotubes for smart bionanocompo-site materials. Carbohydr. Polym. 2020, 245, 116502. [Google Scholar] [CrossRef] [PubMed]
- Giraldo, J.D.; Rivas, B.L. Direct ionization and solubility of chitosan in aqueous solutions with acetic acid. Polym. Bull. 2021, 78, 1465–1488. [Google Scholar] [CrossRef]
- Feng, F.; Liu, Y.; Zhao, B.; Hu, K. Characterization of half N-acetylated chitosan powders and films. Procedia Eng. 2012, 27, 718–732. [Google Scholar] [CrossRef]
- Rinaudc, M.; Pavlov, G.; Desbrières, J. Solubilization of Chitosan in Strong Acid Medium. Int. J. Polym. Anal. Charact. 1999, 5, 267–276. [Google Scholar] [CrossRef]
- Seela, J.L.; Huffman, J.C.; Christou, G. Preparation, structure, and properties of [NEt4][Mn(edt)2(Him)](H2edt = ethane-1,2-dithiol; Him = imidazole), a mononuclear manganese(III) thiolate possessing a rare manganese(III)-imidazole bond. J. Chem. Soc. Chem. Commun. 1985, 1985, 58–60. [Google Scholar] [CrossRef]
- Leffler, C.C.; Müller, B.W. Influence of the acid type on the physical and drug liberation properties of chitosan–gelatin sponges. Int. J. Pharm. 2000, 194, 229–237. [Google Scholar] [CrossRef]
- Ma, Z.; Wang, W.; Wu, Y.; He, Y.; Wu, T. Oxidative Degradation of Chitosan to the Low Molecular Water-Soluble Chitosan over Peroxotungstate as Chemical Scissors. PLoS ONE 2014, 9, e100743. [Google Scholar] [CrossRef] [PubMed]
- Purwanto, E.; Connor, J.; Ngothai, Y. The kinetics oxidative degradation of chitosan in formic acid with the presence of hydrogen peroxide. IOP Conf. Series Mater. Sci. Eng. 2019, 703, 012041. [Google Scholar] [CrossRef]
- Martini, B.; Dimida, S.; De Benedetto, E.; Madaghiele, M.; Demitri, C. Study on the degradation of chitosan slurries. Results Phys. 2016, 6, 728–729. [Google Scholar] [CrossRef][Green Version]
- Gámiz-González, M.; Correia, D.; Lanceros-Mendez, S.; Sencadas, V.; Ribelles, J.G.; Vidaurre, A. Kinetic study of thermal degradation of chitosan as a function of deacetylation degree. Carbohydr. Polym. 2017, 167, 52–58. [Google Scholar] [CrossRef]
- Wanjun, T.; Cunxin, W.; Donghua, C. Kinetic studies on the pyrolysis of chitin and chitosan. Polym. Degrad. Stab. 2005, 87, 389–394. [Google Scholar] [CrossRef]
- Czechowska-Biskup, R.; Rokita, B.; Lotfy, S.; Ulanski, P.; Rosiak, J.M. Degradation of chitosan and starch by 360-kHz ultrasound. Carbohydr. Polym. 2005, 60, 175–184. [Google Scholar] [CrossRef]
- Chen, R.H.; Chang, J.R.; Shyur, J.S. Effects of ultrasonic conditions and storage in acidic solutions on changes in molecular weight and polydispersity of treated chitosan. Carbohydr. Res. 1997, 299, 287–294. [Google Scholar] [CrossRef]
- Bajer, D.; Kaczmarek, H. Study of the Influence OV UV Radiation on Biodegradable Blends Based on Chitosan and Starch. Prog. Chem. Appl. Chitin. Deriv. 2010, 15, 17–24. [Google Scholar]
- Zhang, H.; Neau, S.H. In vitro degradation of chitosan by a commercial enzyme preparation: Effect of molecular weight and degree of deacetylation. Biomaterials 2001, 22, 1653–1658. [Google Scholar] [CrossRef]
- Vårum, K.; Ottøy, M.; Smidsrød, O. Acid hydrolysis of chitosans. Carbohydr. Polym. 2001, 46, 89–98. [Google Scholar] [CrossRef]
- Kam, H.-M.; Khor, E.; Lim, L.-Y. Storage of partially deacetylated chitosan films. J. Biomed. Mater. Res. 1999, 48, 881–888. [Google Scholar] [CrossRef]
- Jayakumar, R.; Prabaharan, M.; Kumar, P.S.; Nair, S.; Tamura, H. Biomaterials based on chitin and chitosan in wound dressing applications. Biotechnol. Adv. 2011, 29, 322–337. [Google Scholar] [CrossRef]
- Muzzarelli, R.; Baldassarre, V.; Conti, F.; Ferrara, P.; Biagini, G. Biological activity of chitosan: Ultrastructural study. Biomaterials 1988, 9, 247–252. [Google Scholar] [CrossRef]
- Li, R.; Xu, Z.; Jiang, Q.; Zheng, Y.; Chen, Z.; Chen, X. Characterization and biological evaluation of a novel silver nanoparticle-loaded collagen-chitosan dressing. Regen. Biomater. 2020, 7, 371–380. [Google Scholar] [CrossRef]
- Kasaai, M.R. Calculation of Mark–Houwink–Sakurada (MHS) equation viscometric constants for chitosan in any solvent–temperature system using experimental reported viscometric constants data. Carbohydr. Polym. 2007, 68, 477–488. [Google Scholar] [CrossRef]
- Morris, G.A.; Castile, J.; Smith, A.; Adams, G.G.; Harding, S.E. The kinetics of chitosan depolymerisation at different temperatures. Polym. Degrad. Stab. 2009, 94, 1344–1348. [Google Scholar] [CrossRef][Green Version]
- Beattie, W.H.; Booth, C. Intrinsic viscosity–molecular weight relationship for cis-1,4-polyisoprene. J. Appl. Polym. Sci. 1963, 7, 507–514. [Google Scholar] [CrossRef]
- Rinaudo, M.; Milas, M.; Le Dung, P. Characterization of chitosan. Influence of ionic strength and degree of acetylation on chain expansion. Int. J. Biol. Macromol. 1993, 15, 281–285. [Google Scholar] [CrossRef]
- Kasaai, M.R.; Arul, J.; Charlet, G. Fragmentation of Chitosan by Acids. Sci. World J. 2013, 2013, 1–11. [Google Scholar] [CrossRef] [PubMed]


| Degradation Time [Hours] | Salt of Malic Acid pKa = 3.51 | Salt of Acetic Acid pKa = 4.76 | ||
|---|---|---|---|---|
| Mv (g/mol) | Mv (g/mol) | |||
| 0 | 1.61 | 119,400 | 1.58 | 116,500 |
| 24 | 1.61 | 119,400 | 1.57 | 115,700 |
| 48 | 1.62 | 118,500 | 1.55 | 114,300 |
| 72 | 1.59 | 117,500 | 1.54 | 113,000 |
| 96 | 1.52 | 111,000 | 1.53 | 111,900 |
| 120 | 1.48 | 107,300 | 1.52 | 111,300 |
| 144 | 1.32 | 106,300 | 1.51 | 110,600 |
| 168 | 1.31 | 106,000 | 1.51 | 109,800 |
| Degradation Time [Hours] | Salt of Formic Acid pKa = 3.75 | Salt of Lactic Acid pKa = 3.81 | ||
| Mv (g/mol) | Mv (g/mol) | |||
| 0 | 1.60 | 118,500 | 1.60 | 118,500 |
| 24 | 1.59 | 117,500 | 1.58 | 116,600 |
| 48 | 1.58 | 116,600 | 1.57 | 115,200 |
| 72 | 1.57 | 115,700 | 1.56 | 114,700 |
| 96 | 1.55 | 113,800 | 1.54 | 112,900 |
| 120 | 1.53 | 111,900 | 1.53 | 111,900 |
| 144 | 1.52 | 111,000 | 1.52 | 111,010 |
| 168 | 1.51 | 110,100 | 1.51 | 110,100 |
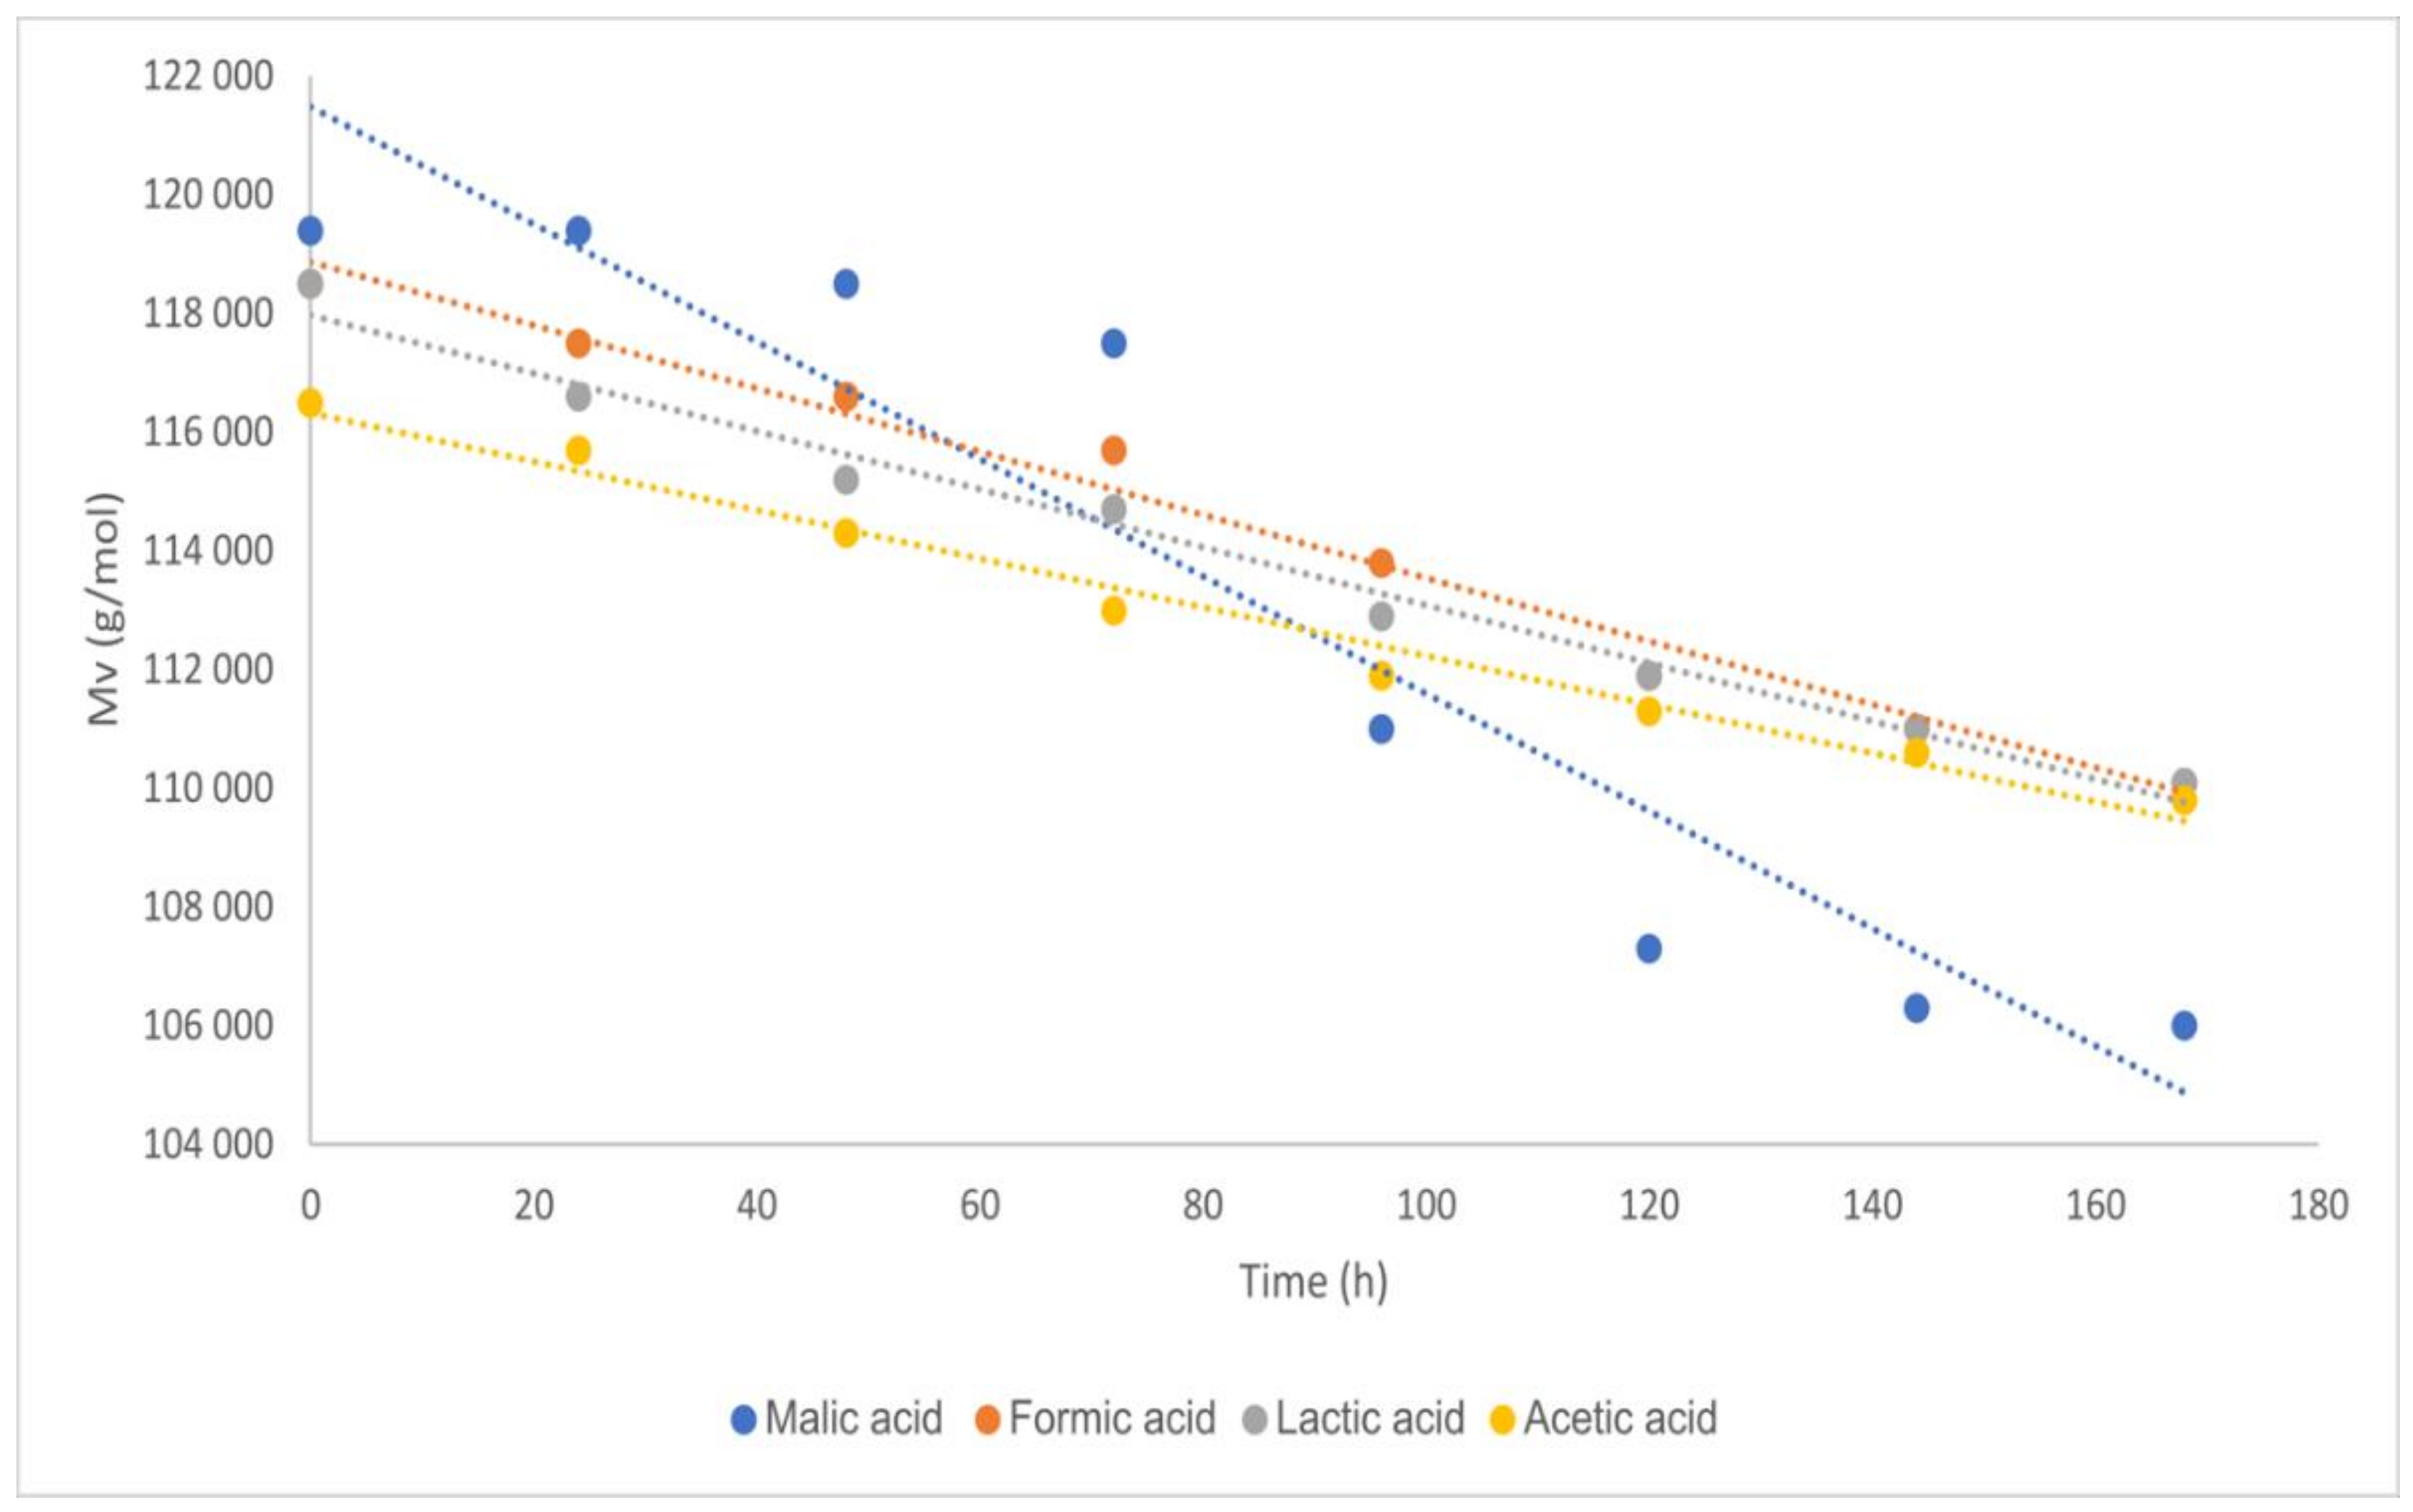
| Acid | pKa | Angular Coefficient Figure 1 | Errors for the Angular Coefficients | R2 |
|---|---|---|---|---|
| Malic acid | 3.51 | −150.24 | 6.14 | 0.99 |
| Formic acid | 3.75 | −53.06 | 2.61 | 0.98 |
| Lactic acid | 3.81 | −48.65 | 2.43 | 0.98 |
| Acetic acid | 4.76 | −41.11 | 2.07 | 0.98 |
| Degradation Time [Hours] | Salt of Malic Acid pKa = 3.51 | Salt of Acetic Acid pKa = 4.76 | ||||
|---|---|---|---|---|---|---|
| Mn (g/mol) | Mw (g/mol) | Pd (Mw/n) | Mn (g/mol) | Mw (g/mol) | Pd (Mw/n) | |
| 0 | 45,300 | 114,100 | 2.52 | 44,200 | 114,200 | 2.58 |
| 24 | 43,800 | 111,800 | 2.55 | 43,900 | 113,000 | 2.57 |
| 48 | 43,800 | 108,100 | 2.47 | 43,600 | 110,900 | 2.54 |
| 72 | 42,100 | 106,200 | 2.52 | 43,300 | 110,900 | 2.56 |
| 96 | 41,400 | 103,100 | 2.49 | 42,900 | 109,500 | 2.55 |
| 120 | 40,700 | 100,500 | 2.47 | 42,600 | 108,500 | 2.55 |
| 144 | 40,800 | 100,000 | 2.45 | 41,900 | 108,000 | 2.58 |
| 168 | 39,650 | 97,000 | 2.45 | 41,800 | 107,800 | 2.58 |
| Degradation Time [Hours] | Salt of Formic Acid pKa = 3.75 | Salt of Lactic Acid pKa = 3.81 | ||||
| Mn (g/mol) | Mw (g/mol) | Pd (Mw/Mn) | Mn (g/mol) | Mw (g/mol) | Pd (Mw/Mn) | |
| 0 | 44,600 | 119,200 | 2.67 | 48,500 | 114,400 | 2.36 |
| 24 | 44,800 | 117,000 | 2.61 | 46,900 | 110,000 | 2.35 |
| 48 | 43,900 | 116,000 | 2.64 | 45,800 | 108,100 | 2.36 |
| 72 | 41,900 | 114,500 | 2.73 | 44,800 | 105,500 | 2.35 |
| 96 | 41,400 | 113,400 | 2.74 | 44,100 | 101,400 | 2.30 |
| 120 | 43,000 | 112,600 | 2.62 | 43,700 | 101,800 | 2.33 |
| 144 | 41,700 | 111,600 | 2.68 | 44,100 | 100,300 | 2.27 |
| 168 | 41,700 | 110,000 | 2.64 | 42,900 | 99,000 | 2.31 |
| Acid | pKa | Angular Coefficient Figure 6 | Errors for the Angular Coefficients | R2 |
|---|---|---|---|---|
| Malic acid | 3.51 | −101.49 | 5.05 | 0.99 |
| Formic acid | 3.75 | −50.94 | 2.52 | 0.99 |
| Lactic acid | 3.81 | −88.94 | 9.51 | 0.94 |
| Acetic acid | 4.76 | −38.89 | 3.74 | 0.95 |
| Acid | pKa | Angular Coefficient Figure 7 | Errors for the Angular Coefficients | R2 |
|---|---|---|---|---|
| Malic acid | 3.51 | −32.02 | 2.98 | 0.95 |
| Formic acid | 3.75 | −19.35 | 5.61 | 0.66 |
| Lactic acid | 3.81 | −29.86 | 4.23 | 0.89 |
| Acetic acid | 4.76 | −14.98 | 0.77 | 0.98 |
| Acid | pKa | k/M (1/h) | Errors for k/M | R2 |
|---|---|---|---|---|
| Malic acid | 3.51 | 11.72 × 10⁻⁹ | 5.61 × 10⁻¹⁰ | 0.98 |
| Formic acid | 3.75 | 3.78 × 10⁻⁹ | 1.30 × 10⁻¹⁰ | 0.99 |
| Lactic acid | 3.81 | 4.01 × 10⁻⁹ | 1.06 × 10⁻¹⁰ | 0.99 |
| Acetic acid | 4.76 | 3.27 × 10⁻⁹ | 0.75 × 10⁻¹⁰ | 0.99 |
| Acid | pKa | k/M (1/h) | Errors for k/M | R2 |
|---|---|---|---|---|
| Malic acid | 3.51 | 19.26 × 10⁻⁹ | 8.51 × 10⁻¹⁰ | 0.99 |
| Formic acid | 3.75 | 9.19 × 10⁻⁹ | 4.71 × 10⁻¹⁰ | 0.98 |
| Lactic acid | 3.81 | 17.55 × 10⁻⁹ | 1.24 × 10⁻⁹ | 0.96 |
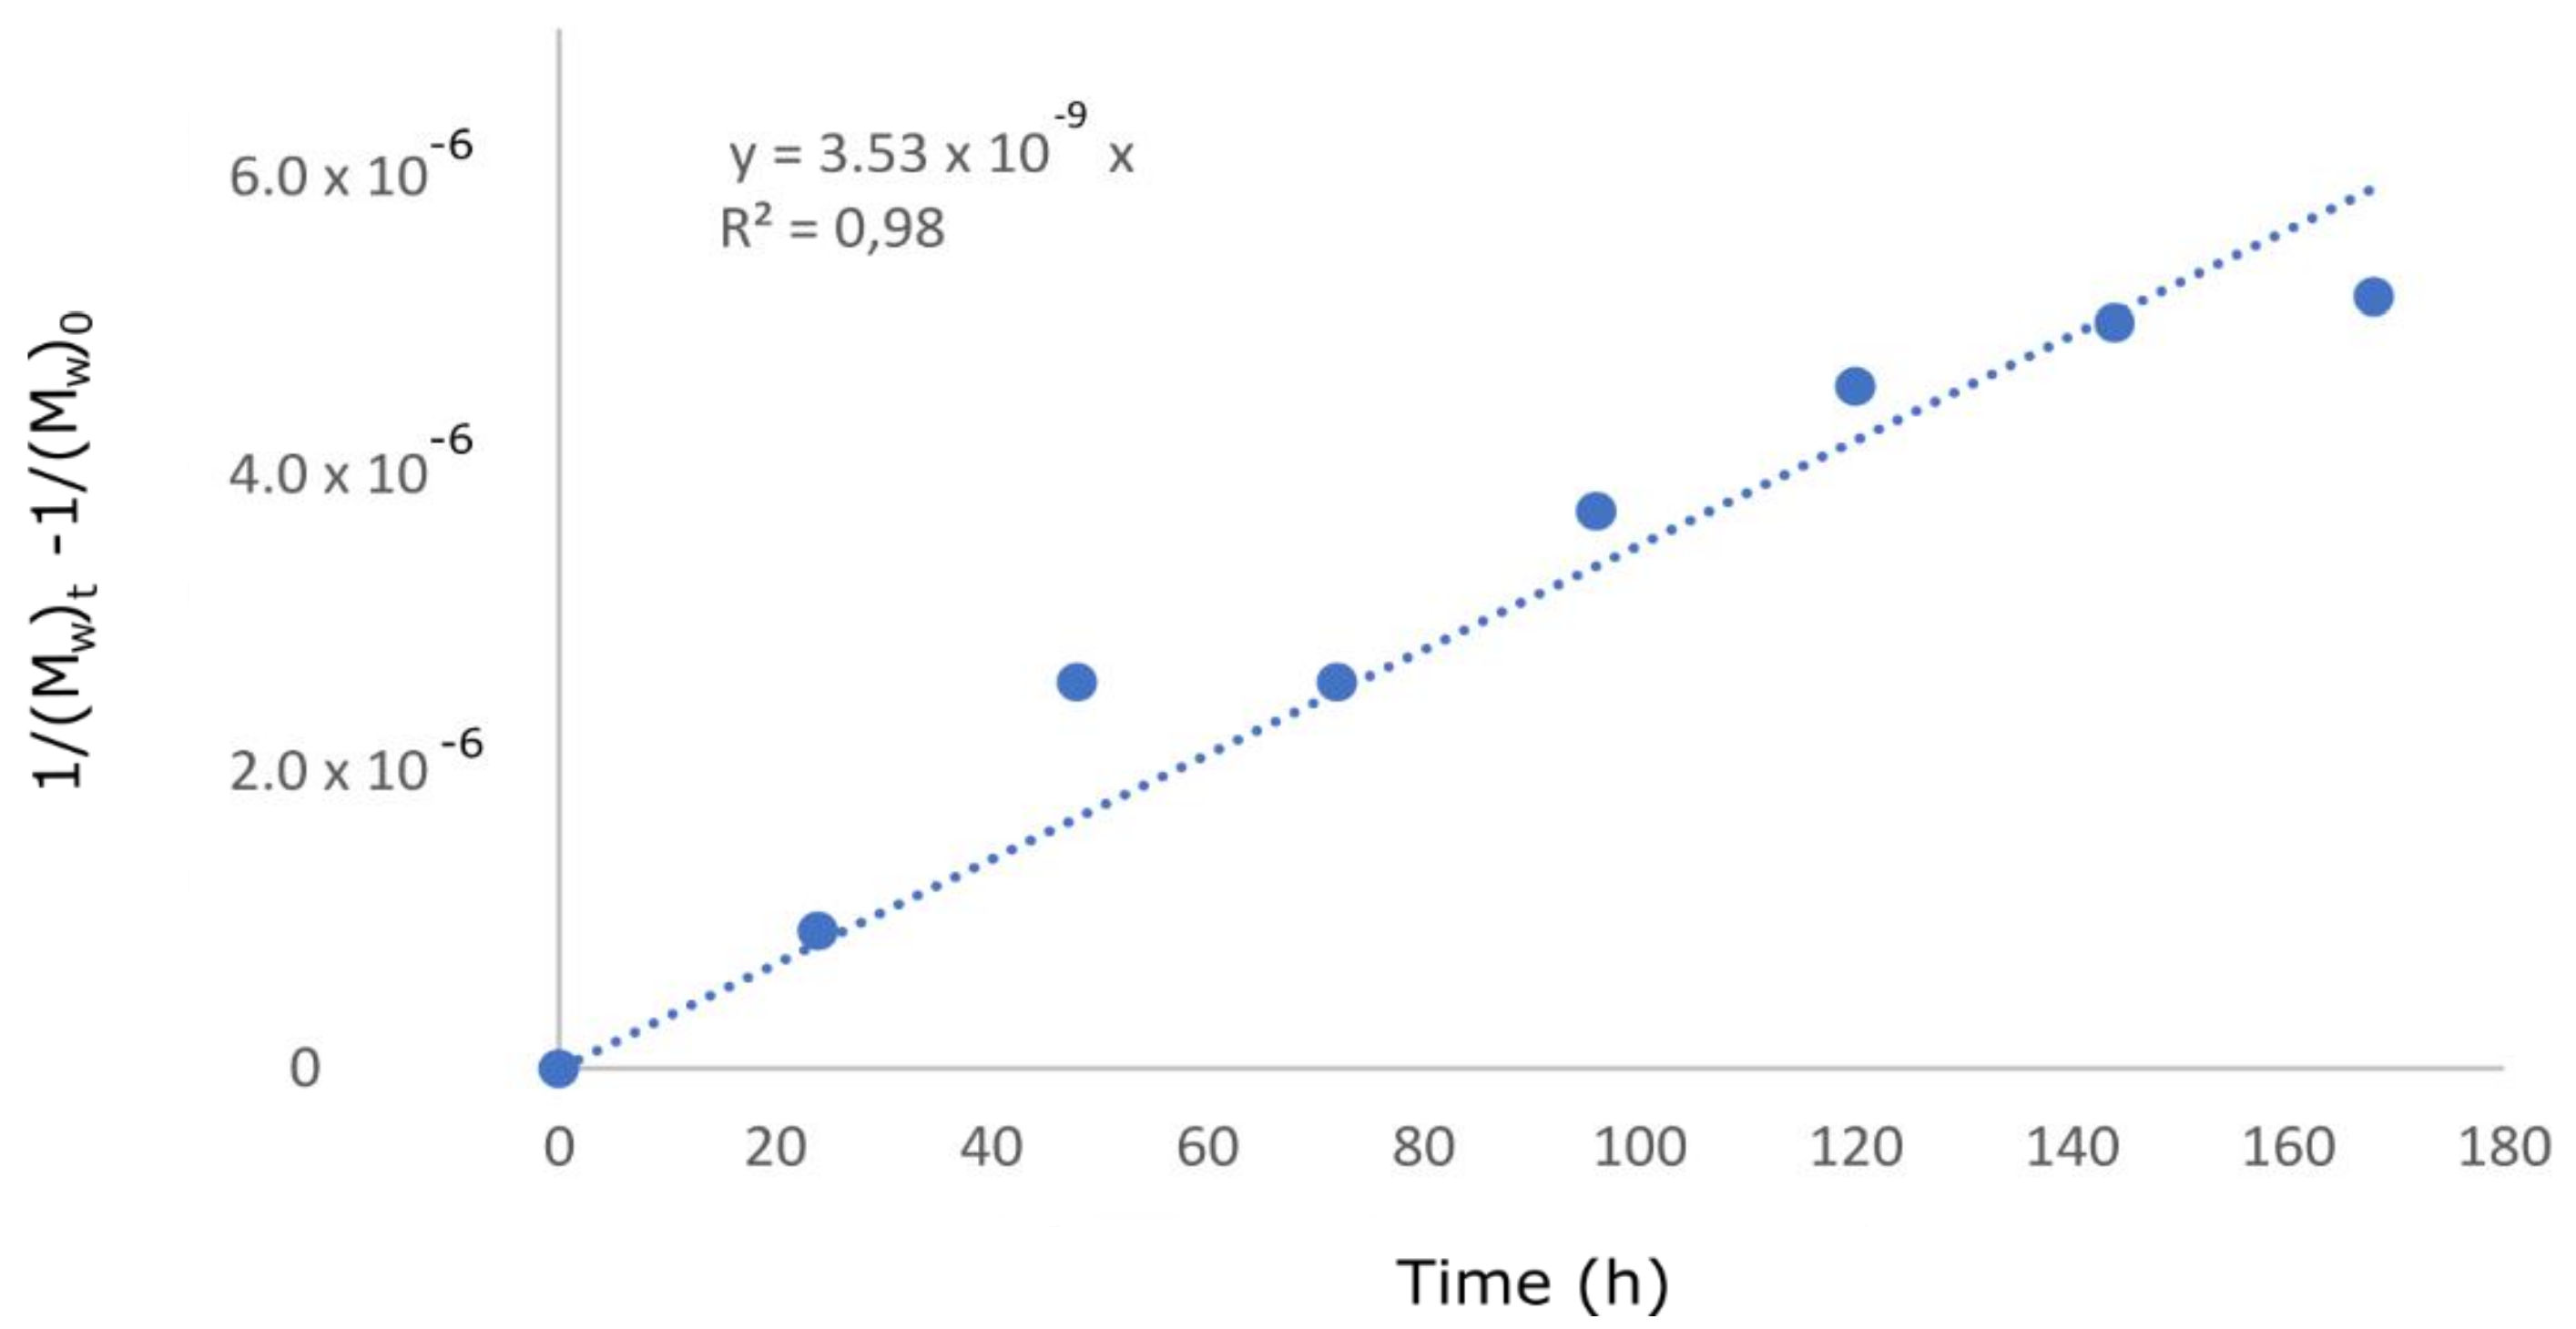
| Acetic acid | 4.76 | 7.66 × 10⁻⁹ | 2.57 × 10⁻¹⁰ | 0.99 |
| Acid | pKa | k/M (1/h) | Errors for k/M | R2 |
|---|---|---|---|---|
| Malic acid | 3.51 | 9.23 × 10⁻⁹ | 1.93 × 10⁻¹⁰ | 0.99 |
| Formic acid | 3.75 | 4.22 × 10⁻⁹ | 1.17 × 10⁻¹⁰ | 0.99 |
| Lactic acid | 3.81 | 9.04 × 10⁻⁹ | 4.71 × 10⁻¹⁰ | 0.98 |
| Acetic acid | 4.76 | 3.53 × 10⁻⁹ | 1.71 × 10⁻¹⁰ | 0.98 |
| Sample Name | Degree of Deacetylation (%) | |
|---|---|---|
| 0 h | 168 h | |
| Acetic acid | 72.2 | 72.9 |
| Lactic acid | 72.9 | 71.6 |
| Formic acid | 72.2 | 72.2 |
| Malic acid | 72.2 | 71.1 |
Publisher’s Note: MDPI stays neutral with regard to jurisdictional claims in published maps and institutional affiliations. |
© 2021 by the authors. Licensee MDPI, Basel, Switzerland. This article is an open access article distributed under the terms and conditions of the Creative Commons Attribution (CC BY) license (https://creativecommons.org/licenses/by/4.0/).
Share and Cite
Sikorski, D.; Gzyra-Jagieła, K.; Draczyński, Z. The Kinetics of Chitosan Degradation in Organic Acid Solutions. Mar. Drugs 2021, 19, 236. https://doi.org/10.3390/md19050236
Sikorski D, Gzyra-Jagieła K, Draczyński Z. The Kinetics of Chitosan Degradation in Organic Acid Solutions. Marine Drugs. 2021; 19(5):236. https://doi.org/10.3390/md19050236
Chicago/Turabian StyleSikorski, Dominik, Karolina Gzyra-Jagieła, and Zbigniew Draczyński. 2021. "The Kinetics of Chitosan Degradation in Organic Acid Solutions" Marine Drugs 19, no. 5: 236. https://doi.org/10.3390/md19050236
APA StyleSikorski, D., Gzyra-Jagieła, K., & Draczyński, Z. (2021). The Kinetics of Chitosan Degradation in Organic Acid Solutions. Marine Drugs, 19(5), 236. https://doi.org/10.3390/md19050236