Abstract
Conotoxins are short, cysteine-rich peptides of great interest as novel therapeutic leads and of great concern as lethal biological agents due to their high affinity and specificity for various receptors involved in neuromuscular transmission. Currently, of the approximately 6000 known conotoxin sequences, only about 3% have associated structural characterization, which leads to a bottleneck in rapid high-throughput screening (HTS) for identification of potential leads or threats. In this work, we combine a graph-based approach with homology modeling to expand the library of conotoxin structures and to identify those conotoxin sequences that are of the greatest value for experimental structural characterization. The latter would allow for the rapid expansion of the known structural space for generating high quality template-based models. Our approach generalizes to other evolutionarily-related, short, cysteine-rich venoms of interest. Overall, we present and validate an approach for venom structure modeling and experimental guidance and employ it to produce a 290%-larger library of approximate conotoxin structures for HTS. We also provide a set of ranked conotoxin sequences for experimental structure determination to further expand this library.
1. Introduction
Toxins have for a long time been considered a rich natural source of therapeutic leads because of their high specificity and binding affinity for various receptors involved in different biological pathways [1,2]. The drug ziconotide, for example, is a potent analgesic derived from a toxin produced by the aquatic cone snail species Conus magus [3]. The on-average smaller size of toxins–typically <100 amino acids along with a sizeable proportion <30 amino acids long [4]—means they can be employed with relative ease in in silico high-throughput screening (HTS) to rationally identify candidates for initial scaffolds interacting with a particular receptor of interest. Although traditional HTS has focused largely on small molecules, the dwindling rate at which such drugs come to market has led to a need to search for other spaces in which to identify ligands for binding with receptors of interest. Natural products, in general, are expected to be a good source of potential therapeutic candidates, and the computational advancements in various HTS strategies make it possible to apply approaches such as docking to more than just small molecules [5,6,7]. Short toxins in particular are of interest because of their pre-existing strong affinities for protein receptors, and software has been developed for in silico screening of them [8]. In one recent study of note, for example, the authors employed a docking approach to identify -conotoxin BuIA, produced by species Conus bullatus, as a competitive agonist for the lysophosphatidic acid receptor 6, a G-protein coupled receptor involved in the development of several cancers [9]. Aside from their therapeutic value, toxins such as these also pose a threat to biosecurity. Rapid advances in synthetic biology have created challenges in determining the health risks posed by natural toxins or modified toxins with even higher pathogenicity [10]. Thus, in tandem with HTS for therapeutic design, it is necessary to simultaneously perform HTS for threat identification. However, HTS approaches for any application are limited by the necessity of possessing a library of at least low-resolution structures of potential toxin candidates: more structures mean a larger search space and hence a higher likelihood of identifying good initial leads [11]. Thus, structural characterization stands as a rate-limiting step for HTS for both therapeutic design and toxin threat characterization, as identified sequences often far outnumber determined structures. Indeed, only about 3% of sequences isolated from cone snail venom have corresponding experimentally-determined structures [12].
If the structures of proteins could be rapidly predicted strictly from their sequences, structural determination would not be a bottleneck; however, structure prediction from sequence still remains a challenging proposition [13]. Ab initio or de novo modeling approaches for obtaining protein structure predictions by modeling essential folding physics are prohibitively expensive except for small proteins of about 20–62 residues in size [14,15,16,17]. Even for proteins short enough to be de novo modeled in isolation, such techniques can become expensive if a large number of different structures are desired. Structure prediction for a query sequence becomes more tractable when experimentally-resolved structures are available for evolutionarily related sequences: this is referred to as homology modeling [18]. For typical proteins (at least 100 amino acids long), a useful rule of thumb for building a homology model of a protein with unknown structure using a structurally characterized protein as the template is that both proteins should share at least 25% sequence identity [19,20]; however, this does not apply to shorter peptides, since the shorter the peptide, the more likely a sequence identity of 25% is to have arisen due to random chance [21,22]. To apply the homology modeling framework for shorter peptides, a reasonable heuristic instead becomes that the alignment length and percent identity fall above the phenomenological curve introduced by Rost [23] (see Equation (1) and Appendix A Figure A1). The relative steepness of the Rost curve for alignment lengths of less than fifty amino acids provides an illustration of why, for peptides of such lengths, it is important to use the actual functional form, rather than a static cutoff, to assess whether a pairwise alignment contains sufficient information for homology modeling.
In this article, we employ a simple sequence graph-based algorithm for homology modeling of related toxin sequences and use the resultant graph to suggest a set of sequences of interest for experimental structural characterization. Network or graph theory is, broadly speaking, the study of the ways in which different types of objects may be related to one another [24]. In essence, the basis of such approaches is to consider a set of related objects as nodes in a graph and the relationships between them as edges between those nodes. This is a versatile framework of thinking that has been profitably employed in diverse domains in the biological sciences [25,26]: e.g., biological systems modeling, in which nodes may be, for example, proteins, and edges may be chemical reactions [27,28]; elucidating allosteric pathways in proteins, in which nodes can be defined as residues, and edges as inter-residue distances [29]; antibody design, in which nodes may be glycans and edges may be the inverses of the spatial distance between them such that gaps in the network represent likely locations for antibodies to dock on a glycosylated protein [30]; or biased sampling of cluster formation, in which the nodes may be particles and edges may be physical contact between them [31]. Thus, for large datasets, network analysis techniques can help wean out salient global attributes from an otherwise confounding plethora of features. Because of the subject’s long history, casting biological problems in the form of a graph allows for the immediate application of well-verified techniques.
Since sequences of proteins may be related in many different ways, including simple amino acid identity and evolutionary relationships, it is no surprise that graph theory has a long and storied history of usage for sequence-grouping tasks such as homology detection [32], structure prediction [33,34,35], protein family identification [36,37], and even direct homology modeling [35]. For large heterogeneous databases, it can be challenging to identify homologs and a number of sophisticated algorithms have been developed for such purposes; we instead focus on the problem of homology modeling a set of cysteine-rich toxins known to be evolutionarily related. In our approach, we employ the number and placement of cysteines within a sequence as a rough initial estimate of functional and structural relatedness.
In the following sections, we present our graph-based approach and employ it to construct sequence graphs and identify good libraries of templates for homology modeling. We demonstrate that, despite the known relationship between the conotoxins, these libraries improve outcomes for structure homology modeling over using a 25% flat cutoff (plus 5% padding). We use our sequence graphs to construct a set of tables indicating sequences in which experimental structural characterization is predicted to be most valuable in creating a broad structure library by using homology modeling. Finally, we employ the graphs and libraries as part of a homology modeling procedure that results in a library of low-resolution structures for the conotoxins that will be of use in future high-throughput studies.
2. Results
We initialize the algorithm (see Figure 1 for a schematic illustration of the procedure) by separating a set of over 2000 known conotoxin sequences into databases containing four, six, eight, and ten cysteines, respectively. For each database, we construct graphs of sequences (cf. Figure 2) in which an edge between two nodes (i.e., sequences) represents a pairwise alignment that is of sufficient length and percent identity to fall into the safe homology modeling zone above the Rost curve (cf. Equation (1) and Figure A1). Some portions of the sequences have known structures, such that the corresponding nodes are annotated with the relevant PDB ID(s). We employ the graphs thus generated to iteratively add nodes with structures to a library of templates for homology modeling. We term this set of sequences , the set of existing structural library templates. Nodes are added to in a greedy manner, in order of highest node degree, such that the resulting library will contain enough templates to homology model the maximum number of non-structurally-characterized sequences possible but with minimal sequence overlap and retaining a number of non-library structures for quality assessment. Since this is approximately the vertex-covering problem of a graph, we cannot find a globally optimal solution, as that problem is NP-complete [38]. We halt the procedure once either we have no further nodes with structures to add or there are no remaining sequences in a given connected component of the graph that are not connected to at least one library template sequence, such that all sequences in that component may be structurally characterized by homology modeling. We refer to the set of sequences that may be homology modeled based on set as set that are covered by . We next perform a similar procedure—but without the constraint of structure annotation—on the nodes absent to identify the sets that are of interest for experimental structural characterization such that they cover the remaining set . Note that it is possible for nodes to belong to both and , and indeed, a small number do.
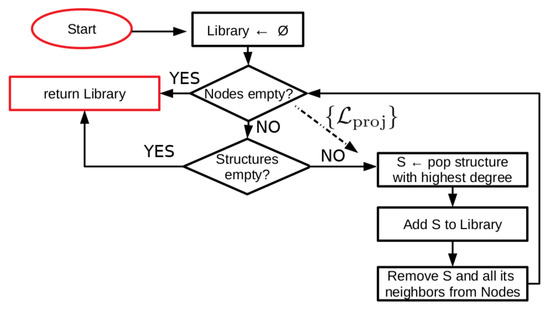
Figure 1.
Schematic of a simple graph-based algorithm for constructing a library of structural templates for homology modeling. For each connected component in the graph of sequences, where an edge represents the ability to homology model one sequence based on another, we employ a greedy approach to find a good library of template structures that cover as much of the sequence space as possible. For computation of the sequence set of interest for experimental characterization, we skip consideration of the structures and run the algorithm on the subset with structure-associated sequences removed.
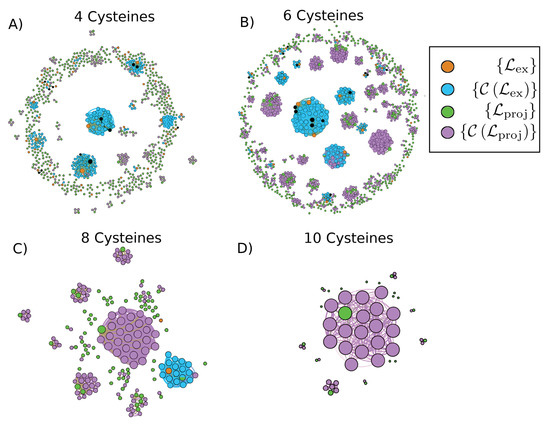
Figure 2.
Graph of conotoxins containing (A) four cysteines, (B) six cysteines, (C) eight cysteines, and (D) ten cysteines where nodes are sequences and edges exist between sequences with pairwise alignments that have high enough length and percent identity to fall above the Rost curve with (Equation (1)). We show the set of sequences added to the template libraries in orange, the set of sequences corresponding to unselected structures in black, the set of covered sequences that we homology model based on the templates included in the library in blue, and the set of projected sequences in green in which structures are in need of characterization in order that the rest of the sequences in magenta may be homology modeled based on some template. Nodes belonging to both and are displayed as half green, half blue. The sizes of the nodes correspond to their degree; that is, the number of other sequences that they can be modeled based on or used to model. Node locations and edge lengths were chosen for ease of visualization of separate connected components. Visualization of the graphs was produced with Gephi 0.9.2 [39].
In Figure 2, we present the sequence graphs for sets of conotoxin sequences with four, six, eight, and ten cysteines, respectively. We specifically display (in green), the experimental structural characterization of which would lead to coverage by homology modeling of the set (in magenta) that comprises sequences with no characterized structure and not covered by set . We also show the set (in orange), which we employ to predict structures for the set (in blue) by homology modeling. In Figure A2, we present the same sequence graphs, but we color the nodes by relative sequence length instead of set occupation. A significant proportion of isolated sequences (nodes with no connections that therefore cannot be homology modeled) are relatively short (cf. the ring of small red nodes in Figure A2A and to a lesser extent in Figure A2B), which demonstrates that a high proportion of isolated nodes may be characterized well through rapid ab initio modeling rather than needing full experimental characterization, particularly for the four and six cysteine sequences.
These figures are a graphical illustration of the sequence space of conotoxins that may be used as a guide to experiment or to produce low-resolution structures for initial HTS. Specifically, out of the 801 sequences with four cysteines, 61 (7.6% of total) currently have experimentally-resolved structures. The graph-based approach selected 49 (6.1% of total) of these structures as comprising the four cysteine template library (set ; blue circles in Figure 2A, while the 12 unselected structures are represented in black), which allowed for homology modeling of 143 (17.9% of total) sequences (set ; orange circles in Figure 2A). This corresponds to an increase of over 230% (143/61) for the number of structures employable for HTS over the original 61. The graph-based approach indicated that seven sequences from (hybrid green/blue circles in the graph) and a further 74 sequences (81 overall—10.1% of total) would need to be characterized experimentally to allow for homology modeling of the remaining 151 (18.9% of total). Of the 453 sequences assigned to , 372 (82.1%) are isolated nodes with no edges; of these, 298 (80.1%) are shorter than 20 amino acids, and 353 (94.9%) are shorter than 30 amino acids in length and thus many of this remainder may be rapidly modeled using ab initio techniques.
For conotoxins with six cysteines (cf. Figure 2B), 44 (4.0% of total) out of the 1113 sequences currently have experimentally-resolved structures. The graph-based approach selected 30 (2.7% of total) of these structures as comprising the six cysteine template library, which allowed for homology modeling of 148 (13.3% of total) sequences. This corresponds to an increase of over 330% (148/44) for the number of structures employable for HTS over the original 44. The graph-based approach indicated that seven sequences from and a further 180 sequences (187 overall–16.8% of total) would need to be characterized experimentally to allow for homology modeling of the remaining 509 (45.7% of total). Of the 419 sequences assigned to , 239 (57.0%) are isolated nodes; of these, 86 (36.0%) are shorter than 20 amino acids, and 163 (68.2%) are shorter than 30 amino acids in length.
For conotoxins with eight cysteines (cf. Figure 2C), 2 (1.1% of total) out of the 190 sequences currently have experimentally-resolved structures. These two structures were selected as comprising the entire template library here, which allowed for homology modeling of a 17 (8.9% of total) sequences. This corresponds to an increase of 850% (17/2) for the number of structures employable for HTS over the original two. The graph-based approach indicated that one sequence from and a further 29 (30 overall—15.8% of total) would need to be characterized experimentally to allow for homology modeling of the remaining 101 (53.1% of total). Of the 71 sequences assigned to sequences, 41 (57.7%) are isolated nodes, but of these, only 5 (12.2%) are shorter than 30 amino acids in length, leaving a good proportion that would likely require experimental characterization to solve their structures. Finally, there are no known structures corresponding to ten cysteine sequences so there is no current coverage (cf. Figure 2D). The graph-based approach indicated that a further 9 of the total 53 sequences (17.0%) would have to be characterized to allow for homology modeling of the remaining 34 (64.2%). Of the 19 sequences assigned to (52.6%), 10 are isolated nodes, and of these, none are shorter than 30 amino acids in length.
For characterization of the remaining structures, focusing efforts on the nodes of the highest degree in the graphs is disproportionately rewarding, since a greater degree in the graph corresponds to the ability to cover a greater number of sequences. In Table 1, Table 2, Table 3 and Table 4, we present and rank the set of conotoxins that are of greatest interest for experimental characterization, as availability of experimental structures for these sequences (belonging to set ) would allow homology modeling of the remainder of the sequences (belonging to set ). Thus, we suggest that experimental structural resolution begin with those sequences listed at the top of their respective tables and work downwards in order to most rapidly and efficiently structurally characterize the sequence space of the conotoxins.

Table 1.
List of sequences containing four cysteines in order of interest for experimental characterization, based on the degree (sequence coverage) in alignment graphs (cf. Figure 2). Name or names of sequences are taken from the Conoserver database [40]. Multiple names for the same sequence indicate the same sequence is produced by different species or has different post-translational modifications. Node degree corresponds to the number of sequences with pairwise alignments that are long enough and have high enough percent identity to be homology modeled with the given sequence as a template. Cysteines are highlighted in red to guide the eye. We note in the fourth column the pharmacological family, although it is unknown for the majority of sequences, as it requires a separate experimental determination in most cases.
Table 2.
List of sequences containing six cysteines in order of interest for experimental characterization, based on the degree (sequence coverage) in alignment graphs (cf. Figure 2). Name or names of sequences are taken from the Conoserver database [40]. Multiple names for the same sequence indicate the same sequence is produced by different species or has different post-translational modifications. Node degree corresponds to the number of sequences with pairwise alignments that are long enough and have a high enough percent identity to be homology modeled with the given sequence as a template. Cysteines are highlighted in red to guide the eye. We note in the fourth column the pharmacological family, although it is unknown for the majority of sequences, as it requires a separate experimental determination in most cases.
Table 3.
List of sequences containing eight cysteines in order of interest for experimental characterization, based on the degree (sequence coverage) in alignment graphs (cf. Figure 2). Name or names of sequences are taken from the Conoserver database [40]. Multiple names for the same sequence indicate the same sequence is produced by different species or has different post-translational modifications. Node degree corresponds to the number of sequences with pairwise alignments that are long enough and have a high enough percent identity to be homology modeled with the given sequence as a template. Cysteines are highlighted in red to guide the eye. We note in the fourth column the pharmacological family, although it is unknown for the majority of sequences, as it requires a separate experimental determination in most cases.
Table 4.
List of sequences containing ten cysteines in order of interest for experimental characterization, based on the degree (sequence coverage) in alignment graphs (cf. Figure 2). Name or names of sequences are taken from the Conoserver database [40]. Multiple names for the same sequence indicate the same sequence is produced by different species or has different post-translational modifications. Node degree corresponds to the number of sequences with pairwise alignments that are long enough and have a high enough percent identity to be homology modeled with the given sequence as a template. Cysteines are highlighted in red to guide the eye. We note in the fourth column the pharmacological family, although it is unknown for the majority of sequences, as it requires a separate experimental determination in most cases.
In Figure 3, we assess the quality of the template libraries (Table A1, Table A2 and Table A3) constructed using the graph-based approach employing the Rost cutoff, and compared with a set of template libraries based on a static 25% rule-of-thumb cutoff. We perform two assessments: an “in-library” assessment, and an “out-of-library” assessment. In the in-library assessment (Figure 3A,B), we construct homology models for each structure in the library using the rest of the library as potential templates and compute the backbone root-mean-square deviation (RMSD) between each modeled structure and the corresponding experimental structure. Compared to the static cutoff, the Rost cutoff produces modeled structures with lower RMSD: the mean RMSD employing the Rost cutoff has a downwards shift from Å to Å for the four cysteine library and from Å to Å for the six cysteine library. In the out-of-library assessment (Figure 3C,D), we construct homology models for the known structures that were not employed as part of the template libraries (Figure 2, black nodes), and compute the backbone RMSD between each modeled structure and the corresponding experimental structure. The mean RMSD has a downward shift from Å to Å for the four cysteine library and from Å to Å for the six cysteine library. The relatively low RMSD for the in-library assessment demonstrates that the template libraries cover a substantial proportion of the known sequence space, while the relatively low RMSD for the out-of-library assessment demonstrates the utility of the homology-modeled structures as part of HTS [41]. Despite the known relationships among the toxins, there is a statistically significant improvement (downwards shift in the distribution, two-tailed Kolmogorov–Smirnov test with ) for both in- and out-of-library structures when using the Rost cutoff as compared to the 25% cutoff.
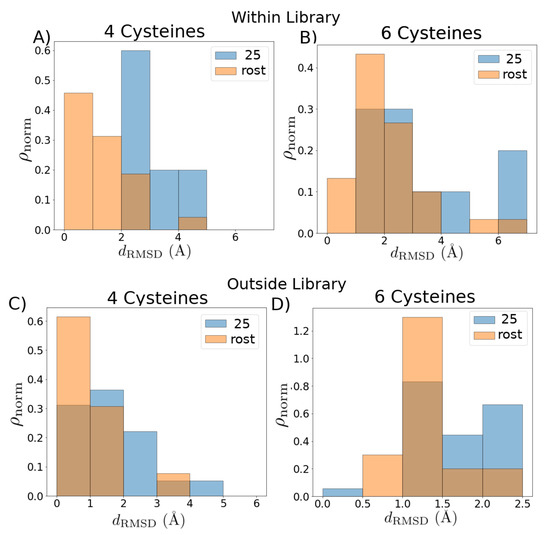
Figure 3.
Quality of graph-based template library selection criteria. Comparison of root-mean-square deviation (RMSD) distributions from experimental structures for (A,B) structures within the libraries, with each structure modeled by selecting from all other templates within the given library (“in-library” assessment), and (C,D) structures outside the libraries modeled by selecting from all templates within the given library (“out-of-library” assessment). For each homology modeled structure, we choose the best fit to the experiment. The distributions produced by the simple 25% cutoff libraries are shown in blue; the distributions produced by using the graph-based algorithm are shown in orange. Distributionis are transparent for ease of viewing.
Finally, in Supporting File “finalmodels.zip”, we attach the set of structures computed by homology modeling (see Figure 4 for a schematic of the procedure), corresponding to sequences in the set , with the four, six, and eight cysteine library structures used as templates. Because we divided the sequences into subsets based on the number of cysteines in a sequence, we are able to use the cysteines aligned as an additional criterion during the homology modeling procedure. The average PROCHECK G-factor, which is a log-odds score based on the likelihood of observing the given distributions of - and - angles in proteins, is for the reported four cysteine models, for the reported six cysteine models, and for the report eight cysteine models. Since this score is not a relative measure and values above are generally considered acceptable, this provides evidence that the structures we have computed are physically reasonable. We further assess the quality of the homology modeling protocol by using it to model each structure in the library with templates selected from other structures in that library. The distribution of root-mean-square deviation (RMSD) values of the top three models based on our ranking criteria (see Materials and Methods for details) compared with each experimental structure is shown in Figure 5A,B. We see that our method performs well [41]: the average RMSD in the four cysteine architecture is Å with at least 80% of the models having less than 3 Å RMSD, and the average RMSD in the six cysteine architecture is Å with 75% of the models having less than 3 Å RMSD. Most of the higher RMSD values are contributed by the flexible loops and coils. When we look at the RMSD distribution after rejecting those atoms that cannot be structurally aligned, as in case of loops and coils, the distributions improve significantly (Figure A3), with a mean of Å for the four cysteine architecture and a mean of Å for the six cysteine architecture, with 100% of the models for both archtiectures having less than 3.5 Å deviations. A second test for validating our method was performed by checking the distribution of native contacts in the modeled structures (Figure 5C,D). Two pairs of residues were defined to have a native contact if the distance between the C atoms in the native experimental structure was less than 8 Å, and the pair was at least four residues apart (C – C ). At least 60% of the native structures were captured in our models, with the distribution means of % and % for the four and six cysteine architectures, respectively.
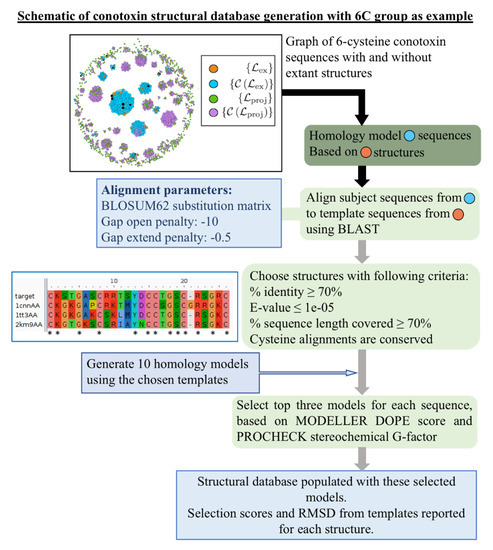
Figure 4.
Schematic of procedure for producing homology modeled structures from library templates for conotoxin sequences with unknown structure lying in the set . We employ a BLAST alignment procedure and specifically force the cysteines to align to further refine the templates that were originally chosen for inclusion using the graph-based Rost criterion. Graph inset of the eight cysteine graph is an example. The inset consisting of an example alignment input figure was created using the alignment obtained from BLAST [42] and visualized with Aliview [43].
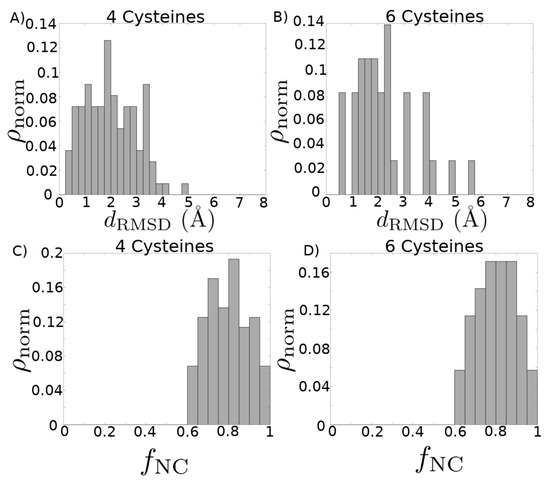
Figure 5.
Quality of modeling criteria. (A,B) Distribution of root-mean-square deviation (RMSD) for homology models compared with their corresponding experimental structures, without prior removal of any structural alignment outliers. Each experimental structure present in the library was modeled by selecting from all other templates in the library. The top three models for each structure based on combined MODELLER DOPE and PROCHECK G-FACTOR scores are considered here. (A) Distribution mean = 2.00 Å, standard deviation = 0.97 Å. (B) Distribution mean = 2.25 Å, standard deviation = 1.20 Å. (C,D) Distribution of fraction of native contacts present in each of the homology modeled structures, with respect to the experimental structure. Each experimental structure present in the library was modeled by selecting from all other templates in the library. The top three models for each structure based on combined MODELLER DOPE and PROCHECK G-FACTOR scores are considered here. (C) Distribution mean = 0.797, standard deviation = 0.108. (D) Distribution mean = 0.805, standard deviation = 0.097.
3. Discussion
By employing a conceptually simple heuristic approach that may also be used for analysis of other short, disulfide-rich, evolutionarily-related peptides, we have constructed a set of sequence graphs that allowed us to rank non-isolated sequences without corresponding characterized structures in an order that would allow for the most rapid expansion of the conotoxin structure library. We constructed template libraries for homology modeling of conotoxins based on the number of cysteines contained in the sequence. We demonstrated that libraries constructed to account for the shorter lengths of the conotoxins produce homology models that are more accurate than libraries constructed with a static 25% cutoff. Currently, sufficient information is not available to homology model any sequences containing more than eight cysteines, as experimental characterization has focused preferentially on the shorter conotoxins. We employed our libraries to predict a set of structures from sequence using homology modeling, allowing us to expand the library of conotoxin structures usable for HTS by about 290% overall, although a number of sequences remain without any associated structural predictions. We assessed the quality of these structures through standard techniques to demonstrate they are expected to be reasonably accurate and therefore may be employed for high-throughput screening of conotoxins as novel therapeutics for new receptor targets. We note that of those sequences that were isolated in our graphs—that is, had no edges—80% of those containing four cysteines and 36% of those containing six cysteines were under 20 amino acids long, marking them as good candidates for a high-throughput ab initio modeling procedure, rather than necessarily for experimental characterization, as they will likely be tractable but will not contain any information about other sequences.
For experimentalists interested in investigating the conotoxins we suggest in the table, we note that the preponderance of peptide structures that we employed for the structure libraries were determined with solution nuclear magnetic resonance (NMR). Maintenance of the tertiary fold of conopeptides, particularly after their secretion into the extracellular environment, depends more on its disulfide bonds and less on the presence of a hydrophobic core [44]. As such, compression artifacts on the free/unbound structures of these disulfide-rich peptides can arise due to crystal packing forces in X-ray studies, which has been observed in the literature [45]. It was also shown recently that solution NMR structures of disulfide-rich peptides based primarily on nuclear Overhauser effects (NOEs) are comparable to a crystallographic resolution of around 2.5 Å, while refinement with residual dipolar couplings (RDCs) can improve this to around 1–1.5 Åresolution [46]. Solution NMR studies, therefore, in addition to providing ensembles that inform on the conformational dynamics, can yield highly appropriate and cost-effective structures compared to those obtained from X-ray or cryo-EM [47].
One important point about short, disulfide-rich peptides that we have not addressed in this work is the existence of so-called “disulfide isomers.” Under certain environmental conditions, there is experimental evidence suggesting that some toxins do not exist as a single set of “native” structures but as a heterogeneous—perhaps metastable—ensemble populated with strikingly different conformations corresponding to differing patterns of cysteine connectivity [48]. Although many conotoxins do have a single thermodynamically stable native state as dictated by their sequence similarity, [49,50] or can be stabilized in one through the use of dicarba or diselenide bonds [51,52], these disulfide isomers, if kinetically or thermodynamically controlled, may be employed to expand the library of structures for HTS. This represents an important area of future work.
Although we do not directly address the question of structure–function relationships in this work, the graph-based method does suggest an interesting route forward. It has been shown that in addition to strict structural contributions, conotoxin binding is also heavily related to surface electrostatics [53], and, indeed, this concept was formalized (as “Protein Surface Topography”) and employed by Kasheverov et al. [54] to design stronger-binding -conotoxin mutants. Another intriguing line of further study, therefore, might be to construct a graph on the basis of the Protein Surface Topography similarities for those structures we have modeled in this work and compare and contrast between that and sequence similarity.
4. Materials and Methods
4.1. Data Acquisition and Curation
For use in construction of the template libraries, we employed a set of 142 conotoxin structures downloaded from the PDB [55], which we found by searching “conotoxin” on the PDB. We manually removed several false positives, such as a crystal structure of the acetylcholine-binding protein that was identified due to the title of the associated paper. We also manually removed several sequences that were identical to natural conotoxin sequences but modified by the replacement of disulfide bonds with dicarba bonds. We did not remove redundant sequences consisting of multiple characterization methods and, in a few cases, structural isomers resulting from different disulfide-bond connections. In future, further work will be done to properly assess the likelihood of multiple stable or metastable states, but we do not address this consideration further here.
For use in the analysis detailed in this article, we downloaded a set of 6255 peptide sequences from the Conoserver [40] using the “Tools > Download Conoserver’s Data” command. We retained only sequences containing four, six, eight, or ten cysteines. We removed anything with the word “precursor” or “patent” in the name, as precursor sequences contain, in addition to the mature peptide sequence that folds into the toxin, a signal sequence and N- and C-terminal pro-regions that are cleaved in the endoplasmic reticulum and Golgi apparatus [56]. A manual inspection of sequences labeled “patent” revealed that many were insufficiently characterized—for example, they noted only the cysteine pattern or they mixed precursor and mature toxin sequences with no indication. We also added to the sequence list any sequence that corresponded to one of the PDB structures that was not already contained in the list. Once the set of all sequences was finalized, we split it into four subsets corresponding to the number of cysteines contained. In the end we retained for analysis a total of 801 unique sequences containing four cysteines, 1113 unique sequences containing six cysteines, 190 unique sequences containing eight cysteines, and 53 unique sequences containing ten cysteines.
4.2. Details of Library Template Selection Procedure
For each subset of sequences corresponding to a different number of contained cysteines, we created an alignment graph as follows. For every sequence, we computed a pairwise alignment with every other sequence, using the “PairwiseAligner” class in the “Align” module of the Biopython package [57], in global mode, with a gap-open penalty of -10 and a gap-extend penalty of −0.5. Employing the networkx Python package [58], we constructed a graph in which nodes represented sequences and we placed an edge between two nodes whenever the percent identity of the highest-percentage pairwise alignment of the two corresponding sequences was greater than [23],
where L is the length of the alignment in numbers of amino acid residues and we set (%).
We constructed two different template libraries for each subset of sequences, one from the pairwise alignment graph and one from a static 25%-identity cutoff (with %). When creating the graph-based libraries (see also Figure 1), we first identified all connected components in the graph. For each connected component, we chose first the sequence with the highest node degree (number of distinct edges) that corresponded to a structure in the set of 142 structures downloaded from the PDB, added it to the library, and removed that sequence and all sequences it shared an edge with from the graph. We continued this procedure until one of two criteria was satisfied: (i) there were no longer any sequences in the connected component with corresponding structures or (ii) there were no longer any sequences in the connected component without corresponding structures. These criteria corresponded to the following two situations, respectively: (i) there were no other structures available for inclusion in the library or (ii) the entire connected component was able to be homology modeled based on the structures included in the library up until that point. For construction of the static sequence-identity cutoff library, sequences within each data set were clustered and a representative sequence from each cluster chosen by using the “sequence_db.filter” command of MODELLER version 9.20 (UCSF, San Francisco, CA, USA) [59,60], which groups sequences together if their sequence identity is greater than a specified cutoff value. The set of cluster representatives became a library of structures in which between any pair the sequence identity was less than the specified cutoff value.
For computation of the homology modeled structures based on the library templates that were used to assess and compare the quality of the two libraries, we used the “align2d” command followed by the “automodel” procedure from MODELLER 9.20 with default parameters. We computed five models for each sequence from each template (except for itself, in the case of library structures being modeled based on other library structures). The best homology model was chosen as the one with the lowest backbone RMSD to the known or experimentally-resolved structure, using the “align” command in PyMOL [61] that superimposes two structures via a structure superposition that is constrained by a prior sequence alignment.
4.3. Homology Modeling Criteria
After assessing the quality of the template libraries, we used them to construct via homology modeling a database of structures for those conotoxin sequences (set shown in blue in Figure 2 and Figure A2) that are covered by those libraries (set given in orange in Figure 2 and Figure A2). The pipeline employed for building these homology-modeled structures is detailed here. A schematic of this pipeline is given in Figure 4. The four cysteine (4C) subset included 143 such sequences for which structures were computed by homology modeling from 49 library structure templates, while the six cysteine (6C) subset included 148 sequences for which structures were computed by homology modeling from 30 library structure templates. There was only one existing non-isolated library structure template having eight cysteine (8C) architecture, and 17 sequences were modeled from it, while no ten cysteine (10C) structures could be modeled, since to date there are no structures of conotoxins containing 10 cysteines deposited in the PDB.
Alignment of each of the subject sequences was performed with those sequences that have a structure present in the template library using BLAST [42]. BLOSUM62 substitution matrix [62] was used with a gap-open penalty of −10 and a gap-extend penalty of −0.5. For each sequence, structures were considered possible templates if they fulfilled the following criteria: (i) sequence identity of ≥70%; (ii) % of sequence length covered; (iii) E-value . Additionally, we constrained the cysteines in the sequence to be aligned in the following manner. If there was a one-position shift in the sequence alignment that would allow the cysteines to align, the gap penalties at that position were removed to enforce cysteine alignment. If a greater than one-position shift would be required to allow the cysteines to align, such a template was not considered.
Structural homology modeling was performed using the MODELLER version 9.20 package [59,60]. Multiple templates were used to aid in the modeling process for those subjects where more than one sequence satisfied the above-mentioned criteria. The models were further relaxed by several steps of conjugate gradients and molecular dynamics with simulated annealing as recommended in the thorough Variable Target Function Method (VTFM) optimization of MODELLER [63]. Due to the alignment of cysteines from the template structures, the disulfide bonds could be constrained by patches. Ten such models were generated for each subject sequence. Subjects 107 and 110 from 4C architecture and subject 2 from 6C architecture did not correspond to any templates that satisfied all of our above criteria. Nevertheless, we modeled these sequences based on the best sequence match.
We selected three top models for each subject based on the Discrete Optimized Protein Energy (DOPE) score [64] and the PROCHECK G-factor [65]. DOPE, a typical criterion for assessing the quality of a modeled structure, is an atomistic distance-dependent statistical potential calculated from a large set of refined high resolution PDB structures. The PROCHECK G-factor is a log-odds score based on observed distributions of the -, and - values measuring whether the model is physically reasonable or if it contains unusual stereochemical configurations. In this study, we normalized the DOPE and G-factor scores and used a combined product of probabilities to rank and sort the structures. The top three models selected for each subject are reported in Supplementary File “finalmodels.zip”, along with their DOPE, G-factor, MODELLER optimization function value (molpdf), GA341 scores [66], and the Ramachandran plots for each of these models. All RMSD calculations were performed with Pymol [61]. There is only one available non-isolated structure in the 8C extant library. This was used to model all 17 subject sequences. The best three models for each sequence along with their assessment scores are reported in the database.
4.4. Quantification and Statistical Analysis
We use the Kolmogorov–Smirnov two-tailed test as implemented in the SciPy package [67] and referred to by the “ks2samp” command to assess whether we may reject the null hypothesis of the RMSDs of experimental structures from homology models based on different template libraries being drawn from the same distribution. We employ a significance level of , meaning that we reject the null hypothesis if the KS statistic D returned by the test is such that , where for a significance level of , and n and m are the number of samples in each set, respectively. The analysis is referred to in Section 2.
5. Conclusions
Overall, the work in this article presents a rational graph-based algorithm that we employ to expand the repertoire of known conotoxin structures for application in a high-throughput manner as part of the early stages of drug design. We expect that the libraries, the expanded set of structures, and the ranking of sequences in terms of the degree of connectedness to other sequences will be valuable resources improving the prospects of conotoxins as novel therapeutic leads and that our approach may be employed for initial characterization of other sets of evolutionarily-related toxins.
Supplementary Materials
The following are available online at https://www.mdpi.com/1660-3397/18/5/256/s1.
Author Contributions
Conceptualization, R.A.M., S.C., T.T., and S.G.; methodology, R.A.M., S.C., T.T., and S.G.; software, R.A.M., S.C., and T.T.; formal analysis, R.A.M., S.C. and T.T.; investigation, R.A.M., S.C. and T.T.; writing—original draft, R.A.M.; writing—review and editing, R.A.M., S.C., T.T., and S.G.; visualization, R.A.M. and S.C.; supervision, S.G.; project administration, S.G.; funding acquisition, S.G. All authors have read and agreed to the published version of the manuscript.
Funding
T.T. and S.G. were supported by the Functional Genomic and Computational Assessment of Threats (Fun-GCAT) program of the Intelligence Advanced Research Projects Activity (IARPA) agency within the Office of the Director of National Intelligence. S.C. and T.T. were also partially supported by the Center for Nonlinear Sciences (CNLS) at LANL. R.A.M. gratefully acknowledges a Los Alamos National Laboratory Director’s Postdoctoral Fellowship. Triad National Security, LLC (Los Alamos, NM, USA) operator of the Los Alamos National Laboratory under Contract No. 89233218CNA000001 with the U.S. Department of Energy.
Acknowledgments
We thank Will Fischer for valuable discussions. This research used resources provided by the Los Alamos National Laboratory Institutional Computing Program, which is supported by the U.S. Department of Energy National Nuclear Security Administration under Contract No. 89233218CNA000001. The views and conclusions contained herein are those of the authors, and should not be interpreted as necessarily representing the official policies or endorsements, either expressed or implied, of the Office of the Director of National Intelligence (ODNI), Intelligence Advanced Research Projects Agency (IARPA), Los Alamos National Laboratory (LANL), Department of Energy (DOE), or the US Government.
Conflicts of Interest
The authors declare no conflict of interest.
Appendix A
We provide tables of the template libraries for homology modeling and three supplementary figures. Structures used as template libraries are provided in the supplementary data folder “libraries.zip”. Homology modeled structures of conotoxins are provided in the supplementary data folder “finalmodels.zip”, along with their scores and the associated Ramachandran plots. Python, MODELLER, and Bash analysis scripts for preparation, graph construction, and further analysis will be provided upon request.

Figure A1.
Rost’s phenomenological curve (Equation (1)) of minimum percentage identity for homology modeling as a function of pairwise alignment length with padding as employed in this work. As the length of the alignment decreases, the minimum percent identity for homology modeling increases, and there is a particularly rapid increase below alignments of about 25 amino acids, where a fairly large proportion of toxins reside.

Figure A2.
Graph of conotoxins containing (A) four cysteines, (B) six cysteines, (C) eight cysteines, and (D) ten cysteines where nodes are sequences and edges exist between sequences with pairwise alignments that have a high enough length and percent identity to fall above the Rost curve with (Equation (1)). Colors show the relative sequence lengths of each node, but the color scale of each graph is independent of the others. The sizes of the nodes correspond to their degree; that is, the number of other sequences that they can be modeled based on or used to model. Node locations and edge lengths were chosen for ease of visualization of separate connected components. Visualization of the graphs was produced with Gephi 0.9.2 [39].
Table A1.
List of conotoxins with corresponding PDB structure IDs [55] comprising the 4C library. Name or names of sequences are taken from the Conoserver database [40]. Multiple names for the same sequence indicate the same sequence is produced by different species or has different post-translational modifications.
| Name(s) | PDB ID | Sequence |
|---|---|---|
| EpI [sTy15>Y], EpI | 1a0m | GCCSDPRCNMNNPDYC |
| PnIB, PnIB [sTy15Y] | 1akg | GCCSLPPCALSNPDYC |
| CnIA | 1b45 | GRCCHPACGKYYSC |
| AuIB, Ac-AuIB, AuIB [ribbon isoform] | 1mxp | GCCSYPPCFATNPDC |
| ImI [R11E] | 1e74 | GCCSDPRCAWEC |
| ImI [R7L] | 1e75 | GCCSDPLCAWRC |
| ImI [D5N] | 1e76 | GCCSNPRCAWRC |
| TIA | 2lr9 | FNWRCCLIPACRRNHKKFC |
| MrIB, MrIB C-term amidated | 1ieo | VGVCCGYKLCHPC |
| EI | 1k64 | RDPCCYHPTCNMSNPQIC |
| GID, GID*, GID*-NH2, GID*[O16P] | 1mtq | IRDECCSNPACRVNNPHVC |
| SI | 1hje | ICCNPACGPKYSC |
| TXIX | 1wct | ECCEDGWCCXAAP |
| GI | 1xga | ECCNPACGRHYSC |
| Conkunitzin-S1 | 1y62 | RPSLCDLPADSGSGTKAEKRIYYNSARKQ-CLRFDYTGQGGNENNFRRTYDCQRTCL |
| PIA, PIA [R1ADMA] | 1zlc | RDPCCSNPVCTVHNPQIC |
| cMII-6 | 2ajw | GCCSNPVCHLEHSNLCGGAAGG |
| PlXIVA | 2fqc | FPRPRICNLACRAGIGHKYPFCHCR |
| GI (SER12)-benzoylphenylalanine | 2fr9 | ECCNPACGRHYYC |
| GI (ASN4)-benzoylphenylalanine | 2frb | ECCYPACGRHYSC |
| OmIA | 2gcz | GCCSHPACNVNNPHICG |
| BuIA, BuIA[P6O], BuIA[P7O] | 2ns3 | GCCSTPPCAVLYC |
| ImI [P6A] | 2ifi | GCCSDARCAWRC |
| ImI [P6K], ImI [P6K] deamidated | 2ifj | GCCSDKRCAWRC |
| ImI, ImI [C2U,C8U], ImI [C2U,C3U,C8U,C12U], ImI deamidated, A c-ImI, ImI [A9S], ImI [C3U,C12U], ImI [P60], ImI [P6APro], ImI [P6A(S)Pro], ImI [P6guaPro], ImI [P6betPro], ImI [P6fluoPro], ImI [P6fluo(S)Pro], ImI [P6phiPro], ImI [P6phi(S)Pro], ImI [P6benzPro], ImI [P6naphPro], ImI [P6phi(3S)Pro], ImI [P6phi(5R)Pro] | 2bypF | GCCSDPRCAWRC |
| CMrVIA [K6P], CMrVIA [K6P] amidated | 2ih7 | VCCGYPLCHPC |
| CMrVIA, CMrVIA amidated | 2b5p | VCCGYKLCHPC |
| Cyclic MrIA | 2j15 | NGVCCGYKLCHPCAG |
| RgIA [P6V] | 2juq | GCCSDVRCRYRCR |
| RgIA [D5E] | 2jur | GCCSEPRCRYRCR |
| RgIA [Y10W] | 2jus | GCCSDPRCRWRCR |
| RgIA | 2jut | GCCSDPRCRYRCR |
| Pc16a | 2ler | SCSCKRNFLCC |
| Midi | 2lu6 | CNCSRWARDHSRCC |
| TxIB | 2lz5 | GCCSDPPCRNKHPDLC |
| Li1.12, TxID | 2m3i | GCCSHPVCSAMSPIC |
| Ar1248 | 2m62 | GVCCGVSFCYPC |
| Lo1a | 2md6 | EGCCSNPACRTNHPEVCD |
| LvIA | 5xgl | GCCSHPACNVDHPEIC |
| Exendin-4/conotoxin chimera (Ex-4[1-27]/pl14a) | 2naw | HGEGTFTSDLSKQMEEEAVRC-FIECLKGIGHKYPFCHCR |
| Bt1.8 | 2nay | GCCSNPACILNNPNQC |
| TXIA(A10L) | 2uz6 | GCCSRPPCILNNPDLC |
| CnVA | 3zkt | ECCHRQLLCCLRFV |
| Cyclic Vc1.1 | 4ttl | GCCSDPRCNYDHPEICGGAAGG |
| GIC | 1ul2 | GCCSHPACAGNNQHIC |
| PeIA, Bt1.4, PeIA[P6O], PeIA[P13O] | 5jmeF | GCCSHPACSVNHPELC |
| Pn10.1 | 5t6v | STCCGYRMCVPC |
| LsIA, LsIA# | 5t90F | SGCCSNPACRVNNPNIC |
| VilXIVA | 6efe | GGLGRCIYNCMNSGGGLSFIQCKTMCY |
Table A2.
List of conotoxins with corresponding PDB structure IDS [55] comprising the 6C library. Name or names of sequences are taken from the Conoserver database [40]. Multiple names for the same sequence indicate the same sequence is produced by different species or has different post-translational modifications.
| Name(s) | PDB ID | Sequence |
|---|---|---|
| conotoxin-GS | 1ag7 | ACSGRGSRCPPQCCMGLRCGRGNPQKCIGAHEDV |
| PIIIE, PIIIE [K9S], PIIIE [S17Y,S18N,S20L] | 1jlo | HPPCCLYGKCRRYPGCSSASCCQR |
| MVIIC, S6.6 | 1omn | CKGKGAPCRKTMYDCCSGSCGRRGKC |
| TVIIA | 1eyo | SCSGRDSRCPPVCCMGLMCSRGKCVSIYGE |
| TxVII | 1f3k | CKQADEPCDVFSLDCCTGICLGVCMW |
| TxVIA | 1fu3 | WCKQSGEMCNLLDQNCCDGYCIVLVCT |
| EVIA | 1g1z | DDCIKPYGFCSLPILKNGLCCSGACVGVCADL |
| GIIIB | 1gib | RDCCTPPRKCKDRRCKPMKCCA |
| GVIA | 1ttl | CKSPGSSCSPTSYNCCRSCNPYTKRCY |
| PIVA | 1p1p | GCCGSYPNAACHPCSCKDRPSYCGQ |
| EIVA | 1pqr | GCCGPYPNAACHPCGCKVGRPPYCDRPSGG |
| PIIIA | 1r9i | QRLCCGFPKSCRSRQCKPHRCC |
| MVIIA[R10K] | 1tt3 | CKGKGAKCSKLMYDCCTGSCRSGKC |
| Am2766 | 1yz2 | CKQAGESCDIFSQNCCVGTCAFICIE |
| MrIIIE | 2efz | VCCPFGGCHELCYCCD |
| FVIA | 2km9 | CKGTGKSCSRIAYNCCTGSCRSGKC |
| Im23a, Mr23a | 2lmz | IPYCGQTGAECYSWCIKQDLSKDWCCDFVKDIRMNPPADKCP |
| BuIIIB | 2lo9 | VGERCCKNGKRGCGRWCRDHSRCC |
| KIIIA, KIIA [W8dTrp] | 2lxg | CCNCSSKWCRDHSRCC |
| Ar1446 | 2m61 | CCRLACGLGCHPCC |
| cGm9a | 2mso | SCNNSCQSHSDCASHCICTFRGCGAVNGLP |
| cBru9a | 2msq | SCGGSCFGGCWPGCSCYARTCFRDGLP |
| Mo3964 | 2mw7 | DGECGDKDEPCCGRPDGAKVCNDPWVCILTSSRCENP |
| MfVIA | 2n7f | RDCQEKWEYCIVPILGFVYCCPGLICGPFVCV |
| cyclic PVIIA | 2n8e | CRIPNQKCFQHLDDCCSRKCNRFNKCVLPETGGG |
| conotoxin-muOxi-GVIIJ | 2n8h | GWCGDPGATCGKLRLYCCSGFCDSYTKTCKDKSSA |
| CnIIIC | 2yen | QGCCNGPKGCSSKWCRDHARCC |
| CcTx | 4b1qP | APWLVPSQITTCCGYNPGTMCPSCMCTNTC |
| Reg12i | 6bx9 | CCTALCSRYHCLPCC |
| MoVIB | 6ceg | CKPPGSKCSPSMRDCCTTCISYTKRCRKYY |
Table A3.
List of conotoxins with corresponding PDB structure IDS [55] comprising the 8C library. Name or names of sequences are taken from the Conoserver database [40]. Multiple names for the same sequence indicate the same sequence is produced by different species or has different post-translational modifications.
| Name(s) | PDB ID | Sequence |
|---|---|---|
| G11.1 | 6cei | CAVTHEKCSDDYDCCGSLCCVGICAKTIAPCK |
| RXIA, RXIA[Btr33>W] | 2p4l | GPSFCKADEKPCEYHADCCNCCLSGICAPSTNWILPGCSTSSFFKI |

Figure A3.
Distribution of root-mean-square deviation (RMSD) for homology models compared with their corresponding experimental structures, after refinement involving the rejection of structural alignment outliers. Each experimental structure present in the library was modeled by selecting from all other templates in the library. The top three models for each structure based on combined MODELLER DOPE and PROCHECK G-FACTOR scores are considered here. (A) Distribution mean = 1.55 Å, standard deviation = 0.92 Å. (B) Distribution mean = 1.17 Å, standard deviation = 0.67 Å.
References
- Zambelli, V.; Pasqualoto, K.; Picolo, G.; Chudzinski-Tavassi, A.; Cury, Y. Harnessing the knowledge of animal toxins to generate drugs. Pharmacol. Res. 2016, 112, 30–36. [Google Scholar] [CrossRef] [PubMed]
- Verdes, A.; Anand, P.; Gorson, J.; Jannetti, S.; Kelly, P.; Leffler, A.; Simpson, D.; Ramrattan, G.; Holford, M.; Verdes, A.; et al. From Mollusks to Medicine: A Venomics Approach for the Discovery and Characterization of Therapeutics from Terebridae Peptide Toxins. Toxins 2016, 8, 117. [Google Scholar] [CrossRef] [PubMed]
- Miljanich, G. Ziconotide: Neuronal Calcium Channel Blocker for Treating Severe Chronic Pain. Curr. Med. Chem. 2004, 11, 3029–3040. [Google Scholar] [CrossRef] [PubMed]
- Dang, B. Chemical synthesis and structure determination of venom toxins. Chin. Chem. Lett. 2019, 30, 1369–1373. [Google Scholar] [CrossRef]
- Romano, J.D.; Tatonetti, N.P. Informatics and Computational Methods in Natural Product Drug Discovery: A Review and Perspectives. Front. Genet. 2019, 10, 368. [Google Scholar] [CrossRef]
- Lee, A.C.L.; Harris, J.L.; Khanna, K.K.; Hong, J.H. A comprehensive review on current advances in peptide drug development and design. Int. J. Mol. Sci. 2019, 20, 2383. [Google Scholar] [CrossRef]
- Ciemny, M.; Kurcinski, M.; Kamel, K.; Kolinski, A.; Alam, N.; Schueler-Furman, O.; Kmiecik, S. Protein–peptide docking: Opportunities and challenges. Drug Discov. Today 2018, 23, 1530–1537. [Google Scholar] [CrossRef]
- Leffler, A.E.; Kuryatov, A.; Zebroski, H.A.; Powell, S.R.; Filipenko, P.; Hussein, A.K.; Gorson, J.; Heizmann, A.; Lyskov, S.; Tsien, R.W.; et al. Discovery of peptide ligands through docking and virtual screening at nicotinic acetylcholine receptor homology models. Proc. Natl. Acad. Sci. USA 2017, 114, E8100–E8109. [Google Scholar] [CrossRef]
- Younis, S.; Rashid, S. Alpha conotoxin-BuIA globular isomer is a competitive antagonist for oleoyl-L-alpha-lysophosphatidic acid binding to LPAR6; A molecular dynamics study. PLoS ONE 2017, 12, e0189154. [Google Scholar] [CrossRef]
- Gomez-Tatay, L.; Hernandez-Andreu, J.M. Biosafety and biosecurity in Synthetic Biology: A review. Crit. Rev. Env. Sci. Tec. 2019, 49, 1587–1621. [Google Scholar] [CrossRef]
- Śledź, P.; Caflisch, A. Protein structure-based drug design: From docking to molecular dynamics. Curr. Opin. Struc. Biol. 2018, 48, 93–102. [Google Scholar] [CrossRef] [PubMed]
- Mansbach, R.A.; Travers, T.; McMahon, B.H.; Fair, J.M.; Gnanakaran, S. Snails In Silico: A Review of Computational Studies on the Conopeptides. Mar. Drugs 2019, 17, 145. [Google Scholar] [CrossRef] [PubMed]
- Huang, P.S.; Boyken, S.E.; Baker, D. The coming of age of de novo protein design. Nature 2016, 537, 320–327. [Google Scholar] [CrossRef]
- Pitera, J.W.; Swope, W. Understanding folding and design: Replica-exchange simulations of “Trp-cage” miniproteins. Proc. Natl. Acad. Sci. USA 2003, 100, 7587–7592. [Google Scholar] [CrossRef] [PubMed]
- Ensign, D.L.; Kasson, P.M.; Pande, V.S. Heterogeneity Even at the Speed Limit of Folding: Large-scale Molecular Dynamics Study of a Fast-folding Variant of the Villin Headpiece. J. Mol. Biol. 2007, 374, 806–816. [Google Scholar] [CrossRef]
- Voelz, V.A.; Bowman, G.R.; Beauchamp, K.; Pande, V.S. Molecular Simulation of ab Initio Protein Folding for a Millisecond Folder. J. Am. Chem. Soc. 2010, 132, 1526–1528. [Google Scholar] [CrossRef]
- Sborgi, L.; Verma, A.; Piana, S.; Lindorff-Larsen, K.; Cerminara, M.; Santiveri, C.M.; Shaw, D.E.; de Alba, E.; Muñoz, V. Interaction Networks in Protein Folding via Atomic-Resolution Experiments and Long-Time-Scale Molecular Dynamics Simulations. J. Am. Chem. Soc. 2015, 137, 6506–6516. [Google Scholar] [CrossRef]
- Dill, K.A.; MacCallum, J.L. The protein-folding problem, 50 years on. Science 2012, 338, 1042–1046. [Google Scholar] [CrossRef]
- Baker, D.; Sali, A. Protein structure prediction and structural genomics. Science 2001, 294, 93–96. [Google Scholar] [CrossRef]
- Xiang, Z. Advances in Homology Protein Structure Modeling. Curr. Protein Pept. Sci. 2006, 7, 217–227. [Google Scholar] [CrossRef]
- Krieger, E.; Nabuurs, S.B.; Vriend, G. Homology modeling. Methods Biochem. Anal. 2003, 44, 509–524. [Google Scholar] [PubMed]
- Kong, L.; Lee, B.T.K.; Tong, J.C.; Tan, T.W.; Ranganathan, S. SDPMOD: An automated comparative modeling server for small disulfide-bonded proteins. Nucleic Acids Res. 2004, 32, W356–W359. [Google Scholar] [CrossRef] [PubMed][Green Version]
- Rost, B. Twilight zone of protein sequence alignments. Protein Eng. Des. Sel. 1999, 12, 85–94. [Google Scholar] [CrossRef] [PubMed]
- Van Steen, M. Graph Theory and Complex Networks—An Introduction; van Steen, Maarten: Lexington, KY, USA, 2010; Volume 144. [Google Scholar]
- Green, S.; Şerban, M.; Scholl, R.; Jones, N.; Brigandt, I.; Bechtel, W. Network analyses in systems biology: New strategies for dealing with biological complexity. Synthese 2018, 195, 1751–1777. [Google Scholar] [CrossRef]
- Pavlopoulos, G.A.; Secrier, M.; Moschopoulos, C.N.; Soldatos, T.G.; Kossida, S.; Aerts, J.; Schneider, R.; Bagos, P.G. Using graph theory to analyze biological networks. BioData Min. 2011, 4, 10. [Google Scholar] [CrossRef]
- Morel, P.A.; Lee, R.E.; Faeder, J.R. Demystifying the cytokine network: Mathematical models point the way. Cytokine 2017, 98, 115–123. [Google Scholar] [CrossRef]
- Aburatani, S.; Kokabu, Y.; Teshima, R.; Ogawa, T.; Araki, M.; Shiarai, T. Application of Graph Theory to Evaluate Chemical Reactions in Cells. J. Phys. Conf. Ser. 2019, 1391, 012047. [Google Scholar] [CrossRef]
- Sethi, A.; Tian, J.; Derdeyn, C.A.; Korber, B.; Gnanakaran, S. A mechanistic understanding of allosteric immune escape pathways in the HIV-1 envelope glycoprotein. PLoS Comput. Biol. 2013, 9, e1003046. [Google Scholar] [CrossRef]
- Chakraborty, S.; Berndsen, Z.T.; Hengartner, N.W.; Korber, B.T.; Ward, A.B.; Gnanakaran, S. A Network-based approach for Quantifying the Resilience and Vulnerability of HIV-1 Native Glycan Shield. bioRxiv Preprint 2019. bioRxiv:10.1101/856071. [Google Scholar]
- Long, A.W.; Ferguson, A.L. Rational design of patchy colloids via landscape engineering. Mol. Syst. Des. Eng. 2018, 3, 49–65. [Google Scholar] [CrossRef]
- Santiago, C.; Pereira, V.; Digiampietri, L. Homology Detection Using Multilayer Maximum Clustering Coefficient. J. Comput. Biol. 2018, 25, 1328–1338. [Google Scholar] [CrossRef] [PubMed]
- Bolten, E.; Schliep, A.; Schneckener, S.; Schomburg, D.; Schrader, R. Clustering protein sequences–structure prediction by transitive homology. Bioinformatics 2001, 17, 935–941. [Google Scholar] [CrossRef] [PubMed]
- Pipenbacher, P.; Schliep, A.; Schneckener, S.; Schonhuth, A.; Schomburg, D.; Schrader, R. ProClust: Improved clustering of protein sequences with an extended graph-based approach. Bioinformatics 2002, 18, S182–S191. [Google Scholar] [CrossRef] [PubMed]
- Yan, Y.; Zhang, S.; Wu, F.X. Applications of graph theory in protein structure identification. Proteome Sci. 2011, 9, S17. [Google Scholar] [CrossRef] [PubMed]
- Abascal, F.; Valencia, A. Clustering of proximal sequence space for the identification of protein families. Bioinformatics 2002, 18, 908–921. [Google Scholar] [CrossRef]
- Enright, A.J.; Ouzounis, C.A. GeneRAGE: A robust algorithm for sequence clustering and domain detection. Bioinformatics 2000, 16, 451–457. [Google Scholar] [CrossRef]
- Karp, R.M. Reducibility among Combinatorial Problems. In Complexity of Computer Computations: Proceedings of a Symposium on the Complexity of Computer Computations, Held March 20–22, 1972, at the IBM Thomas J. Watson Research Center, Yorktown Heights, New York, and Sponsored by the Office of Naval Research, Mathematics Program, IBM World Trade Corporation, and the IBM Research Mathematical Sciences Department; Miller, R.E., Thatcher, J.W., Bohlinger, J.D., Eds.; Springer: Boston, MA, USA, 1972; pp. 85–103. [Google Scholar] [CrossRef]
- Bastian, M.; Heymann, S.; Jacomy, M. Gephi: An open source software for exploring and manipulating networks. In Proceedings of the Third International AAAI Conference on Weblogs and Social Media, San Jose, CA, USA, 17–20 May 2009. [Google Scholar]
- Kaas, Q.; Yu, R.; Jin, A.H.; Dutertre, S.; Craik, D.J. ConoServer: Updated content, knowledge, and discovery tools in the conopeptide database. Nucleic Acids Res. 2012, 40, D325–D330. [Google Scholar] [CrossRef]
- Heo, L.; Feig, M. Experimental accuracy in protein structure refinement via molecular dynamics simulations. Proc. Natl. Acad. Sci. USA 2018, 115, 13276–13281. [Google Scholar] [CrossRef]
- Altschul, S.F.; Gish, W.; Miller, W.; Myers, E.W.; Lipman, D.J. Basic local alignment search tool. J. Mol. Biol. 1990, 215, 403–410. [Google Scholar] [CrossRef]
- Larsson, A. AliView: A fast and lightweight alignment viewer and editor for large data sets. Bioinformatics 2014, 30, 3276–3278. [Google Scholar] [CrossRef]
- Undheim, E.A.; Mobli, M.; King, G.F. Toxin structures as evolutionary tools: Using conserved 3D folds to study the evolution of rapidly evolving peptides. BioEssays 2016, 38, 539–548. [Google Scholar] [CrossRef] [PubMed]
- De Araujo, A.D.; Mobli, M.; Castro, J.; Harrington, A.M.; Vetter, I.; Dekan, Z.; Muttenthaler, M.; Wan, J.; Lewis, R.J.; King, G.F.; et al. Selenoether oxytocin analogues have analgesic properties in a mouse model of chronic abdominal pain. Nat. Commun. 2014, 5, 1–12. [Google Scholar] [CrossRef] [PubMed]
- Ramanujam, V.; Shen, Y.; Ying, J.; Mobli, M. Residual dipolar couplings for resolving cysteine bridges in disulfide-rich peptides. Front. Chem. 2020, 7, 889. [Google Scholar] [CrossRef] [PubMed]
- Williamson, M.P. Peptide structure determination by NMR. In Spectroscopic Methods and Analyses; Humana Press: Totowa, NJ, USA, 1993; pp. 69–85. [Google Scholar]
- Combelles, C.; Gracy, J.; Heitz, A.; Craik, D.J.; Chiche, L. Structure and folding of disulfide-rich miniproteins: Insights from molecular dynamics simulations and MM-PBSA free energy calculations. Proteins 2008, 73, 87–103. [Google Scholar] [CrossRef] [PubMed]
- Paul George, A.A.; Heimer, P.; Maaß, A.; Hamaekers, J.; Hofmann-Apitius, M.; Biswas, A.; Imhof, D. Insights into the Folding of Disulfide-Rich μ-Conotoxins. ACS Omega 2018, 3, 12330–12340. [Google Scholar] [CrossRef]
- Dutton, J.L.; Bansal, P.S.; Hogg, R.C.; Adams, D.J.; Alewood, P.F.; Craik, D.J. A new level of conotoxin diversity, a non-native disulfide bond connectivity in alpha-conotoxin AuIB reduces structural definition but increases biological activity. J. Biol. Chem. 2002, 277, 48849–48857. [Google Scholar] [CrossRef]
- Chhabra, S.; Belgi, A.; Bartels, P.; van Lierop, B.J.; Robinson, S.D.; Kompella, S.N.; Hung, A.; Callaghan, B.P.; Adams, D.J.; Robinson, A.J.; et al. Dicarba Analogues of α-Conotoxin RgIA. Structure, Stability, and Activity at Potential Pain Targets. J. Med. Chem. 2014, 57, 9933–9944. [Google Scholar] [CrossRef]
- Steiner, A.M.; Bulaj, G. Optimization of oxidative folding methods for cysteine-rich peptides: A study of conotoxins containing three disulfide bridges. J. Pept. Sci. 2011, 17, 1–7. [Google Scholar] [CrossRef]
- Akondi, K.B.; Muttenthaler, M.; Dutertre, S.; Kaas, Q.; Craik, D.J.; Lewis, R.J.; Alewood, P.F. Discovery, Synthesis, and Structure–Activity Relationships of Conotoxins. Chem. Rev. 2014, 114, 5815–5847. [Google Scholar] [CrossRef]
- Kasheverov, I.E.; Chugunov, A.O.; Kudryavtsev, D.S.; Ivanov, I.A.; Zhmak, M.N.; Shelukhina, I.V.; Spirova, E.N.; Tabakmakher, V.M.; Zelepuga, E.A.; Efremov, R.G.; et al. High-Affinity α-Conotoxin PnIA Analogs Designed on the Basis of the Protein Surface Topography Method. Sci. Rep. 2016, 6, 36848. [Google Scholar] [CrossRef]
- Berman, H.M.; Westbrook, J.; Feng, Z.; Gilliland, G.; Bhat, T.N.; Weissig, H.; Shindyalov, I.N.; Bourne, P.E. The Protein Data Bank. Nucleic Acids Res. 2000, 28, 235–242. [Google Scholar] [CrossRef] [PubMed]
- Kaas, Q.; Westermann, J.C.; Craik, D.J. Conopeptide characterization and classifications: An analysis using ConoServer. Toxicon 2010, 55, 1491–1509. [Google Scholar] [CrossRef] [PubMed]
- Cock, P.J.A.; Antao, T.; Chang, J.T.; Chapman, B.A.; Cox, C.J.; Dalke, A.; Friedberg, I.; Hamelryck, T.; Kauff, F.; Wilczynski, B.; et al. Biopython: Freely available Python tools for computational molecular biology and bioinformatics. Bioinformatics 2009, 25, 1422–1423. [Google Scholar] [CrossRef] [PubMed]
- Hagberg, A.A.; Schult, D.A.; Swart, P.J. Exploring network structure, dynamics, and function using NetworkX. In Proceedings of the 7th Python in Science Conference (SciPy2008), Pasadena, CA, USA, 19–24 August 2008. [Google Scholar]
- Sali, A.; Blundell, T.L. Comparative Protein Modelling by Satisfaction of Spatial Restraints. J. Mol. Biol. 1993, 234, 779–815. [Google Scholar] [CrossRef] [PubMed]
- Webb, B.; Sali, A. Comparative Protein Structure Modeling Using MODELLER. In Current Protocols in Bioinformatics; John Wiley & Sons, Inc.: Hoboken, NJ, USA, 2016; Volume 54, pp. 1–5. [Google Scholar] [CrossRef]
- Schrödinger LLC. The PyMOL Molecular Graphics System, Version 1.8; Technical Report; Schrödinger LLC: New York, NY, USA, 2015. [Google Scholar]
- Henikoff, S.; Henikoff, J.G. Amino acid substitution matrices from protein blocks. Proc. Natl. Acad. Sci. USA 1992, 89, 10915–10919. [Google Scholar] [CrossRef]
- Braun, W.; Go, N. Calculation of protein conformations by proton-proton distance constraints: A new efficient algorithm. J. Mol. Biol. 1985, 186, 611–626. [Google Scholar] [CrossRef]
- Shen, M.y.; Sali, A. Statistical potential for assessment and prediction of protein structures. Protein Sci. 2006, 15, 2507–2524. [Google Scholar] [CrossRef]
- Laskowski, R.A.; MacArthur, M.W.; Moss, D.S.; Thornton, J.M.; IUCr. PROCHECK: A program to check the stereochemical quality of protein structures. J. Appl. Crystallogr. 1993, 26, 283–291. [Google Scholar] [CrossRef]
- John, B.; Sali, A. Comparative protein structure modeling by iterative alignment, model building and model assessment. Nucleic Acids Res. 2003, 31, 3982–3992. [Google Scholar] [CrossRef]
- Oliphant, T.E. Python for Scientific Computing. Comput. Sci. Eng. 2007, 9, 10–20. [Google Scholar] [CrossRef]
© 2020 by the authors. Licensee MDPI, Basel, Switzerland. This article is an open access article distributed under the terms and conditions of the Creative Commons Attribution (CC BY) license (http://creativecommons.org/licenses/by/4.0/).