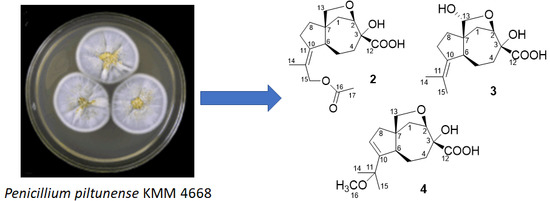
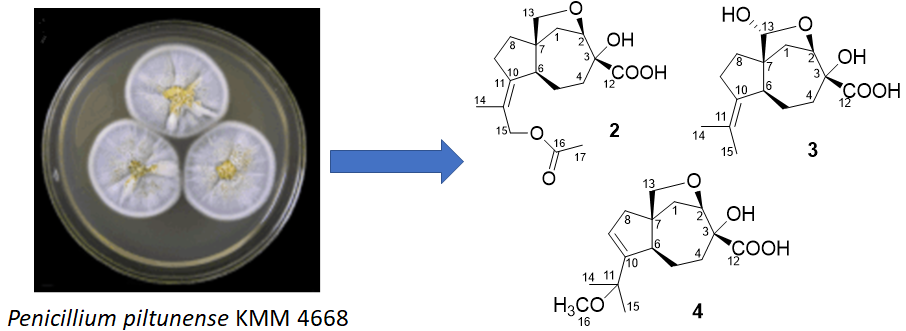
2. Results and Discussion
The fungus was cultured for 21 days on the solid rice medium. The EtOAc extract of the mycelium was purified by a combination of Si gel and Gel ODS-A column chromatography and RP HPLC to yield compounds
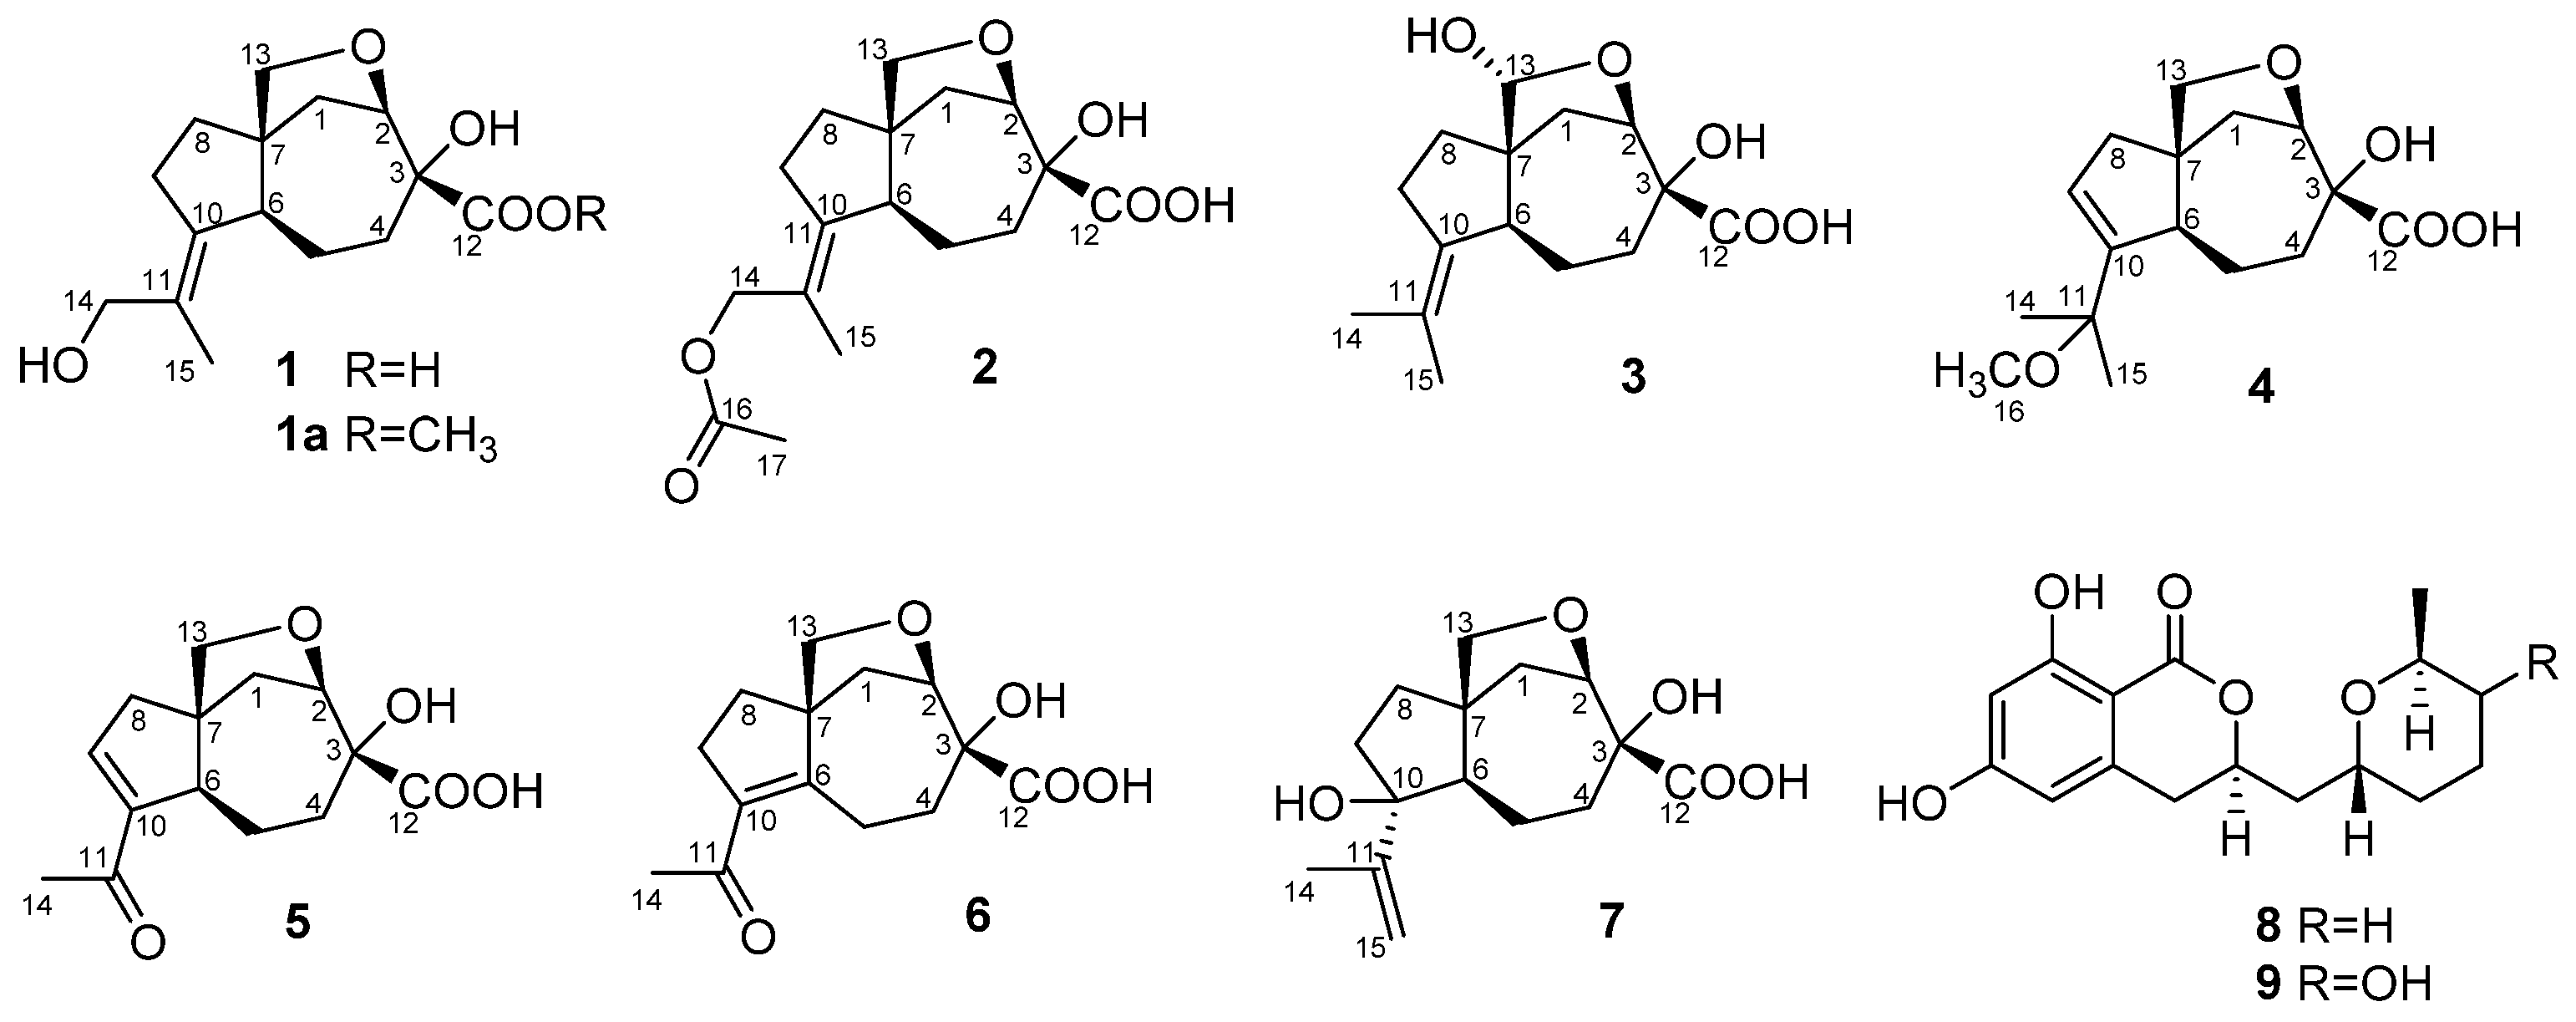
1–
9 (
Figure 1) as amorphous solids.
The molecular formula of
1 was determined as C
15H
22O
5 from the HRESIMS peak at
m/z 281.1392 [M – H]
− and was in accordance with the
13C nuclear magnetic resonance (NMR) data. The
1H and
13C NMR (
Table 1;
Table 2;
Table S2; Figures S22–S28), DEPT and HSQC spectra showed the presence of a methyl group (δ
H 1.81, δ
C 17.3), seven methylenes (δ
C 25.0, 32.6, 35.7, 35.9, 37.4, 66.5 and 77.0) including two oxygen-bearing, two methines (δ
H 2.37, 4.32, δ
C 57.6, 85.5) including one methine linked to an oxygen atom, one sp
3 quaternary carbon (δ
C 54.4), one oxygenated quaternary carbon (δ
C 80.0), one tetrasubstituted double bond (δ
C 129.7 and 141.3) and one carbonyl or carboxyl carbon (δ
C 178.4).
The correlations observed in the COSY and HSQC spectra of
1 indicated the presence of the following isolated spin systems: –CH
2–CH< (C-1–C-2), –CH
2–CH
2–CH< (C-4–C-6) and –CH
2–CH
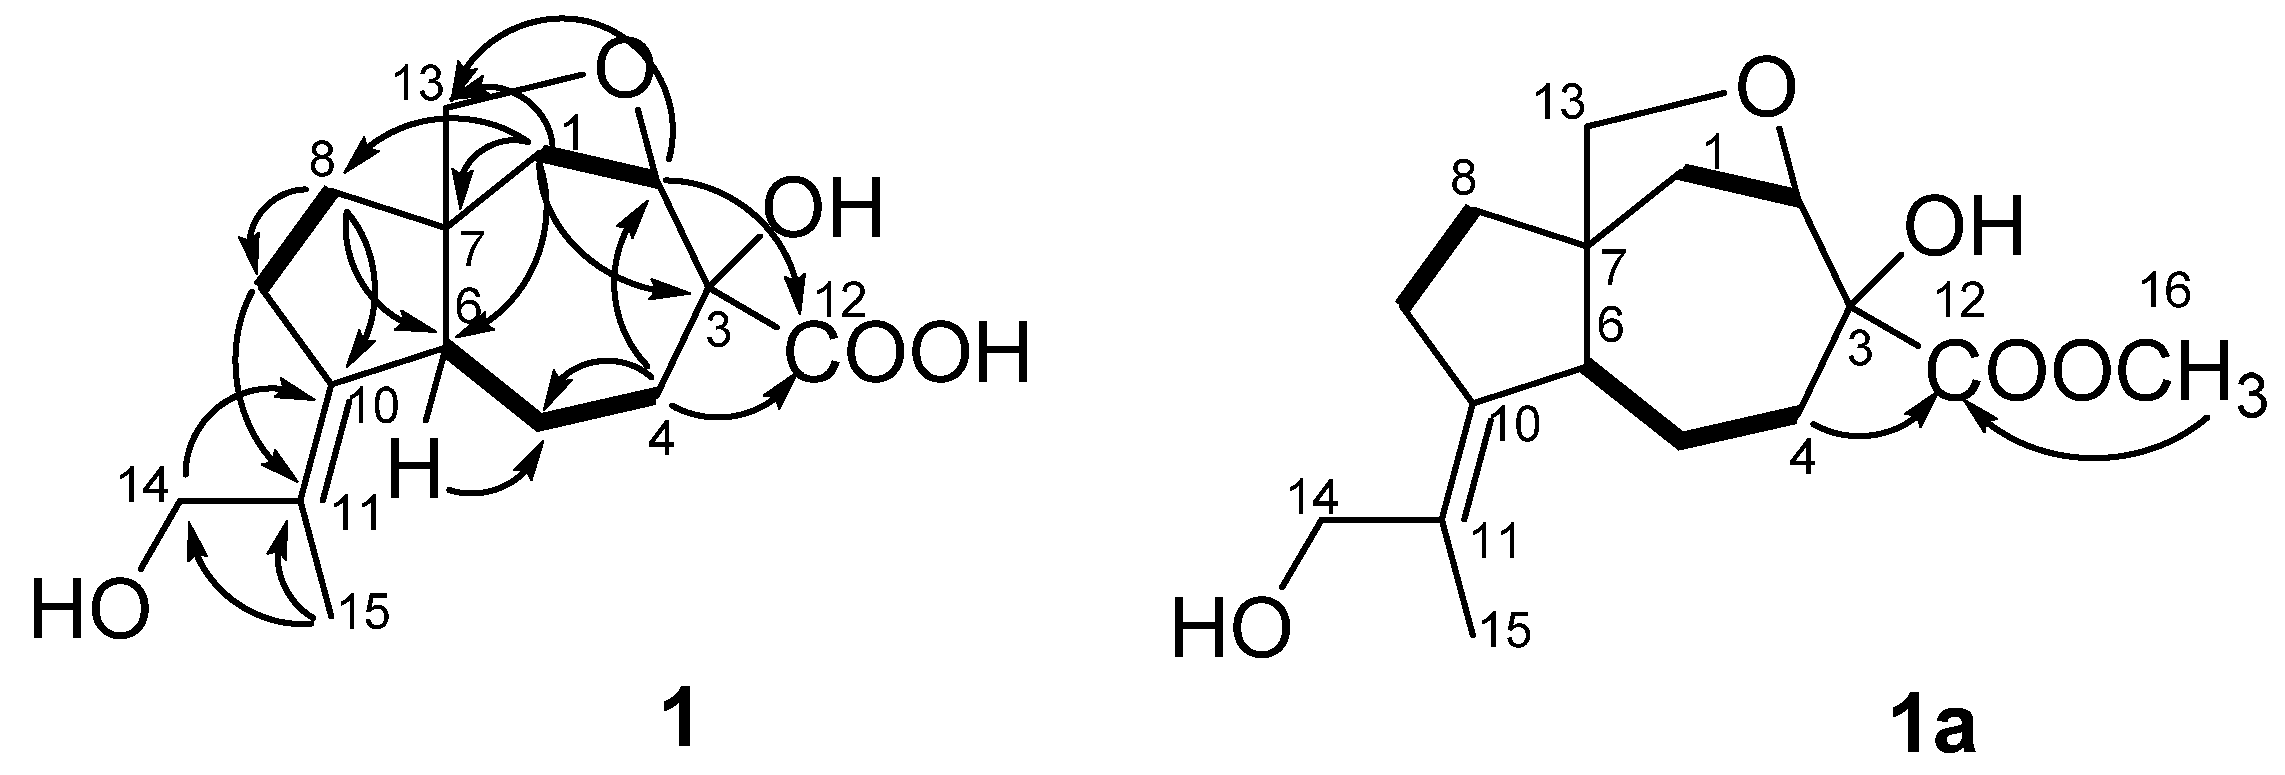
2– (C-8–C-9). The HMBC correlations (
Figure 2) from H-1β (δ
H 2.19) to C-2 (δ
C 85.5), C-3 (δ
C 80.0), C-6 (δ
C 57.6), C-7 (δ
C 54.4) and C-8 (δ
C 35.9), from H-4β (δ
H 2.44) toC-2, C-3, C-5 (δ
C 25.0) and C-6, from H-8β (δ
H 1.53) to C-6, C-7, C-9 (δ
C 32.6) and C-10 (δ
C 141.3) revealed the presence of a carotane bicyclic ring system. The long-range correlations from H
3-15 (δ
H 1.81) to C-10, C-11 (δ
C 129.7) and C-14 (δ
C 66.5) indicated the presence of the 2-hydroxy-1-methylethylidene residue at C-10 in
1. TheHMBC correlations from H-1α (δ
H 2.05), H-2 (δ
H 4.32) and H-8 to C-13 (δ
C 77.0) and downfield chemical shifts of C-2, C-3 and C-13 suggested the presence of hydroxy group at C-3 and confirmed the existence of the ether bridge between C-2 and C-13 in
1.The treatment of
1 with diazomethane resulted in the methylated derivative
1a as the only product. The long-range correlations from H
2-4 (δ
H 1.49, 2.37) and H
3-16 (δ
H 3.79) to C-12 (δ
C 175.9) (
Figure 2, S27) revealed the presence of a carboxyl group at C-3 in
1. Thus, the planar structure of
1 was established (
Figure 2) and was very similar to aspterricacid [
13] with the exception of presence of a 2-hydroxy-1-methylethylidene group at C-10 instead of an isopropylidene one.
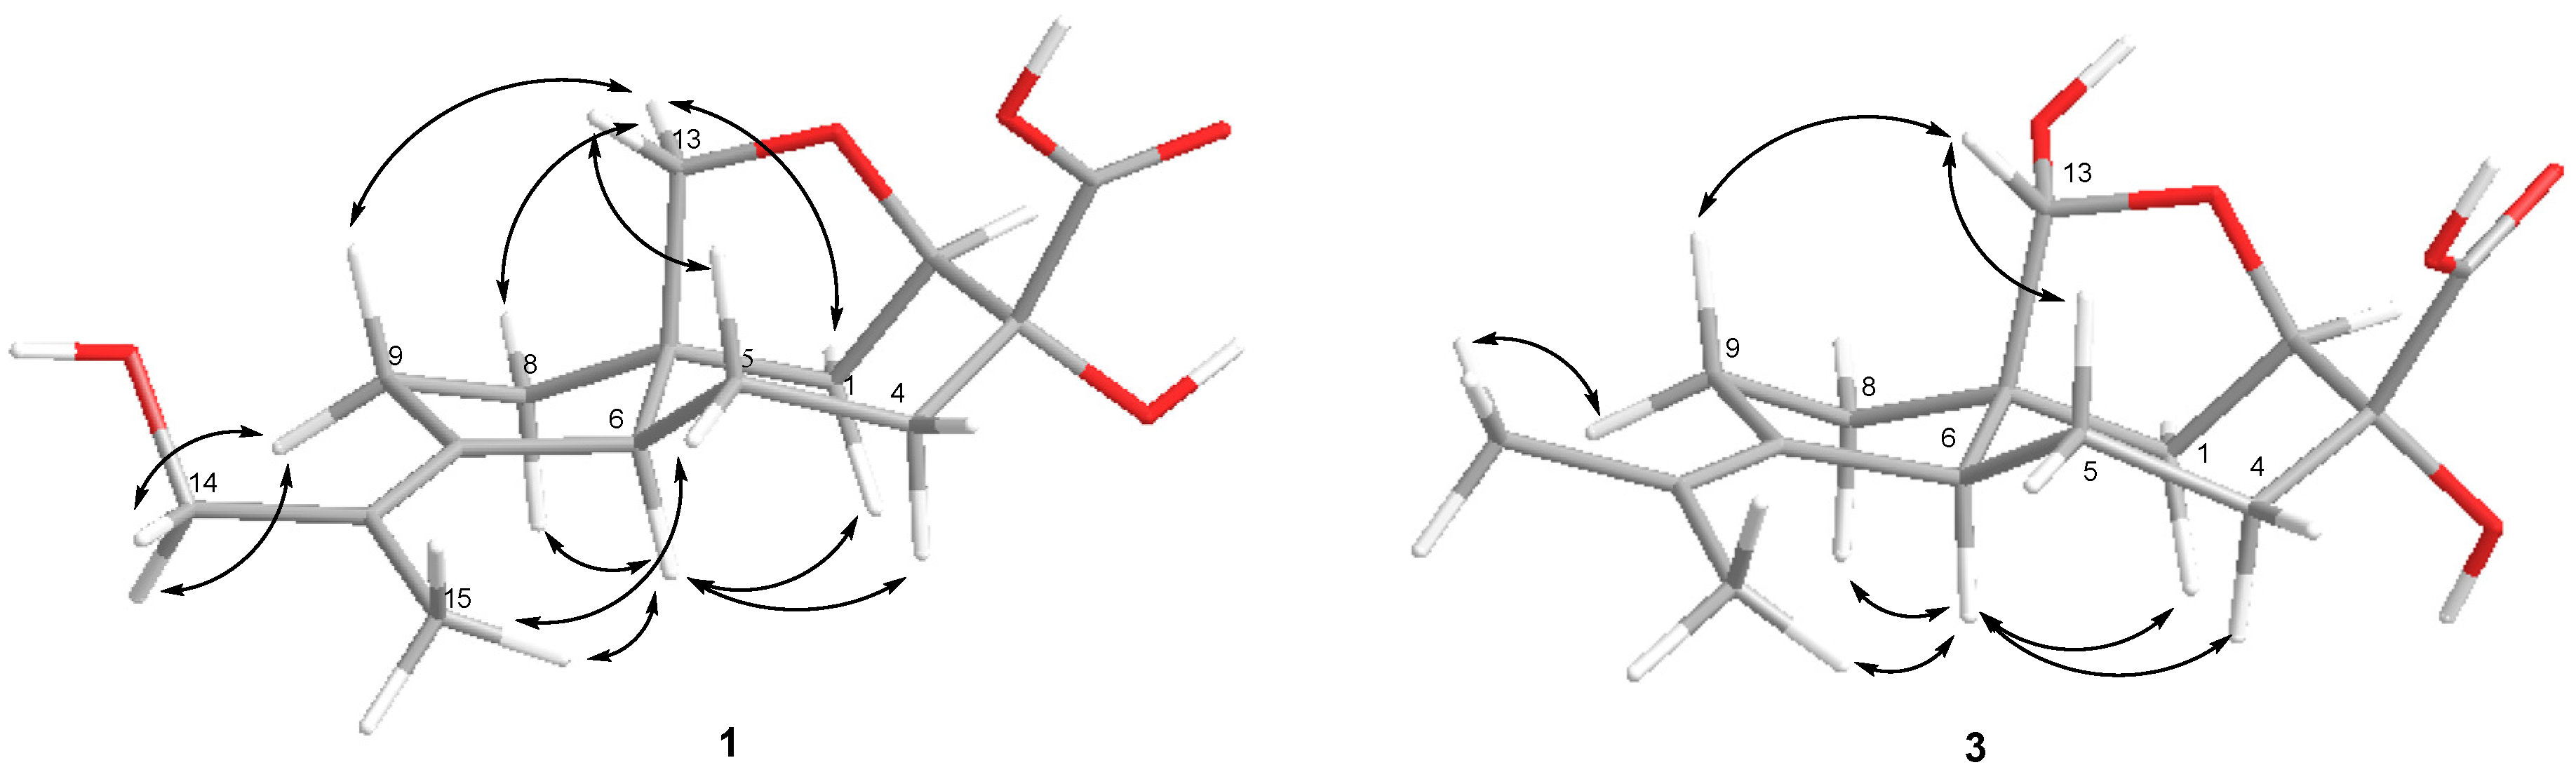
The nuclear Overhauser spectroscopy(NOESY) correlations (
Figure 3) H-6/H-1α, H-4α (δ
H 1.43), H-8α (δ
H 1.71), H-13a (δ
H 3.37)/H-1β, H-8β and H-9β (δ
H 2.11), H-13b (δ
H 3.73)/H-5β (δ
H 1.72), H
3-15 (δ
H 1.81)/H-5α (δ
H 2.44), H-6 (δ
H 2.37) and H
2-14 (δ
H 3.92, 4.01)/H-9α (δ
H 2.47) were assigned relative configuration of
1 including
E configuration of the 10, 11 double bond. Compound
1 exhibited a nearly identical circular dichroism (CD) spectrum (
Figure S1) to that of aspterric acid [
10], for which the absolute configuration was established using X-ray analysis [
13]. Thus, the absolute configuration of
1 was assigned as 2
R,3
R,6
S,7
S. Compound
1 was named piltunine A.
A database search revealed that compound
1 is a synthetic compound that available commercially (
SciFinder.cas.org). Piltunine A (
1) is reported here for first time as a natural product.
The HRESIMS of
2 showed the quasimolecular ion at
m/z 323.1500 [M – H]
–. These data, coupled with
13C NMR spectral data (DEPT), established the molecular formula of
2 as C
17H
24O
6. The general features of
1H and
13C NMR spectra (
Table 1;
Table 2;
Table S2; Figures S33–S39) of
2 showed a close similarity of the carbon chemical shifts to the ones for piltunine A (
1), with the exception of the C-10, C-11 and C-14 carbon signals. The molecular mass difference of 42 mass units between
1 and
2 and HMBC correlations from H
3-17 (δ
H 2.03) to C-14 (δ
C 69.4) and C-16 (δ
C 173.6) indicate the presence of an acetoxy group at C-14 in
2.
The absolute configurations of the chiral centers in
2 were elucidated as 2
R,3
R,6
S,7
S based on NOESY data (
Figure S39,
Table S2) and biogenetic considerations. Compound
2 was named piltunine B.
The molecular formula of compound
3 was determined as C
15H
22O
5 based on the analysis of HRESIMS (
m/z 281.1388 [M – H]
−, calcd for C
15H
22O
5 281.1394) and NMR data (
Table 1;
Table 2;
Table S2; Figures S40–S46). The
13C NMR data for this compound were similar to those obtained for aspterric acid [
10] and aspterric acid methyl ester [
14] with the exception of the C-1, C-7, C-8 and C-13 carbon signals. The molecular mass difference of 16 mass units between
3 and aspterric acid and HMBC correlations from H-1α (δ
H 1.89), H-2 (δ
H 4.40), H-8α (δ
H 1.46) to C-13 (δ
C 101.1) revealed the presence of a hydroxy group at C-13 in
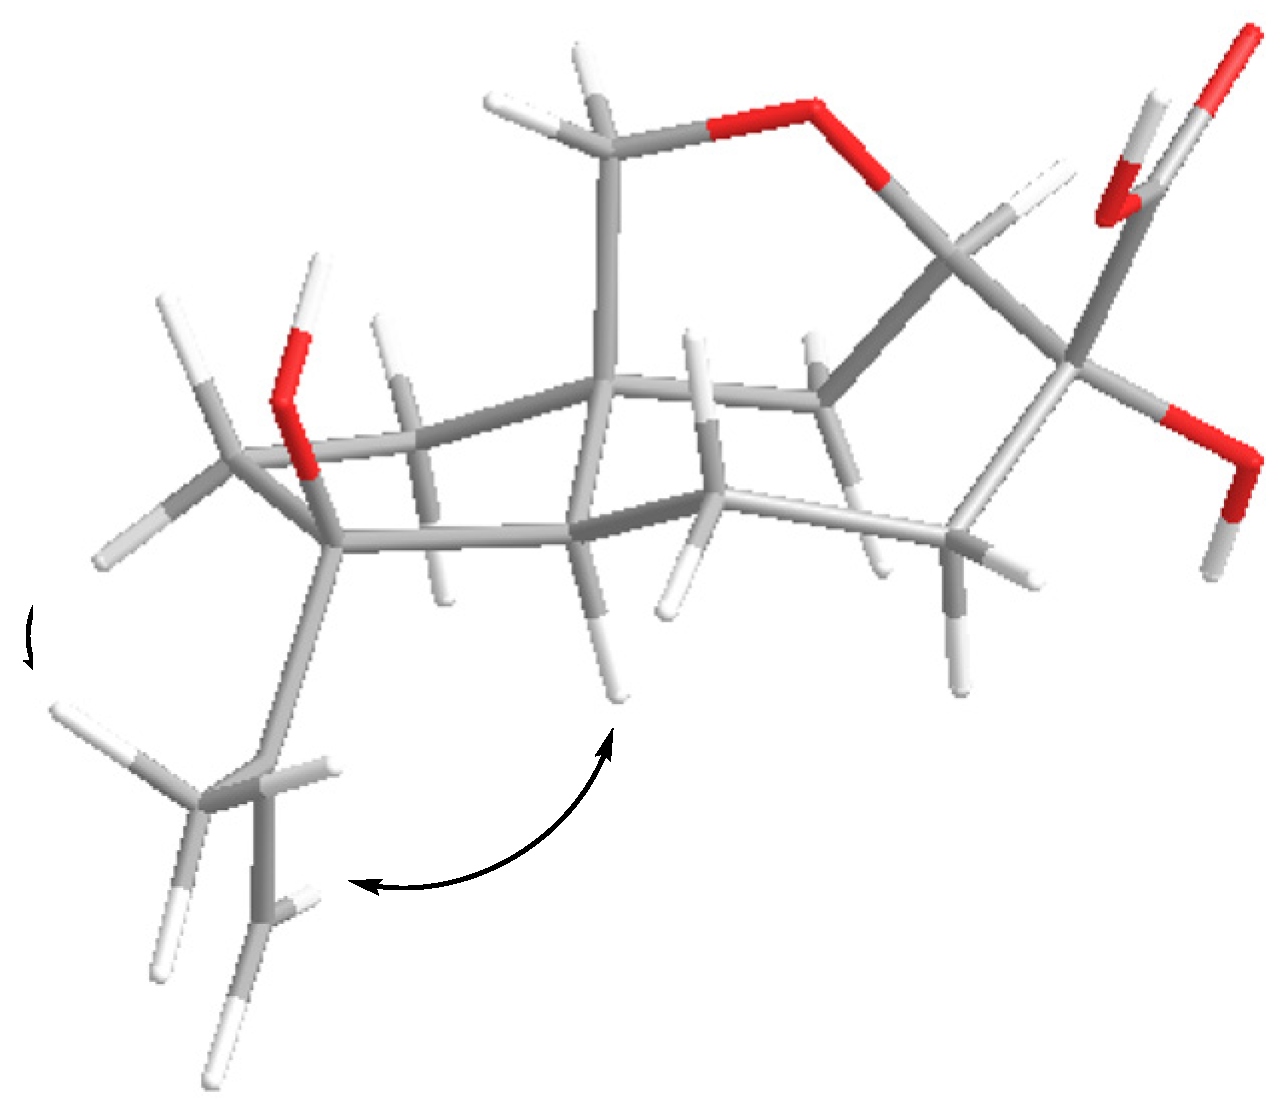
3. The absolute configurations of the chiral centers in
3 were elucidated as 2
R,3
R,6
S,7
S,13
R based on NOESY data (
Figure 3) and biogenetic considerations. Compound
3 was named piltunine C.
(–)HRESIMS
4 gave a quasimolecular ion at
m/z 295.1548 [M – H]
−. These data, coupled with
13C NMR spectroscopic data (
Table 1;
Table 2;
Table S3; Figures S47–S53), established the molecular formula of
4 as C
16H
24O
5. The structures of the carotane seven-membered and furan rings in
4 were determined by HMBC correlations (
Figure S52) as for piltunine A (
1). The long-range correlations from H-8β (δ
H 2.06) to C-6 (δ
C 60.4), C-7 (δ
C 56.0), C-9 (δ
C 129.7) and C-10 (δ
C 152.0), from H-9 (δ
H 5.68) to C-10, C-11 (δ
C 77.7), from H
3-14 (δ
H 1.30) to C-10, C-11, C-15 (δ
C 26.6) and from H
3-16 (δ
H 3.12) to C-11 elucidated the structures of a five-membered ring with ∆
9,10 double bond and side chain, including the location of the tertiary methoxy group at C-11.
The relative configuration of
4 was assigned based on NOESY correlations (
Figure S53) H-6 (δ
H 2.09)/H-1α (δ
H 2.16), H-4α (δ
H 1.37) and H-8β (δ
H 2.06)/H-1β (δ
H 2.21), H-13a (δ
H 3.38) and H-13b (δ
H 3.95)/H-5β(δ
H 1.88). The absolute configurations of the chiral centers in
4 were defined to be the same as that of piltunine A (
1) based on biogenetic consideration. Compound
4 was named piltunine D.
The HRESIMS of
5 showed the quasimolecular ion at
m/z 265.1077 [M – H]
–. These data, coupled with
13C NMR spectral data (
Table 1 and
Table 2;
Table S3; Figures S54–S60), established the molecular formula of
5 as C
14H
18O
5. The ultraviolet (UV) spectrum exhibits a λ
max at 239 nm (logε3.76) and at 195 nm (logε 3.50), consistent with the enone system in
5. The structures of the carotane seven-membered and furan rings in
5 were determined by HMBC correlations (
Figure S59) as for piltunines A (
1) and D (
4). The HMBC correlations from H-8β (δ
H 2.62) to C-6 (δ
C 58.7), C-7 (δ
C 55.5), C-9 (δ
C 147.8) and C-10 (δ
C 149.0), from H-9 (δ
H 6.90) to C-6, C-7, C-10, C-11 (δ
C 200.8), from H
3-14 (δ
H 2.26) to C-10 and C-11 elucidated the structures of a five-membered ring and indicated the 9-en-11-one position for the trisubstituted enonechromophore in
5. The absolute configurations of the chiral centers in
5 were elucidated based on a NOESY experiment (
Figure S60) and biogenetic considerations as for piltunine D (
4). Compound
5 was named piltunine E.
The molecular formula of
6 was determined as C
14H
18O
5 based on the analysis of HRESIMS (
m/z 265,1080 [M–H]
−, calcd for C
14H
17O
5 265,1081) and by
13C NMR analyses (
Table 1 and
Table 2;
Table S3; Figures S61–S67).The UV spectrum exhibits a λ
max at 255 nm (logε4.07) and at 196 (logε 3.88), consistent with the enone system in
6. The HMBC correlations (
Figure S66) from H-1β (δ
H 2.07) to C-2 (δ
C 85.0), C-3 (δ
C 78.6), C-6 (δ
C 162.7), C-7 (δ
C 60.5) and C-8 (δ
C 33.4), from H-4β (δ
H 2.26) to C-2, C-3, C-5 (δ
C 23.3), C-6 and C-12 (δ
C 178.3), from H
2-8 (δ
H 1.89, 1.96) to C-1 (δ
C 39.1), C-6, C-7, C-9 (δ
C 33.7), C-10 (δ
C 135.4) and C-13 (δ
C 79.7)and from H
3-14 (δ
H 2.24) to C-9, C-10 and C-11 (δ
C 202.5) revealed the presence of a carotane bicyclic ring system, an ester bridge between C-2 and C-13 and 6-en-11-one position for the tetrasubstituted enone chromophore in
6. The absolute configurations of the chiral centers in
6 were defined based on NOESY correlations H-13a (δ
H 3.74)/H-1β (δ
H 2.07), H-8β(δ
H 1.89), H-13b (δ
H 3.84)/H-5β(δ
H 2.74), H-1α (δ
H 2.32)/H-4α (δ
H 1.46) (
Figure S67) and biogenetic considerations as 2
R,3
R,7
S. Compound
6 was named piltunine F.
The absolute configurations of the chiral centers in penigrisacid D (
7)were defined based on NOESY (
Figure 4,
Figure S73) correlations H-6 (δ
H 1.71)/H-1α (δ
H 2.03), H-4α (δ
H 1.41), H-8α (δ
H 1.85), H-15b (δ
H 5.01), H-13a (δ
H 3.41)/H-1β (δ
H 2.25), H-8β(δ
H 1.89), H-13b (δ
H 4.67)/H-5β(δ
H 1.81), H-9β (δ
H 1.65) and H-9α (δ
H 2.12)/H
3-14 (δ
H 1.78) and biogenetic considerations as 2
R,3
R,6
S,7
S,10
S.
We have investigated the effect of the isolated compounds
1,
1a,
2,
7–
9 on the viability of human drug-resistant prostate cancer 22Rv1 cell as well as on human prostate non-cancer PNT-2 cells using an MTT assay (
Table 3). We have also determined a selectivity index (SI) at for all the tested substances (
Table 3). Compounds showing high SI values are more active in cancer cells in comparison with non-cancer cells lines. Thus,
8 had the highest SI value among the tested substances, which makes it a promising candidate for the further synthetic modifications in order to optimize its anticancer activity and selectivity. Interestingly,
8 has been also identified to be the most cytotoxic in cancer cells in comparison with the other substances (
Table 3). Note, 22Rv1 cells are known to be resistant to the hormone therapy due to the expression of androgen receptor splice variant AR-V7 [
15]. Thus, the compounds which are active inAR-V7-positive 22Rv1 cells are of high clinical interest.
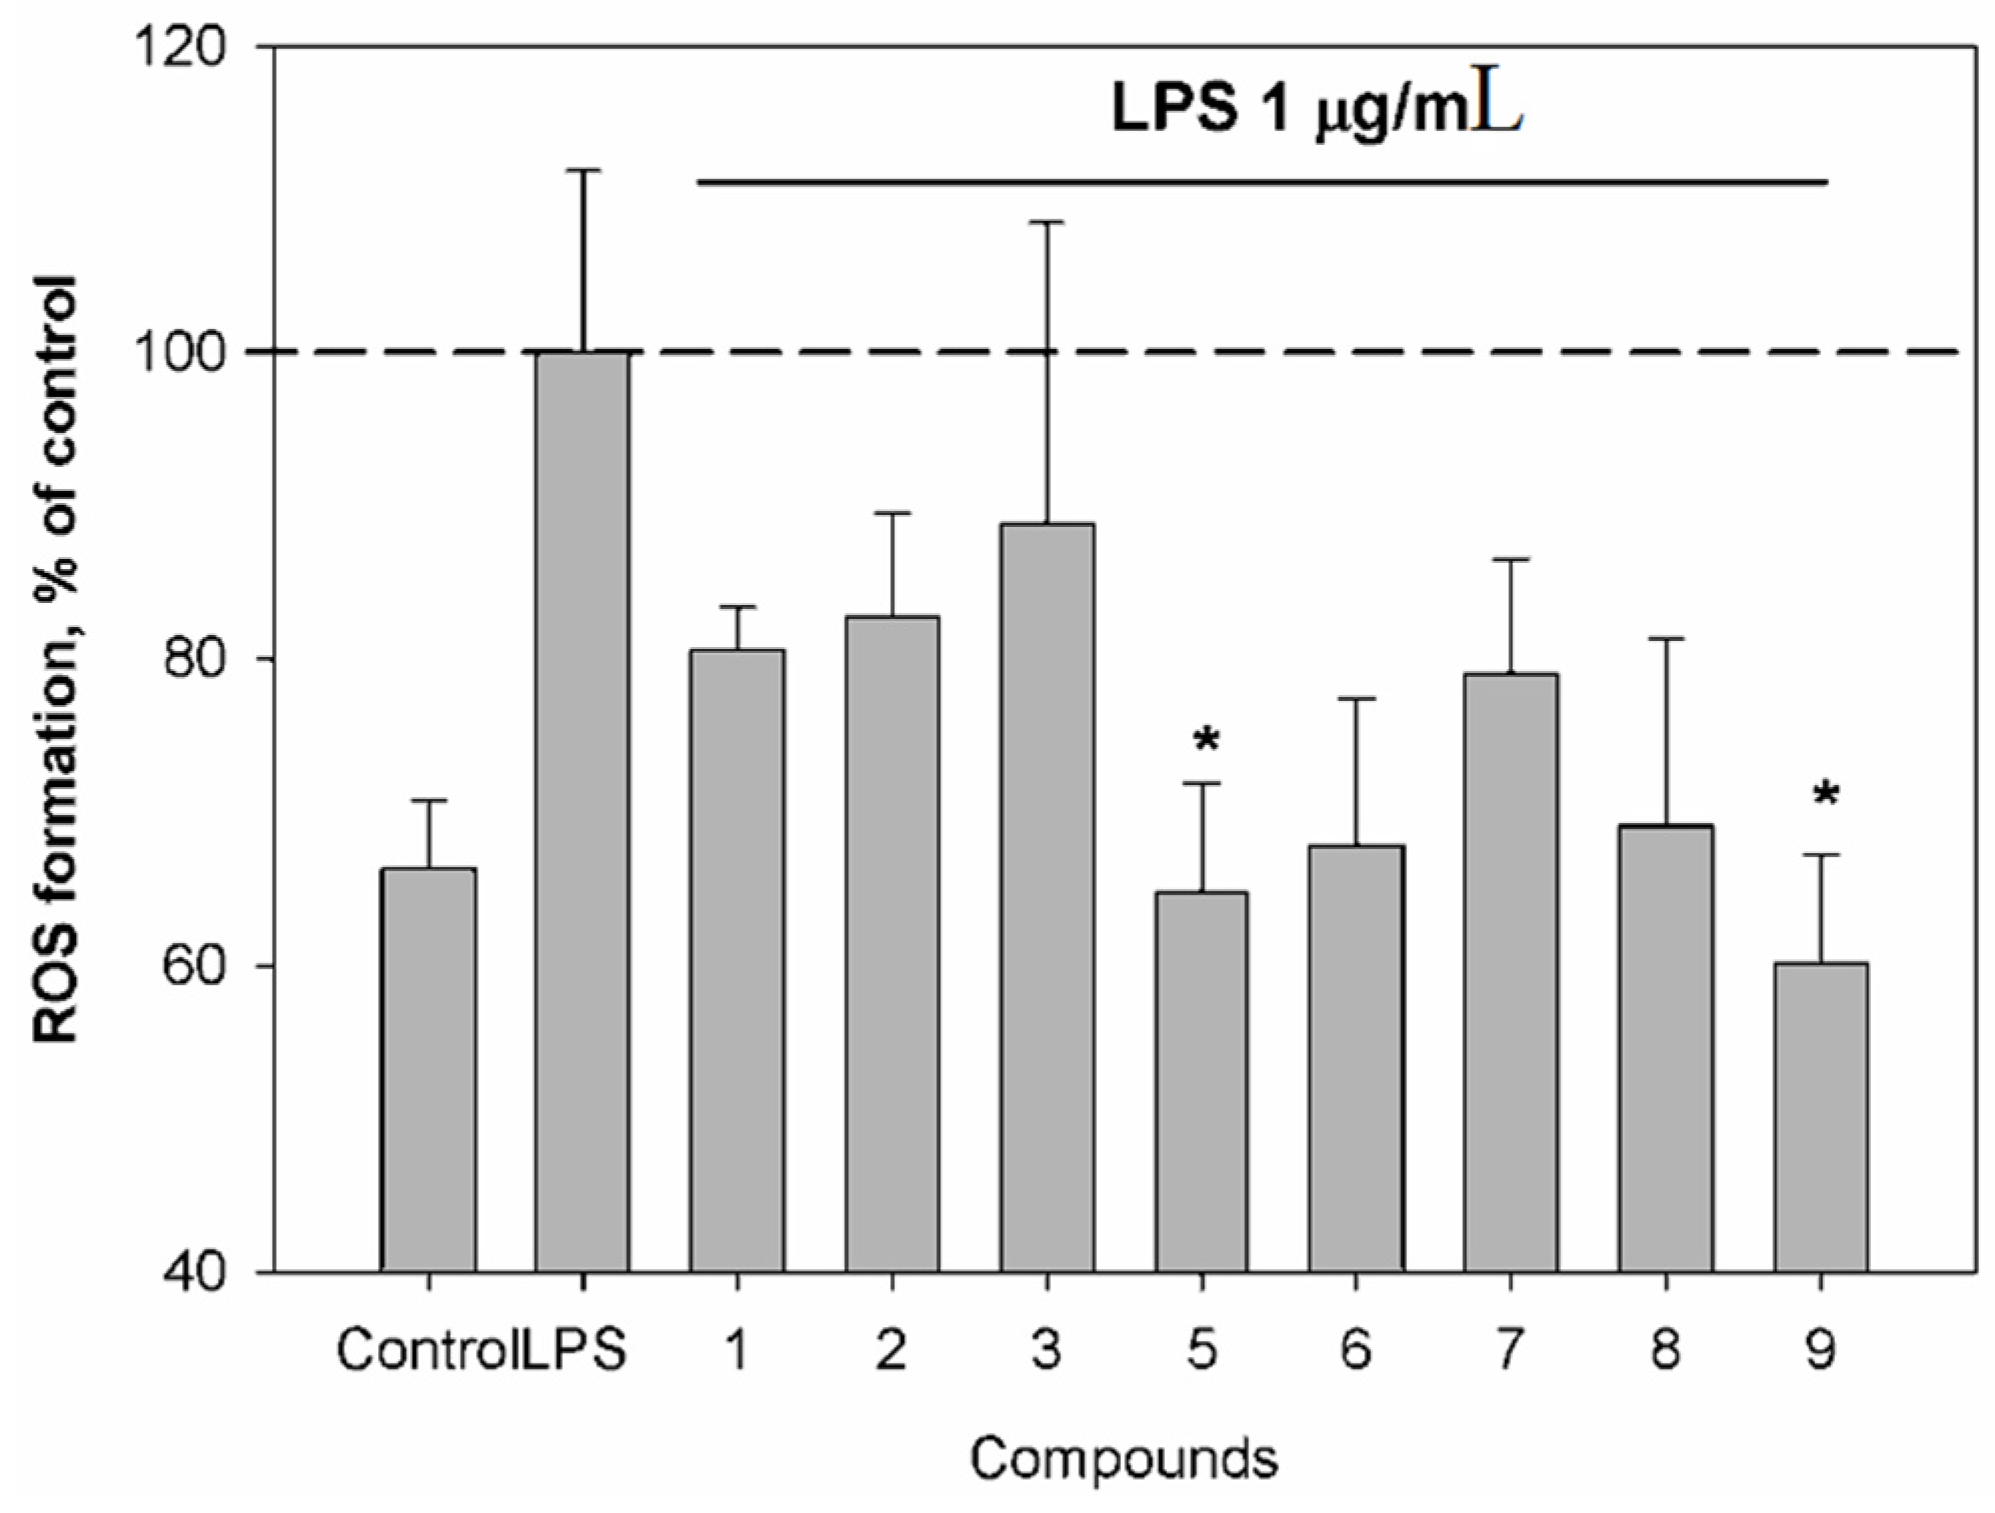
Additionally, we have investigated the effects of the isolated compounds 1, 2, 3 and 5–9 on reactive oxygen species (ROS) and nitric oxide (NO) production in murine macrophages following lipopolysaccharide (LPS) stimulation. NO, which is produced in large quantities by inducible nitric oxide synthase (iNOS), is known to be responsible for vasodilation and hypotension observed during septic shock and inflammation.
Compounds
5 and
9 induced a significant down-regulation of ROS production (
Figure 5). LPS from E. coli, an inflammatory agent, was used as a positive control in our study.
Compound 9 suppressed NO production in LPS-stimulated macrophages at non-toxic concentration of 1 μM. NO level in these cells was decreased by 24.1 ± 0.7% (p < 0.05, Student’s t-test) in comparison with LPS-treated control (data not shown). Therefore, compound 9 may be a promising candidate for the therapy of inflammatory diseases accompanying overproduction of NO.
3. Materials and Methods
3.1. General Experimental Procedures
Optical rotations were measured on a Perkin-Elmer 343 polarimeter (Perkin Elmer, Waltham, MA, USA). UV spectra were recorded on a Shimadzu UV-1601PC spectrometer (Shimadzu Corporation, Kyoto, Japan) in methanol. CD spectra were measured with a Chirascan-Plus CD Spectrometer (Leatherhead, UK) in methanol. NMR spectra were recorded in CD3OD and CDCl3, on a Bruker DPX-500 (Bruker BioSpin GmbH, Rheinstetten, Germany) and a Bruker DRX-700 (Bruker BioSpin GmbH, Rheinstetten, Germany) spectrometer, using TMS as an internal standard. HRESIMS spectra were measured on a Maxis impact mass spectrometer (Bruker Daltonics GmbH, Rheinstetten, Germany).
Low-pressure liquid column chromatography was performed using Si gel L (50/100 μm, Imid, Russia) and Gel ODS-A (12 nm, S – 75 um, YMC Co, Ishikawa, Japan). Plates precoated with Si gel (5–17 μm, 4.5 × 6.0 cm, Imid) and Si gel60 RP-18 F254S (20 × 20 cm, Merck KGaA, Germany) were used for thin-layer chromatography. Preparative HPLC was carried out on aAgilent 1100 chromatograph (Agilent Technologies, USA) using a YMC ODS-AM (YMC Co., Ishikawa, Japan) (5 µm, 10 × 250 mm), YMC ODS-A (YMC Co., Ishikawa, Japan) (5 µm, 4.6 × 250 mm) and Supelco Discovery C-18 (5 μm, 250 × 4.6 mm) columns with a Agilent 1100 refractometer (Agilent Technologies, Santa Clara, CA, USA).
3.2. Fungal Strain
The strain of Penicillium piltunense KMM 4668 was isolated from marine subaqueous soil (Piltun Bay, Sea of Okhotsk, the northeastern shelf of the Sakhalin Island, Russia). The fungus was identified according to a molecular biology protocol by DNA amplification and sequencing of the ITS region (MycoBank accession number is MB818671) and morphological and physiological studies. The strain is stored at the Collection of Marine Microorganisms (KMM) of G.B. Elyakov Pacific Institute of Bioorganic Chemistry (Vladivostok, Russia).
3.3. Cultivation of Fungus
The fungus was cultured at 22 °C for three weeks in 60 × 500 mL Erlenmeyer flasks, each containing rice (20.0 g), yeast extract (20.0 mg), KH2PO4 (10 mg) and natural sea water from the Marine Experimental Station of PIBOC, Troitsa (Trinity) Bay, Sea of Japan (40 mL).
3.4. Extraction and Isolation
At the end of the incubation period, the mycelia and medium were homogenized and extracted with EtOAc (1 L). The obtained extract was concentrated to dryness. The residue (4.8 g) was dissolved in H2O−EtOH (4:1) (100 mL) and was extracted with n-hexane (0.2 L × 3) and EtOAc (0.2 L × 3). After evaporation of the EtOAc layer, the residual material (2.5 g) was passed over a silica column (3 × 14 cm), which was eluted first with n-hexane (200 mL) followed by a step gradient from 5% to 50% EtOAc in n-hexane (total volume 20 L). Fractions of 250 mL were collected and combined on the basis of TLC (Si gel, toluene–isopropanol 6:1 and 3:1, v/v).
The n-hexane–EtOAcfraction (80:20, 570 mg) wasseparated on a Gel ODS-A column (1.5 × 8 cm), which was eluted by a step gradient from 40% to 80% MeOH in H2O (total volume 1 L) to yield subfractions I, II and III. Subfraction I (40% MeOH, 100 mg) was purified by RP HPLC on a YMC ODS-A column eluting with MeOH–H2O (40:60) to yield 1 (15 mg). Subfraction II (60% MeOH, 143 mg) was purified by RP HPLC on a YMC ODS-AM column eluting at first with MeOH–H2O–TFA (65:35:0.1) and then with MeOH–H2O (55:45) to yield 2 (13 mg), 7 (7 mg), 9 (7.5 mg). Subfraction III (80% MeOH, 60 mg) was purified and separated by RP HPLC on a YMC ODS-A column eluting at first with MeOH–H2O (80:20) and then with MeOH–H2O (60:40) to yield 8 (10 mg) and 4 (1 mg).
The n-hexane–EtOAcfraction (70:30, 70 mg) was separated on a Gel ODS-A column (1.5 × 8 cm) eluting with MeOH–H2O (40:60) and then was purified on an YMC ODS-A column eluting with MeOH–H2O (60:40) to yield 3 (3 mg).
The n-hexane–EtOAcfraction (50:50, 500 mg) was separated on a Gel ODS-A column (1.5 × 8 cm) eluting with MeOH–H2O (60:40) and then was purified on a Supelco-C-18 column eluting with MeOH–H2O (35:65) to yield 5 (6 mg) and 6 (4.6 mg).
3.5. Spectral Data
Piltunine A (
1): amorphous solids; [α]
D20–91.6 (
c 0.1 CH
3OH); UV (CH
3OH) λ
max (log ε) 242 (3.19) and 203 (3.73) nm, see
Supplementary Figure S8; CD (
c 2.1 × 10
−3, CH
3OH), λ
max(∆ε) 207 (+4.61), 229 (–0.29), 250 (+0.45) nm, see
Supplementary Figure S1; infrared (IR) (CDCl
3) ν
max 3500, 2947, 1751, 1714, 1670, 1485, 1412, 1390, 1216, 1091, 1048 cm
−1, see
Supplementary Figures S14 and S15;
1H and
13C NMR data, see
Table 1 and
Table 2,
Supplementary Table S2, Figures S22–S28; HRESIMS
m/
z 281.1392 [M – H]
– (calcd. for C
15H
21O
5, 281.1394, Δ +1.0 ppm), 305.1352 [M + Na]
+ (calcd. for C
15H
22O
5Na, 305.1359, Δ +2.6 ppm).
Piltunine B (
2): amorphous solids; [α]
D20–55 (
c 0.09 CH
3OH); UV (CH
3OH) λ
max (log ε) 250 (3.14) and 201 (3.80) nm, see
Supplementary Figure S9; CD (
c 2.2 × 10
−3, CH
3OH), λ
max(∆ε) 209 (+0.45), 225 (−0.51), 252 (+0.28) nm, see
Supplementary Figure S2; IR (CDCl
3) ν
max 3500, 2937, 1758, 1744, 1714, 1602, 1385, 1241, 1051 cm
−1, see
Supplementary Figures S16 and S17;
1H and
13C NMR data, see
Table 1 and
Table 2,
Supplementary Table S2, Figures S33–S39; HRESIMS
m/
z 323.1500 [M – H]
– (calcd. for C
17H
23O
6, 323.1500, Δ +0.1 ppm), 347.1468 [M + Na]
+ (calcd. for C
17H
24O
6Na, 347.1465, Δ −0.9 ppm).
Piltunine C (
3): amorphous solids; [α]
D20–145 (
c 0.1 CH
3OH); UV (CH
3OH) λ
max (log ε) 199 (3.66) nm, see
Supplementary Figure S10; CD (
c 2.1 × 10
−3, CH
3OH), λ
max(∆ε) 204 (+4.77), 226 (–0.33) nm, see
Supplementary Figure S3;
1H and
13C NMR data, see
Table 1 and
Table 2,
Supplementary Table S2, Figures S40–S46; HRESIMS
m/
z 281.1388 [M – H]
– (calcd. for C
15H
21O
5, 281.1394, Δ +2.2 ppm), 305.1355 [M + Na]
+ (calcd. for C
15H
22O
5Na, 305.1359, Δ +1.6 ppm).
Piltunine D (
4): amorphous solids; [α]
D20–25 (
c 0.08 CH
3OH); UV (CH
3OH) λ
max (log ε) 199 (3.55) nm, see
Supplementary Figure S11; CD (
c 2.7 × 10
−3, CH
3OH), λ
max(∆ε) 221 (−0.48), 250 (+0.24), 297 (−0.05) nm; IR (CDCl
3) ν
max 2929, 2857, 1745, 1713, 1457, 1216, 1068 cm
−1, see
Supplementary Figures S18 and S19;
1H and
13C NMR data, see
Table 1 and
Table 2,
Supplementary Table S3, Figures S47–S53; HRESIMS
m/
z 295.1548 [M – H]
– (calcd. for C
16H
23O
5, 295.1551, Δ +0.9 ppm).
Piltunine E (
5): amorphous solids; [α]
D20–84.5 (
c 0.10 CH
3OH); UV (CH
3OH) λ
max(log ε) 239 (3.76) and 195 (5.50) nm, see
Supplementary Figure S8; CD (
c 3.0 × 10
−3, CH
3OH), λ
max(∆ε) 195 (+6.25), 238 (−1.16) nm, see
Supplementary Figure S5;
1H and
13C NMR data, see
Table 1 and
Table 2,
Supplementary Table S3, Figures S54–S60; HRESIMS
m/
z 265.1077 [M – H]
– (calcd. for C
14H
17O
5, 265.1081, Δ +1.7 ppm), 289.1043 [M + Na]
+ (calcd. for C
14H
18O
5Na, 289.1046, Δ +1.1 ppm).
Piltunine F (
6): amorphous solids; [α]
D20 −16.1 (
c 0.14 CH
3OH); UV (CH
3OH) λ
max(log ε) 255 (4.07) and 196 (3.88) nm, see
Supplementary Figure S9; CD (
c 1.2 × 10
−3, CH
3OH), λ
max(∆ε) 214 (−1.65), 257 (+3.86) nm, see
Supplementary Figure S6; IR (CDCl
3) ν
max 3500, 2945, 1759, 1673, 1605, 1385, 1259, 1209, 1136, 1112, 1053 cm
−1, see
Supplementary Figures S20 and S21;
1H and
13C NMR data, see
Table 1 and
Table 2,
Supplementary Table S3, Figures S61–S67; HRESIMS
m/
z 265.1080 [M – H]
–(calcd. for C
14H
17O
5, 265.1081, Δ +0.4 ppm), 289.1042 [M + Na]
+ (calcd. for C
14H
18O
5Na, 289.1046, Δ +1.4 ppm).
Penigrisacid D (
7): amorphous solids; [α]
D20–36.2 (
c 0.16 EtOH); CD (
c 2.7 × 10
−3, CH
3OH), λ
max(∆ε) 209 (−1.03), 257 (+0.03), 300 (–0.12) nm, see
Supplementary Figure S7;
1H and
13C NMR data, see
Supplementary Table S1, Figures S68–S73; HRESIMS
m/
z 281.1394 [M – H]
– (calcd. for C
15H
21O
5, 281.1394, Δ +0.3 ppm), 305.1358 [M + Na]
+ (calcd. for C
15H
22O
5Na, 305.1359, Δ +0.5 ppm).
3.6. Cell Lines and Culture Conditions
The human prostate cancer cells 22Rv1 and human prostate non-cancer cells PNT-2 were purchased from ATCC. Cell lines were cultured according to the manufacturers instructions in 10% FBS/RPMI media (Invitrogen). Cells were continuously kept in culture for a maximum of 3 months, and were routinely inspected microscopically for stable phenotype and regularly checked for contamination with mycoplasma. The authentity of the cells has recently been confirmed by the Multiplexion (Heidelberg, Germany) using highly polymorphic short tandem repeat loci.
3.7. In Vitro MTT-Based Drug Sensitivity Assay
The
in vitro cytotoxicity of individual substances was evaluated using the MTT (3-(4,5-dimethylthiazol-2-yl)-2,5-diphenyltetrazolium bromide) assay, which was performed as previously described [
16]. The vehicle (DMSO) treated cells were used as a negative control. Treatment time was 72 h.
3.8. Reactive Oxygen Species (ROS) Level Analysis in Lipopolysaccharide (LPS)-Treated Cells
The suspension of macrophages on 96-well plates (2 × 10
4 cells/well) were washed withphosphate-buffered saline (PBS) and treated with 180 µL/well of the tested compounds (10 μM) for 1 h and 20 µL/well LPS from
E. coli serotype 055:В5 (Sigma-Aldrich, MA, USA, 1.0 μg/mL), which were both dissolved in PBS and cultured at 37 °C in a CO
2-incubator for one hour. For the ROS levels measurement, 200 μL of 2,7-dichlorodihydrofluorescein diacetate (DCF-DA, Sigma, final concentration 10 μM) fresh solution was added to each well, and the plates were incubated for 30 min at 37 °C. The intensity of DCF-DA fluorescence was measured at λex 485 n/λem 518 nm using the plate reader PHERAstar FS (BMG Labtech, Offenburg, Germany) [
17].
3.9. Reactive Nitrogen Species (RNS) Level Analysis in LPS-Treated Cells
The suspension of macrophages on 96-well plates (2 × 10⁴ cells/well) were washed with the PBS and treated with 180 µL/well of the tested compounds (10 μM) for 1 h and 20 µL/well LPS from E. coli serotype 055:В5 (Sigma, 1.0 μg/mL), which were both dissolved in PBS and cultured at 37 °C in a CO2-incubator for one hour. For the RNS levels measurement, 200 μL Diaminofluorescein-FM diacetate (DAF FM-DA, Sigma, final concentration 10 μM) fresh solution was added to each well, and the plates were incubated for 40 min at 37 °C, then replace with fresh PBS, and then incubated for an additional 30 min to allow complete de-esterification of the intracellular diacetates. The intensity of DAF FM-DA fluorescence was measured at λex 485 n/λem 520 nm using the plate reader PHERAstar FS (BMG Labtech, Offenburg, Germany).
3.10. Peritoneal Macrophage Isolation
Mice BALB/c were sacrificed by cervical dislocation. Peritoneal macrophages were isolated using standard procedures. For this purpose, 3 ml of PBS (pH 7.4) was injected into the peritoneal cavity and the body intensively palpated for 1–2 min. Then the peritoneal fluid was aspirated with a syringe. Mouse peritoneal macrophage suspension was applied to a 96-well plate left at 37 °C in an incubator for 2 h to facilitate attachment of peritoneal macrophages to the plate. Then a cell monolayer was triply flushed with PBS (pH 7.4) for deleting attendant lymphocytes, fibroblasts and erythrocytes and cells were used for further analysis.
All animal experiments were conducted in compliance with all rules and international recommendations of the European Convention for the Protection of Vertebrate Animals used for experimental and other scientific purposes. All procedures were approved by the Animal Ethics Committee at the G. B. Elyakov Pacific Institute of Bioorganic Chemistry, Far Eastern Branch of the Russian Academy of Sciences (Vladivostok, Russia), according to the Laboratory Animal Welfare guidelines.
3.11. Statistical Analysis
Average value, standard error, standard deviation and p-values in all experiments were calculated and plotted on the chart using SigmaPlot 3.02 (Jandel Scientific, San Rafael, CA, USA) or GraphPad Prism software v. 5.01 (GraphPad Prism software Inc., La Jolla, CA, USA). Statistical difference was evaluated by the t-test, and results were considered as statistically significant at p < 0.05.


 ,
, 


