Article

Proteomic Analysis of the Chlorophyta Dunaliella New Strain AL-1 Revealed Global Changes of Metabolism during High Carotenoid Production

1
Unité de Biotechnologie des Algues, Biological Engineering Department, National School of Engineers of Sfax, University of Sfax, Sfax 3038, Tunisia
2
Laboratoire de Biotechnologie Végétale Appliquée à l’Amélioration des Cultures, Faculty of Sciences of Sfax, University of Sfax, Sfax 3000, Tunisia
3
Center for Molecular Biophysics (CBM), CNRS UPR 4301, Orléans 45071, France
4
Laboratoire BRM-PBA Ifremer, Nantes 44311, France
*
Author to whom correspondence should be addressed.
Mar. Drugs 2017, 15(9), 293; https://doi.org/10.3390/md15090293
Submission received: 20 July 2017 / Revised: 27 August 2017 / Accepted: 31 August 2017 / Published: 20 September 2017
(This article belongs to the Collection Bioactive Compounds from Marine Plankton)

Abstract

:
The green microalgae Dunaliella genus is known for the production of high added value molecules. In this study, strain AL-1 was isolated from the Sebkha of Sidi El Hani (Sousse, Tunisia). This isolate was identified both morphologically and genetically via 18S rRNA gene sequence as a member of the genus Dunaliella. Strain AL-1 was found to be closely related to Dunaliella salina, Dunaliella quartolecta and Dunaliella polymorpha with more than 97% similarity. Response surface methodology was used to maximize carotenoid production by strain AL-1 by optimizing its growth conditions. The highest carotenoid content was obtained at salinity: 51, light intensity: 189.89 μmol photons·m−2·s−1, and nitrogen: 60 mg·L−1. Proteomic profiling, using two-dimensional gel electrophoresis, was performed from standard and optimized cultures. We detected 127 protein spots which were significantly differentially expressed between standard and optimized cultures. Among them 16 protein spots were identified with mass spectrometry and grouped into different functional categories using KEGG (Kyoto Encyclopedia of Genes and Genomes) such as photosynthetic Calvin cycle, regulation/defense, energy metabolism, glycolysis, and cellular processes. The current study could be of great interest in providing information on the effect of stressful conditions in microalgae carotenoid production.

1. Introduction

Due to a number of benefits, microalgae have recently gained much interest. In fact, they are easy to cultivate and they present high biomass productivity. In addition, their cultivation does not need arable land, they do not vie with food production, and they can produce a great variety of secondary metabolites by adaptation to environmentally changing conditions [1,2]. These molecules have a high potential to be used in biotechnological applications [1].
In the few last years there has been a growing demand for antioxidant, colorant, and bioactive compounds obtained from natural sources [3]. As a matter of fact, carotenoids synthesized by microalgae have been attracting attention. These pigments provide protection to the photosynthetic apparatus in plants by dissipating excess energy [2]. They also take part in oxygenic photosynthesis, as accessory pigments for harvesting light or as structural molecules that stabilize protein folding in the photosynthetic apparatus [4]. Moreover these lipophilic compounds function as scavengers of reactive oxygen species which mainly arise from sunlight absorption by chromophores and consequently protect chlorophylls, proteins, lipids, and DNA from oxidative damages. Carotenoids produced by green algae, are attractive materials in food, pharmaceutical, and cosmeceutical industries due to their strong properties. They have been associated in recent years with lowering the risks of cancer [5].
The aptitude to produce these large amounts of specific organic compounds by some Dunaliella members has made them superlative organisms for cell factory applications [6]. Amongst others, Dunaliella salina (Chlorophyta, Chlorophyceae), a unicellular biflagellate green alga, has been highly researched and utilized as a source of various industrial compounds such as carotenoids, glycerol, and unsaturated fatty acids [7].
The unicellular green algae D. salina can be considered as a powerful biological system able to tolerate and acclimate to a wide range of salt concentrations by production and accretion of the compatible solute glycerol at concentrations that are relative to the external NaCl [8,9]. Additionally to their halotolerance; some Dunaliella species display remarkable properties of tolerance to high light [10,11]; low temperature, and limited nutrients [12], achieved by the buildup of massive amounts of carotenoids, glycerol, unsaturated fatty acids, and many other compounds.
The halotolerant algae D. salina acclimate to various kinds of environmental stress by regulating the expression of numerous stress inducible genes [13]. This is achieved by some changes in metabolism involving the up-regulation or down-regulation of many metabolic pathways.
Rapidly developing genomics, transcriptomics, proteomics, and metabolomics have become crucial in understanding the microorganism’s response mechanism to the changes occurring in their physical environment [14]. Proteomic study and two-dimensional electrophoresis (2-DE), have been the main techniques of separation and comparison of complex protein mixtures in D. salina [15]. When consolidated with mass spectrometry [16], these combined methods could precisely determine molecular mass and analyze the molecular structure [17,18].
In this paper, a response surface methodology (RSM) was applied to determine the influence of culture conditions (light intensity, salinity, and nitrogen deficiency) on carotenoid production. We analyzed the protein expression during carotenoid accumulation in the isolated strain AL-1 with 2-DE. A differential protein expression map, mass spectrometry, and bioinformatics analysis were used to analyze and identify the differentially expressed proteins with the aim of extending our knowledge on physiological changes in cells under stressful conditions.

2. Results and Discussion

2.1. Identification of the Newly Isolated Dunaliella Strain

To valorize strains belonging to the Tunisian biotope, which have bioactive compounds that can be used in biotechnological applications, a new halotolerant microalga was isolated from Sebkha of Sidi El Hani (Sousse, Tunisia). The cell shape of our isolate varies from cylindrical, ovoid, and fusiform to about spherical. This strain is unicellular and biflagellate. The cellular size is measured as approximately 8–18 μm diameter. These characteristics are consistent with previous morphological characteristics of Dunaliella genus [19]. The 18S rRNA gene sequence of strain AL-1 (comprising about 1800 bp) was amplified using the universal primers EukA and EukB as described by Chtourou et al. [20,21] to analyze the strain phylogenetic position. Phylogenetic analysis showed that strain AL-1 is a member of Dunaliellaceae family and Dunaliella genus. The isolated strain was found to be closely affiliated to D. salina, D. quartolecta, and D. polymorpha with more than 97% similarity.
Microalgae cells change shape (fusiform to spherical) and color (green to orange) with changing cultural conditions (under optimized conditions).

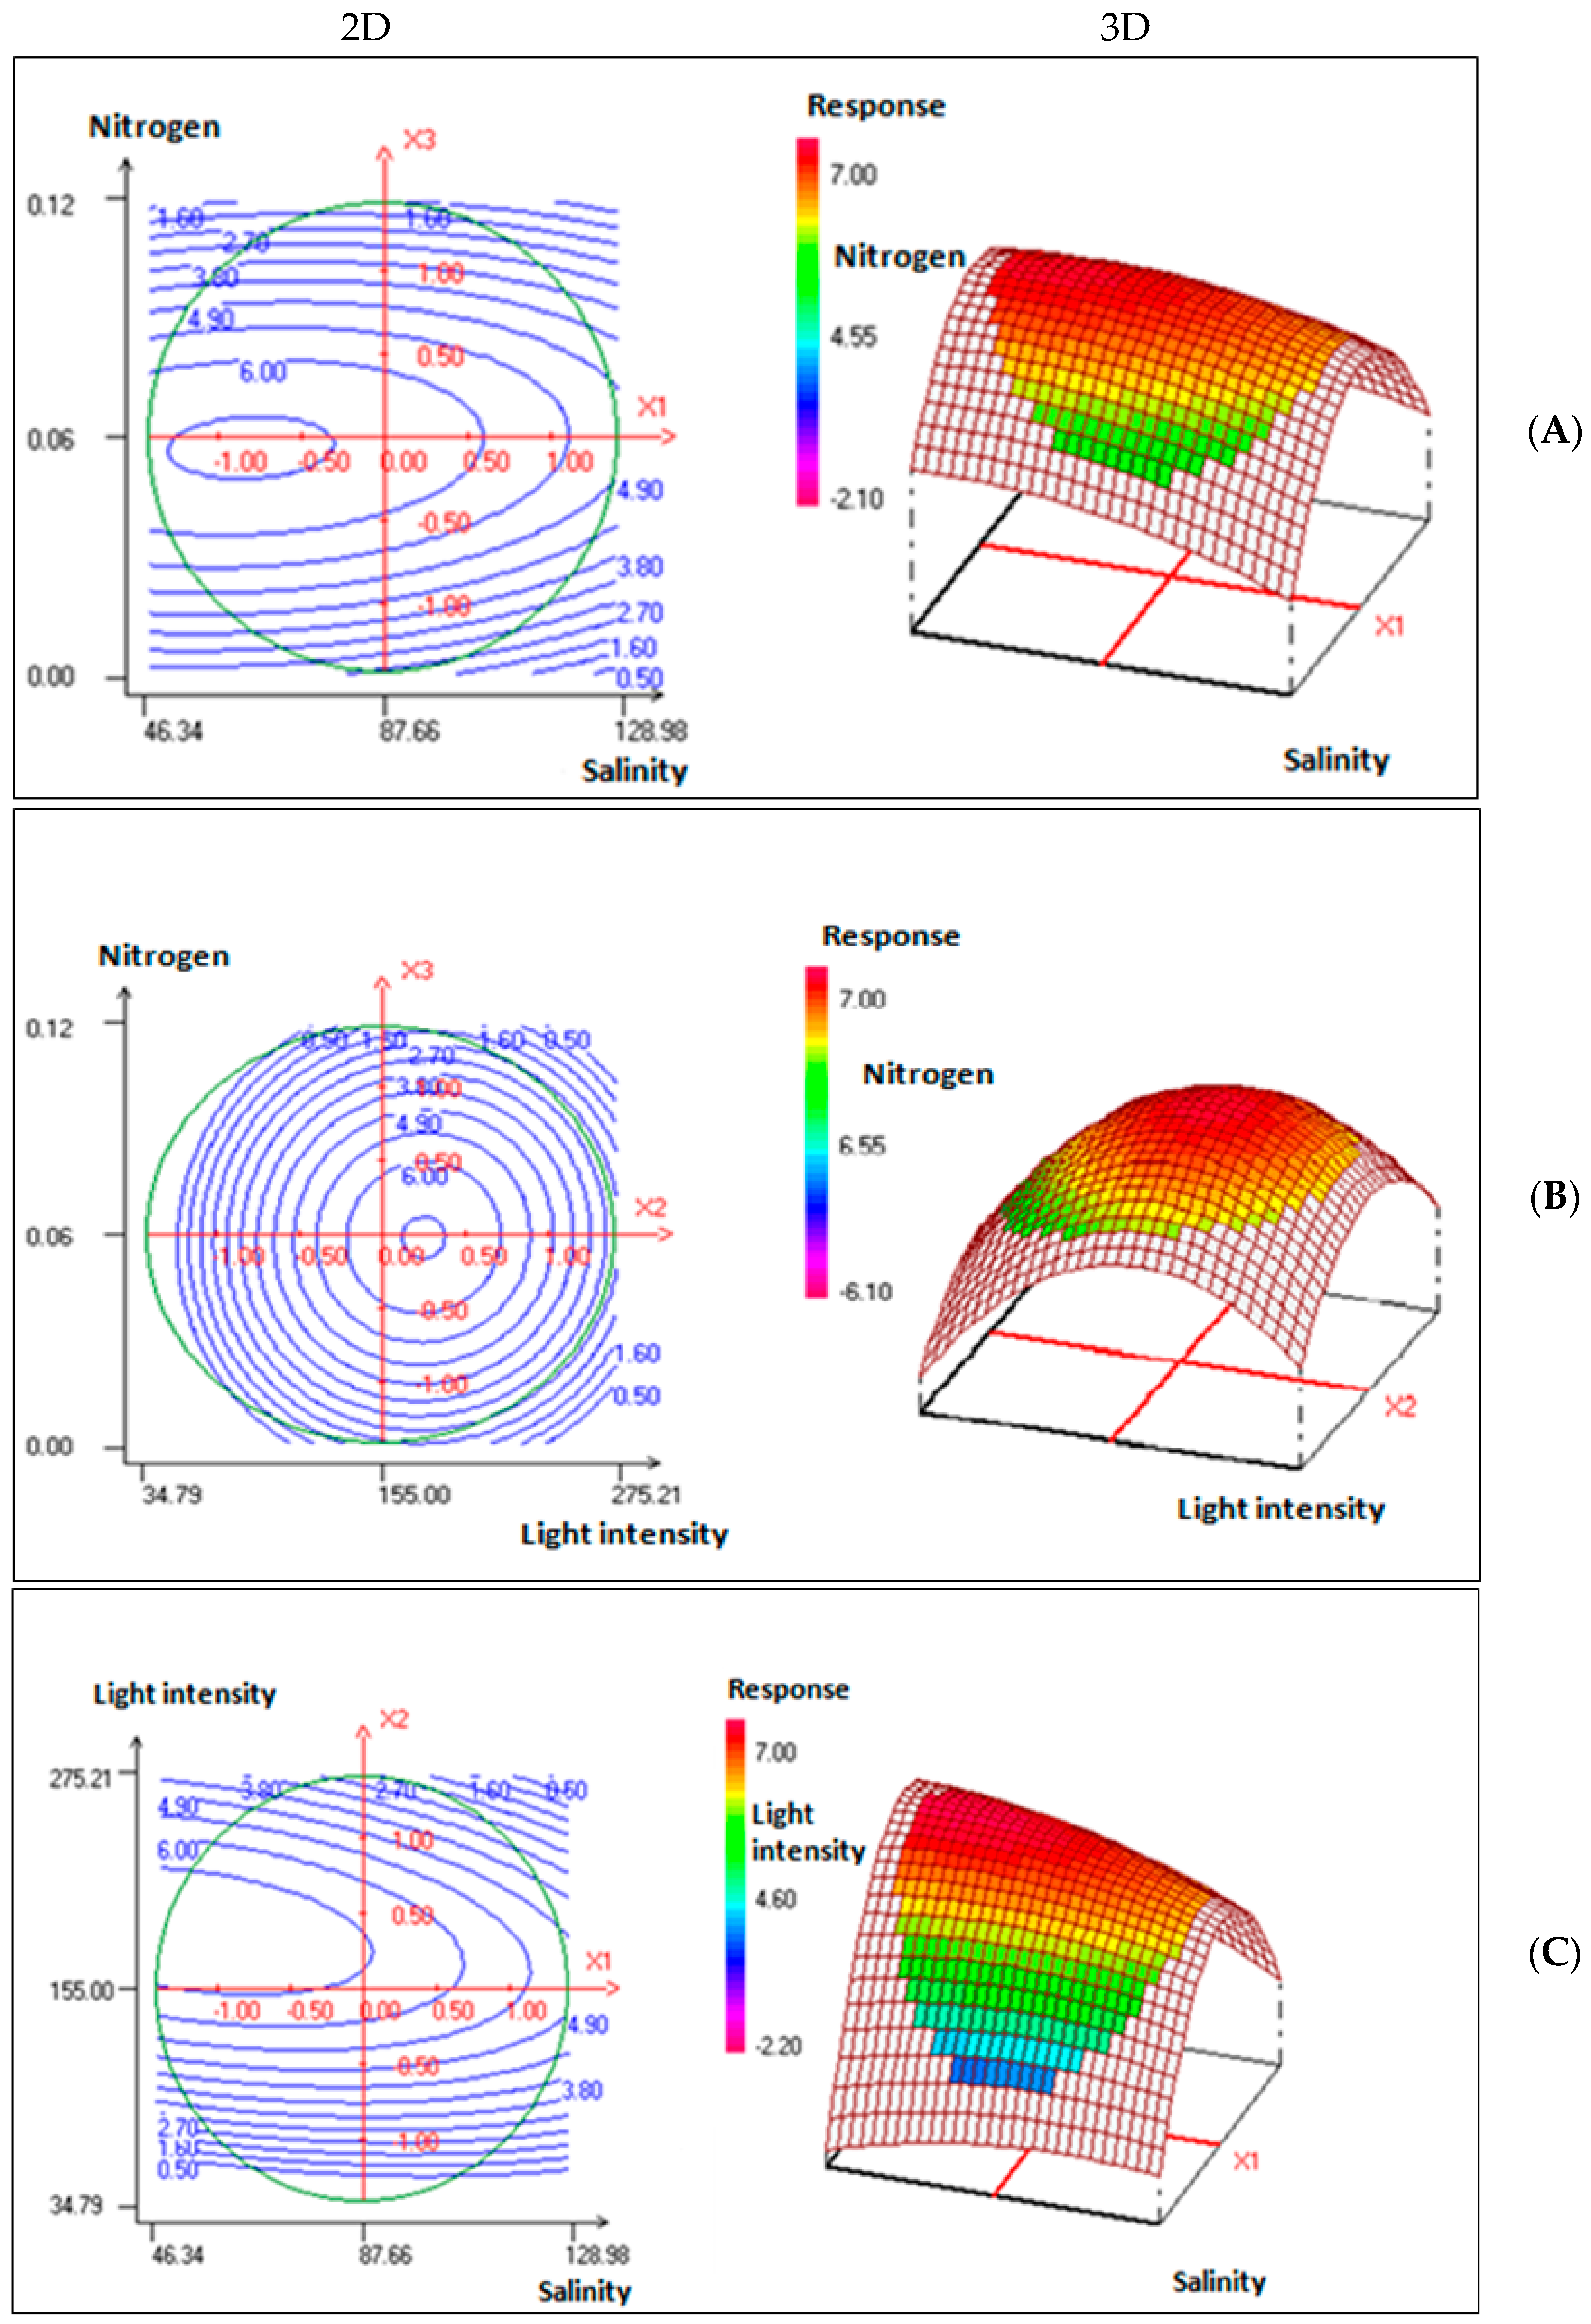
2.2. Experimental Design and Validation of Optimized Growth Conditions

Previous findings have shown that within stressful conditions such as high light intensity [10], salt concentration [9] or nitrogen deficiency [12], Dunaliella strains could accumulate a high amount of carotenoids.
In order to ameliorate the carotenoid production of our isolated strain, an optimization of the culture conditions was performed considering preliminary analyses of nitrogen concentration (NaNO3), salinity (NaCl), and light intensity (Table 1).
A response surface methodology (RSM) was then used to examine the effect of interactions between these factors on carotenoid production. Nemrod-W 2D and 3D plots (Figure 1; Table 2) show that the established model indicates that only b2 is slightly significant while the quadratic effects b22 and b33 have a very significant effect on the production of microalga carotenoids.
In fact, the carotenoid production from cultures performed at optimized conditions was three times higher than that from cultures in F/2 medium under standard conditions. It increased effectively from 1.98 mg·g−1, mass spectrometry (MS) at light intensity of 80 μmol photons·m−2·s−1, 27 salinity and 1.075 g·L−1 nitrogen to 6.86 mg∙g−1 MS at light intensity 189.89 μmol photons·m−2·s−1, 51.01 salinity and 60 mg·L−1 nitrogen. This result confirms the successful application of the Box-Behnken methodology to optimize factors and study their interaction for the best carotenoid production.
The variance’s analysis (ANOVA) through Fisher’s F test of the carotenoid production of Dunaliella sp. was performed to ensure the statistical significance and the adequacy of the model. The model was found to be significant at 95% confidence level by the F-test as shown in Table 3, with a p-value of regression ≤0.05. In addition, the model did not exhibit lack of-fit (p >0.05) denoting the failure of the model to represent data in the experimental domain at points that were excluded from the regression [22].
The obtained model quality was evaluated by calculating of the correlation coefficient value as well as the determination coefficient (R2).
The experimental results were analyzed and an approximating function of Dunaliella sp. carotenoid production was obtained in the form of the Equation (1):
Y carotenoids = 6.421 0.513 X 1 + 1.395 X 2 0.125 X 3 0.327 X 1 2 2.781 X 2 2 2.305 X 3 2 0.646 X 1 X 2 + 0.188 X 1 X 3 + 0.135 X 2 X 3 ,
where Ycarotenoids represent the predicted carotenoid content; X1 represent the salinity; X2 the light intensity, and X3 the nitrogen.
As a result, the optimized conditions for carotenoid yield were as follows: salinity, 51.01; light intensity, 189.89 μmol photons·m−2·s−1, and nitrogen, 60 mg∙L−1.
The R2 value of 0.924 for Equation (1) was relatively high and indicated that the experimental carotenoid content values are in good agreement with the predicted carotenoid production levels from this model. The interaction between each independent factor and R2 can be considered statistically significant.

2.3. Proteomic Analysis

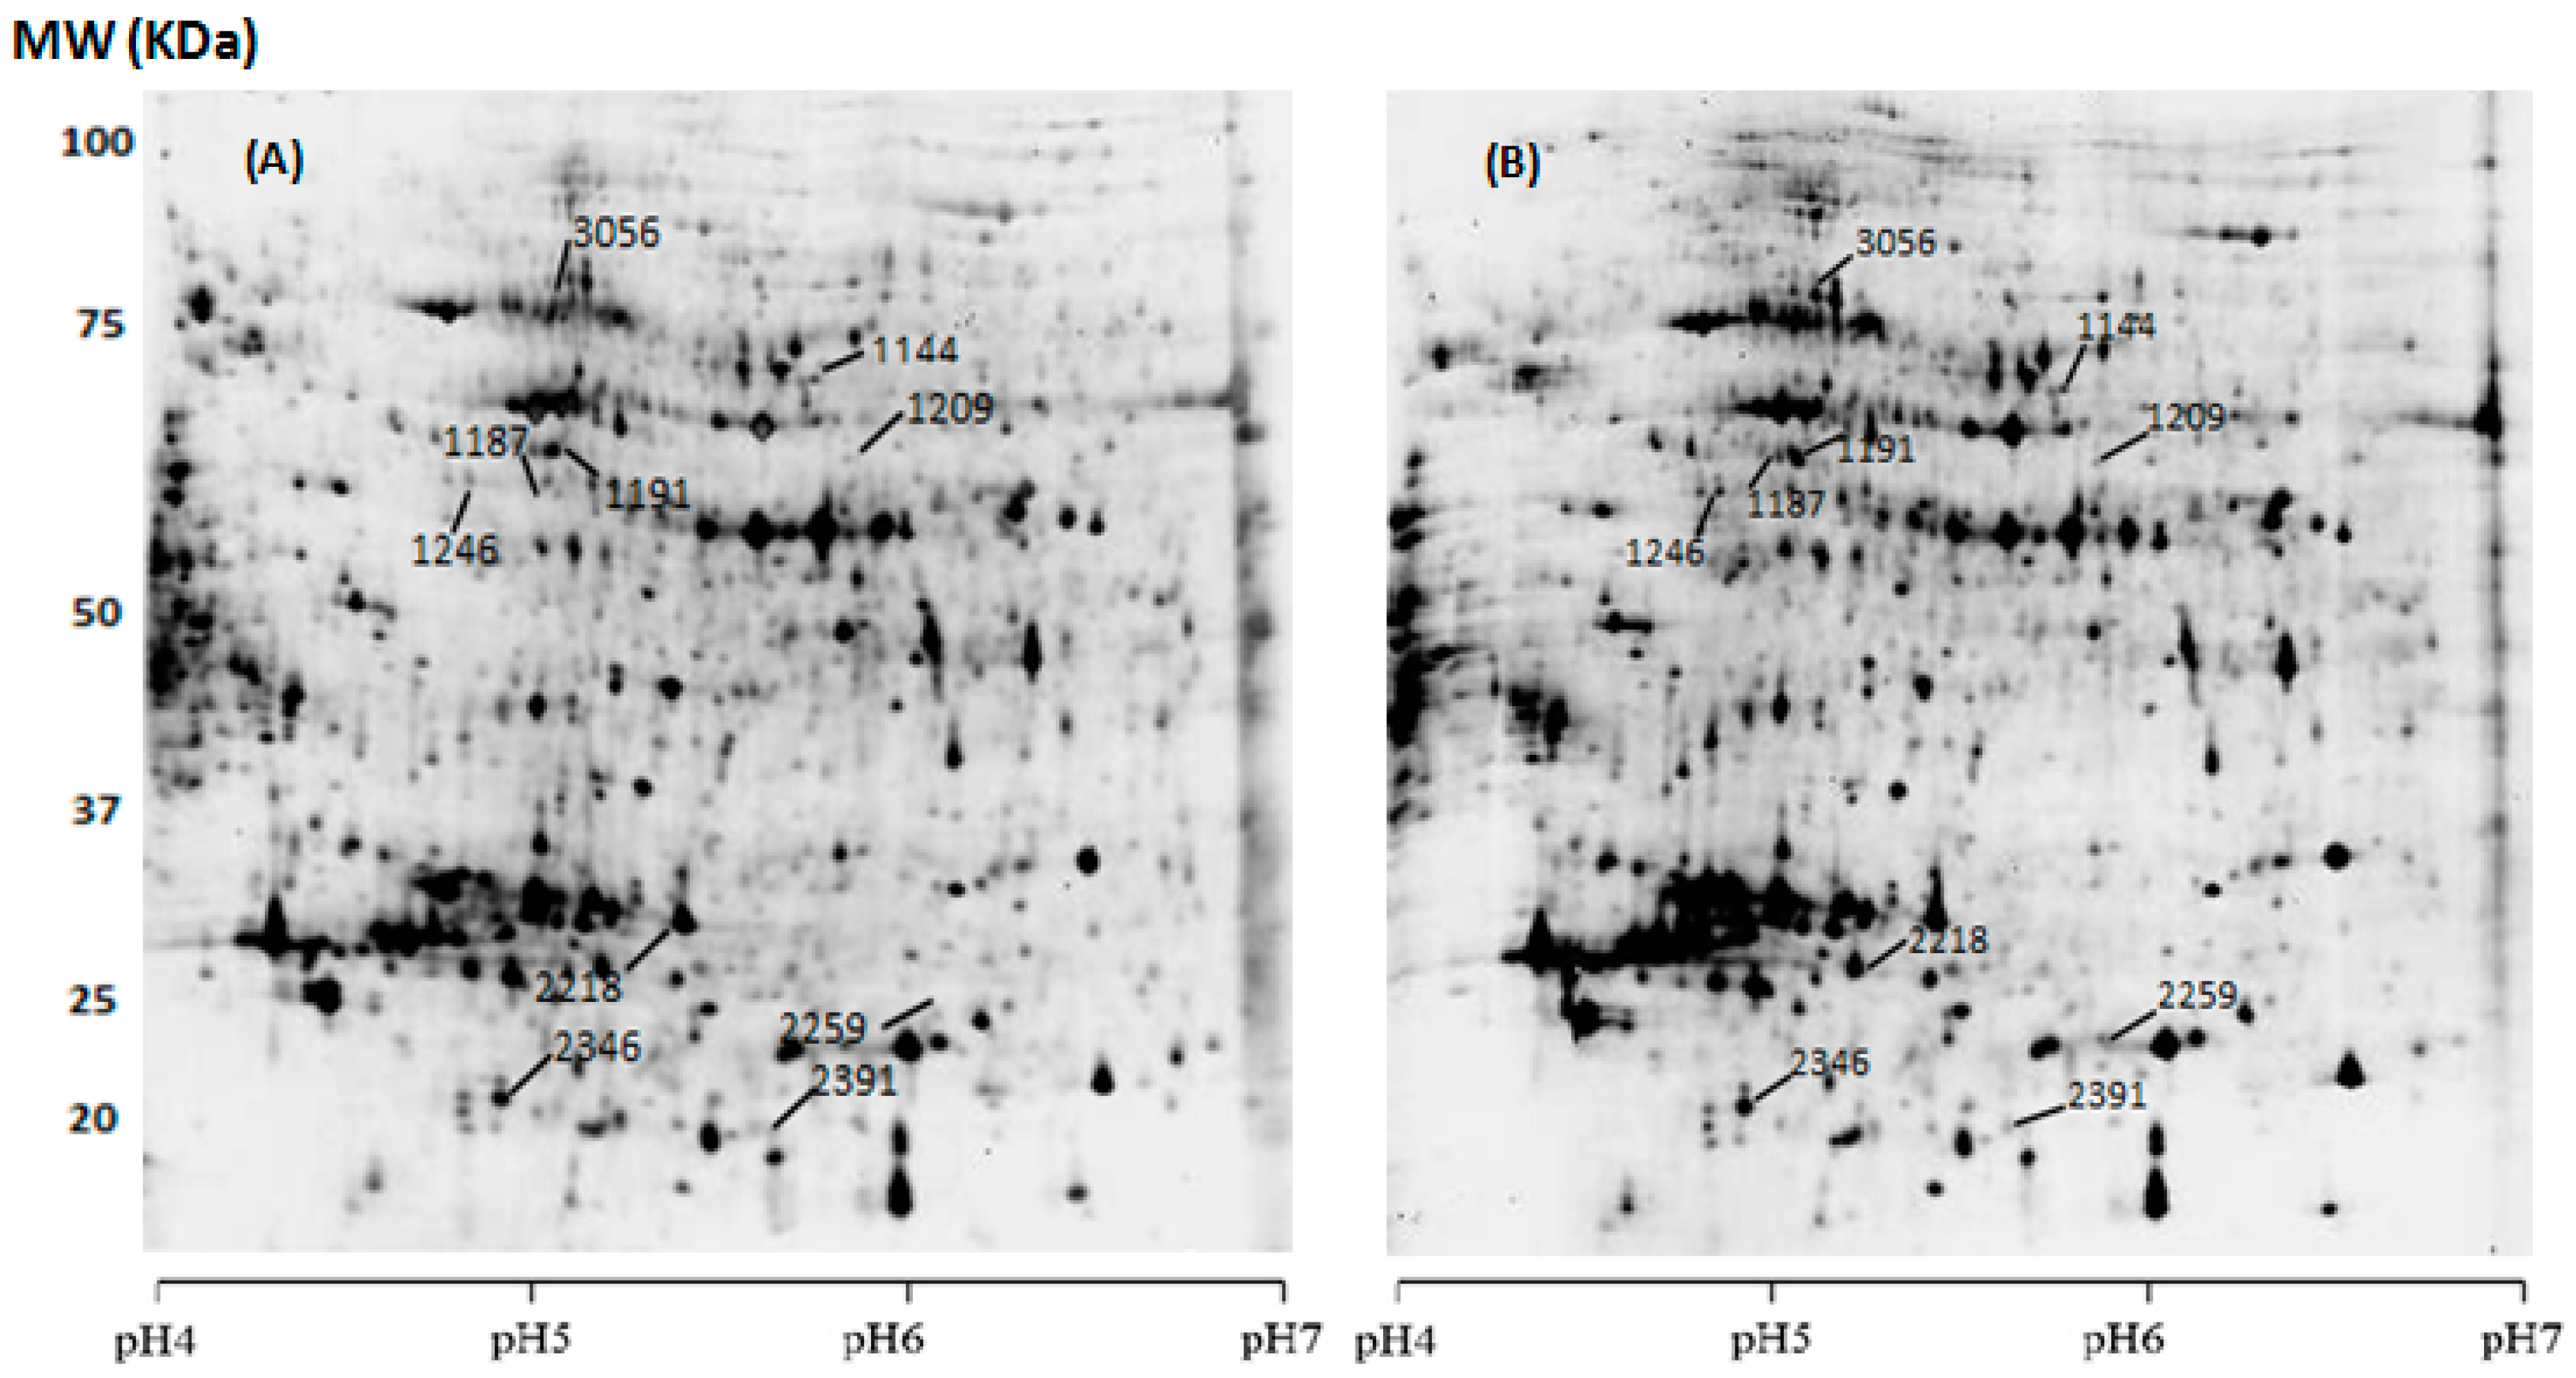
2.3.1. Two-Dimensional Electrophoresis Profiles of Total Proteins in Response to Carotenoid High Production

In order to extend our knowledge of the molecular mechanisms implicated in the production of carotenoids under stress conditions, we undertook a differential comparative proteomic analysis of the isolated strain growing in standard and optimized cultures for production of these pigments. As shown in (Figure 2) and based on SameSpot software analysis, the spots revealed significant difference in proteome from the newly isolated strain cultured in two metabolic conditions (standard and optimized). Our proteomic study resulted in analysing 1173 protein spots of which 127 were differentially expressed. Among them, 57 protein spots were down-regulated and 70 were up-regulated.
The present work showed that exposure to these stressful environmental conditions distorted the accumulation of many Dunaliella strain AL-1 proteins. These proteins were found to be involved in a different metabolic pathway positioning through KEGG (Kyoto Encyclopedia of Genes and Genomes), whose functions were involved in carbon and energy metabolism, carbohydrate metabolism, glycolysis/gluconeogenesis, protein chaperone, and cellular processes.

2.3.2. Spot Identification

Protein spots that showed consistent differences in all gel images and detected by SameSpot Software (Figure 2) were selected for automated MS/MS spectrometry analysis and peptide mass fingerprinting (Table 4 and Table 5). Table 4 also shows if the particular spot was up- or down-regulated under optimized conditions, promoting high carotenoid production. We found that 11 spots contained 16 unique proteins (Table 5). Some of these proteins, like heat shock protein (HSP), the α- and β-subunit of mitochondrial ATP synthase, enolase, carbonic anhydrase, α- and β-tubulin, were up-regulated in optimized conditions; whereas photosystem I light-harvesting cholrophyll-a/b protein and chloroplast ribulose phosphate-3-epimerase were down-regulated.

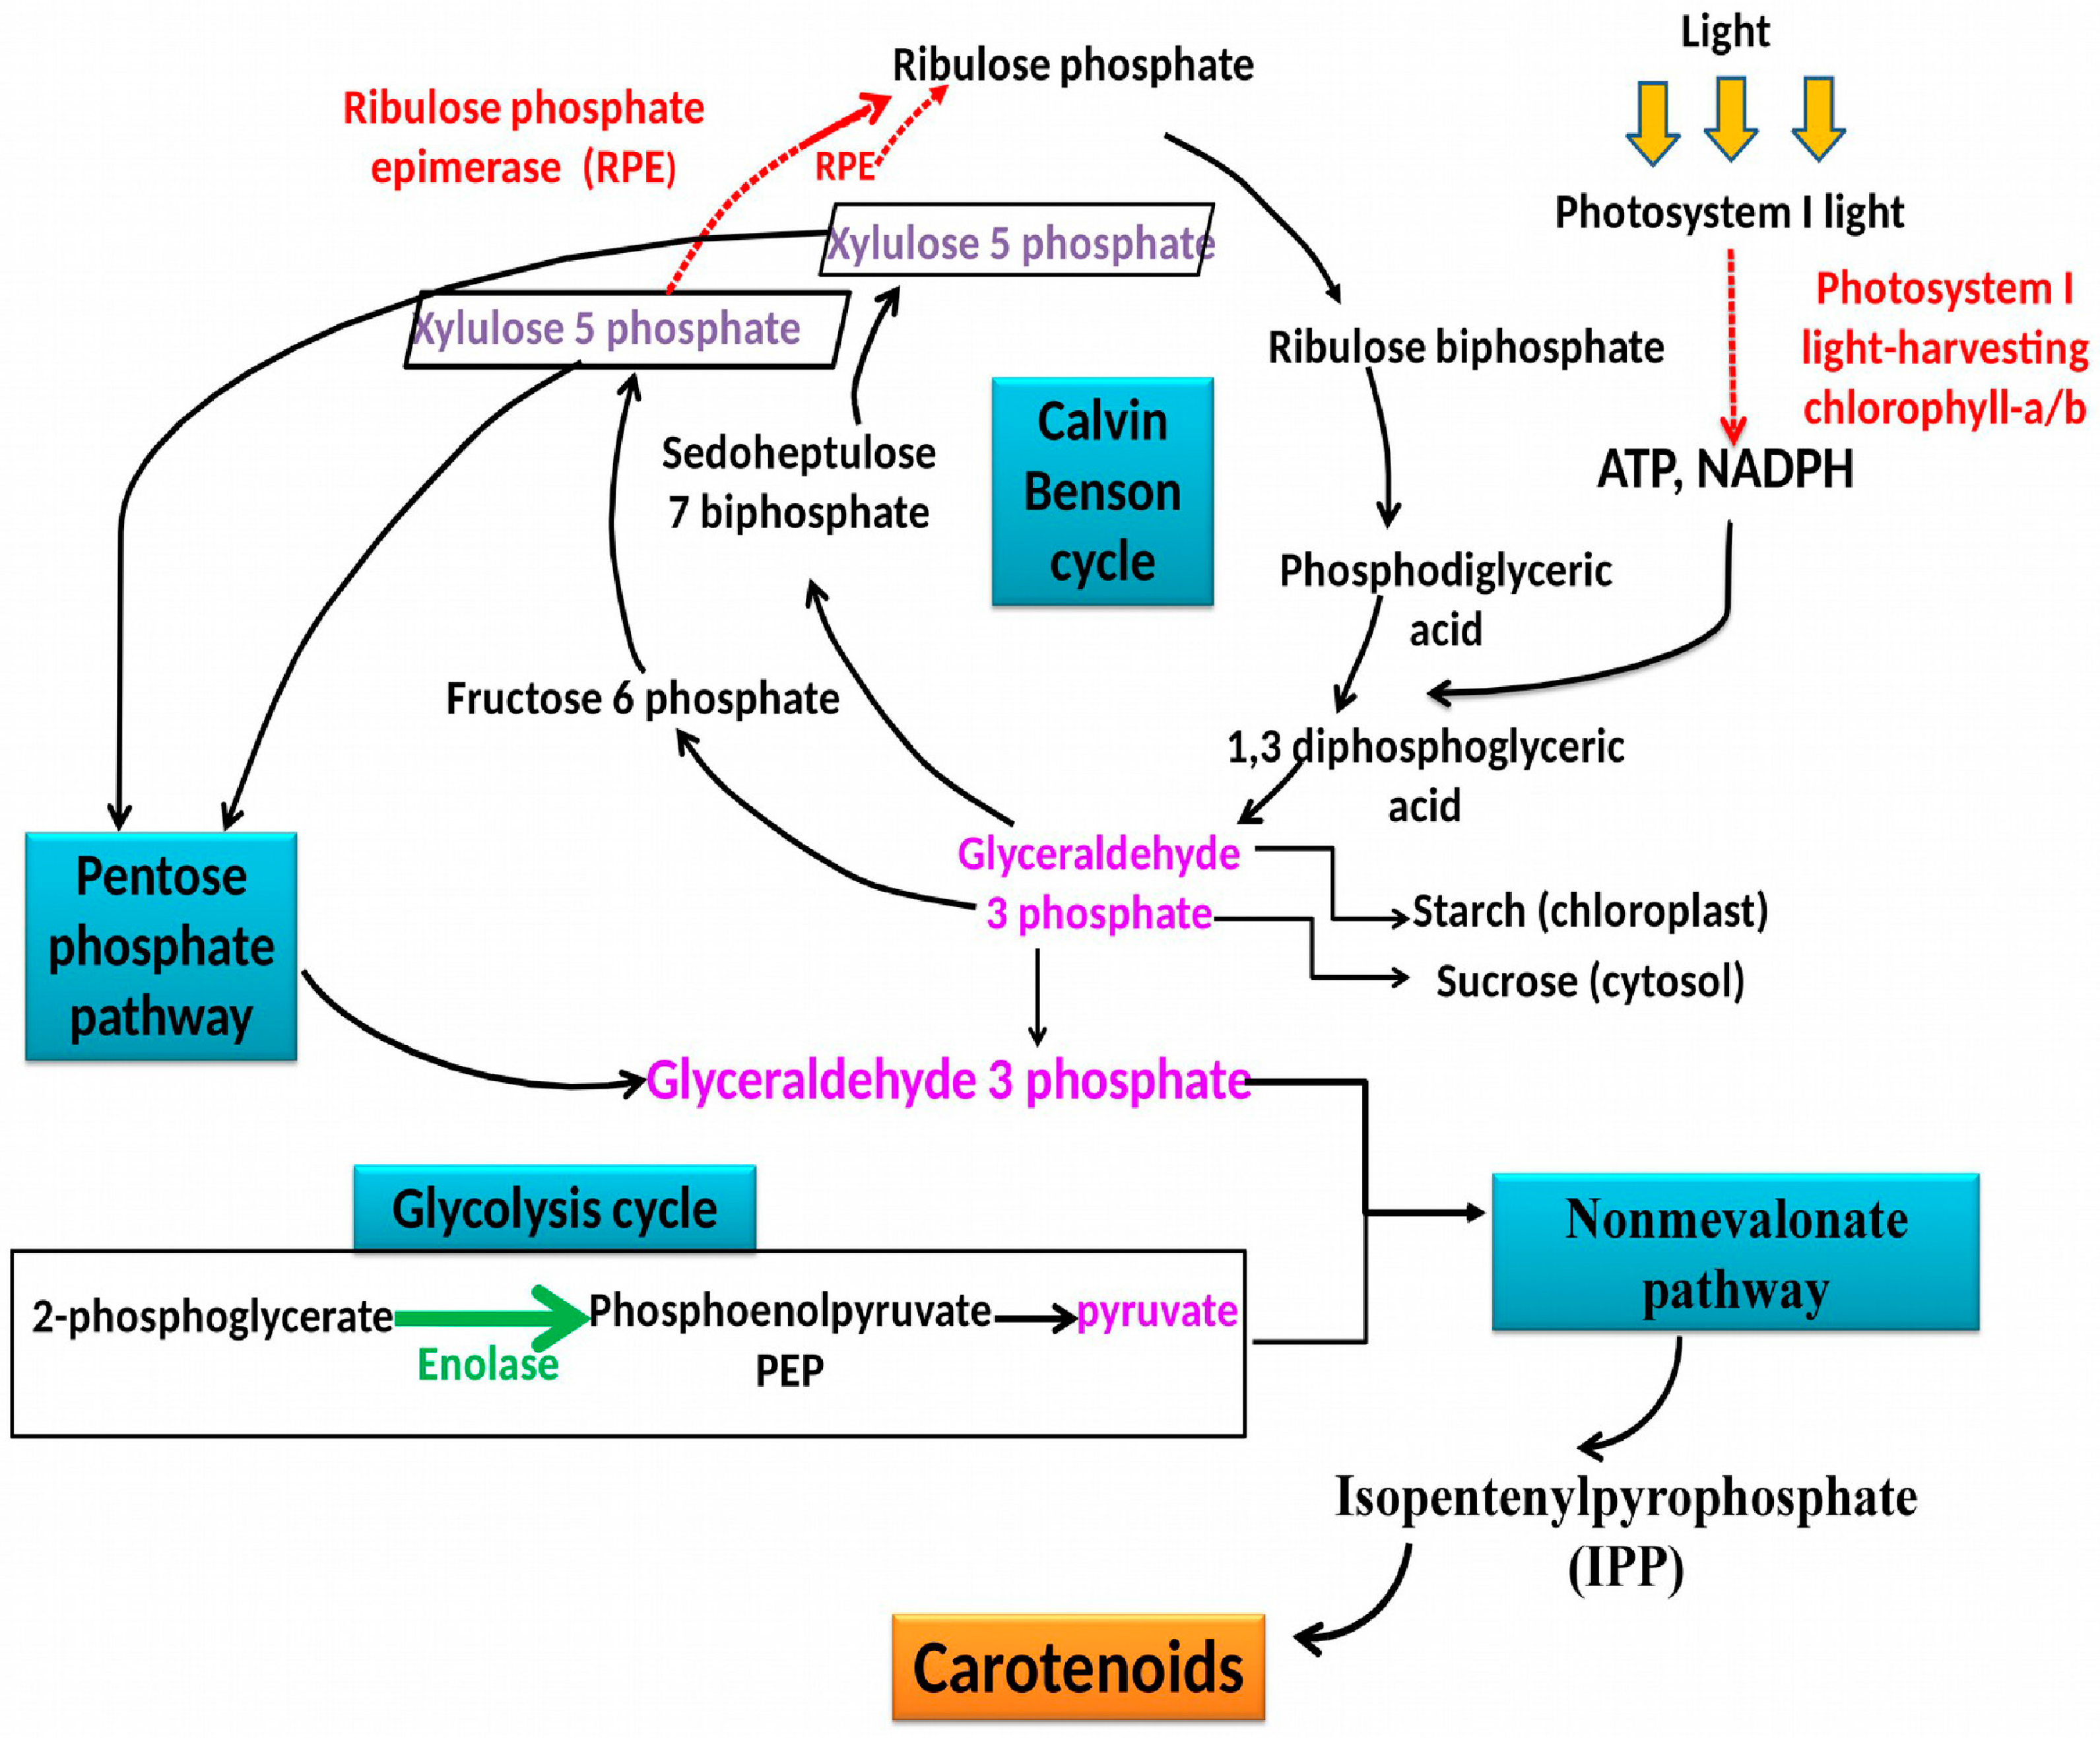
2.3.3. Functional Classification of Identified Proteins

The optimized culture conditions for carotenoid production appear to affect considerably the metabolism of Dunaliella sp. AL-1. In fact, the potential roles of the differentially expressed proteins associated with applied stress in microalga are examined below.
ATP synthase CF1 alpha and beta subunits (chloroplast) (migrated in different spots: 1209, 2218, 1187, 1246, and 1191): The enzyme related to energy metabolism, photosynthesis, and also metabolic flexibility. The great quantity of these enzymes is consistent with proteomics findings demonstrating up-regulation of energy metabolism in the Dunaliella strain at high salinity [23]. As described by Liska et al. [23], the increased level of ATP and redox energy generating enzymes suggest enhanced energy metabolism at high salt in Dunaliella salina. In accordance with these results, we found that carotenoid production was stimulated 346% at high salinity, in fact, it increased from 1.98 mg·g−1 MS under standard conditions (salinity 27) to 6.86 mg·g−1 MS under optimized conditions (salinity 51) (Figure 1). Producing more ATP and redox energy could play a role in supplying the metabolic pathways for an enhanced transport of CO2 and ions [16].
Carbonic anhydrase (spot 3056): Carbonic anhydrase, as a metalloenzyme, is found in almost every type of tissue and plays a crucial role in catalyzing the equilibration of carbon dioxide (CO2) and carbonic acid (H2CO3) [24]. It is vital for many eukaryotic physiological processes like respiration, photosynthesis, and CO2 transport. The activity regulation of carbonic anhydrase is associated with numerous factors and does not follow a similar pattern for all the studied microalgae [25]. Under high carotenoid production conditions, when the salinity reaches 51, the CO2 solubility decreases and it becomes the rate-limiting phase in photosynthesis [26]. Our analysis reveals that the carbonic anhydrase was up-regulated in AL-1Dunaliella strain. This suggests that carbonic anhydrase enhances carbon acquisition [16]. It should be noted that, previous proteomics analysis showed also an up-regulation of this enzyme with light intensity in Chlamydomonas reinhardtii [26]. Similar to the present finding, Dionisio-sese et al. [27] indicated that light caused an increase in cabII-1 transcript abundance in Chlamydomonas by virtue of its role in the light reactions of photosynthesis.
Heat shock protein HSP 70 (spots 1246 and 1256): HSPs are a group of functionally related proteins triggered by various stressful conditions. They have multiple roles including membrane translocation, protein degradation, protein folding, misfolded proteins repair, and protein homeostasis regulation in normal and stressed cells [28]. Low temperature, osmotic, salinity, oxidative, desiccation, heavy metals, UV light, nitrogen deficiency or water deprivation are among the stressful conditions for cells, which have been found to provoke the synthesis of HSPs according to several studies [29]. Therefore, up-regulation of HSP in Dunaliella can also be described altogether as part of the stress response [30]. High level expression of HSPs can be generated by exposure to different environmental stress conditions [31]. We identified in this context of stressful conditions (N deficiency, high salinity, high light intensity), two HSPs 70 kDa proteins, which were up-regulated (2.9 fold).
Several studies have shown that nitrogen starvation could induce oxidative stress in plants, which could be part of the production of stress responsive proteins. Hockin et al. found that a lower protein content associated with nitrogen starvation could limit electron transfer over the photosynthetic complex in diatoms, rising the production of ROS, and thus oxidative stress [32]. Recently, some other studies have reported increase in HSP70 expression in response to salinity stress [33,34]. Yokthongwattana et al. [6] studied the involvement of HSP70B in the repair of photodamaged Photosystem II (PSII) and showed the strong correlation between patterns of HSP70B gene expression and the rate of PSII photodamage further with a low light vs high light.
Enolase (Spot 1144): The conversion of 2-phosphoglycerate to phosphoenolpyruvate (PEP) is catalyzed by the key enzyme in the glycolytic pathway; the enolase [35]. This abundant glycolytic enzyme is absolutely a multifunctional protein and could be considered as a surface receptor and also as a heat shock protein [36]. As observed, our analysis found up-regulation of the enolase under carotenoid accumulating conditions (3.1 fold). It was noted also that enolase functions as a cell associated stress protein implicated in cellular protection during hypoxia [37]. Recently, Ruan et al. reported that enolase is involved in both temperature and salt stress in algae [38].
Chloroplast ribulose phosphate-3-epimerase (Spot 2259): Ribulose phosphate-3-epimerase is involved in the biological process and takes part in several important metabolic pathways, comprising carbohydrate biosynthesis and the Calvin cycle. This enzyme which catalyzes the reversible epimerization of d-ribulose 5-phosphate to d-xylulose 5-phosphate, showed a decrease in expression under carotenoid biosynthesis conditions (5.4 fold). On the contrary, authors have found an increase in the expression level of this protein subsequently with nitrogen deprivation in the diatom Phaeodactylum tricornutum [39]. As suggested previously by Nowitzki et al. [40] and Mastrobuoni et al. [41], the increased expression of this enzyme may participate in the increased yield of ribulose-1,5-bisphosphate, hence favoring carbon fixation and production of glyceraldehyde-3-P (G3P), which is the precursor for triglyceride biosynthesis.
Photosystem I light-harvesting chlorophyll-a/b protein 2 (Spots 2346 and 2391): Protein complexes are major components of the photosynthetic apparatus that absorb light and transfer excitation energy to the photochemical reaction [42]. Previous observations have also mentioned that the functional Chlorophyll antenna size of photosystem I (PSI) was diminished significantly in response to irradiance stress during cell growth [43]. It is concluded that excessive irradiance during cell growth induces a down-regulation of the Chlorophyll antenna size of PSI in Dunaliella AL-1.
Flagellar Proteins (Spots 1187 and 1191): In eukaryotic cells, microtubules are highly dynamic structures composed of, α- and β-tubulin heterodimers. They are known to play a key role in major processes such as cell motility, intracellular trafficking, and mitosis [44,45].
Recent studies have suggested that microtubules plays a major role in plant development as potent players in detecting stressful conditions, and as a consequent cellular response inducer [46].
Our study showed that α- and β-tubulins, known to compose the flagellum, were up-regulated in Dunaliella strain AL-1. These findings are in agreements with previous results [23] which explained the functional meaning of increased yield of cytoskeletal proteins under high salt conditions by strengthening the cell cytoskeleton. However, recent results [42] reported a down-regulation of flagellar proteins under salt stress. This metabolism is not yet well known in microalgae, but we suspect that up-regulation of tubulins in response to these stressful conditions may result in a profound reorganization of these membrane skeleton structures involved in plasma membrane integrity as well as harbouring signalling complexes and ion channels. In fact, the response of cytoskeleton protein to stress is well documented in plants. Authors have linked the changes in abundance of cytoskeleton-associated proteins to an adaptive response during osmotic stress [47]. Livanos et al., discussed well the interplay between ROS and tubulin cytoskeleton and highlighted the reorganization and remodelling of tubulin in response to ROS homeostasis [46].
Taken together, the identified carotenoid production induced proteins in Dunaliella sp. AL-1 revealed a down-regulation of PSI light proteins and ribulose phosphate-3-epimerase, an important enzyme in the Calvin cycle. These findings show that Dunaliella sp. strain AL-1 when producing a high amount of carotenoids, have a reduced photosynthetic CO2 assimilation as a consequence. Nonetheless, carbon continued to be assimilated as seen from the up-regulation of carbonic anhydrase. The latter is involved in the first step of CO2 fixation in the photorespiration process. Slowing down the light depended-photosynthesis would be offset not only by enhancing photorespiration but also by stimulating carbohydrate degradation (e.g., oxidative pentose phosphate cycle, and glycolysis cycle). In fact, as shown in (Figure 3), the down-regulation of the Calvin cycle enzyme ribulose phosphate-3-epimerase leads to the accumulation of xylulose-5P, a substrate for G3P production in the pentose phosphate cycle. Consistent with this prediction, we found that enolase, an important enzyme in the glycolysis cycle, was also up regulated under carotenoid production conditions. The accumulation of PEP molecules produced by enolase leads to an increased yield of pyruvate, the latest product of glycolysis pathway. The regulated metabolic pathways for a subsequent accumulation of G3P and pyruvate would be probably the first step of the carotenoid production by the methylerythritolphosphate (MEP) pathway.
The present data suggest that carotenoid production conditions are considered as stressful conditions for Dunaliella sp. strain AL-1, which in turn reacts by reducing photosynthetic assimilation and accelerating photorespiration. The findings revealed also an important accumulation of the xylulose-5P product. This is described for the first time, to the best of our knowledge, in carotenoid production conditions. It is suspected to play a crucial role as precursor or activator for isopentenyl pyrophosphate (IPP) production in non-mevalonate pathway (Figure 3).

3. Materials and Methods

3.1. Algal Strain, Medium and Culture Conditions

The alga used in this study was isolated from the Sebkha of Sidi El Hani (Sousse, Tunisia), which is located thirty kilometers from the south-west of Sousse. First, two hundred milliliters of each sample were filtered using a 0.22 μm pore size membrane. Subsequently each membrane was flooded into 50 mL of F/2 medium [48]. Flasks were incubated at 28 °C at a continuous illumination intensity (80 μmol photons·m−2·s−1) provided by cool-white fluorescence tubes (TL5 tungsten filament lamps; Philips Co., Taipei, Taiwan). Every two days, the cultures were visually examined and the algal development was confirmed by inverted microscopy analysis at 40× magnification (Motic microscope AE2000, Barcelona, Spain) [49].
Isolation of a pure microalga was performed by combining serial dilutions, plating, and micromanipulation techniques. In order to check the culture purity, each dilution series was microscopically analyzed.

3.2. DNA Extraction, PCR Amplification, Sequencing, and Phylogenetic Analysis

The microalgal strain was identified based on 18S rRNA gene sequence. Genomic DNA extraction was performed using Quick-G DNA MiniPrep D3006 Kit (Zymo Research, Irvine, CA, USA) as recommended by the manufacturer. The 18S rRNA gene was amplified by PCR using universal primers: EukA (5′-AACCTGGTTGATCCTGCCAGT-3′) and EukB (5′-TGATCCTTCTGCAGGTTCACCTAC-3′) [21]. PCR condition was as follows: denaturation by heating at 95 °C for 3 min and subjected to 35 cycles at 95 °C for 30 s, at 55 °C for 30 s, and at 72 °C for 2 min and a final elongation step at 72 °C for 7 min [50]. PCR products were purified and sequenced with EukA and EukB primers. All 18S DNA sequences of the isolated strains were compared to all microalgal sequences available in the Gene Bank data base using the BLAST program.

3.3. Carotenoid Analysis

To quantify carotenoids, 2 mL of each culture in their exponential phase (standard and optimized conditions) were centrifuged at 4000× g during 10 min. The pellet was solubilized in ethanol 96% and sonicated for 30 min to extract all pigments. After sonication, the solution was centrifuged at 10,000× g for 10 min and carotenoids were assayed spectrophotometrically using the Equation (2) given by Wellburn and Lichtenthaler [51].
[carotenoids] (mg·L−1) = (1000 × A470 − 2.05 × [chlorophyll a] − 114.8 [chlorophyll b])/245

3.4. Experimental Design and Data Analysis

In this present paper, a Box-Behnken design [52] was applied to optimize the best experimental conditions of three independent factors affecting the carotenoid production of Dunaliella sp.: salinity (X1), light intensity (X2), and nitrogen (X3). The amount of carotenoids (Y) was fixed as the design experiments response which could be described by a second order polynomial function. Nemrod-W® software (LPRAI, Marseille, France) was used, for the experimental design, regression and statistical analysis [49,53] (Logiciel Nemrod-W, LPRAI, Marseille, France). Table 1 and Table 2 show independents variables of the Box–Behnken plan in coded levels where Y is the response variable, β0 the constant, Xi and Xj the coded variables ranging between +1 and −1. The coefficients for the linear, quadratic, and interaction effects are. βi, βii and βij, respectively. Furthermore, the experiments were randomized to avoid systematic error, and three central replicates were added to estimate the pure experimental error. In the current work, the experiment design contained 15 trials for optimizing culture conditions and the levels of independent variables were set to three levels: low (−1), medium (0), and high (+1).

3.5. Statistical Analysis

Analysis of variance (ANOVA) was used to validate the results of carotenoid production of the RSM design.

3.6. Proteomic Analysis

3.6.1. Protein Extraction

For proteomics, 400 mL of exponential phase cultures (standard and optimized) were centrifuged at 2500× g for 20 min at 5 °C. Pellets were rinsed twice with distilled water, rapidly frozen at −80 °C then lyophilized. The lyophilized pellets were used for total protein extraction following the protocol reported by Lee and Lo [54]. In brief, cells were added by 1 mL TRIzol Reagent™ (Ambion, Invitrogen, Carlsbad, CA, USA) and protease inhibitors (Roche Diagnostics, Germany) then sonicated for 3 min using a Vibra-Cell® 75022 sonicator (Bioblock, Illkirch, France) in an ice bath. After that 200 μL of chloroform were added to the cell lysate before shaking and centrifugation for 10 min at 4 °C (12,000× g). Ethanol (300 μL) was added to the lower phase after removing the hydrophilic one. After centrifugation for 10 min at 4 °C (16,000× g), the supernatants was mixed with one volume of 20% trichloroacetic acid (TCA) and 0.14% β-mercaptoethanol, in cold acetone. After an overnight incubation, proteins were precipitated at −20 °C, the mixtures were centrifuged for 10 min at 4 °C (16,000× g). Finally, the pellets were washed with cold acetone then re-suspended in a buffer containing urea (6 M), thio-urea (2 M), CHAPS (4%), and Bio-Lyte 3/10 (2%) [55]. Two biological replicates were performed for each condition.

3.6.2. Two-Dimensional Gel Electrophoresis (2-DE)

Extracts were analyzed on analytic 2-DE gels by referring to the O’Farrell protocol [56]. The second-dimension electrophoresis was performed on 12% sodium dodecyl sulfate (SDS) polyacrylamide gels to separate proteins having molecular weight ranging from 10 to 120 kDa. 2D Clean-up kit (GE Healthcare, Freiburg, Germany) was used to purify 30 μg and 300 μg of protein for analytic and preparative gels, respectively. The aliquots were then re-suspended in 330 μL rehydration buffer containing urea (6 M), thio-urea (2 M), CHAPS (4%), Bio-Lyte 3/10 (2%), bromophenol blue (0.01%), tributylphosphine (3.3 mM), and DTT (5%). The dry immobilized pH gradient (IPG) strips (linear pH 4–7 (Bio-Rad, Marnes-la-Coquette, France)), were rehydrated for 18 h at 50 V before applying isoelectric focusing (IEF) using the Bio-Rad Protean IEF Cell at 66,000 V·h. The strips were first treated with a buffer containing urea (6 M), SDS (2%), Tris-HCl (0.05 M) pH 8.8, glycerol (30%) added with DTT (2%) and tributylphosphine (3.3 mM). Then they were treated with the same buffer supplemented this time with iodoacetamide (4%) [55]. Finally, the visualization of proteins was carried out by the silver staining and Bio-Safe colloidal Coomassie blue (Bio-Rad, Marnes-la-Coquette, France) methods for analytic and preparative gels, respectively. Two technical replicates were performed for each extract.

3.6.3. Image Acquisition and Data Analysis

Bio-Rad GS800 densitometer was used to register analytic gels images. The latter were analyzed with the Progenesis SameSpots, version 3.0, software (Nonlinear Dynamics Ltd., Newcastle, UK). The quality control (QC) of the software, was used to verify the gel’s quality. The vector alignment tool of SameSpots Workflow was employed for an automatic pixel level geometric alignment of the gels monitored by manual corrections. The background-corrected abundance of each spot was calculated, and the abundance ratio was determined by dividing the sample abundance by the reference abundance. Spot volumes were normalized to calibrate data between different sample runs, and normalized spots were then statistically analyzed by using the statistics module in SameSpots. ANOVA tests were carried out to evaluate significant differences between standard and optimized cultures. The significant differentially expressed protein spots were elaborated using the criterion a p-value <0.05 to exclude false positives, a power >0.8 to guarantee reproducibility among gels of standard and optimised cultures, and a fold number >2 for the biological significance.

3.6.4. In-Gel Tryptic Digestion and Protein Identification by Mass Spectrometry

The differentially expressed protein spots of interest were further identified by mass spectrometry (MS). Protein samples of each condition group were run in parallel on separate preparative polyacrylamide gels and stained with Coomassie brilliant blue (Colloidal Blue stain kit; Bio-Rad, Marnes-la-Coquette, France). Bands of interest were excised from gels and automated tryptic digestion was conducted as previously described [57,58]. Gel bands were excised in a sterile laminar flow hood, transferred individually to 1.5 mL microtubes and cut into cubes of roughly 1 mm3. Gel cubes were de-stained for 1 h and 30 min at 4 °C using a solution of 45% acetonitrile and 55 mM ammonium bicarbonate. After gel cube washing and in-gel trypsin proteolysis of proteins, the peptides produced were extracted onto Poros beads and purified with ZipTips (Millipore, Molsheim, France) as previously described [58].
Extracted proteolytic peptides were analyzed by nanoUltraHPLC-nanoESI UHR-QTOF MS. Experiments were performed using an UltiMate™ 3000 NanoRSLC System (Dionex, Sunnyvale, CA, USA) connected to a Bruker MaXis UHR-QTOF 2 GHz mass spectrometer equipped with an online nano-ESI ion source. The LC-MS setup was controlled by Bruker Hystar™ software version 3.2 (Bruker Daltonics, Bremen, Germany). Peptides were pre-concentrated online on a Dionex Acclaim PepMap100 C18 reverse-phase precolumn (inner diameter 100 μm, length 2 cm, particle size 5 μm, pore size 100 Å), and separated on a nanoscale Acclaim Pepmap100 C18 column (inner diameter 75 μm, length 25 cm, particle size 2 μm, pore size 100 Å) at a flowrate of 450 nL/min using a 2–35% gradient of acetonitrile in 0.1% formic acid. Peaks with the three highest intensities and a minimum of 400 ion counts were selected for collision-induced dissociation (CID) MS/MS fragmentation using an isolation window of 3–9 Da depending on the m/z value.
Acquired MS/MS spectra were searched against the UniProtKB/Swiss-Prot/TrEMBL and non-redundant protein sequences from NCBI (http://www.ncbi.nlm.nih.gov) using the Mascot identification engine (version 2.3, Matrix Science, London, UK). The search was conducted allowing for a maximum of two missed cleavages, 5 ppm tolerance for precursor ions, and 0.04 Da for fragment ions, respectively. Methionine oxidation was allowed. Since contaminations from human (mainly keratins) origin could be present in the samples analyzed, the search in databases was restricted to microalgae species. In case of peptides matching to multiple members of a protein family, the presented protein was selected based on both the highest score and the highest number of matching peptides.

4. Conclusions

The Dunaliella strain AL-1 was isolated and identified based on 18S rRNA gene sequence. Response surface methodology was used to determine the optimal experimental conditions (light intensity, salinity, and nitrogen deficiency) for high carotenoid production from the newly isolated Dunaliella AL-1 strain. In this present paper, two-dimensional gel electrophoresis (2-DE) coupled with MS-MS resulted in the understanding of some physiological changes in the cells. In fact, a larger number of different metabolic, stress, and cellular process genes were differentially-expressed under optimized conditions. This allowed us to better understand the metabolic changes in Dunaliella sp. strain AL-1 during the production of carotenoids.

Acknowledgments

We are very grateful to Gaël Bougaran (Laboratoire BRM-PBA Ifremer, Nantes, France) for his excellent technical assistance with the proteomic analysis. The authors would like to express their gratitude to Guillaume Gabant from the “Plateforme de Spectrométrie de Masse et Protéomique du Centre de Biophysique Moléculaire” (CNRS, Orléans, France) for mass spectrometry analysis.

Author Contributions

Faten Ben Amor, Slim Abdelkafi and Imen Fendri conceived of and proposed the idea; Faten Ben Amor, Fatma Elleuch, Slim Abdelkafi and Imen Fendri designed the study; Faten Ben Amor, Fatma Elleuch, Mohamed Barkallah, Matthieu Garnier and Hajer Ben Hlima performed the experiments; Faten Ben Amor, Mohamed Barkallah, Matthieu Garnier, Bruno Saint-Jean, Hajer Ben Hlima, Chantal Pichon, Slim Abdelkafi, and Imen Fendri participated in data analysis; Faten Ben Amor, Hajer Ben Hlima, Bruno Saint-Jean, Slim Abdelkafi, and Imen Fendri contributed to writing and revising the manuscript. All authors read and approved the final manuscript.

Conflicts of Interest

The authors declare no conflict of interest.

References

  1. Hosseini Tafreshi, A.; Shariati, M. Dunaliella biotechnology: Methods and applications. J. Appl. Microbiol. 2009, 107, 14–35. [Google Scholar] [CrossRef] [PubMed]
  2. Foo, S.C.; Yusoff, F.M.; Ismail, M.; Basri, M.; Yau, S.K.; Khong, N.M.; Chan, K.W.; Ebrahimi, M. Antioxidant capacities of fucoxanthin-producing algae as influenced by their carotenoid and phenolic contents. J. Biotechnol. 2017, 241, 175–183. [Google Scholar] [CrossRef] [PubMed]
  3. Ben Hsouna, A.; Hamdi, N.; Miladi, R.; Abdelkafi, S. Myrtus communis essential oil: Chemical composition and antimicrobial activities against food spoilage pathogens. Chem. Biodivers. 2014, 11, 571–580. [Google Scholar] [CrossRef] [PubMed]
  4. Ibañez, E.; Cifuentes, A. Benefits of using algae as natural sources of functional ingredients. J. Sci. Food Agric. 2013, 93, 703–709. [Google Scholar] [CrossRef] [PubMed]
  5. Emtyazjoo, M.; Moghadasi, Z.; Rabbani, M.; Emtyazjoo, M.; Samadi, S.; Mossaffa, N. Anticancer effect of Dunaliella salina under stress and normal conditions against skin carcinoma cell line A431 in vitro. Iran. J. Fish. Sci. 2012, 11, 283–293. [Google Scholar]
  6. Yokthongwattana, K.; Chrost, B.; Behrman, S.; Casper-Lindley, C.; Melis, A. Photosystem II damage and repair cycle in the green alga Dunaliella salina: Involvement of a chloroplast-localized HSP70. Plant Cell Physiol. 2001, 42, 1389–1397. [Google Scholar] [CrossRef] [PubMed]
  7. Lao, Y.-M.; Xiao, L.; Luo, L.-X.; Jiang, J.-G. Hypoosmotic expression of Dunaliella bardawil ζ-carotene desaturase is attributed to a hypoosmolarity-responsive element different from other key carotenogenic genes. Plant Physiol. 2014, 165, 359–372. [Google Scholar] [CrossRef] [PubMed]
  8. Ben-Amotz, A.; Avron, M. The Role of Glycerol in the osmotic regulation of the halophilic alga Dunaliella parva. Plant Physiol. 1973, 51, 875–878. [Google Scholar] [CrossRef] [PubMed]
  9. Fazeli, M.R.; Tofighi, H.; Samadi, N.; Jamalifar, H. Effects of salinity on beta-carotene production by Dunaliella tertiolecta DCCBC26 isolated from the Urmia salt lake, north of Iran. Bioresour. Technol. 2006, 97, 2453–2456. [Google Scholar] [CrossRef] [PubMed]
  10. Hejazi, M.A.; Wijffels, R.H. Effect of light intensity on β-carotene production and extraction by Dunaliella salina in two-phase bioreactors. Biomol. Eng. 2003, 20, 171–175. [Google Scholar] [CrossRef]
  11. Xu, Y.; Ibrahim, I.M.; Harvey, P.J. The influence of photoperiod and light intensity on the growth and photosynthesis of Dunaliella salina (chlorophyta) CCAP 19/30. Plant Physiol. Biochem. 2016, 106, 305–315. [Google Scholar] [CrossRef] [PubMed]
  12. Mojaat, M.; Pruvost, J.; Foucault, A.; Legrand, J. Effect of organic carbon sources and Fe2+ ions on growth and β-carotene accumulation by Dunaliella salina. Biochem. Eng. J. 2008, 39, 177–184. [Google Scholar] [CrossRef]
  13. Avron, M. The osmotic components of halotolerant algae. Trends Biochem. Sci. 1986, 11, 5–6. [Google Scholar] [CrossRef]
  14. Guarnieri, M.T.; Nag, A.; Smolinski, S.L.; Darzins, A.; Seibert, M.; Pienkos, P.T. Examination of triacylglycerol biosynthetic pathways via de novo transcriptomic and proteomic analyses in an unsequenced microalga. PLoS ONE 2011, 6, e25851. [Google Scholar] [CrossRef] [PubMed]
  15. Katz, A.; Waridel, P.; Shevchenko, A.; Pick, U. Salt-induced changes in the plasma membrane proteome of the halotolerant alga Dunaliella salina as revealed by blue native gel electrophoresis and nano-LC-MS/MS analysis. Mol. Cell. Proteom. 2007, 6, 1459–1472. [Google Scholar] [CrossRef] [PubMed]
  16. Juin, C.; Bonnet, A.; Nicolau, E.; Bérard, J.B.; Devillers, R.; Thiéry, V.; Cadoret, J.P.; Picot, L. UPLC-MSE profiling of Phytoplankton metabolites: Application to the identification of pigments and structural analysis of metabolites in Porphyridium purpureum. Mar. Drugs 2015, 13, 2541–2558. [Google Scholar] [CrossRef] [PubMed]
  17. Brechlin, P.; Jahn, O.; Steinacker, P.; Cepek, L.; Kratzin, H.; Lehnert, S.; Jesse, S.; Mollenhauer, B.; Kretzschmar, H.A.; Wiltfang, J.; et al. Cerebrospinal fluid-optimized two-dimensional difference gel electrophoresis (2-D DIGE) facilitates the differential diagnosis of Creutzfeldt-Jakob disease. Proteomics 2008, 8, 4357–4366. [Google Scholar] [CrossRef] [PubMed]
  18. Jin, T.; Hu, L.-S.; Chang, M.; Wu, J.; Winblad, B.; Zhu, J. Proteomic identification of potential protein markers in cerebrospinal fluid of GBS patients. Eur. J. Neurol. 2007, 14, 563–568. [Google Scholar] [CrossRef] [PubMed]
  19. Oren, A. A hundred years of Dunaliella research: 1905–2005. Saline Syst. 2005, 1, 2. [Google Scholar] [CrossRef] [PubMed] [Green Version]
  20. Chtourou, H.; Dahmen, I.; Jebali, A.; Karray, F.; Hassairi, I.; Abdelkafi, S.; Ayadi, H.; Sayadi, S.; Dhouib, A. Characterization of Amphora sp., a newly isolated diatom wild strain, potentially usable for biodiesel production. Bioprocess Biosyst. Eng. 2015, 38, 1381–1392. [Google Scholar] [CrossRef] [PubMed]
  21. Chtourou, H.; Dahmen, I.; Hassairi, I.; Abdelkafi, S.; Sayadi, S.; Dhouib, A. Dunaliella sp. a wild algal strain isolated from the Sfax-Tunisia solar evaporating salt-ponds, a high potential for biofuel production purposes. J. Biobased Mater. Bioenergy 2014, 8, 27–34. [Google Scholar] [CrossRef]
  22. Ahmad, A.L.; Wong, S.S.; Teng, T.T.; Zuhairi, A. Optimization of coagulation-flocculation process for pulp and paper mill effluent by response surface methodological analysis. J. Hazard. Mater. 2007, 145, 162–168. [Google Scholar] [CrossRef] [PubMed]
  23. Liska, A.J.; Shevchenko, A.; Pick, U.; Katz, A. Enhanced photosynthesis and redox energy production contribute to salinity tolerance in Dunaliella as revealed by homology-based proteomics. Plant Physiol. 2004, 136, 2806–2817. [Google Scholar] [CrossRef] [PubMed]
  24. Smith, K.S.; Ferry, J.G. Prokaryotic carbonic anhydrases. FEMS Microbiol. Rev. 2000, 24, 335–366. [Google Scholar] [CrossRef] [PubMed]
  25. Aizawa, K.; Miyachi, S. Carbonic anhydrase and CO2 concentrating mechanisms in microalgae and cyanobacteria. FEMS Microbiol. Lett. 1986, 39, 215–233. [Google Scholar] [CrossRef]
  26. Eriksson, M.; Villand, P.; Gardeström, P.; Samuelsson, G. Induction and regulation of expression of a low-CO2-induced mitochondrial carbonic anhydrase in Chlamydomonas reinhardtii. Plant Physiol. 1998, 116, 637–641. [Google Scholar] [CrossRef] [PubMed]
  27. Dionisio-Sese, M.L.; Fukuzawa, H.; Miyachi, S. Light-induced carbonic anhydrase axpression in Chlamydomonas reinhardtii. Plant Physiol. 1990, 94, 1103–1110. [Google Scholar] [CrossRef] [PubMed]
  28. Guo, R.; Youn, S.H.; Ki, J.-S. Heat shock protein 70 and 90 genes in the harmful dinoflagellate Cochlodinium polykrikoides: Genomic structures and transcriptional responses to environmental stresses. Int. J. Genom. 2015, 2015, e484626. [Google Scholar]
  29. Li, Z.; Srivastava, P. Heat-shock proteins. Curr. Protoc. Immunol. 2004, Appendix 1. Appendix 1T. [Google Scholar] [CrossRef]
  30. Santoro, M.G. Heat shock factors and the control of the stress response. Biochem. Pharmacol. 2000, 59, 55–63. [Google Scholar] [CrossRef]
  31. Choi, Y.E.; Kwon, K.W.; Lee, J.C.; Woo, S.Y. Expression of the rice cytoplasmic cysteine synthase gene in tobacco reduces ozone-induced damage. Plant Biotechnol. Rep. 2007, 1, 93–100. [Google Scholar] [CrossRef]
  32. Hockin, N.L.; Mock, T.; Mulholland, F.; Kopriva, S.; Malin, G. The response of diatom central carbon metabolism to nitrogen starvation is different from that of green algae and higher plants. Plant Physiol. 2012, 158, 299–312. [Google Scholar] [CrossRef] [PubMed] [Green Version]
  33. Larsen, P.F.; Nielsen, E.E.; Koed, A.; Thomsen, D.S.; Olsvik, P.A.; Loeschcke, V. Interpopulation differences in expression of candidate genes for salinity tolerance in winter migrating anadromous brown trout (Salmo trutta L.). BMC Genet. 2008, 9, 12. [Google Scholar] [CrossRef] [PubMed] [Green Version]
  34. Tine, M.; Bonhomme, F.; McKenzie, D.J.; Durand, J.-D. Differential expression of the heat shock protein Hsp70 in natural populations of the tilapia, Sarotherodon melanotheron, acclimatised to a range of environmental salinities. BMC Ecol. 2010, 10, 11. [Google Scholar] [CrossRef] [PubMed]
  35. Wang, W.-X.; Li, K.-L.; Chen, Y.; Lai, F.-X.; Fu, Q. Identification and function analysis of enolase gene NlEno1 from Nilaparvata lugens (Stål) (Hemiptera: Delphacidae). J. Insect Sci. 2015, 15. [Google Scholar] [CrossRef] [PubMed]
  36. Pancholi, V. Multifunctional alpha-enolase: Its role in diseases. Cell. Mol. Life Sci. CMLS 2001, 58, 902–920. [Google Scholar] [CrossRef] [PubMed]
  37. Aaronson, R.M.; Graven, K.K.; Tucci, M.; McDonald, R.J.; Farber, H.W. Non-neuronal enolase is an endothelial hypoxic stress protein. J. Biol. Chem. 1995, 270, 27752–27757. [Google Scholar] [CrossRef] [PubMed]
  38. Ruan, K.; Duan, J.; Bai, F.; Lemaire, M.; Ma, X.; Bai, L. Function of Dunaliella salina (Dunaliellaceae) enolase and its expression during stress. Eur. J. Phycol. 2009, 44, 207–214. [Google Scholar] [CrossRef]
  39. Yang, Z.-K.; Ma, Y.-H.; Zheng, J.-W.; Yang, W.-D.; Liu, J.-S.; Li, H.-Y. Proteomics to reveal metabolic network shifts towards lipid accumulation following nitrogen deprivation in the diatom Phaeodactylum tricornutum. J. Appl. Phycol. 2013, 26, 73–82. [Google Scholar] [CrossRef] [PubMed]
  40. Nowitzki, U.; Wyrich, R.; Westhoff, P.; Henze, K.; Schnarrenberger, C.; Martin, W. Cloning of the amphibolic Calvin cycle/OPPP enzyme d-ribulose-5-phosphate 3-epimerase (EC 5.1.3.1) from spinach chloroplasts: Functional and evolutionary aspects. Plant Mol. Biol. 1995, 29, 1279–1291. [Google Scholar] [CrossRef] [PubMed]
  41. Mastrobuoni, G.; Irgang, S.; Pietzke, M.; Aßmus, H.E.; Wenzel, M.; Schulze, W.X.; Kempa, S. Proteome dynamics and early salt stress response of the photosynthetic organism Chlamydomonas reinhardtii. BMC Genom. 2012, 13, 215. [Google Scholar] [CrossRef] [PubMed]
  42. Jia, Y.-L.; Chen, H.; Zhang, C.; Gao, L.-J.; Wang, X.-C.; Qiu, L.-L.; Wu, J.-F.; Jia, Y.-L.; Chen, H.; Zhang, C.; et al. Proteomic analysis of halotolerant proteins under high and low salt stress in Dunaliella salina using two-dimensional differential in-gel electrophoresis. Genet. Mol. Biol. 2016, 39, 239–247. [Google Scholar] [CrossRef] [PubMed]
  43. Smith, B.M.; Morrissey, P.J.; Guenther, J.E.; Nemson, J.A.; Harrison, M.A.; Allen, J.F.; Melis, A. Response of the photosynthetic apparatus in Dunaliella salina (Green Algae) to irradiance stress. Plant Physiol. 1990, 93, 1433–1440. [Google Scholar] [CrossRef] [PubMed]
  44. Parker, A.L.; Kavallaris, M.; McCarroll, J.A. Microtubules and their role in cellular stress in cancer. Front. Oncol. 2014, 4, 153. [Google Scholar] [CrossRef] [PubMed]
  45. Willem, S.; Srahna, M.; Devos, N.; Gerday, C.; Loppes, R.; Matagne, R.F. Protein adaptation to low temperatures: A comparative study of α-tubulin sequences in mesophilic and psychrophilic algae. Extremophiles 1999, 3, 221–226. [Google Scholar] [CrossRef] [PubMed]
  46. Livanos, P.; Galatis, B.; Apostolakos, P. The interplay between ROS and tubulin cytoskeleton in plants. Plant Signal. Behav. 2014, 9, e28069. [Google Scholar] [CrossRef] [PubMed]
  47. Kosová, K.; Prášil, I.T.; Vítámvás, P. Protein contribution to plant salinity response and tolerance acquisition. Int. J. Mol. Sci. 2013, 14, 6757–6789. [Google Scholar] [CrossRef] [PubMed]
  48. Guillard, R.R.L. Culture of Phytoplankton for Feeding Marine Invertebrates. In Culture of Marine Invertebrate Animals; Smith, W.L., Chanley, M.H., Eds.; Springer: New York, NY, USA, 1975; pp. 29–60. ISBN 978-1-4615-8716-3. [Google Scholar]
  49. Dammak, M.; Haase, S.M.; Miladi, R.; Ben Amor, F.; Barkallah, M.; Gosset, D.; Pichon, C.; Huchzermeyer, B.; Fendri, I.; Denis, M.; et al. Enhanced lipid and biomass production by a newly isolated and identified marine microalga. Lipids Health Dis. 2016, 15, 209. [Google Scholar] [CrossRef] [PubMed]
  50. Fendri, I.; Chaari, A.; Dhouib, A.; Jlassi, B.; Abousalham, A.; Carrière, F.; Sayadi, S.; Abdelkafi, S. Isolation, identification and characterization of a new lipolytic Pseudomonas sp., strain AHD-1, from Tunisian soil. Environ. Technol. 2010, 31, 87–95. [Google Scholar] [CrossRef] [PubMed]
  51. Wellburn, A.R.; Lichtenthaler, H. Formulae and program to determine total carotenoids and chlorophylls A and B of leaf extracts in different solvents. In Advances in Agricultural Biotechnology; Sybesma, C., Ed.; Advances in Photosynthesis Research; Springer: Dordrecht, The Netherland, 1984; pp. 9–12. ISBN 978-90-247-2943-2. [Google Scholar]
  52. Box, G.E.P.; Behnken, D.W. Some new three level designs for the study of quantitative variables. Technometrics 1960, 2, 455–475. [Google Scholar] [CrossRef]
  53. Mathieu, J.E.; Heffner, T.S.; Goodwin, G.F.; Salas, E.; Cannon-Bowers, J.A. The influence of shared mental models on team process and performance. J. Appl. Psychol. 2000, 85, 273–283. [Google Scholar] [CrossRef] [PubMed]
  54. Lee, F.W.-F.; Lo, S.C.-L. The use of Trizol reagent (phenol/guanidine isothiocyanate) for producing high quality two-dimensional gel electrophoretograms (2-DE) of dinoflagellates. J. Microbiol. Methods 2008, 73, 26–32. [Google Scholar] [CrossRef] [PubMed]
  55. Garnier, M.; Carrier, G.; Rogniaux, H.; Nicolau, E.; Bougaran, G.; Saint-Jean, B.; Cadoret, J.P. Comparative proteomics reveals proteins impacted by nitrogen deprivation in wild-type and high lipid-accumulating mutant strains of Tisochrysis lutea. J. Proteom. 2014, 105, 107–120. [Google Scholar] [CrossRef] [PubMed]
  56. O’Farrell, P.H. High resolution two-dimensional electrophoresis of proteins. J. Biol. Chem. 1975, 250, 4007–4021. [Google Scholar] [PubMed]
  57. Abdelkafi, S.; Abousalham, A.; Fendri, I.; Ogata, H.; Barouh, N.; Fouquet, B.; Scheirlinckx, F.; Villeneuve, P.; Carrière, F. Identification of a new phospholipase D in Carica papaya latex. Gene 2012, 499, 243–249. [Google Scholar] [CrossRef] [PubMed]
  58. Ben Halima, N.; Khemakhem, B.; Fendri, I.; Ogata, H.; Baril, P.; Pichon, C.; Abdelkafi, S. Identification of new oat β-amylase by functional proteomics. Biochim. Biophys. Acta 2016, 1864, 52–61. [Google Scholar] [CrossRef] [PubMed]
Figure 1. (A) Contour plots and response surface plot showing the effect of nitrogen, salinity concentration, and their mutual interaction on fixed light intensity. (B) Contour plots and response surface plot showing the effect of nitrogen concentration, light intensity, and their mutual interaction on salinity concentration fixed. (C) Contour plots and response surface plot showing the effect of light intensity, salinity concentration, and their mutual interaction on nitrogen concentration fixed.
Marinedrugs 15 00293 g001
Figure 2. 2-DE of whole cell proteoms of Dunaliella AL-1 strain at exponential phase of standard (A) and optimized (B) cultures. Proteins of both cultures at exponential phase were extracted. For each technical duplicates, 30 μg of whole cell proteins were separated on a pH 4–7 gradient and 12% polyacrylamide sodium dodecyl sulfate (SDS) gel and then revealed by silver staining. Six gels were included for image and statistical analysis. Identified spots by mass spectrometry (MS) are localized on the gels.
Marinedrugs 15 00293 g002
Figure 3. Schematic presentation of the regulated metabolic pathways under carotenoid production conditions in Dunaliella strain AL-1. Red dotted arrows indicate the down regulated enzymes while green thick arrows show the up regulated enzyme identified in this work. Blue boxes denote pathway names.
Marinedrugs 15 00293 g003
Table 1. Variables and experimental levels for optimizing culture conditions.
FactorCoded SymboleLevel
−10+1
SalinityX158.4487.66116.88
Light intensity (μmol photons·m−2·s−1)X270155240
Nitrogen·(g·L−1)X30.020.060.1
Table 2. Statistical analysis of the coefficients for carotenoid response.
CoefficientValueStudent’s t TestSignificance (%)
b06.42110.770.0120 a
b1−0.513−1.4121.9
b21.3953.821.24 c
b3−0.125−0.3474.6
b11−0.327−0.6156.9
b22−2.781−5.170.355 b
b33−2.305−4.290.781 b
b12−0.646−1.2526.6
b130.1880.3673.1
b230.1350.2680.5
a Significant at 99.9%, b Significant at 99%, c Significant at 95%.
Table 3. Variance analysis for carotenoid production response.
Source of VariationSum of SquaresDegrees of FreedomMean SquareRatioSignificance (%)Significance
Regression64.476897.16416.71472.47 cSignificant
Residual5.334651.0669---
Lack of fit5.148331.716118.4235.2Not significant
Error0.186320.0932---
Total69.81114----
R2 = 0.924; c Significant at 95%.
Table 4. Identification of Dunaliella strain AL-1 proteins induced by carotenoid production conditions.
Spot NumberHypothetical FunctionANOVA (p)FoldStandard ConditionsStressful ConditionsUp/Down
1144Enolase3.218 × 10−43.12.936 × 1058.967 × 105up
3056Carbonic anhydrase5.285 × 10−43.11.958 × 1066.082 × 106up
1246ATP synthase CF1 beta subunit (chloroplast)0.0014.13.382 × 1051.370 × 106up
1209ATP synthase CF1 alpha subunit (chloroplast)0.0023.41.002 × 1053.448 × 105up
1187beta-tubulin, partial0.0033.12.854 × 1058.967 × 105up
2391Photosystem I light-harvesting chlorophyll-a/b protein0.0053.54.321 × 1061.227 × 106down
1191ATP synthase CF1 beta subunit (chloroplast)0.0115.04.455 × 1052.232 × 106up
2259Chloroplast ribulose phosphate -3-epimerase0.0145.42.089 × 1063.860 × 105down
2218ATP synthase CF1 alpha subunit (chloroplast)0.0212.73.416 × 1061.273 × 106up
2346Photosystem I light-harvesting chlorophyll-a/b protein 20.0862.17.220 × 1063.412 × 106down
1255Heat shock protein HSP700.0212.93.357 × 1059.837 × 105up
Table 5. Mass spectrometry (MS) identification of spots.
ClassSpot NumberMW [kDa]/pI TheoreticalScoreSC [%]PeptidesHypothetical FunctionProtein Accession Number
Carbon and energy metabolism305664.2/4.6130.44.24Carbonic anhydraseP54212
120954.5/5.262.44.82ATP synthase CF1 alpha subunit (chloroplast)ACS95056
221854.5/5.2100.75.02ATP synthase CF1 alpha subunit (chloroplast)ACS95056
118751.8/4.83017.789.682ATP synthase CF1 beta subunit (chloroplast)ACS95063
124651.8/4.871.79.82ATP synthase CF1 beta subunit (chloroplast)ACS95063
119151.8/4.8754.640.613ATP synthase CF1 beta subunit (chloroplast)ACS95063
225928.2/967.98.32Chloroplast ribulose phosphate-3-epimeraseAEF79975
Carbohydrate metabolism (Glycolysis/Gluconeogenesis)114452.1/5.32202.855.551EnolaseAIJ00881
Protein chaperon (stress)125571.7/5.2459.211.813Heat shock protein HSP70CAB71138
124671.7/5.2217.68.25Heat shock protein HSP70CAB71138
Photosynthesis239124.7/6.4200.015.45Photosystem I light-harvesting chlorophyll-a/b proteinACN94453
234624.7/6.4161.916.74harvesting chlorophyll-a/b protein 2ACN94453
Cellular Processes (Cytoskeleton)118739.1/4.7952.746.122beta-tubulin, partialAAY84712
118749.4/4.9326.519.79alpha-tubulin proteinAEF79970
119139.1/4.71683.357.347beta-tubulin, partialAAY84712
119149.4/4.9489.926.613alpha-tubulin proteinAEF79970

