2.2. Dicitrinone B Inhibits the Proliferation of Multiple Tumor Types
A previous study reported that dicitrinone B showed moderate cytotoxic activities against four tumor cell lines [
6]. To examine its effect on other tumor cells, twenty tumor cell lines derived from eight different types of tumors were used for evaluating cell growth inhibition. As shown in
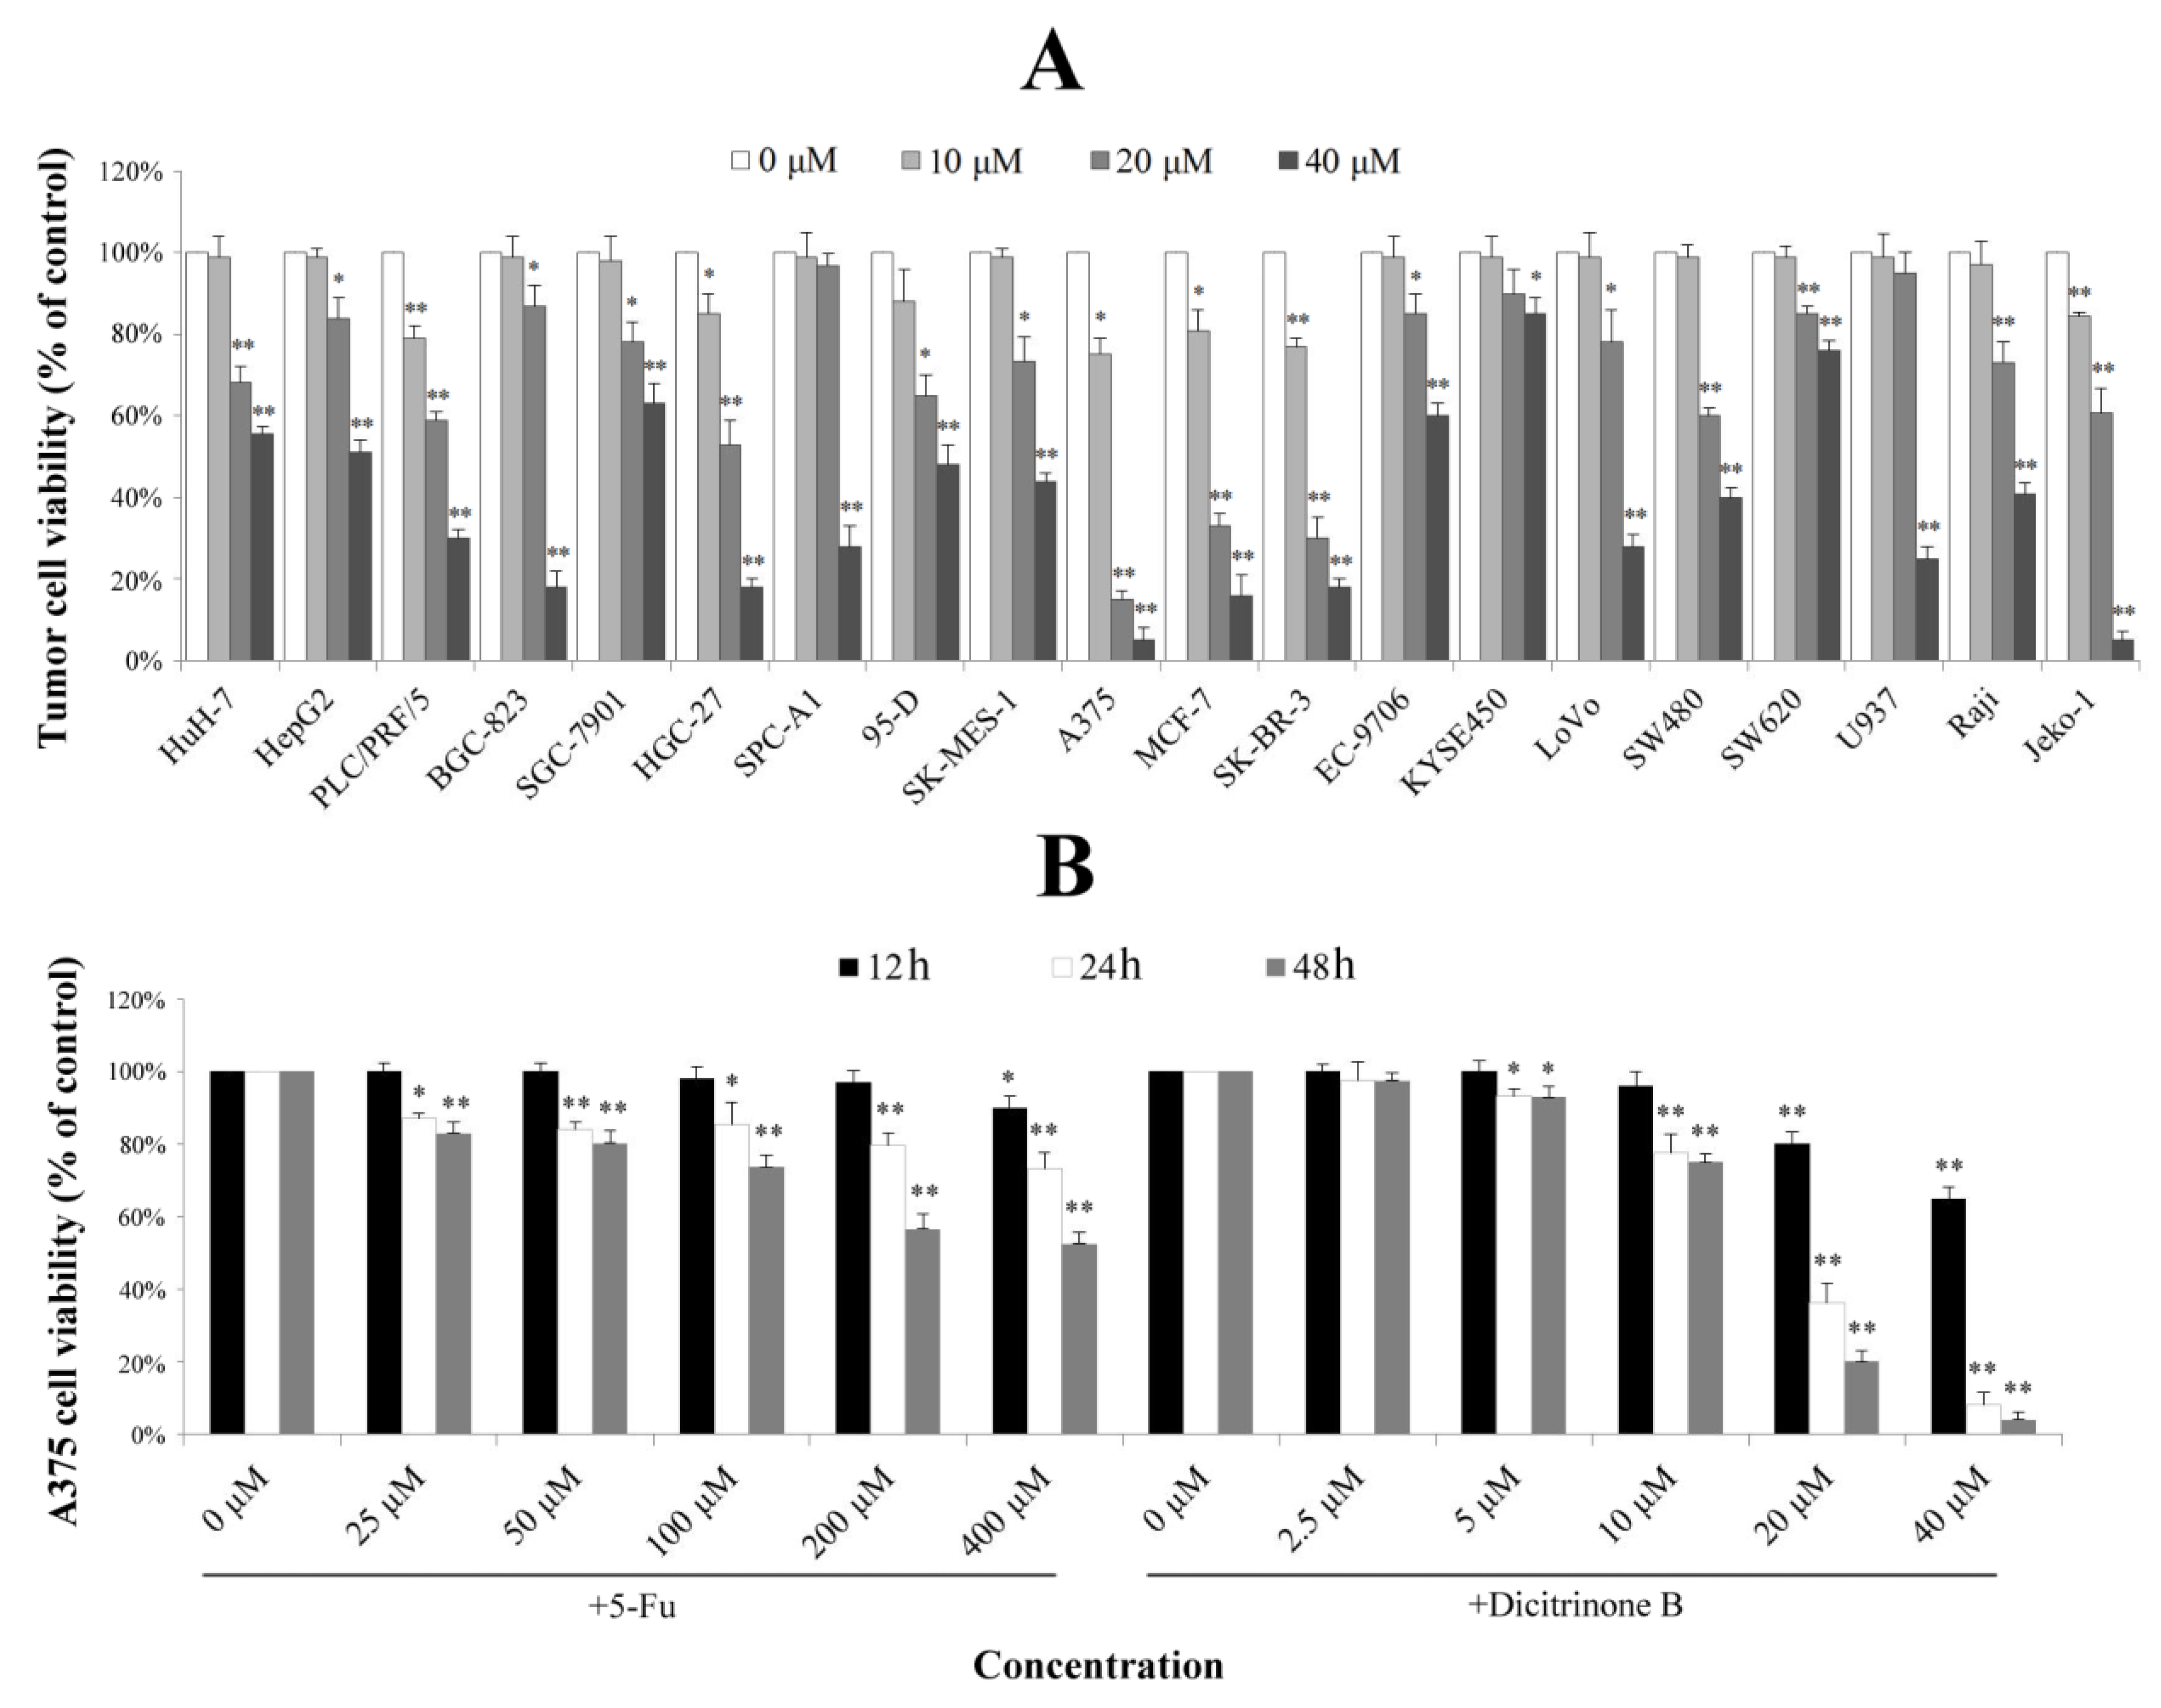
Figure 2A, different tumor cell lines had different levels of proliferation inhibition after being treated with gradient concentrations of dicitrinone B for 48 h. The IC
50 values of the three most sensitive cell lines, including malignant melanoma cell line A375 and breast cancer cell lines SK-BR-3 and MCF-7, were 13.38 μM, 14.28 μM and 15.70 μM, respectively. Since the malignant melanoma cell line, A375, was the most sensitive, we finally chose it as the target cell line for further study. The effect of the first-line chemotherapy drug, 5-fluorouracil (5-Fu), was also tested as a positive control on A375 cells. The results showed that the viability of A375 cells by dicitrinone B presented a slightly lower change compared to the cells treated with ten times the concentration of 5-Fu after 12 h of treatment; when the exposure time reached 24 h, the viability of cells treated with 20 μM and 40 μM of dicitrinone B was more significantly decreased compared to that of cells treated with ten times the concentration of 5-Fu, and it dropped to 36.17% and 8.16%, respectively; the viability for 48 h under dicitrinone B treatment presented slightly lower growth than did the 24-h group and still presented a stronger effect compared to 5-Fu (
Figure 2B). The IC
50 of dicitrinone B for 24 h was 16.61 μM, while the IC
50 of 5-Fu was more than 40 μM, revealing that dicitrinone B treatment inhibits A375 cell growth in a dose-and time-dependent manner and has more potent anticancer activity than 5-Fu.
Figure 2.
Dicitrinone B inhibits the proliferation of multiple tumor types. (A) The effects of dicitrinone B on multiple tumor types by WST-1 assay after tumor cells exposure to zero, 10, 20 and 40 μM of dicitrinone B for 48 h. (B) A375 cells were treated with dicitrinone B (zero, 2.5, five, 10, 20 and 40 μM) or 5-fluorouracil (5-Fu) (zero, 25, 50, 100, 200 and 400 μM) for 12, 24 and 48 h. The viability of cells was determined by WST-1 assay. The data are presented as the means ± SD from at least five independent experiments. Significant differences between the treatment and control groups are indicated as * (p < 0.05) or ** (p < 0.01).
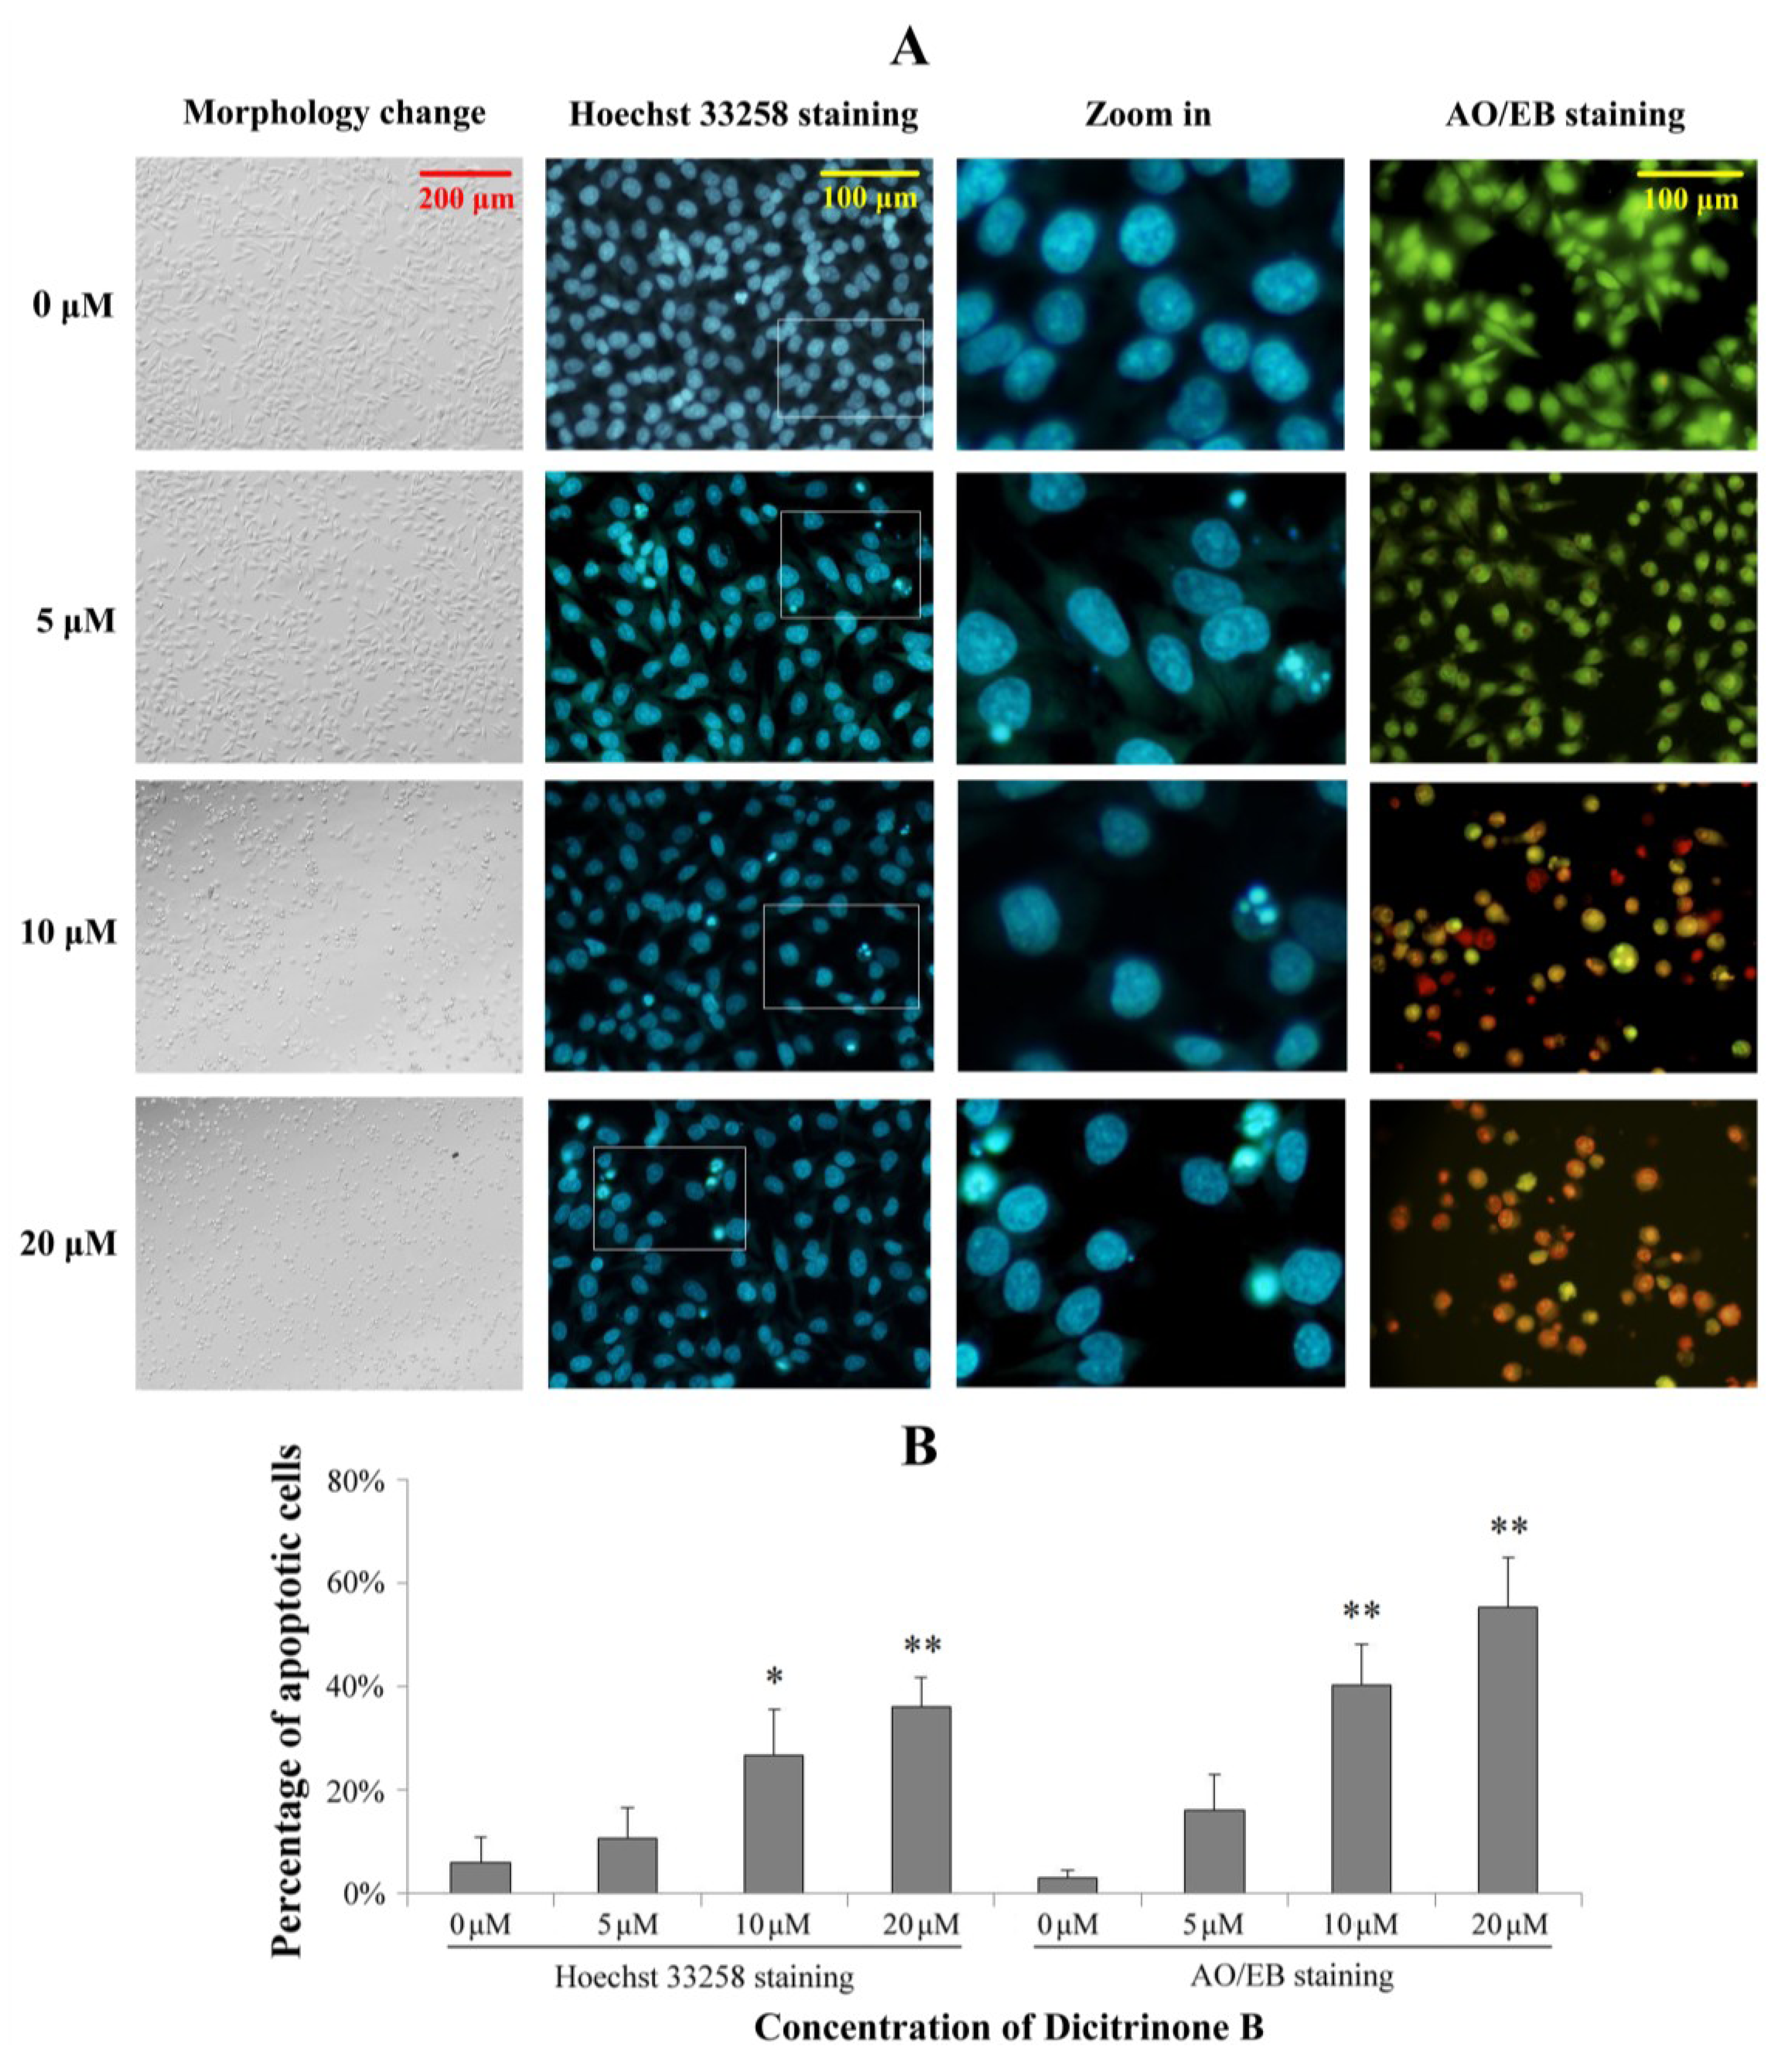
Figure 3.
Dicitrinone B induces significant apoptotic morphological changes. (A) After being exposed to zero, five, 10 and 20 μM of dicitrinone B for 24 h, A375 cells were stained by Hoechst 33258 or acridine orange/ethidium bromide (AO/EB). (B) Quantification of the proportion of apoptotic cells detected by Hoechst 33258 staining and AO/EB staining. Data are presented as the mean ± SD from three independent experiments. Significant differences between the treatment and control groups are indicated as * (p < 0.05) or ** (p < 0.01).
2.3. Dicitrinone B Induces Significant Apoptotic Morphological Changes in A375 Cells
To determine whether the growth inhibitory activity of dicitrinone B was related to the induction of apoptosis, a morphological assay was performed using the Hoechst 33258 staining and acridine orange/ethidium bromide (AO/EB) staining. As shown in
Figure 3, the proportion of apoptotic cells with chromatin condensation and apoptotic bodies were increased to 26.71% and 35.92% after exposed to 10 and 20 μM of dicitrinone B, while the control group was mainly living cells with normal nuclei. The AO/EB double staining results also showed green early apoptotic cells, with nuclear margination and chromatin condensation occurring when treated with 5 μM of dicitrinone B, and 40.24% and 55.15% of orange later apoptotic cells with fragmented chromatin were observed when the concentration of dicitrinone B raised to 10 μM and 20 μM, respectively, indicating that dicitrinone B could cause obvious cellular morphological change, such as cellular shrinkage, and induce apoptosis in A375 cells.
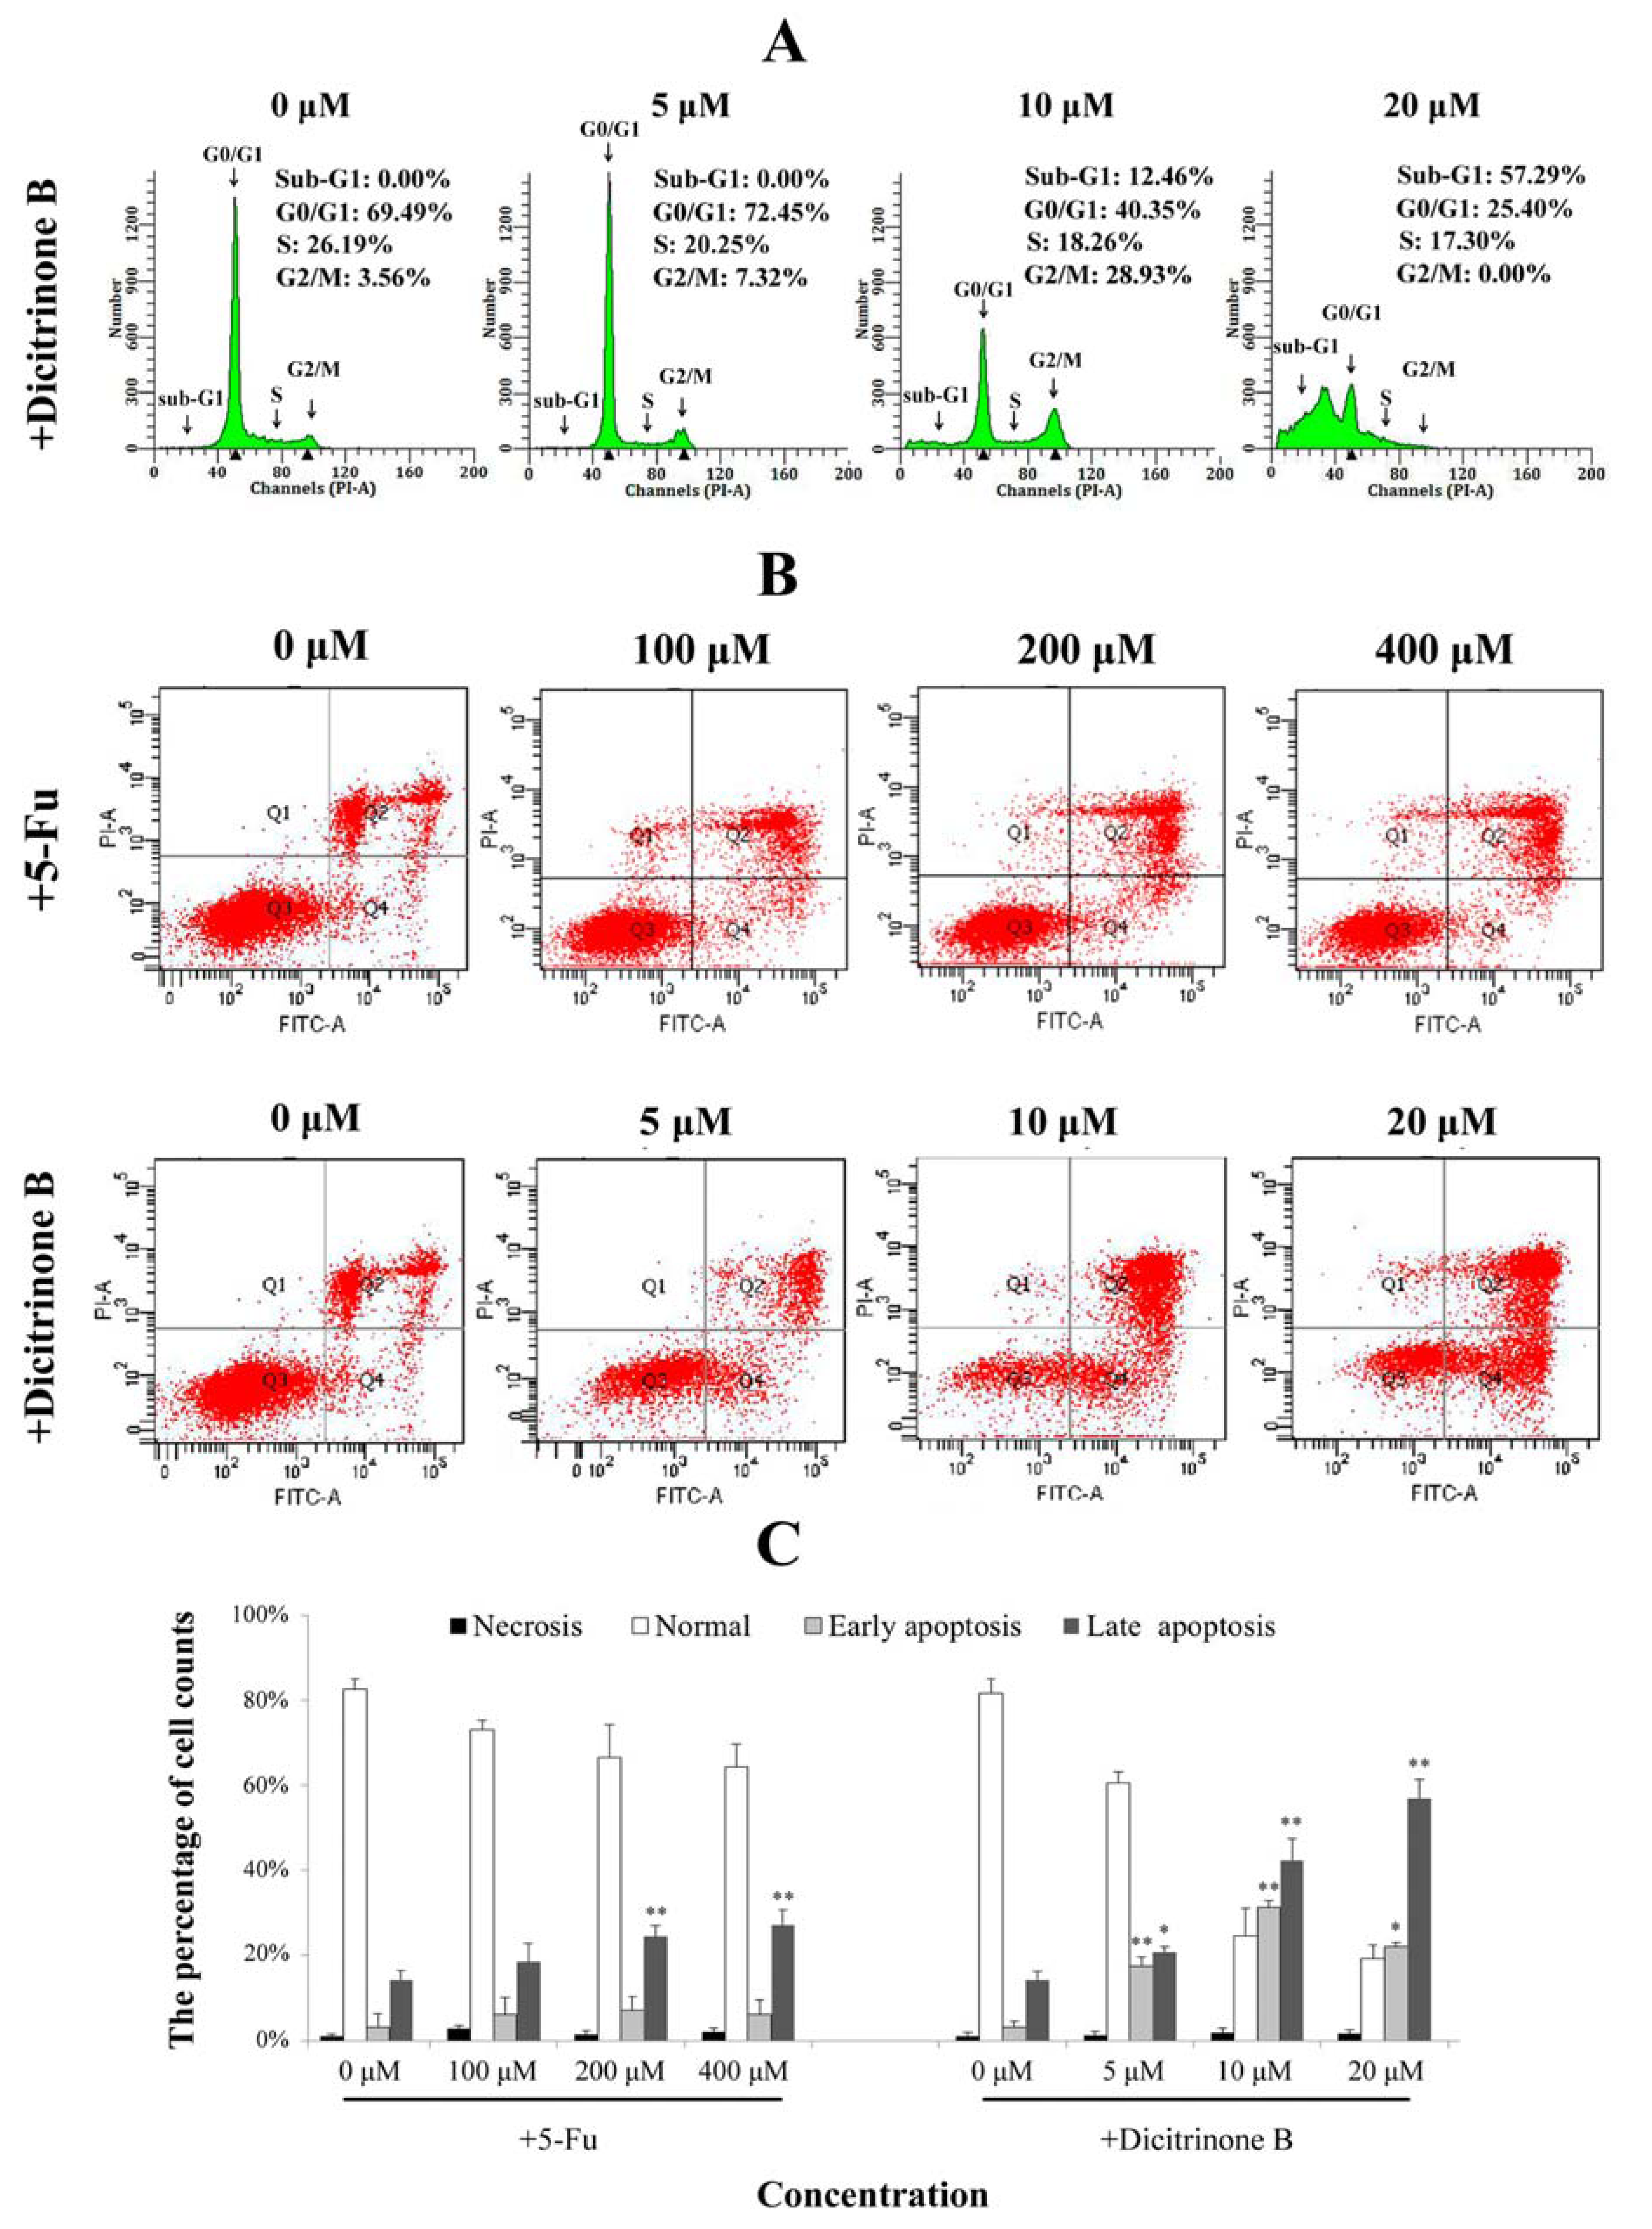
Figure 4.
Dicitrinone B induces A375 cell apoptosis. (A) Cell cycle analysis by flow cytometry. After being treated with dicitrinone B (zero, five, 10 and 20 μM) for 24 h, cells were fixed in ethanol and stained with propidium iodide. DNA content was determined. (B) A375 cells were treated with dicitrinone B (zero, five, 10 and 20 μM) for 24 h and were analyzed with Annexin-V/PI staining by flow cytometry, with 5-Fu (zero, 100, 200 and 400 μM) as a positive control. Q1 represents necrotic cells; Q2 represents non-viable apoptotic cells; Q3 represents normal cells; and Q4 represents viable apoptotic cell. (C) Densitometry of cell counts. Data are expressed as the mean ± SEM (n = 3). Significant differences between the treatment and control groups are indicated as * (p < 0.05) or ** (p < 0.01).
2.4. Dicitrinone B Affects the Cell Cycle and the Integrity of the Plasma Membrane in A375 Cells
To further confirm dicitrinone B-induced apoptosis, cell cycle analysis and Annexin-V/PI double staining were performed. When A375 cells were treated with 5 μM and 10 μM of dicitrinone B, the percentage of G
2/M cells increased from 3.56% in the control to 7.32% and 28.93%, respectively (
Figure 4A). When the concentration of dicitrinone B reached 20 μM, the proportion of sub-G
0/G
1 cells, an important hallmark of apoptotic cells, significantly increased to greater than 50% (
Figure 4A). These results suggested that dicitrinone B might inhibit A375 cell growth by blocking cells in the G
2/M phase. Annexin-V/PI double staining results showed that early apoptosis rates of A375 cells changed from 15.80% to 30.70% to 20.30% and the late apoptotic cells’ increased from 23.10% to 43.60% to 60.80%, when treated with 5 μM, 10 μM and 20 μM of dicitrinone B (
Figure 4B,C). However, when treated with 5-Fu, both the early and late cell apoptosis rates presented little change compared to the blank control group (
Figure 4B,C). The above results demonstrate that dicitrinone B could effectively induce apoptosis by destroying the integrity of the plasma membrane, and the apoptosis rates presented in a dose-dependent manner.
2.5. Dicitrinone B Triggers Apoptosis through ROS Generation
It has been reported that ROS accumulation could lead to mitochondrial dysfunction via depolarizing the mitochondrial membrane potential [
15,
16,
17,
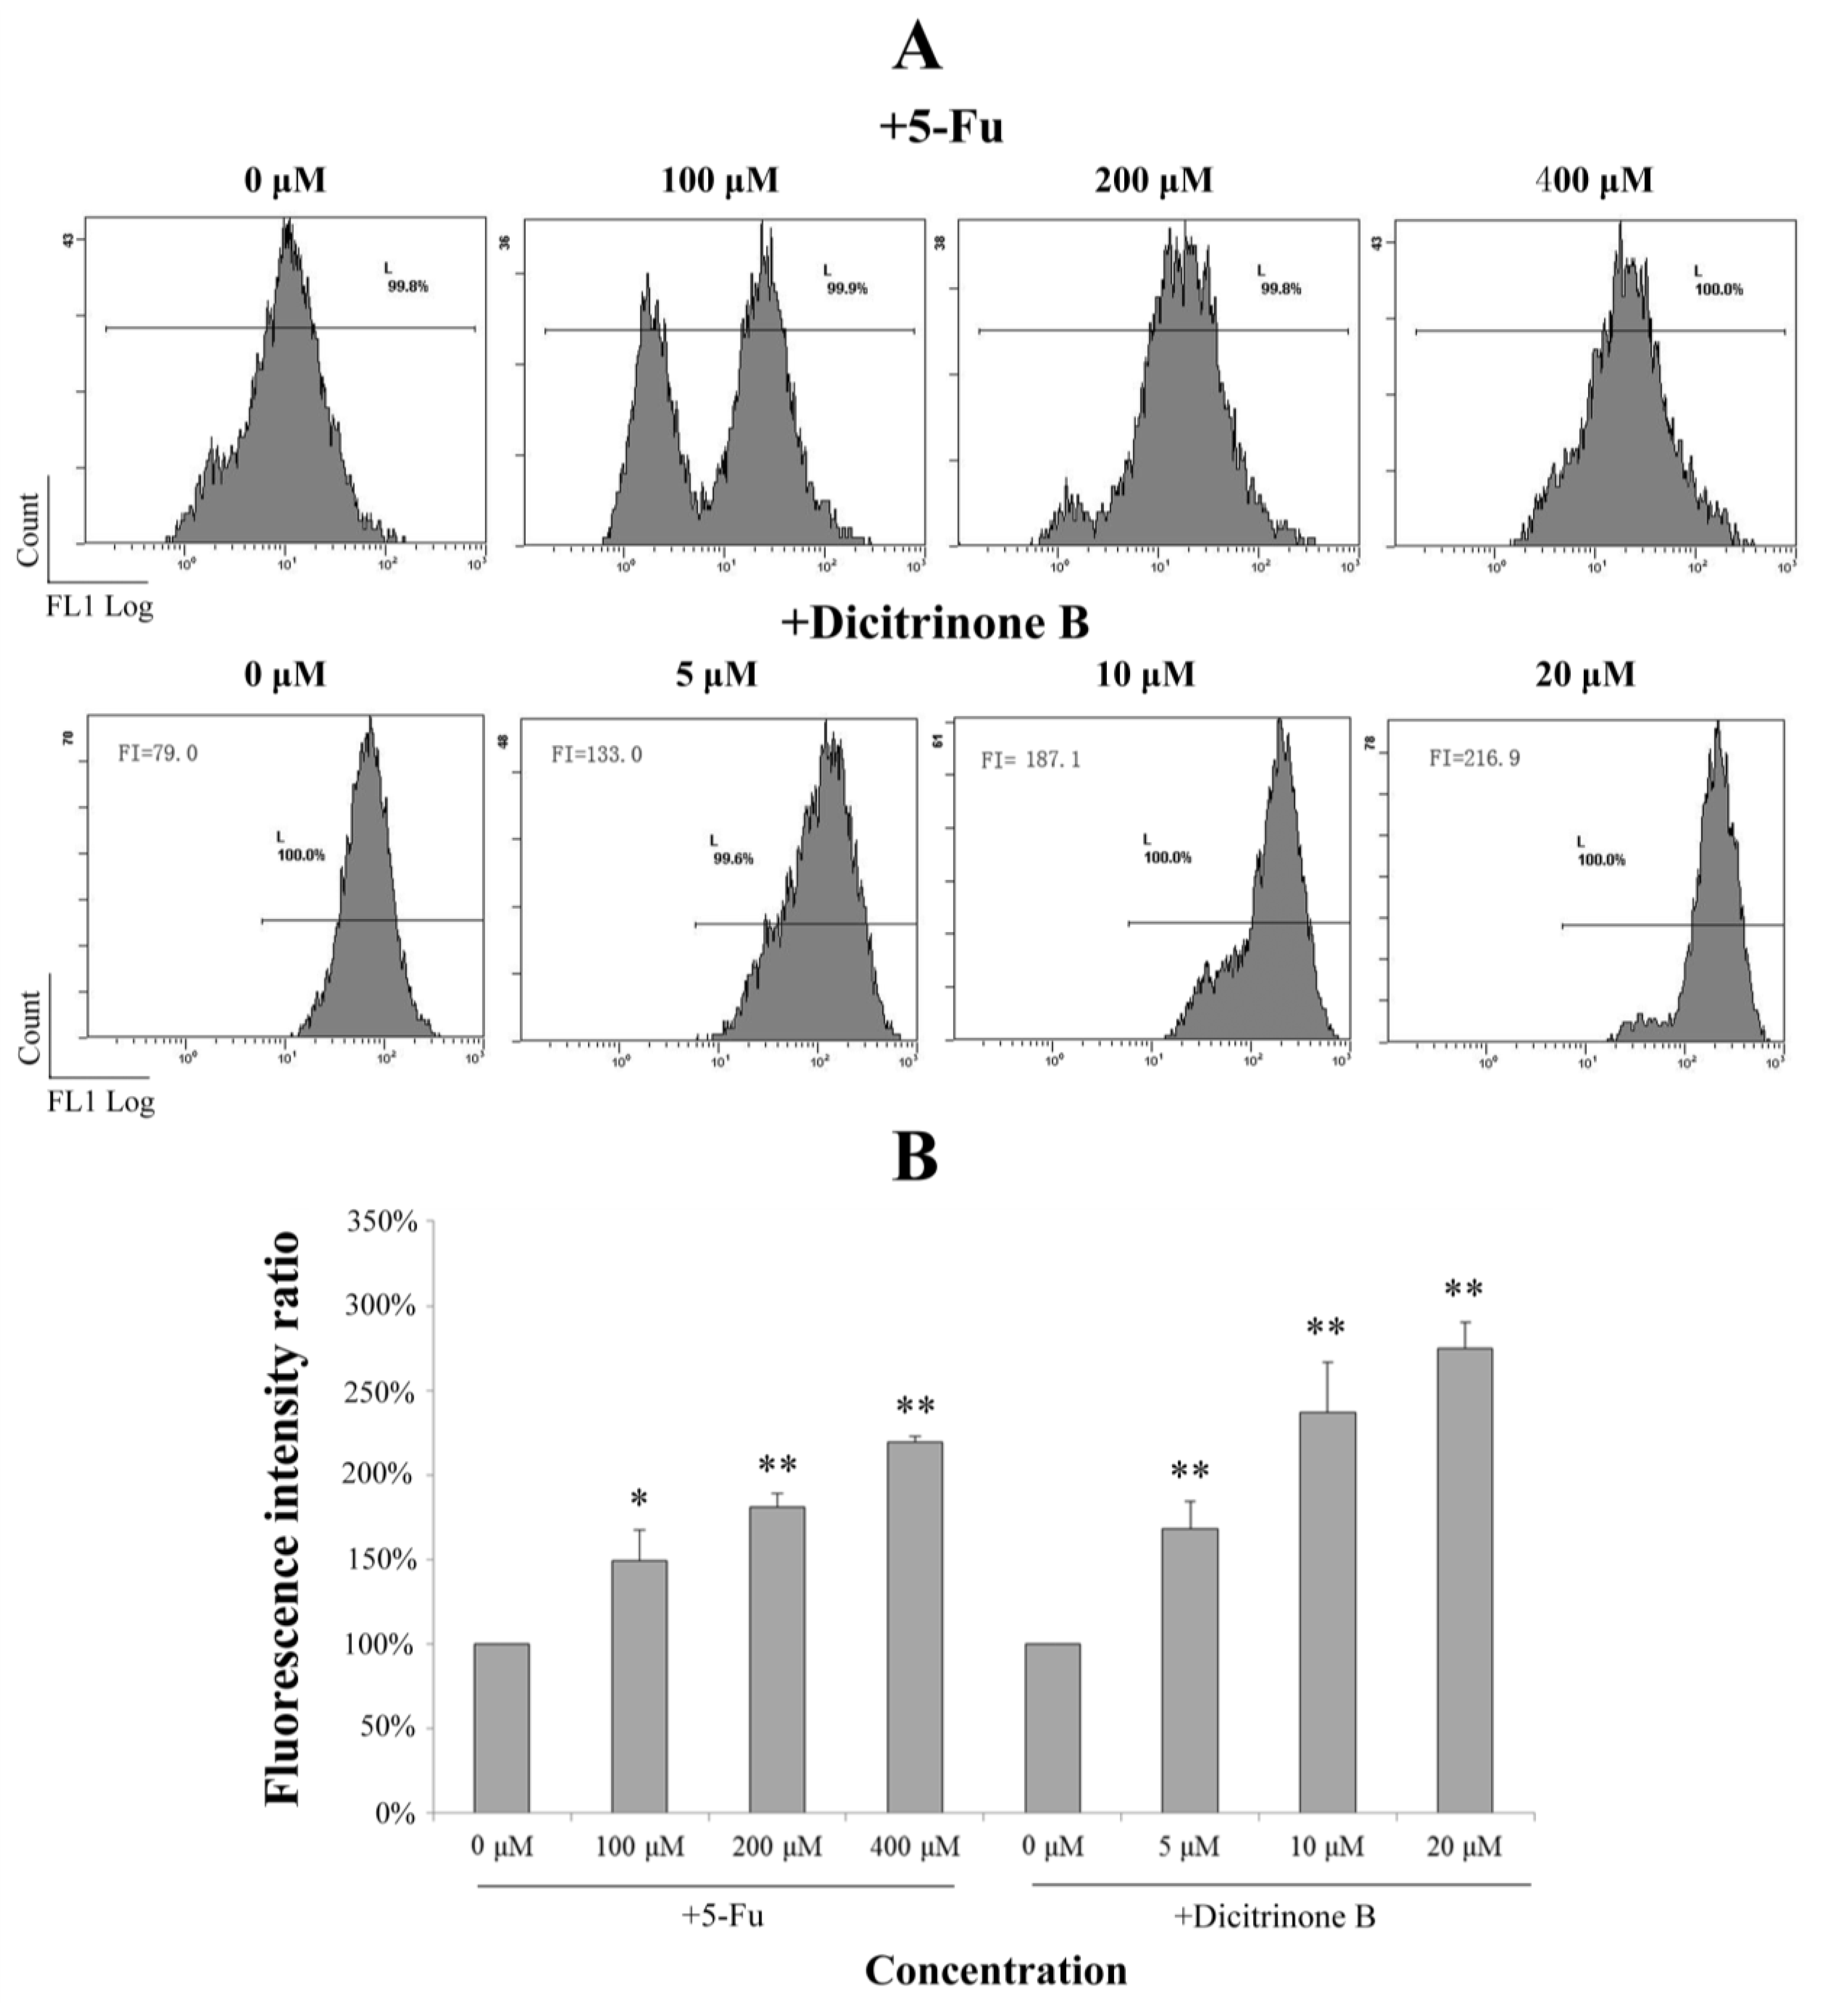
18]. We next investigated whether dicitrinone B-induced apoptosis was triggered by ROS accumulation. DCFH-DA is a cell membrane permeable compound and is converted into the cell membrane impermeable nonfluorescent compound, DCFH, by intracellular esterases. Oxidation of DCFH by ROS produces a highly fluorescent DCF. The fluorescence intensity of DCF inside the cells is proportional to the amount of peroxide produced. Therefore, by using ROS-sensitive fluorescence dye DCFH-DA, we found that treatment of A375 cells with dicitrinone B and 5-Fu led to increased ROS accumulation in a dose-dependent manner (
Figure 5). An average increase of 2–3 fold in ROS was observed under dicitrinone B treatment, while a comparable level was observed under twenty times concentration of the 5-Fu treatment. The data suggested that ROS may take part in the apoptosis of A375 cells induced by dicitrinone B.
Figure 5.
Dicitrinone B induces the accumulation of reactive oxygen species (ROS). (A) After dicitrinone B (five, 10 and 20 μM) treatment for 24 h, the level of intracellular ROS using DCF fluorescence was detected by flow cytometry, with 5-Fu (100, 200 and 400 μM) as a positive control. (B) Quantification of the results shown in (A). Values are expressed as the mean ± SD of three independent measurements. Significant differences between the treatment and control groups are indicated as * (p < 0.05) or ** (p < 0.01).
Figure 6.
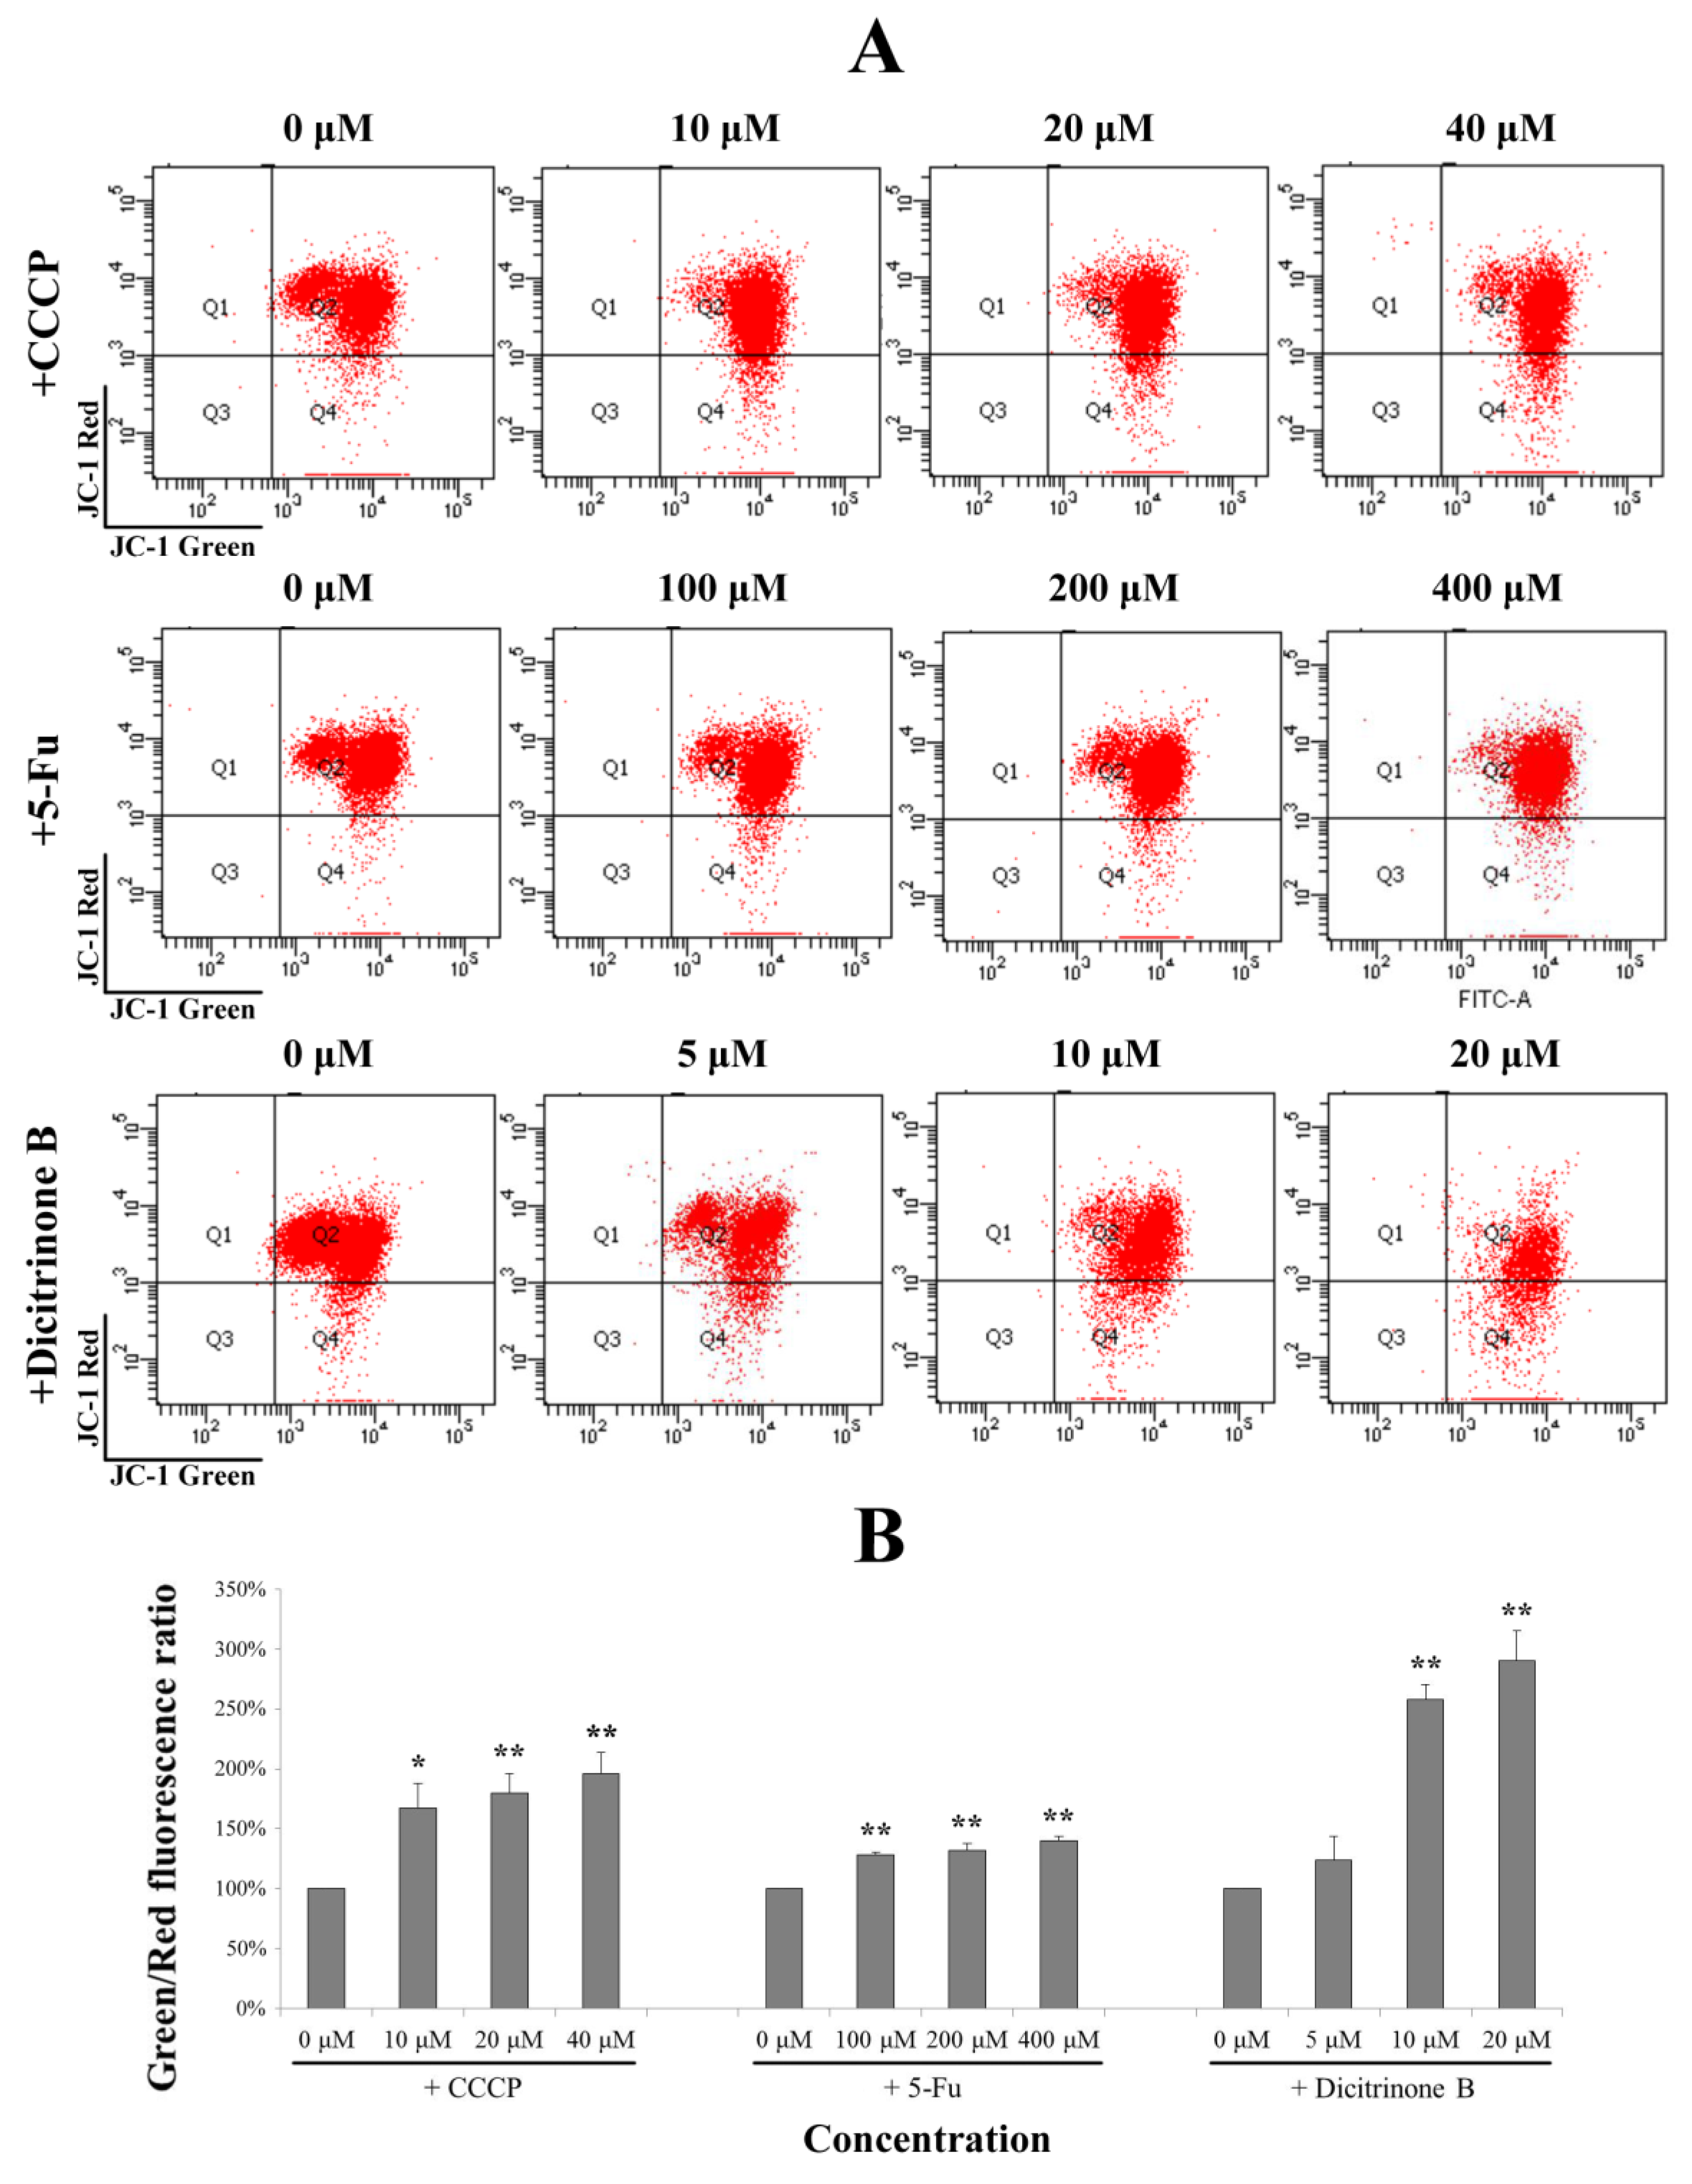
Dicitrinone B induces the loss of the mitochondrial membrane potential (MMP). (A) After dicitrinone B (zero, five, 10 and 20 μM) and 5-Fu (zero, 100, 200 and 400 μM) treatment for 24 h, cells were stained with JC-1 and then analyzed by flow cytometry. The ratio of green-to-red JC-1 fluorescence was used to quantitatively describe the decline of MMP, with CCCP (zero, 10, 20 and 40 μM) as a positive control. (B) Quantification of the results shown in (A). Values are expressed as the mean ± SD of three independent measurements. Significant differences between the treatment and control groups are indicated as * (p < 0.05) or ** (p < 0.01).
2.6. ROS Accumulation Caused by Dicitrinone B Treatment Leads to Mitochondria Damage
Once generated, ROS could cause mitochondrial membrane permeabilization [
19]. Therefore, we examined the depolarization of the mitochondrial membrane potential using the fluorescent cationic dye, JC-1. In non-apoptotic cells, the negative charge established by the intact mitochondrial membrane potential allows the JC-1 to accumulate in the mitochondria and forms “J-aggregates” that become fluorescent red. By contrast, in apoptotic cells, the mitochondrial membrane potential collapses, and JC-1 remains in the cytoplasm in a monomeric form that exhibits green fluorescence [
18]. The ratio of green-to-red JC-1 fluorescence was used to quantitatively describe the MMP. In order to evaluate the degree of dicitrinone B-reduced MMP, an MMP-disrupting agent, CCCP, was chosen as the positive control. As shown in
Figure 6A, after being treated with gradient concentrations of dicitrinone B for 24 h, the ratio of green to red of JC-1 fluorescence was increased in a dose-dependent manner. Although there was no significant difference between the 5 μM of dicitrinone B treatment group and the control group, there was an average increase of 2–3 fold in the green-to-red JC-1 fluorescence ratio when exposed to 10 μM and 20 μM of dicitrinone B, and a higher level was presented compared to the 5-Fu and CCCP treatments (
Figure 6B), indicating that dicitrinone B treatment leads to the loss of MMP.
2.7. Dicitrinone B Activates Caspase Pathway under the Regulation of Bcl-2 Family Proteins
The caspase family is at the heart of apoptotic machinery, where these enzymes play key roles in the execution of apoptosis [
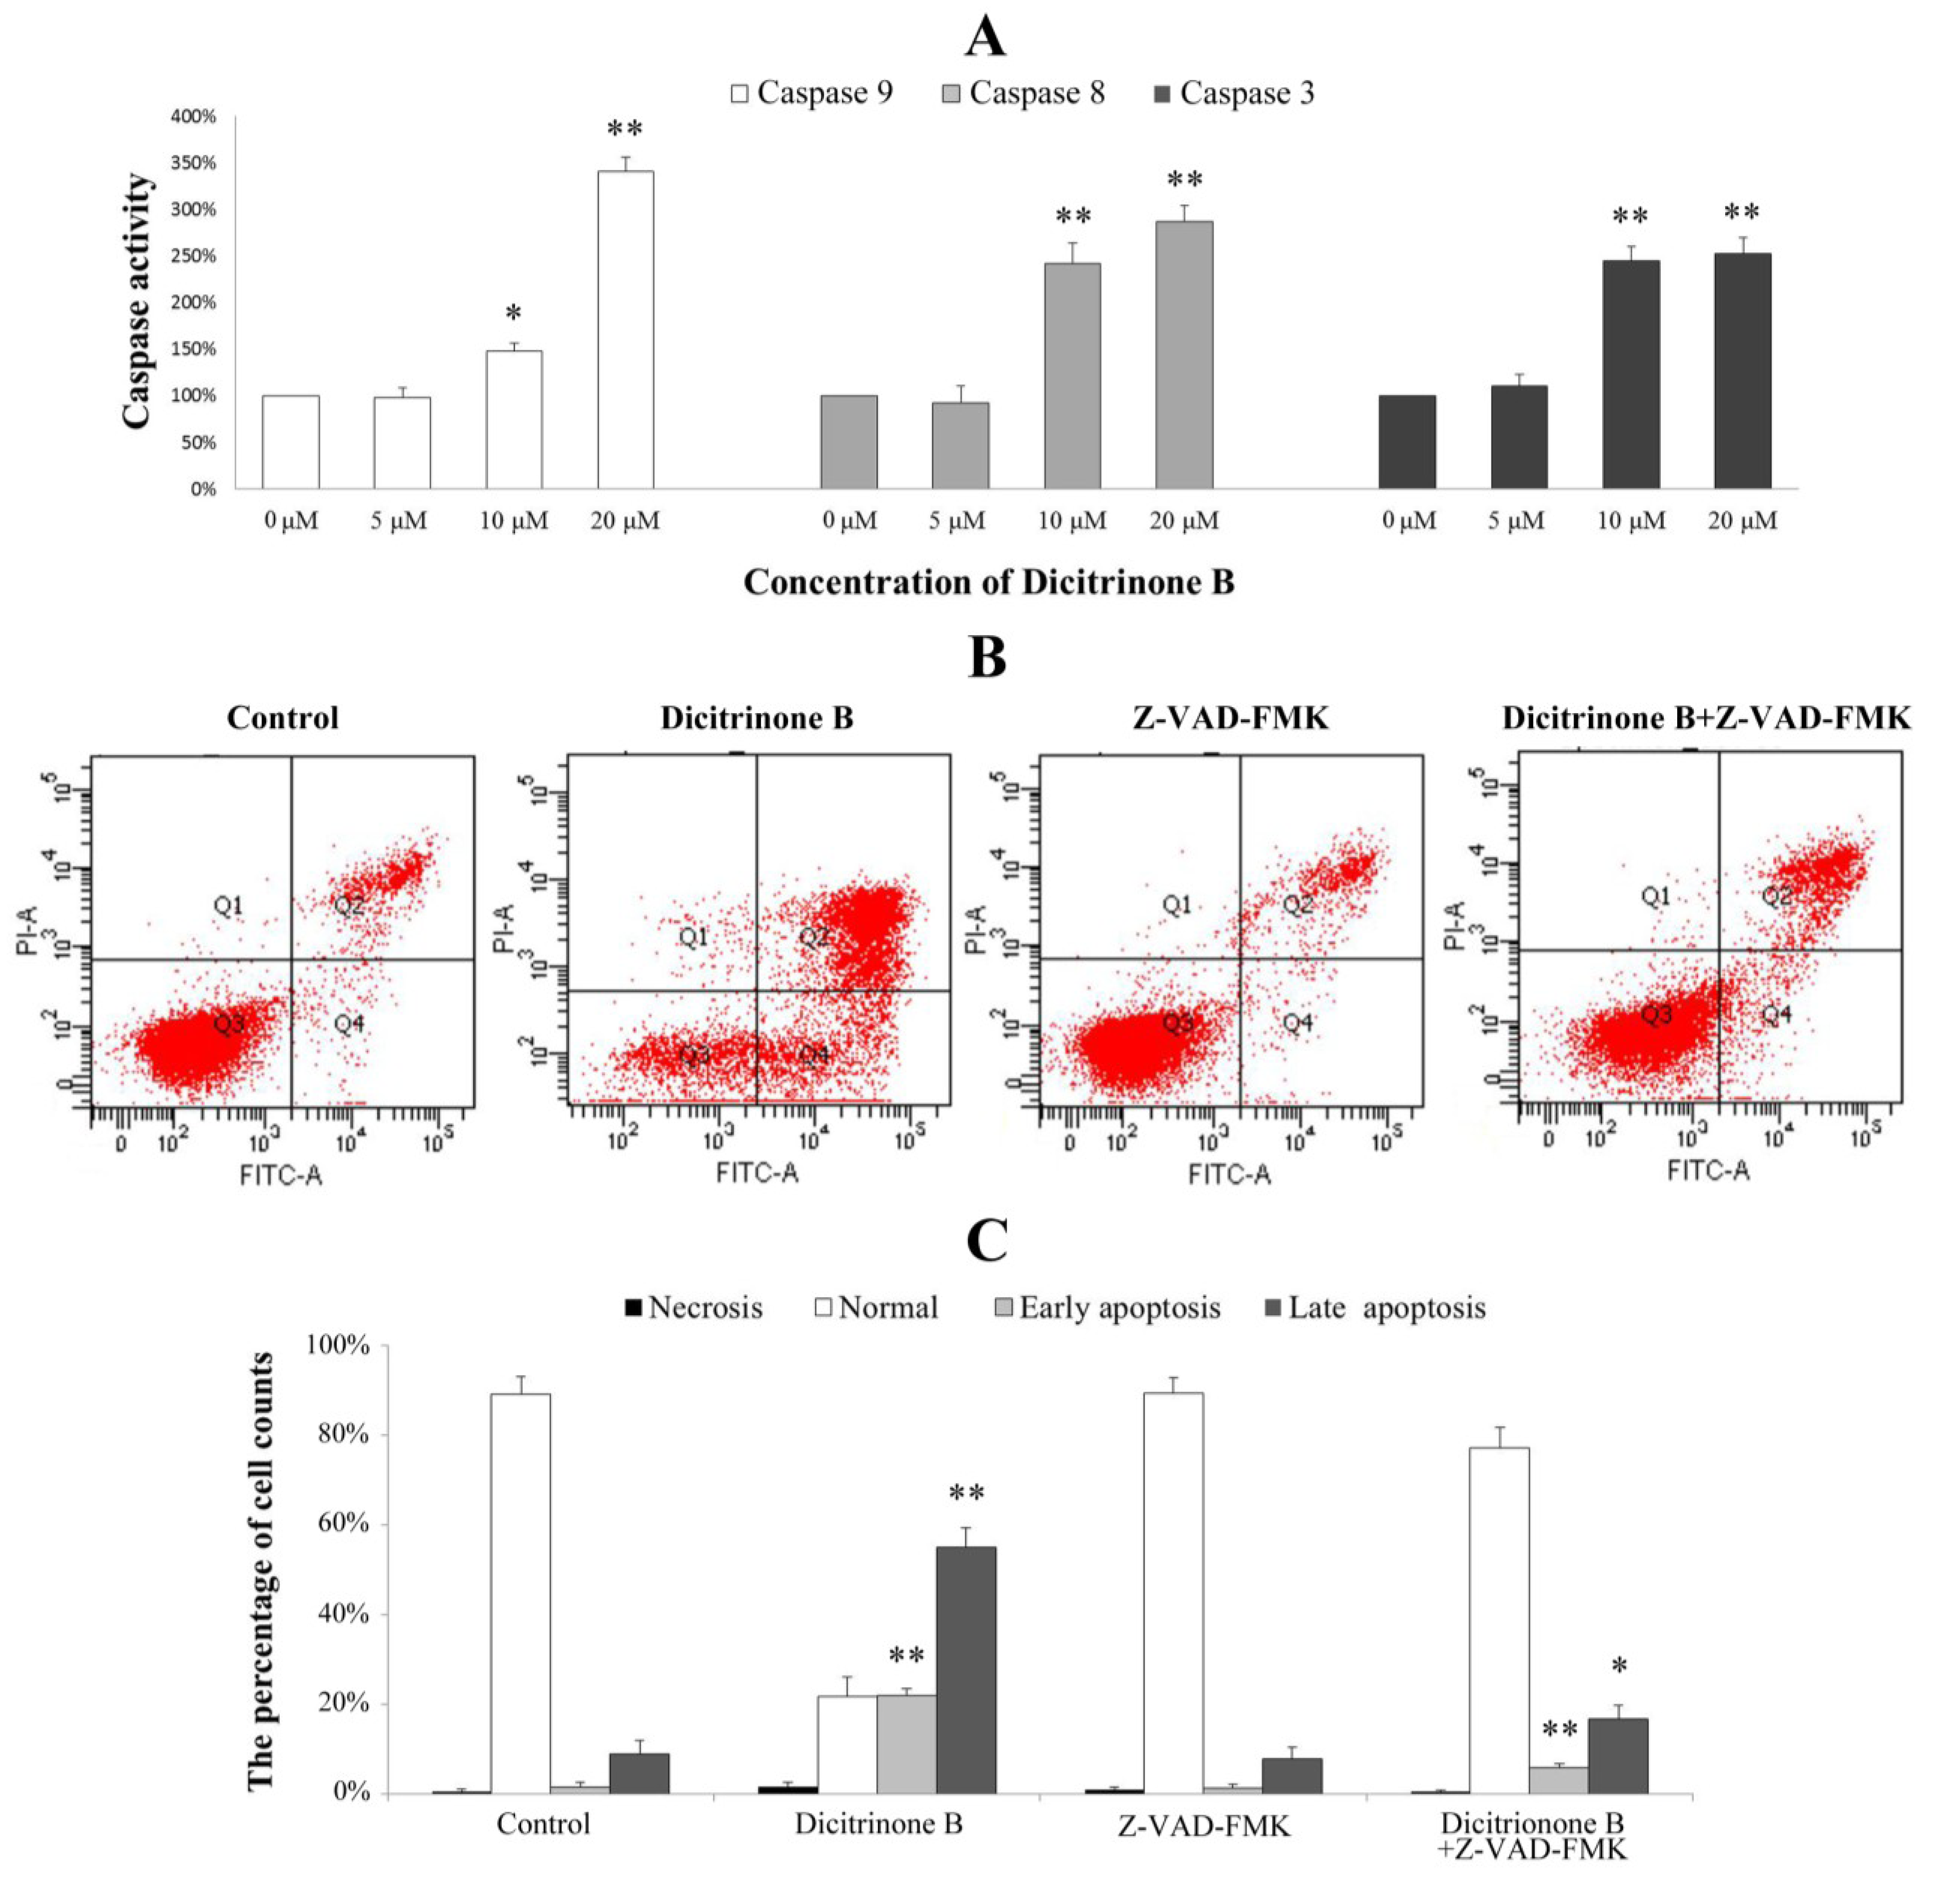
20]. To identify whether caspases were involved in the mechanism, we measured the catalytic activity of caspase-9, caspase-8 and caspase-3 by colorimetric assays. The results demonstrated a gradual increase of cleaved caspase-9, cleaved caspase-8 and cleaved caspase-3 proteins in a dose-dependent manner, indicating that dicitrinone B could significantly activate caspase-9, caspase-8 and caspase-3 (
Figure 7A). To further demonstrate the involvement of caspase activation in the apoptotic effect, we analyzed whether the pan-caspase inhibitor, Z-VAD-FMK, could prevent dicitrinone B-induced apoptosis. When A375 cells were incubated with 20 μM of dicitrinone B in the presence of 20 μM of the caspase inhibitor, Z-VAD-FMK, we observed that the apoptotic response was decreased significantly (
Figure 7B,C). The proportion of late apoptotic cells decreased from 55.62% to 16.75%. This observation allowed us to conclude that there was involvement of the caspase-dependent pathways in the dicitrinone B-induced apoptotic death of A375 cells.
Since the activated caspase-3 could cleave PARP, which is an early and specific indicator of apoptosis [
21], we next investigated pro-PARP and cleaved-PARP expression by western blot (
Figure 8A). We found that pro-PARP decreased and cleaved-PARP increased both in a dose-dependent manner, indicating that PARP was cleaved during the process of apoptosis induced by dicitrinone B. Although the caspase proteolytic cascade is a central point in the apoptotic response, its activity is tightly regulated by a variety of factors. Bcl-2 family proteins, including antiapoptotic members (such as Bcl-2) and proapoptotic members (such as Bax) have been proven to be one of the most important factors and play a pivotal role [
21,
22]. To further analyze the possible mechanism underlying dicitrinone B-induced apoptosis, we tested the expression of Bcl-2 and Bax by western blot. The results showed that the Bax level increased while the Bcl-2 level decreased in a dose-dependent manner (
Figure 8A,B). The ratio of Bax/Bcl-2, which is a key factor regulating apoptosis, was further calculated and proven to increase in a dose-dependent manner. Furthermore, the mRNA levels of Bax and Bcl-2 were determined by real-time quantitative PCR. After 24 h of dicitrinone B treatment, the ratio of Bax/Bcl-2 mRNA was increased with the increased concentration (
Figure 8C), which was consistent with the previous data of the western blot analysis. To summarize, dicitrinone B induces the apoptosis of A375 cells by activating the caspase-cascade response and regulating the expression of Bax and Bcl-2.
Figure 7.
Analysis of the apoptosis-associated caspase activities in A375 cells. (A) A375 cells were treated with dicitrinone B (zero, five, 10 and 20 μM) for 24 h. The activities of caspase-9, -8 and -3 were determined by colorimetric assays kits, respectively. (B) A375 cells were incubated with 20 μM of dicitrinone B in the presence or absence of 20 μM of the caspase inhibitor, Z-VAD-FMK and then analyzed with Annexin-V/PI staining by flow cytometry. (C) Densitometry of cell counts. Data are expressed as the mean ± SD (n = 3). Significant differences between the treatment and control groups are indicated as * (p < 0.05) or ** (p < 0.01).
Figure 8.
Real-time quantitative PCR and western blot analysis of the apoptosis-associated proteins in A375 cells. (A) After cells were treated with a different concentration of dicitrinone B for 24 h, the expressions of Bcl-2, Bax, pro-PARP and cleaved-PARP were determined by western blot, with GAPDH as a loading control. (B) Quantitative Bcl-2, Bax, pro-PARP and cleaved-PARP expressions after normalization to GAPDH. (C) The ratio of Bax/Bcl-2 at the protein and mRNA level in A375 cells treated with dicitrinone B (zero, five, 10 and 20 μM) for 24 h. Data are expressed as the mean ± SEM (n = 3). Significant differences between the treatment and control groups are indicated as * (p < 0.05) or ** (p < 0.01).
2.8. Global Discussion
It was reported that the specific situations that microorganisms live in might activate some silent genes and induce some unique biosynthetic pathways [
23]. Marine fungi are an important resource for finding chemically and biologically diverse compounds, due to their special living environment. In recent years, interest in the bioactive ingredients of marine fungi has been growing rapidly, as most of the fungal-derived compounds are capable of inhibiting the growth and proliferation of cancer cells. In this study, we obtained dicitrinone B, a novel carbon-bridged citrinin dimer, isolated and purified using many purification methods, from the marine-derived fungus,
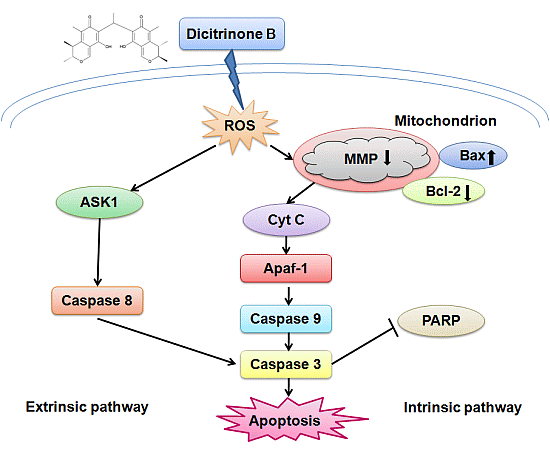
Penicillium citrinum, and tested for its cytotoxicity effect on multiple tumor cells. The results showed that dicitrinone B effectively inhibited the cell growth of multiple tumor cells, especially A375 cells. Most interestingly, it seems to have more potent anticancer efficacy, inhibiting cell proliferation and tumor growth, as compared to large doses of the first-line chemotherapy drug, 5-Fu, in A375 cells. Further study indicated that dicitrinone B induced apoptosis, at least in part, mediated by two apoptosis pathways. The first one was through the ROS-related intrinsic mitochondrial pathway, and the second one was through the extrinsic apoptotic pathway. This is the first report that clearly characterizes the antitumor properties of dicitrinone B and identifies its mechanism in a tumor model.
In our study, we found that dicitrinone B pretreatment observably induced rapid ROS generation in a dose-dependent manner. Increased oxidative stress could cause the opening of the mitochondrial permeability transition pore (MPTP mitochondrial) and eventually leads to mitochondrial membrane permeabilization [
24]. Mitochondria are vital intracellular organelles, whose functions encompass, but are not limited to, ATP production, apoptosis regulation and biosynthesis of several metabolites. They are also the main cellular source and immediate target of ROS [
25]. We found the attenuation of MMP after dicitrinone B treatment and speculated that it was the result of the excessive accumulation of ROS. Once the mitochondria are destabilized, the apoptogenic factors, such as cytochrome c, would be released from the outer mitochondria membrane space into the cytosol [
26]. It has been reported that cytochrome c release induces caspase activation, which, in turn, may promote either cell death or vital processes, like differentiation and proliferation. These opposite outcomes may derive from different subsets of substrates, which are cleaved by the caspases in different situations [
25]. Although we have not detected the release of cytochrome c in our study yet, we would do more in-depth research in the future.
We further detected the activation of caspase-9, caspase-8 and caspase-3, which play key roles in the execution of apoptosis and the cleavage of PARP, indicating the subsequent induction of both the extrinsic and intrinsic apoptosis pathways. Regardless of the extrinsic or intrinsic apoptotic pathway, caspase-3 is the core protein involved in cellular apoptosis [
27]. The extrinsic pathway is regulated by a death-inducing signaling complex, which is made of a Fas-associated death domain and procaspase-8. The death-inducing signaling complex activates caspase-8 and the downstream caspases [
15]. It has been reported that ROS accumulation could activate ASK1 to participate in the process of the extrinsic apoptotic pathway [
28]. We detected the activation of caspase-8, suggesting that extrinsic apoptosis pathways may also contribute to dicitrinone B-induced apoptosis. However, the precise mechanism of this pathway remains to be determined.
Members of the Bcl-2 family are major regulators of cell death or cell survival [
29]. Bcl-2 family proteins include both pro-apoptotic members (e.g., Bax, Bid, Bad and Bim) and anti-apoptotic members (e.g., Bcl-2, Bcl-XL, Mcl-1 and Bcl-w). The balance of pro-apoptotic and anti-apoptotic Bcl-2 family proteins decides the fate of the cell [
30]. Our data clearly showed that dicitrinone B treatment of A375 cells resulted in a dose-dependent increase in the level of Bax with a concomitant decrease in the Bcl-2 level and, finally, caused an increase of the Bax/Bcl-2 ratio, demonstrating that Bcl-2 family protein regulation would be involved in dicitrinone B-induced apoptosis. It has been reported that Bcl-2 family proteins could regulate the caspase cascade [
31]. Some studies highlighted the importance of the Bc1-2 family in protecting mitochondria against the loss of function during apoptosis [
32], while other opinions on the Bc1-2 family focused on its inhibiting of the release of the apoptosis-associated factor, cytochrome c, from the mitochondria [
33] or regulating ion flux [
34]. Our data suggested that Bcl-2 and Bax participated in dicitrinone B-induced apoptosis, but the details of the mechanisms need further study.

