
Seroprevalence and Shifting Endemicities of Hepatitis A Virus Infection in Two Contrasting Geographical Areas in Indonesia

 , and
, and
Abstract
1. Introduction
2. Materials and Methods
2.1. Study Design and Setting
2.2. Anti-HAV IgG Testing and Endemicity Measure
2.3. Measuring Risk Factors and Associations with HAV Seroprevalence
2.4. Data Management and Analysis
3. Results
3.1. Participant Characteristics
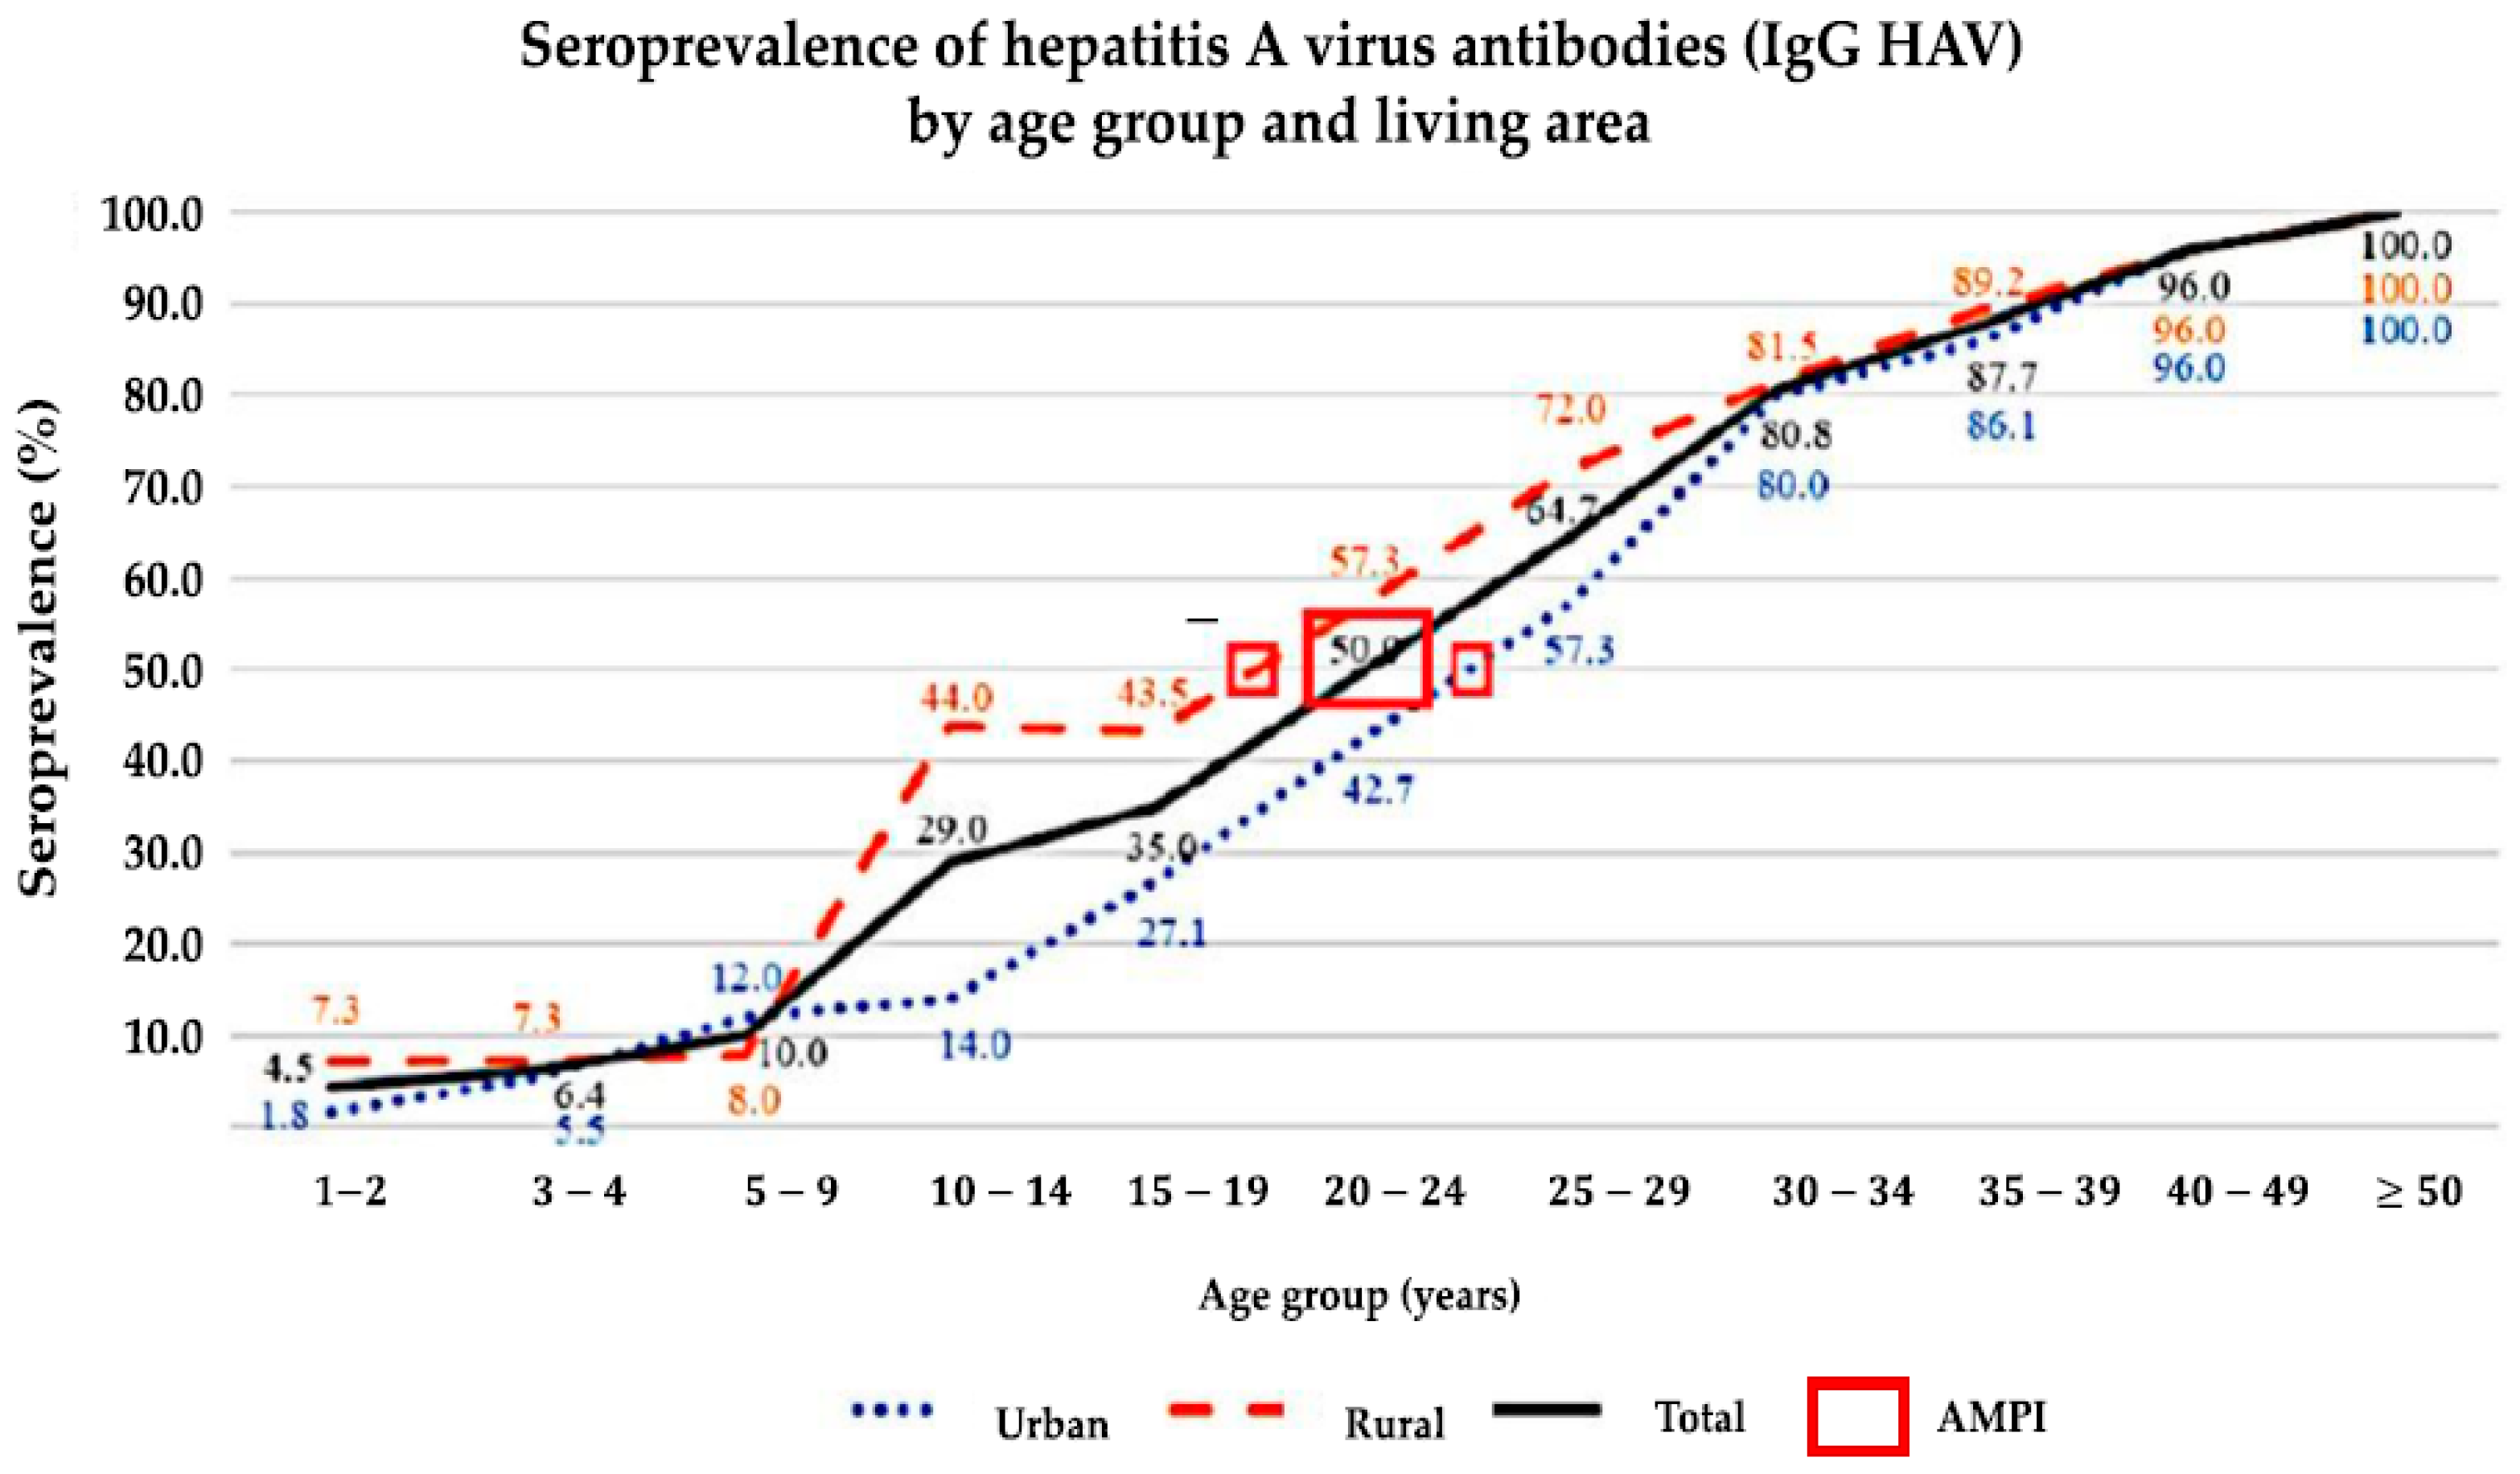
3.2. Seroprevalence and Endemicity
3.3. Household SES
3.4. Knowledge of Hepatitis A and Hygienic Food Intake
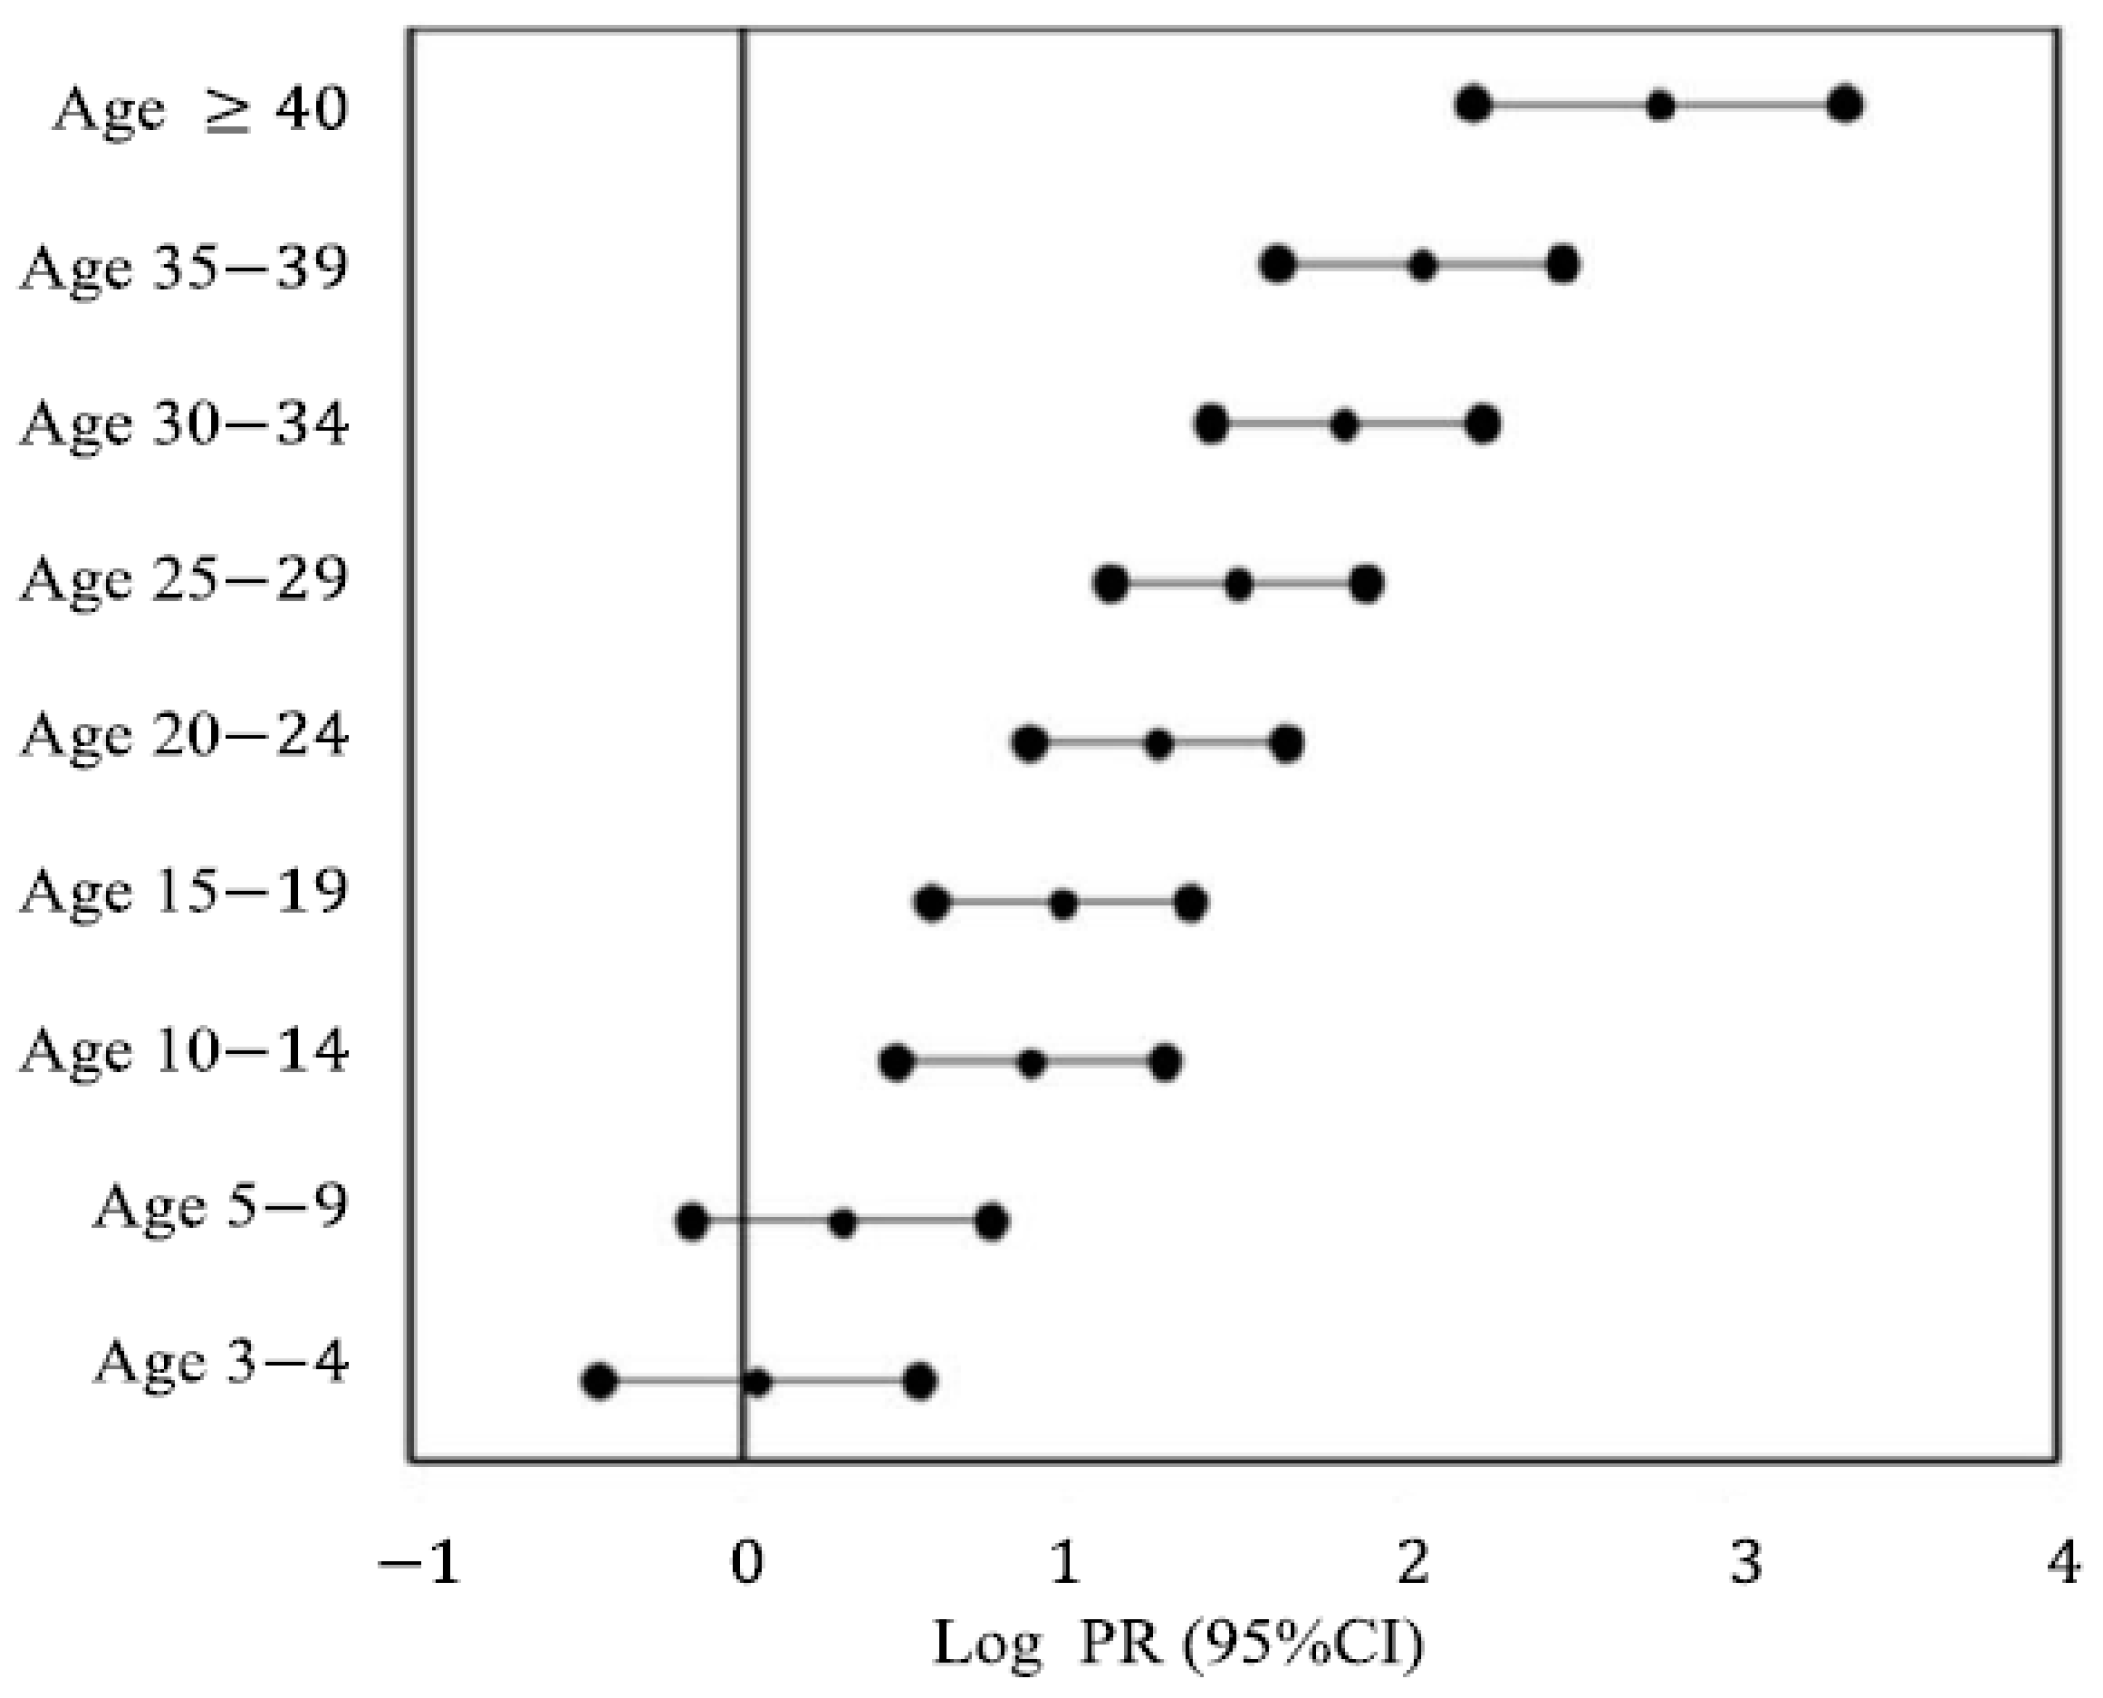
3.5. Multivariate Analysis
4. Discussion
5. Conclusions
Supplementary Materials
Author Contributions
Funding
Institutional Review Board Statement
Informed Consent Statement
Data Availability Statement
Acknowledgments
Conflicts of Interest
References
- Prüss, A.; Kay, D.; Fewtrell, L.; Bartram, J. Estimating the burden of disease from water, sanitation, and hygiene at a global level. Environ. Health Perspect. 2002, 110, 537–542. [Google Scholar] [PubMed]
- Thébault, A.; Roque-Afonso, A.-M.; Kooh, P.; Cadavez, V.; Gonzales-Barron, U.; Pavio, N. Risk factors for sporadic hepatitis A infection: A systematic review and meta-analysis. Microb. Risk Anal. 2020, 17, 100155. [Google Scholar] [CrossRef]
- World Health Organization. WHO position paper on hepatitis A vaccines—June 2012. Wkly. Epidemiol. Rec. Relev. Épidémiologique Hebd. 2012, 87, 261–276. Available online: https://www.who.int/publications/i/item/who-wer8728-29-261-276 (accessed on 24 January 2024).
- World Health Organization. WHO position paper on hepatitis A vaccines—October 2022. Wkly. Epidemiol. Rec. Organ. Mond. De La Santé Genève 2022, 40, 493–512. Available online: https://www.who.int/publications/i/item/who-wer9740-493-512 (accessed on 30 January 2024).
- The Institute for Health Metrics and Evaluation. Acute Hepatitis A—Level 4 Cause. Available online: https://www.healthdata.org/research-analysis/diseases-injuries-risks/factsheets/2021-acute-hepatitis-level-4-disease (accessed on 20 June 2022).
- Thompson, E.G.; Husney, A. Hepatitis A Virus Test. Available online: https://www.healthlinkbc.ca/healthwise/hepatitis-virus-test (accessed on 5 March 2025).
- Hanafiah, K.M.; Jacobsen, K.H.; Wiersma, S.T. Challenges to mapping the health risk of hepatitis A virus infection. Int. J. Health Geogr. 2011, 10, 57. [Google Scholar] [CrossRef] [PubMed]
- Jacobsen, K.H.; Wiersma, S.T. Hepatitis A virus seroprevalence by age and world region, 1990 and 2005. Vaccine 2010, 28, 6653–6657. [Google Scholar] [CrossRef] [PubMed]
- Hernandez-Suarez, G.; Saha, D.; Lodroño, K.; Boonmahittisut, P.; Taniwijaya, S.; Saha, A.; Badur, S.; Poovorawan, Y. Seroprevalence and incidence of hepatitis A in Southeast Asia: A systematic review. PLoS ONE 2021, 16, e0258659. [Google Scholar] [CrossRef] [PubMed]
- Juffrie, M.; Graham, R.R.; Tan, R.I.; Widjaja, S.; Mulyadi, S.; Weil, J.; Bock, H.L. Seroprevalence of hepatitis A virus and varicella zoster antibodies in a Javanese community (Yogyakarta. Indonesia). Southeast Asian J. Trop. Med. Public Health 2000, 31, 21–24. [Google Scholar] [PubMed]
- World Health Organization. Hepatitis A. Available online: https://www.who.int/news-room/fact-sheets/detail/hepatitis-a (accessed on 4 January 2024).
- Bandung City Profile (Kota Bandung). Available online: https://bandung.go.id/profile (accessed on 5 March 2025).
- Bandung Regency Profile (Kabupaten Bandung). Available online: https://id.wikipedia.org/wiki/Kabupaten_Bandung (accessed on 5 March 2025).
- Chi, V.; Cleary, S.; Bocchini, J.A., Jr. In pursuit of control and elimination: Update on hepatitis A and B epidemiology and prevention strategies. Curr. Opin. Pediatr. 2018, 30, 689–697. [Google Scholar] [CrossRef] [PubMed]
- World Health Organization. Global Health Sector Strategy on Viral Hepatitis 2016–2021. Towards Ending Viral Hepatitis. Available online: https://apps.who.int/iris/handle/10665/246177 (accessed on 30 January 2024).
- Sa-Nguanmoo, P.; Posuwan, N.; Vichaiwattana, P.; Vuthitanachot, V.; Saelao, S.; Foonoi, M.; Fakthongyoo, A.; Makaroon, J.; Srisingh, K.; Asawarachun, D.; et al. Declining Trend of Hepatitis A Seroepidemiology in Association with Improved Public Health and Economic Status of Thailand. PLoS ONE 2016, 11, e0151304. [Google Scholar] [CrossRef] [PubMed]
- Abbott Laboratories. ARCHITECT HAVAB-G. 510(k) Substantial Equivalence Determination Decision Summary. Available online: https://www.accessdata.fda.gov/cdrh_docs/reviews/K113704.pdf (accessed on 28 January 2024).
- Abbott Laboratories. ARCHITECT HAVAB-G. Available online: https://www.ilexmedical.com/files/PDF/HAVAb-IgG_AEC.pdf (accessed on 28 January 2024).
- Ariyarathna, N.; Abeysena, C. Risk factors for viral hepatitis A infection in Gampaha District, Sri Lanka: An unmatched case control study. BMC Public Health 2020, 20, 1–7. [Google Scholar] [CrossRef] [PubMed]
- World Health Organization. Core Questions on Drinking Water, Sanitation and Hygiene for Household Surveys: 2018 Update; United Nations Children’s Fund (UNICEF): New York, NY, USA; World Health Organization: New York, NY, USA, 2018; Available online: https://washdata.org/sites/default/files/documents/reports/2019-03/JMP-2018-core-questions-for-household-surveys.pdf (accessed on 5 January 2021).
- Psaki, S.R.; Seidman, J.C.; Miller, M.; Gottlieb, M.; Bhutta, Z.A.; Ahmed, T.; Ahmed, A.S.; Bessong, P.; John, S.M.; Kang, G.; et al. Measuring socioeconomic status in multicountry studies: Results from the eight-country MAL-ED study. Popul. Health Metr. 2014, 12, 8. [Google Scholar] [CrossRef] [PubMed]
- Alian, S.; Ajami, A.; Ghasemian, R.; Yadegarinia, D. Age-specific seroprevalence of hepatitis A in Sari, northern Islamic Republic of Iran. East. Mediterr. Health J. 2011, 17, 754–758. [Google Scholar] [CrossRef] [PubMed]
- Jacobsen, K.H.; Koopman, J.S. The effects of socioeconomic development on worldwide hepatitis A virus seroprevalence patterns. Int. J. Epidemiol. 2005, 34, 600–609. [Google Scholar] [CrossRef] [PubMed]
- Choe, Y.J.; Son, H. The changing gender differences in hepatitis a incidence in South Korea. Vaccine 2020, 38, 712–714. [Google Scholar] [CrossRef] [PubMed]
- Hepatitis Virus. Rates* of Reported Cases† of Hepatitis A Virus Infection, by Sex—United States, 2006–2021. Available online: https://www.cdc.gov/hepatitis/statistics/2021surveillance/hepatitis-a/figure-1.5.htm (accessed on 6 March 2025).
- Samara, K.A.; Barqawi, H.J.; Aboelsoud, B.H.; AlZaabi, M.A.; Alraddawi, F.T.; Mannaa, A.A. Hepatitis A virus knowledge and immunization attitudes and practices in the United Arab Emirates community. Sci. Rep. 2021, 11, 2651. [Google Scholar] [CrossRef] [PubMed]
- Barzaga, N.G. Hepatitis A shifting epidemiology in South-east Asia and China. Vaccine 2000, 18, S61–S64. [Google Scholar] [CrossRef] [PubMed]
- Franco, E.; Meleleo, C.; Serino, L.; Sorbara, D.; Zaratti, L. Hepatitis A: Epidemiology and prevention in developing countries. World J. Hepatol. 2012, 4, 68–73. [Google Scholar] [CrossRef] [PubMed]
- Kaswandani, N.; Gunardi, H.; Prayitno, A.; Kartasasmita, C.B.; Prasetyo, D.; Husada, D.; Sarosa, G.I.; Oswari, H.; Ismoedijanto, I.; Rusmil, K.; et al. Immunization Schedule for Children Aged 0—18 Years Old Indonesian Pediatric Society Recommendation 2024. Sari Pediatri 2025, 26, 328–336. Available online: https://saripediatri.org/index.php/sari-pediatri/article/view/2843 (accessed on 2 February 2025).


| Characteristics | Total n = 1280 | Living Area | p Value * | Anti-HAV IgG | p Values * | ||
|---|---|---|---|---|---|---|---|
| Urban n = 640 | Rural n = 640 | Positive n = 647 (50.55%) | Negative n = 633 (49.45%) | ||||
| Sex: | 0.001 | 0.001 | |||||
| Male | 506 (39.5%) | 283 (44.2%) | 223 (34.8%) | 227 (44.9%) | 279 (55.1%) | ||
| Female | 774 (60.5%) | 357 (55.8%) | 417 (65.2%) | 420 (54.3%) | 354 (45.7%) | ||
| Age (years): | 1.00 | <0.001 | |||||
| 1–2 | 110 (8.6%) | 55 (8.6%) | 55 (8.6%) | 5 (4.5%) | 105 (95.5%) | ||
| 3–4 | 110 (8.6%) | 55 (8.6%) | 55 (8.6%) | 7 (6.4%) | 103 (93.6%) | ||
| 5–9 | 100 (7.8%) | 50 (7.8%) | 50 (7.8%) | 10 (10.0%) | 90 (90.0%) | ||
| 10–14 | 100 (7.8%) | 50 (7.8%) | 50 (7.8%) | 29 (29.0%) | 71 (71.0%) | ||
| 15–19 | 140 (10.9%) | 70 (10.9%) | 70 (10.9%) | 49 (35.0%) | 91 (65.0%) | ||
| 20–24 | 150 (11.7%) | 75 (11.7%) | 75 (11.7%) | 75 (50.0%) | 75 (50.0%) | ||
| 25–29 | 150 (11.7%) | 75 (11.7%) | 75 (11.7%) | 97 (64.7%) | 53(35.3%) | ||
| 30–34 | 130 (10.2%) | 65 (10.2%) | 65 (10.2%) | 105 (80.8%) | 25 (19.2%) | ||
| 35–39 | 130 (10.2%) | 65 (10.2%) | 65 (10.2%) | 114 (87.7%) | 16 (12.3%) | ||
| 40–49 | 100 (7.8%) | 50 (7.8%) | 50 (7.8%) | 96 (96.0%) | 4 (4.0%) | ||
| ≥50 | 60 (4.7%) | 30 (4.7%) | 30 (4.7%) | 60 (100%) | 0 (0%) | ||
| Education of father: | <0.001 | <0.001 | |||||
| Illiterate | 9 (0.7%) | 6 (0.9%) | 3 (0.5%) | 9 (100%) | 0 (0%) | ||
| Primary school (6 years) | 382 (29.9%) | 182 (28.5%) | 200 (31.3%) | 277 (72.5%) | 105 (27.5%) | ||
| Middle school (9 years) | 274 (21.5%) | 114 (17.8%) | 160 (25.1%) | 143 (52.2%) | 131 (47.8%) | ||
| High school (13 years) | 531 (41.6%) | 278 (43.5%) | 253 (39.7%) | 188 (35.4%) | 343 (64.6%) | ||
| Graduate/post-graduate (16+ years) | 81 (6.3%) | 59 (9.2%) | 22 (3.4%) | 27 (33.3%) | 54 (66.7%) | ||
| Education of mother: | <0.001 | <0.001 | |||||
| Illiterate | 7 (0.5%) | 6 (0.9%) | 1 (0.2%) | 7 (100%) | 0 (0%) | ||
| Primary school (6 years) | 428 (33.5%) | 191 (29.9%) | 237 (37.1%) | 308 (72.0%) | 120 (28.0%) | ||
| Middle school (9 years) | 310 (24.3%) | 147 (23.0%) | 163 (25.5%) | 155 (50.0%) | 155 (50.0%) | ||
| High school (13 years) | 468 (36.6%) | 246 (38.5%) | 222 (34.7%) | 152 (32.5%) | 316 (67.5%) | ||
| Graduate/post-graduate (16+ years) | 65 (5.1%) | 49 (7.7%) | 16 (2.5%) | 23 (35.4%) | 42 (64.6%) | ||
| Occupation: | 0.004 | <0.001 | |||||
| Professional | 69 (5.4%) | 41 (6.4%) | 28 (4.4%) | 48 (69.6%) | 21 (30.4%) | ||
| Semi-professional | 3 (0.2%) | 1 (0.2%) | 2 (0.3%) | 3 (100%) | 0 (0%) | ||
| Clerical/shop owner | 37 (2.9%) | 22 (3.4%) | 15 (2.3%) | 27 (73.0%) | 10 (27.0%) | ||
| Skilled worker | 66 (5.2%) | 34 (5.3%) | 32 (5.0%) | 44 (66.7%) | 22 (33.3%) | ||
| Semi-skilled worker | 35 (2.7%) | 19 (3.0%) | 16 (2.5%) | 23 (65.7%) | 12 (34.3%) | ||
| Unskilled worker | 103 (8.1%) | 66 (10.3%) | 37 (5.8%) | 86 (83.6%) | 17 (16.5%) | ||
| Household duties | 319 (24.9%) | 133 (20.8%) | 186 (29.1%) | 262 (82.1%) | 57 (17.9%) | ||
| Unemployed (adults) | 73 (5.7%) | 36 (5.6%) | 37 (5.8%) | 39 (53.4%) | 34 (46.6%) | ||
| Attending school | 318 (24.9%) | 158 (24.7%) | 160 (25.0%) | 93 (29.2%) | 225 (70.8%) | ||
| Attending garderie/pre-school | 40 (3.1%) | 23 (3.6%) | 17 (2.7%) | 4 (10.0%) | 36 (90.0%) | ||
| At home (children) | 208 (16.3%) | 99 (15.5%) | 109 (17.0%) | 12 (5.8%) | 196 (94.2%) | ||
| Other | 8 (0.6%) | 7 (1.1%) | 1 (0.2%) | 6 (75.0%) | 2 (25.0%) | ||
| Total number of family members living in the same household: | 0.029 | 0.001 | |||||
| <2 | 21 (1.6%) | 11 (1.7%) | 10 (1.6%) | 18 (85.7%) | 3 (14.3%) | ||
| 2–3 | 241 (18.9%) | 107 (16.7%) | 134 (21.0%) | 140 (57.6%) | 103 (42.4%) | ||
| 4–5 | 683 (53.4%) | 337 (52.7%) | 346 (54.2%) | 334 (48.9%) | 349 (51.1%) | ||
| 6–9 | 291 (22.8%) | 156 (24.4%) | 135 (21.2%) | 138 (57.3%) | 153 (52.6%) | ||
| ≥10 | 42 (3.3%) | 29 (4.5%) | 13 (2.0%) | 17 (40.5%) | 25 (59.5%) | ||
| The number of rooms in house: | 0.058 | 0.800 | |||||
| <2 | 270 (21.1%) | 140 (21.9%) | 133 (20.8%) | 138 (51.1%) | 132 (48.9%) | ||
| 2–3 | 758 (59.4%) | 358 (56.0%) | 400 (62.5%) | 385 (50.8%) | 373 (49.2%) | ||
| 4–5 | 216 (16.9%) | 122 (19.0%) | 94 (14.7%) | 107 (49.5%) | 109 (50.5%) | ||
| ≥5 | 33 (2.6%) | 20 (3.1%) | 13 (2.0%) | 14 (42.4%) | 19 (57.6%) | ||
| WAMI: | |||||||
| W score | 0.095 (0.083) | 0.089 (0.066) | 0.15 | 0.100 (0.087) * | 0.090 (0.079) * | 0.097 | |
| A score | 0.141 (0.048) | 0.130 (0.053) | <0.001 | 0.142 (0.049) * | 0.139 (0.048) * | 0.47 | |
| M score | 0.152 (0.050) | 0.142 (0.044) | <0.001 | 0.133 (0.050) * | 0.168 (0.044) * | <0.001 | |
| I score | 0.168 (0.055) | 0.171 (0.051) | 0.217 | 0.171 (0.052) * | 0.165 (0.057) * | 0.1.61 | |
| WAMI index: | 0.003 | 0.164 | |||||
| Mean (SD) | 0.555 (0.139) | 0.532 (0.130) | 0.547 (0.143) * | 0.562 (0.135) * | |||
| Median | 0.562 | 0.547 | 0.547 | 0.562 | |||
| Range | 0.219–0.969 | 0.188–0.906 | 0.234–0.938 | 0.219–0.969 | |||
| 0.188–0.344 | 50 (7.8%) | 67 (10.5%) | 24 (8.1%) | 26 (7.6%) | |||
| >0.344–0.500 | 202 (31.6%) | 209 (32.7%) | 103 (34.7%) | 99 (28.9%) | |||
| >0.500–0.656 | 219 (34.2%) | 230 (35.9%) | 94 (31.6%) | 125 (36.4%) | |||
| >0.656–0.813 | 149 (23.3%) | 131 (20.5%) | 67 (22.6%) | 82 (23.9%) | |||
| >0.813–0.969 | 20 (3.1%) | 3 (0.5%) | 9 (3.0%) | 11 (3.2%) | |||
| The main source of drinking water for members of the household: | <0.001 | <0.001 | |||||
| a. Piped water into dwelling (i) | 100 (15.6%) | 22 (3.4%) | 63 (9.7%) | 59 (9.3%) | |||
| b. Tubewell/bore-hole (i) | 69 (10.8%) | 9 (1.4%) | 44 (6.8%) | 34 (5.4%) | |||
| c. Protected dug well (i) | 8 (1.3%) | 3 (0.5%) | 3 (0.5%) | 8 (1.3%) | |||
| d. Unprotected dug well (un) | 2 (0.3%) | 0 | 0 | 2 (0.3%) | |||
| e. Protected spring (i) | 8 (1.3%) | 0 | 4 (0.6%) | 4 (0.6%) | |||
| f. Unprotected spring (un) | 2 (0.3%) | 0 | 1 (0.2%) | 1 (0.2%) | |||
| g. Bottled water (un) | 451 (70.5%) | 361 (56.4%) | 441 (68.2%) | 371 (58.6%) | |||
| h. Cart with small tank/drum (un) | 0 | 6 (0.9%) | 5 (0.8%) | 1 (0.2%) | |||
| i. Other: refill gallon (un) | 0 | 239 (37.3%) | 86 (13.3%) | 153 (24.2%) | |||
| Source of drinking water: | 0.003 | 0.624 | |||||
| Improved | 185 (28.9%) | 34 (5.3%) | 114 (17.6%) | 105 (16.6%) | |||
| Unimproved | 455 (71.1%) | 606 (94.7%) | 533 (82.4%) | 528 (83.4.%) | |||
| Sanitation: If using a “flush” or “pour flush” probe, where does the waste go? | <0.001 | 0.010 | |||||
| a. Piped sewer system (i) | 56 (4.4%) | 11 (1.7%) | 45 (7.0%) | 36 (5.6%) | 20 (3.2%) | ||
| b. Septic tank (i) | 659 (51.5%) | 289 (45.2%) | 370 (57.8%) | 351 (54.3%) | 308 (48.7%) | ||
| c. Pit latrine (i) | 5 (0.4%) | 0 | 5 (0.8%) | 4 (0.6%) | 1 (0.2%) | ||
| d. Elsewhere (un) | 30 (2.3%) | 24 (3.8%) | 6 (0.9%) | 12 (1.9%) | 18 (2.8%) | ||
| e. No facilities or bush or field (un) | 2 (0.2%) | 0 | 2 (0.3%) | 2 (0.3%) | 0 | ||
| f. Other: ditch (river) (un) | 521 (40.7%) | 314 (49.1%) | 207 (32.3%) | 240 (37.1%) | 281 (44.4%) | ||
| g. Do not know (un) | 7 (0.5%) | 2 (0.3%) | 5 (0.8%) | 2 (0.3%) | 5 (0.8%) | ||
| Sanitation facility: | <0.001 | 0.002 | |||||
| Improved | 720 (56.25%) | 300 (46.9) | 420 (65.6) | 391 (60.4) | 329 (52.0) | ||
| Unimproved | 560 (43.75%) | 340 (53.1 | 220 (34.4) | 256 (39.6) | 304 (48.0) | ||
| Anti-HAV IgG (S/CO) | Living Area | p Value | Anti-HAV IgG | Total (S/CO) | ||
|---|---|---|---|---|---|---|
| Urban n = 640 | Rural n = 640 | Positive n = 647 | Negative n = 633 | |||
| Average (SD) | 4.75 (5.048) | 5.73 (5.29) | <0.001 * | 10.192 (1.953) | 0.186 (0.121) | 5.24 (5.19) |
| Median | 0.32 | 7.89 | 10.62 | 0.15 | 1.96 | |
| Range | 0.07–13.06 | 0.05–19.29 | 1.01–19.29 | 0.05 –0.95 | 0.05–19.29 | |
| Seroprotected | 0.003 ** | |||||
| Positive | 297 (46.4%) | 350 (54.7%) | 647 (50.6%) | |||
| Negative | 343 (53.6%) | 290 (45.3%) | 633 (49.4%) | |||
| Characteristics | Urban | p Value * | Rural | p Value ** | Positivity Between Urban and Rural p Value *** | ||
|---|---|---|---|---|---|---|---|
| Positive n (%) 297 (46.4) | Negative n (%) 343 (53.6) | Positive n (%) 350 (54.7) | Negative n (%) 290 (45.3) | ||||
| Sex | 0.049 | 0.020 | |||||
| Male | 119 (42.0%) | 164 (58.0%) | 108 (48.4%) | 115 (51.6%) | 0.152 | ||
| Female | 178 (49.9%) | 179 (50.1%) | 242 (58.0%) | 175 (42.0%) | 0.023 | ||
| Age (Years) | <0.001 * | <0.001 * | |||||
| 1–2 | 1 (1.8%) | 54 (98.2%) | 4 (7.3%) | 51 (92.7%) | 0.363 | ||
| 3–4 | 3 (5.5%) | 52 (94.5%) | 4 (7.3%) | 51 (92.7%) | 1.000 | ||
| 5–9 | 6 (12.0%) | 44 (88.0%) | 4 (8.0%) | 46 (92.0%) | 0.741 | ||
| 10–14 | 7 (14.0%) | 43 (86.0%) | 22 (44.0%) | 28 (56.0%) | 0.001 | ||
| 15–19 | 19 (27.1%) | 51 (72.9%) | 30 (42.9%) | 40 (57.1%) | 0.051 | ||
| 20–24 | 32 (42.7%) | 43 (57.3%) | 43 (57.3%) | 32 (42.7%) | 0.072 | ||
| 25–29 | 43 (57.3%) | 32 (42.7%) | 54 (72.0%) | 21 (28.0%) | 0.060 | ||
| 30–34 | 52 (80.0%) | 13 (20.0%) | 53 (81.5%) | 12 (18.5%) | 0.824 | ||
| 35–39 | 56 (86.1%) | 9 (13.9%) | 58 (89.2%) | 7 (10.8%) | 0.593 | ||
| 40–49 | 48 (96.0%) | 2 (4.0%) | 48 (96.0%) | 2 (4.0%) | 1.000 | ||
| ≥50 | 30 (100%) | 0 | 30 (100%) | 0 | 1.000 | ||
| Variables | Total | Living Area | p Value | Anti-HAV Ig G | p Value | ||
|---|---|---|---|---|---|---|---|
| Urban | Rural | Positive | Negative | ||||
| Knowledge of disease | |||||||
| 1. Heard about a disease called hepatitis A before (yes) Kind of disease: | 437 (34.1%) | 276 (43.1%) | 161 (25.2%) | 217 (33.5%) | 220 (34.8%) | ||
| a. Communicable | 222 (50.8%) | 125 (45.3%) | 97 (60.2%) | <0.001 | 117 (53.4%) | 105 (47.3%) | 0.647 |
| b. Non-communicable | 102 (23.5%) | 64 (23.2%) | 38 (23.6%) | 0.001 | 47 (21.55) | 55 (24.8%) | 0.433 |
| c. Do not know | 113 (25.8%) | 87 (31.5%) | 26 (16.1%) | 55 (25.1%) | 62 (27.9%) | ||
| 2. The main way of transmission | <0.001 | 0.009 | |||||
| a. By blood | 71 (20.5%) | 57 (24.6%) | 14 (12.3%) | 24 (14.4%) | 47 (26.3%) | ||
| b. By air | 55 (15.9%) | 46 (19.8%) | 9 (7.9%) | 21 (12.6%) | 34 (19.0%) | ||
| c. Sexually transmitted | 14 (4.0%) | 13 (5.6%) | 1 (0.9%) | 6 (3.6%) | 8 (4.5%) | ||
| d. By contaminated food/water | 151 (43.6%) | 81 (34.9%) | 70 (61.4%) | 81 (48.5%) | 70 (39.1%) | ||
| e. By mosquito bite | 17 (4.9%) | 16 (6.9%) | 1 (0.9%) | 11 (6.6%) | 6 (3.4%) | ||
| f. Combination | 38 (11.0%) | 19 (8.2%) | 19 (16.7%) | 24 (14.4%) | 14 (7.8%) | ||
| 3. A vaccine to prevent hepatitis A available in Indonesia | |||||||
| 257 (58.8%) | 165 (59.8%) | 92 (57.1%) | 0.522 | 128 (59.3%) | 129 (58.4%) | 0.494 |
| 35 (8.0%) | 19 (6.9%) | 16 (9.9%) | 14 (6.5%) | 21 (9.5%) | ||
| 145 (33.2%) | 92 (33.3%) | 53 (32.9%) | 74 (34.3%) | 71 (32.1%) | ||
| 4. The possible risk factor/factors | (n = 439) | (n = 279) | (n = 160) | ||||
| 191 (43.5%) | 125 (44.8%) | 66 (41.2%) | 0.470 | 97 (15.0%) | 94 (14.8%) | 0.943 |
| 193 (44.0%) | 100 (35.8%) | 93 (58.1%) | <0.001 | 93 (14.4%) | 99 (15.6%) | 0.526 |
| 60 (13.7%) | 30 (10.8%) | 30 (18.8%) | 0.019 | 28 (4.3%) | 32 (5.0%) | 0.538 |
| 70 (15.9%) | 45 (16.1%) | 25 (15.6%) | 0.890 | 33 (5.1%) | 37 (5.8%) | 0.558 |
| 108 (24.6%) | 86 (30.8%) | 22 (13.8%) | <0.001 | 55 (8.5%) | 53 (8.4%) | 0.934 |
| 5. The possible symptoms of hepatitis A | (n = 442) | (n = 280) | (n = 162) | ||||
| 317 (71.7%) | 193 (68.9%) | 124 (76.5%) | 0.087 | 165 (75.0%) | 152 (68.5%) | 0.029 |
| 188 (42.5%) | 118 (42.1%) | 70 (43.2%) | 0.827 | 93 (42.3%) | 95 (42.8%) | 0.078 |
| 78 (17.6%) | 53 (18.9%) | 25 (15.4%) | 0.353 | 37 (16.8%) | 41 (18.5%) | 0.737 |
| 195 (44.1%) | 134 (47.9%) | 61 (37.7%) | 0.038 | 98 (44.5%) | 97 (43.7%) | 0.981 |
| 83 (18.8%) | 52 (18.6%) | 31 (19.1%) | 0.884 | 40 (18.2%) | 43 (19.5%) | 0.750 |
| 261 (59.0%) | 179 (63.9%) | 82 (50.6%) | 0.006 | 130 (59.1%) | 131 (59.0%) | 0.618 |
| 146 (33.0%) | 96 (34.3%) | 50 (30.9%) | 0.462 | 69 (31.4%) | 77 (34.7%) | 0.678 |
| 6. Knowledge of HAV ** | <0.001 | 0.645 * | |||||
| Adequate | 839 (65.5%) | 361 (56.4%) | 478 (74.7%) | 428 (66.2%) | 411 (64.9%) | ||
| Inadequate | 441 (34.5%) | 279 (43.6%) | 162 (25.3%) | 219 (33.8%) | 222 (35.1%) | ||
| Hygienic food intake | |||||||
| 1. Prepare food at home | <0.001 | 0.278 | |||||
| 288 (22.5%) | 90 (14.1%) | 198 (30.9%) | 157 (24.3%) | 131 (20.7%) | ||
| 447 (34.9%) | 203 (31.6%) | 245 (38.3%) | 217 (33.5%) | 230 (36.4%) | ||
| 544 (42.5%) | 347 (54.3%) | 197 (30.8%) | 273 (42.2%) | 271 (42.9%) | ||
| 2. Main meals from home | <0.001 | 0.004 | |||||
| a. Never | 22 (1.7%) | 10 (1.6%) | 12 (1.9%) | 15 (2.3%) | 7 (1.1%) | ||
| b. Sometimes | 300 (23.4%) | 115 (18.0%) | 185 (28.9%) | 168 (26.0%) | 132 (20.9%) | ||
| c. Most of the time | 194 (15.2%) | 157 (24.5%) | 37 (5.8%) | 108 (16.7%) | 86 (13.6%) | ||
| d. Always | 764 (59.7%) | 358 (55.9%) | 406 (63.4%) | 356 (55.0%) | 408 (64.5%) | ||
| 3. Main meals from street | <0.001 | 0.075 | |||||
| 393 (30.7%) | 208 (32.5%) | 185 (28.9%) | 206 (31.8%) | 187 (29.5%) | ||
| 760 (59.4%) | 349 (54.5%) | 411 (64.2%) | 365 (56.4%) | 395 (62.4%) | ||
| 98 (7.7%) | 68 (10.6%) | 30 (4.7%) | 59 (9.1%) | 39 (6.2%) | ||
| 29 (2.3%) | 15 (2.3%) | 14 (2.2%) | 17 (2.6%) | 12 (1.9%) | ||
| 4. Wash hands before handling food | <0.001 | 0.032 | |||||
| 15 (1.2%) | 3 (0.5%) | 12 (1.9%) | 13 (2.0%) | 2 (0.3%) | ||
| 210 (16.4%) | 64 (10.0%) | 146 (22.8%) | 109 (16.9%) | 101 (16.0%) | ||
| 178 (13.9%) | 28 (4.4%) | 150 (23.5%) | 93 (14.4%) | 85 (13.4%) | ||
| 876 (68.5%) | 545 (85.2%) | 331 (51.8%) | 431 (66.7%) | 445 (70.3%) | ||
| 5. Wash hands before eating food | <0.001 | 0.402 | |||||
| 3 (0.2%) | 0 | 3 (0.5%) | 2 (0.3%) | 1 (0.2%) | ||
| 75 (5.9%) | 4 (0.6%) | 38 (5.9%) | 32 (4.9%) | 43 (6.8%) | ||
| 123 (9.6%) | 8 (1.3%) | 103 (16.1%) | 67 (10.4%) | 56 (8.8%) | ||
| 1079 (84.3%) | 627 (98.1%) | 496 (77.5%) | 546 (84.4%) | 533 (84.2%) | ||
| 6. Wash hands after defecation (in case of younger children) | 0.024 | 0.006 | |||||
| 1 (0.1%) | 0 | 1 (0.2%) | 0 | 1 (0.2%) | ||
| 21 (1.6%) | 4 (0.6%) | 17 (2.7%) | 3 (0.5%) | 18 (2.8%) | ||
| 14 (1.1%) | 8 (1.3%) | 6 (0.9%) | 7 (1.1%) | 7 (1.1%) | ||
| 1242 (97.2%) | 627 (98.1%) | 615 (96.2%) | 636 (98.5%) | 606 (95.9%) | ||
| 7. The kitchen which prepared the food: free of insects and rodents | <0.001 | 0.077 | |||||
| 392 (30.6%) | 148 (23.1%) | 244 (38.1%) | 207 (32.0%) | 185 (29.2%) | ||
| 686 (53.6%) | 391 (61.1%) | 295 (46.1%) | 326 (50.4%) | 360 (56.9%) | ||
| 85 (6.6%) | 40 (6.3%) | 45 (7.0%) | 51 (7.9%) | 34 (5.4%) | ||
| 117 (9.1%) | 61 (9.5%) | 56 (8.8%) | 63 (9.7%) | 54 (8.5%) | ||
| Variables | Coeff B | SE (B) | p-Value | PRadj (95% CI) |
|---|---|---|---|---|
| Living area (rural vs. urban) | 0.485 | 0.154 | 0.002 | 1.62 (1.20–2.19) |
| Age (years) * | ||||
| 3–4 | 0.124 | 0.577 | 0.830 | 1.13 (0.37–3.50) |
| 5–9 | 0.705 | 0.539 | 0.198 | 2.02 (0.70–5.82) |
| 10–14 | 2.029 | 0.480 | <0.001 | 7.60 (2.97–19.47) |
| 15–19 | 2.247 | 0.459 | <0.001 | 9.46 (3.84–23.26) |
| 20–24 | 2.927 | 0.454 | <0.001 | 18.68 (7.67–45.46) |
| 25–29 | 3.477 | 0.459 | <0.001 | 32.35 (13.16–79.57) |
| 30–34 | 4.254 | 0.483 | <0.001 | 69.75 (27.08–179.63) |
| 35–39 | 4.760 | 0.508 | <0.001 | 116.72 (43.12–315.90) |
| ≥40 | 6.433 | 0.666 | <0.001 | 621.97 (168.77–2292.18) |
| Education of father ** | ||||
| Illiterate and primary school (6 years) | 0.673 | 0.327 | 0.040 | 1.96 (1.03–3.72) |
| Middle school (9 years) | 0.716 | 0.332 | 0.031 | 2.05 (1.07–3.92) |
| High school (13 years) | 0.254 | 0.311 | 0.414 | 1.29 (0.70–2.37) |
| The kitchen which prepared the food: free of insects and rodents | 0.596 | 0.217 | 0.006 | 1.82 (1.19–2.78) |
Disclaimer/Publisher’s Note: The statements, opinions and data contained in all publications are solely those of the individual author(s) and contributor(s) and not of MDPI and/or the editor(s). MDPI and/or the editor(s) disclaim responsibility for any injury to people or property resulting from any ideas, methods, instructions or products referred to in the content. |
© 2025 by the authors. Published by MDPI on behalf of the Lithuanian University of Health Sciences. Licensee MDPI, Basel, Switzerland. This article is an open access article distributed under the terms and conditions of the Creative Commons Attribution (CC BY) license (https://creativecommons.org/licenses/by/4.0/).
Share and Cite
Prasetyo, D.; Ermaya, Y.S.; Hernandez-Suarez, G.; Guzman-Holst, A.; Kartasasmita, C.B. Seroprevalence and Shifting Endemicities of Hepatitis A Virus Infection in Two Contrasting Geographical Areas in Indonesia. Medicina 2025, 61, 806. https://doi.org/10.3390/medicina61050806
Prasetyo D, Ermaya YS, Hernandez-Suarez G, Guzman-Holst A, Kartasasmita CB. Seroprevalence and Shifting Endemicities of Hepatitis A Virus Infection in Two Contrasting Geographical Areas in Indonesia. Medicina. 2025; 61(5):806. https://doi.org/10.3390/medicina61050806
Chicago/Turabian StylePrasetyo, Dwi, Yudith Setiati Ermaya, Gustavo Hernandez-Suarez, Adriana Guzman-Holst, and Cissy B. Kartasasmita. 2025. "Seroprevalence and Shifting Endemicities of Hepatitis A Virus Infection in Two Contrasting Geographical Areas in Indonesia" Medicina 61, no. 5: 806. https://doi.org/10.3390/medicina61050806
APA StylePrasetyo, D., Ermaya, Y. S., Hernandez-Suarez, G., Guzman-Holst, A., & Kartasasmita, C. B. (2025). Seroprevalence and Shifting Endemicities of Hepatitis A Virus Infection in Two Contrasting Geographical Areas in Indonesia. Medicina, 61(5), 806. https://doi.org/10.3390/medicina61050806