
Hemodialysis Patients May Benefit from Cholecalciferol Treatment Targeting High Level of 25(OH)D

 , , , ,
  and
and 
Abstract
1. Introduction
2. Materials and Methods
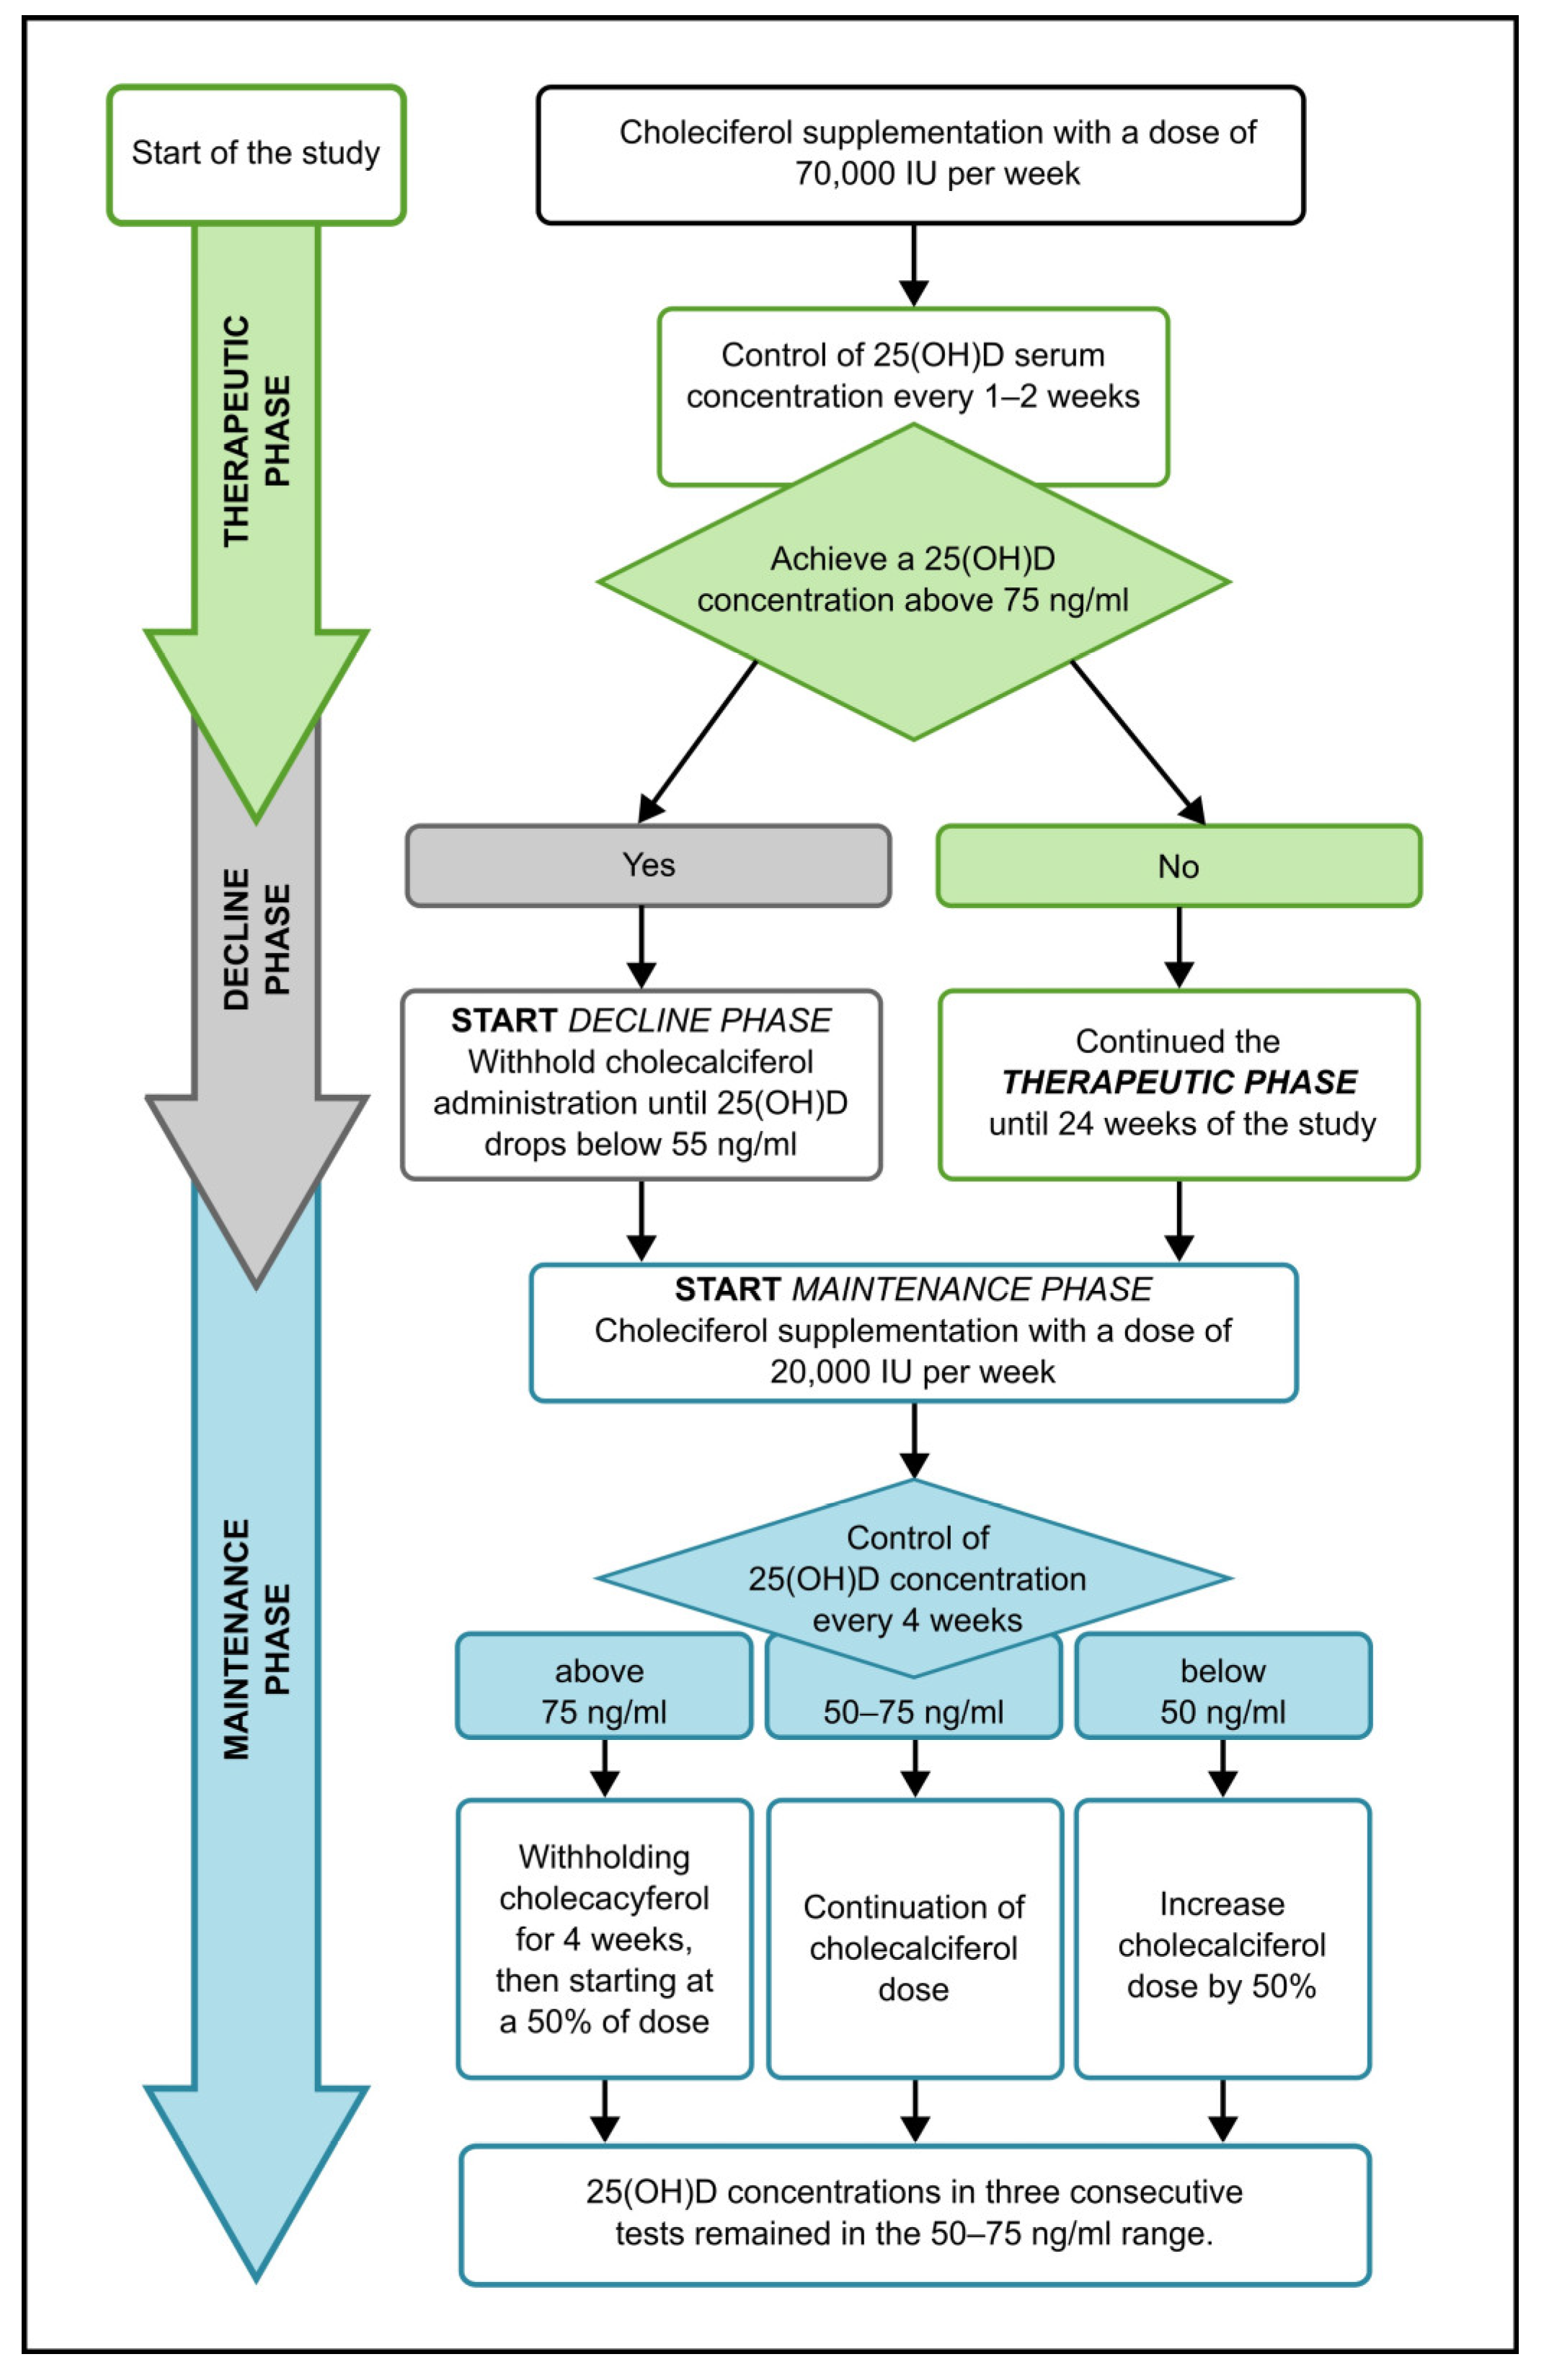
2.1. Study Design
2.2. Patients
2.3. Therapeutic and Maintenance Dose Management
2.4. Laboratory Measurements
2.4.1. 25(OH)D and 1,25(OH)2D
2.4.2. 1–84 PTH
2.4.3. Calcium and Phosphorus
2.5. Statistical Analysis
3. Results
3.1. Characteristics of the Study Group
3.2. Laboratory Measurements
3.2.1. 25(OH)D
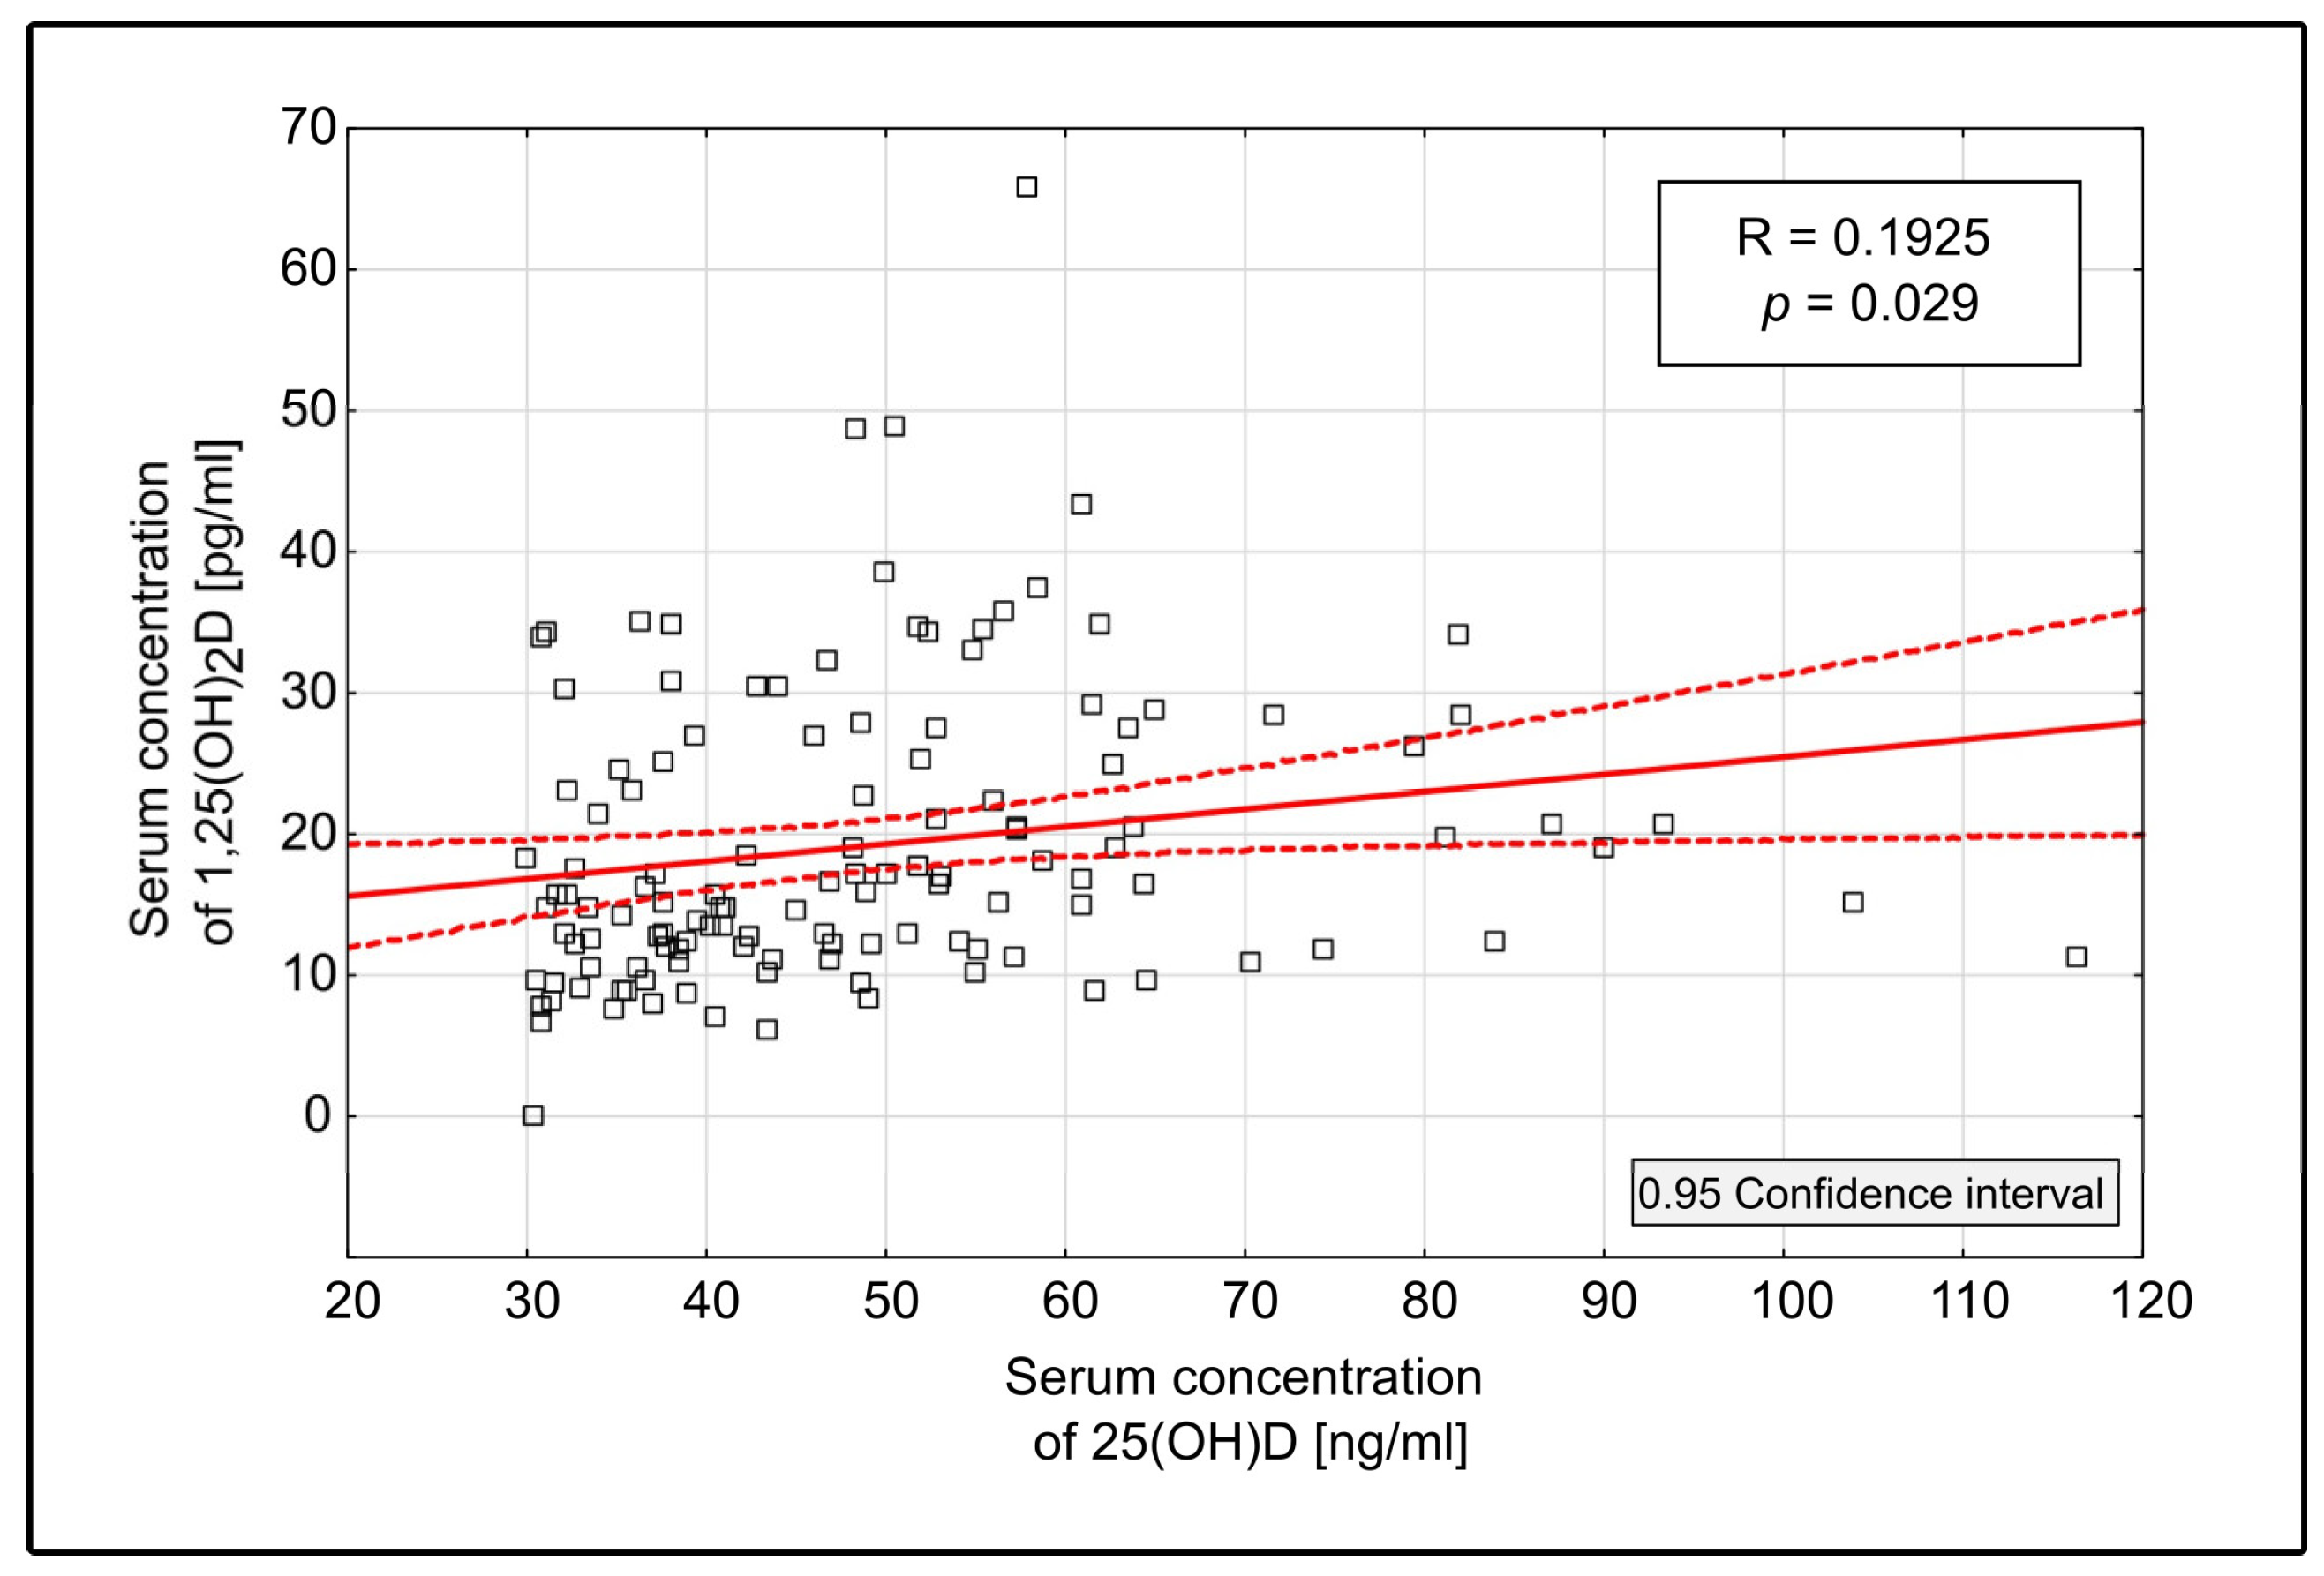
3.2.2. 1,25(OH)2D
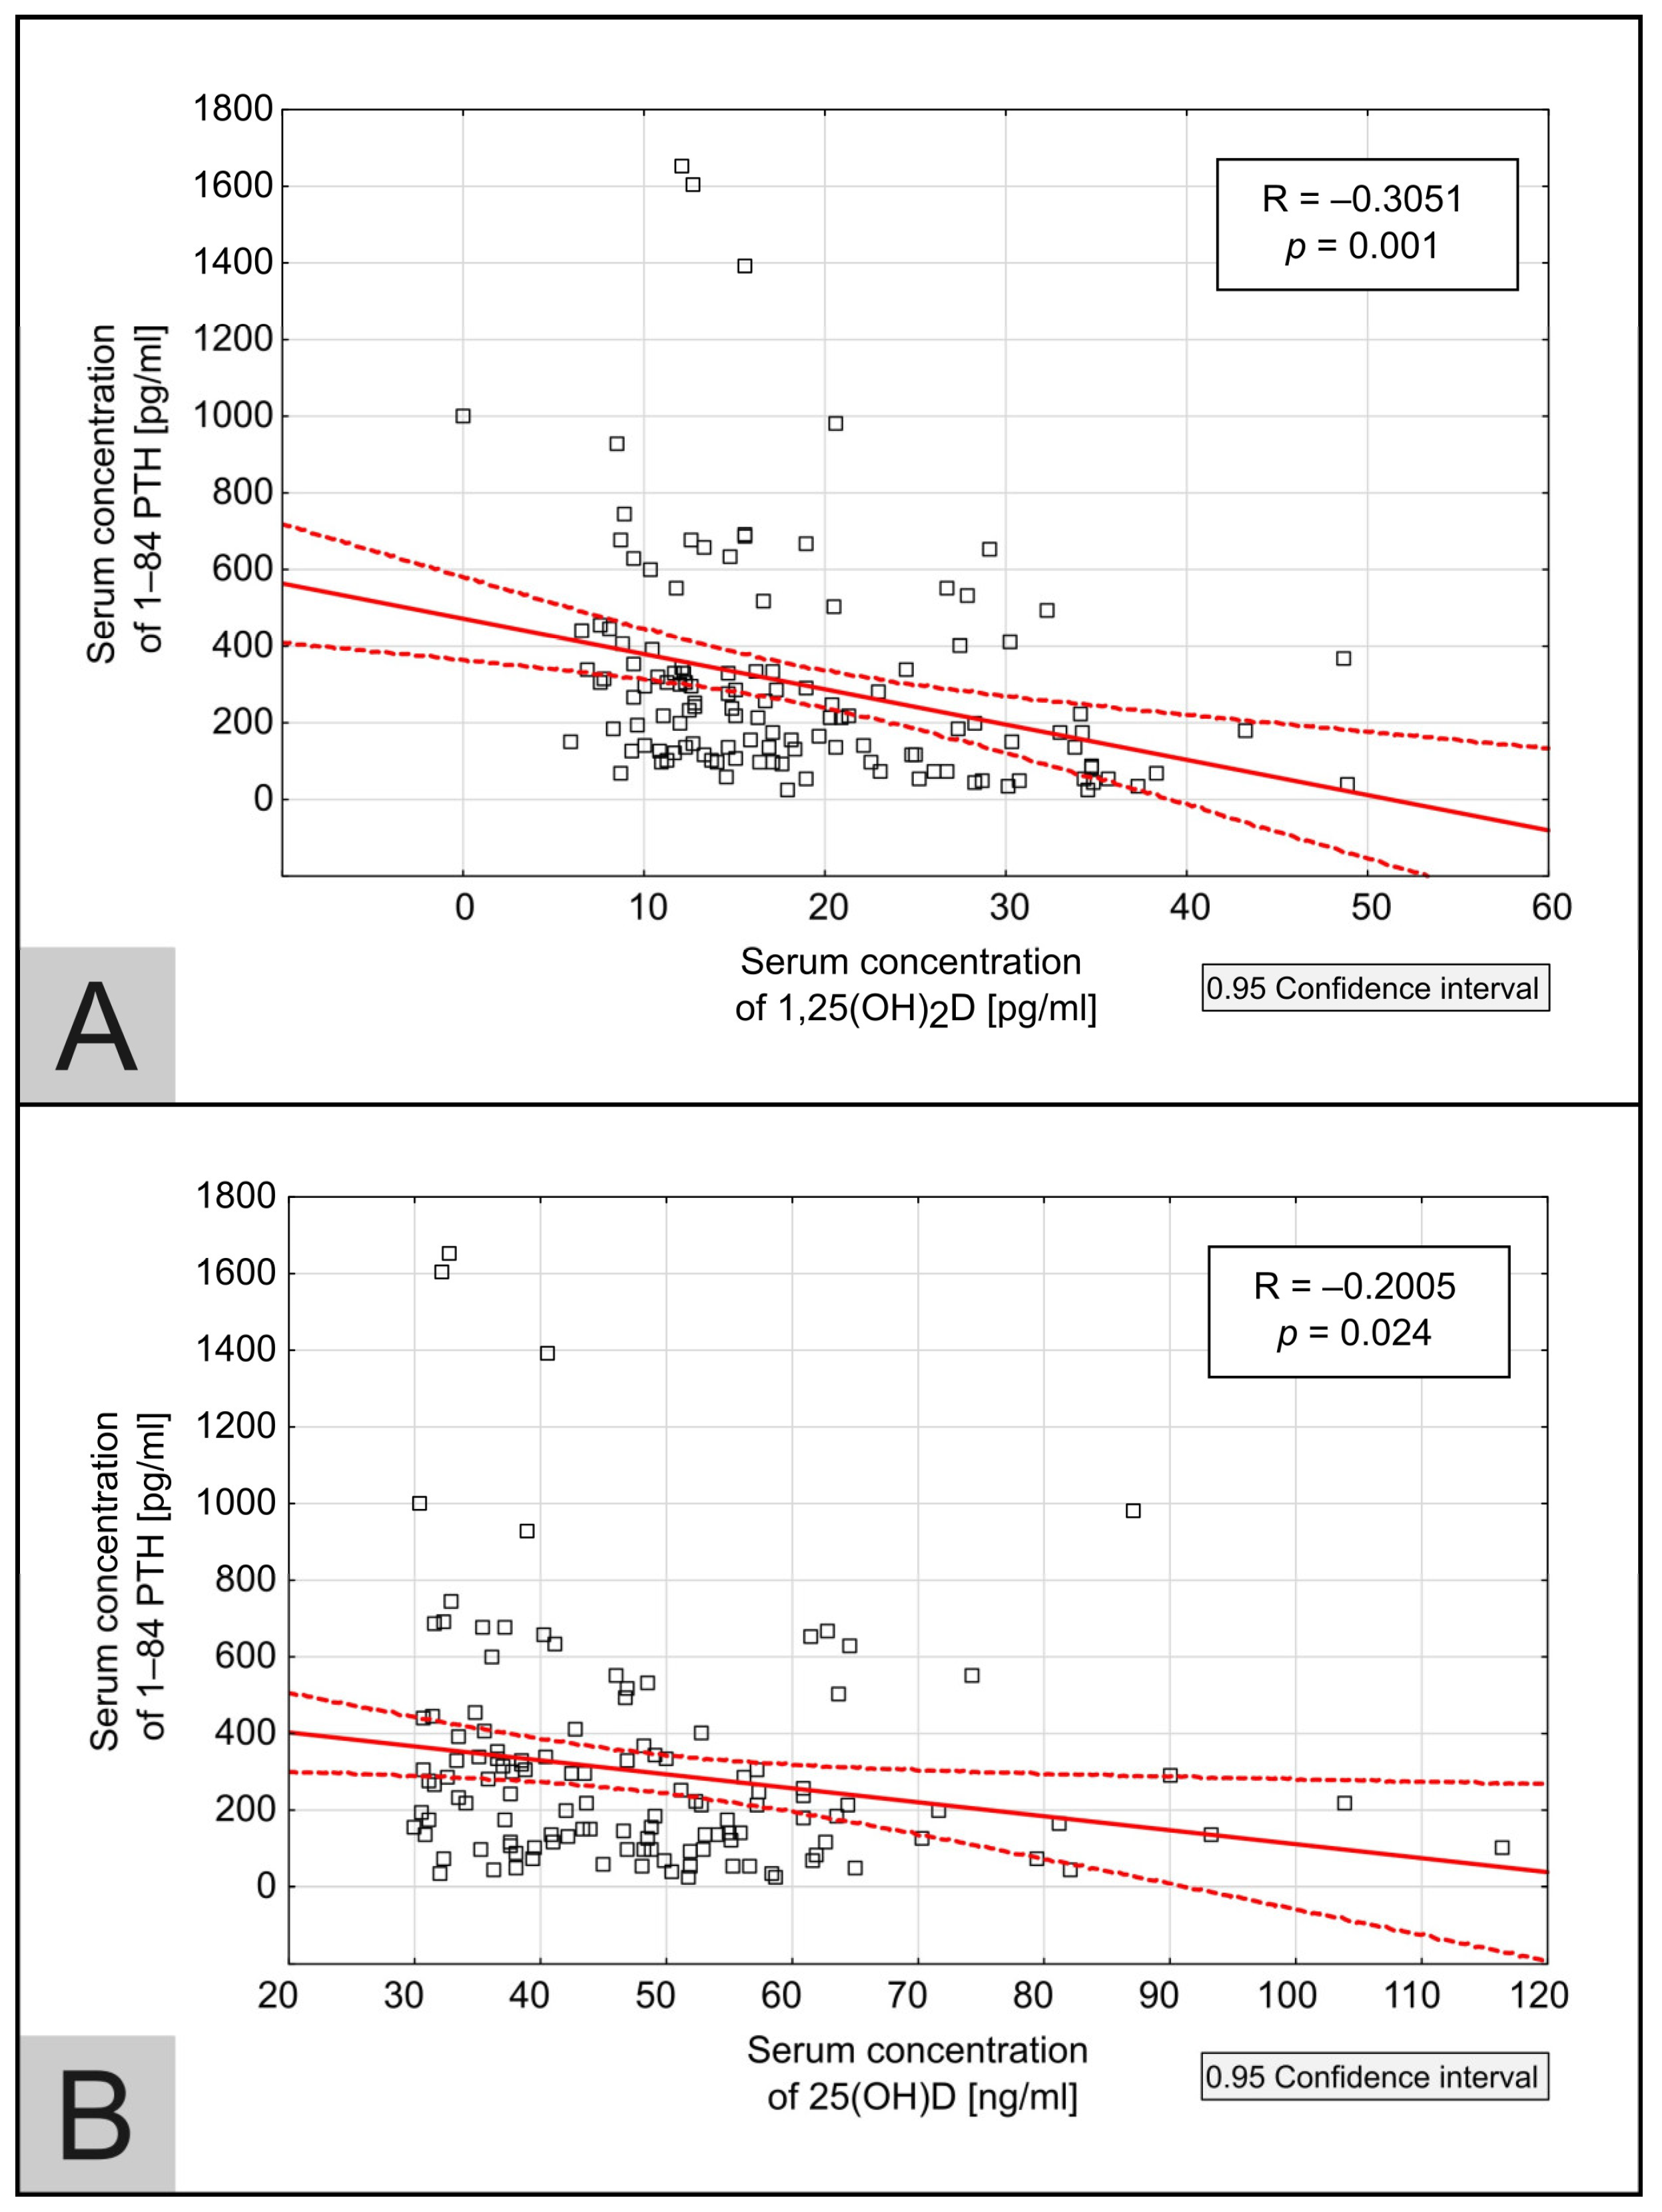
3.2.3. 1–84 PTH
3.2.4. Independent Associations Between 25(OH)D, 1,25(OH)2D, 1–84 PTH
3.2.5. Calcium
3.2.6. Phosphorus
3.3. The Maintenance Cholecalciferol Dose Adjustment
4. Discussion
5. Conclusions
Author Contributions
Funding
Institutional Review Board Statement
Informed Consent Statement
Data Availability Statement
Acknowledgments
Conflicts of Interest
References
- Hryciuk, M.; Heleniak, Z.; Dębska-Ślizień, A. Management of Chronic Kidney Disease—Mineral and Bone Disorder. Ren. Dis. Transplant. Forum 2023, 16, 65–80. [Google Scholar] [CrossRef]
- Pludowski, P.; Takacs, I.; Boyanov, M.; Belaya, Z.; Diaconu, C.C.; Mokhort, T.; Zherdova, N.; Rasa, I.; Payer, J.; Pilz, S. Clinical Practice in the Prevention, Diagnosis and Treatment of Vitamin D Deficiency: A Central and Eastern European Expert Consensus Statement. Nutrients 2022, 14, 1483. [Google Scholar] [CrossRef] [PubMed]
- Płudowski, P.; Kos-Kudła, B.; Walczak, M.; Fal, A.; Jackowska, T.; Helwich, E.; Mazur, A. Guidelines for Preventing and Treating Vitamin D Deficiency: A 2023 Update in Poland. Nutrients 2023, 5, 695. [Google Scholar] [CrossRef] [PubMed]
- Kidney Disease: Improving Global Outcomes (KDIGO) CKD-MBD Update Work Group. KDIGO 2017 Clinical Practice Guideline Update for the Diagnosis, Evaluation, Prevention, and Treatment of Chronic Kidney Disease-Mineral and Bone Disorder (CKD-MBD). Kidney Int. Suppl. 2017, 7, 1–59. [Google Scholar] [CrossRef]
- Kim, S.M.; Choi, H.J.; Lee, J.P.; Kim, D.K.; Oh, Y.K.; Kim, Y.S.; Lim, C.S. Prevalence of Vitamin D Deficiency and Effects of Supplementation with Cholecalciferol in Patients with Chronic Kidney Disease. J. Ren. Nutr. 2014, 24, 20–25. [Google Scholar] [CrossRef]
- Zawierucha, J.; Małyszko, J.; Durlik, M.; Ciechanowski, K.; Nowicki, M.; Oko, A.; Rutkowski, B.; Stompór, T.; Kroczak, M.; Dryl-Rydzyńska, T. Treatment of secondary hyperparathyroidism hemodialysis patients in Poland—Real life scenario. Nefrol. Dial. Pol. 2016, 20, 197–200. (In Polish) [Google Scholar]
- Tarasewicz, A.; Komorniczak, M.; Zakrzewska, A.; Biedunkiewicz, B.; Małgorzewicz, S.; Jankowska, M.; Jasiulewicz, K.; Płonka, N.; Dąbrowska, M.; Dębska-Ślizień, A.; et al. The Efficacy and Safety of High-Dose Cholecalciferol Therapy in Hemodialysis Patients. Biomedicines 2024, 12, 377. [Google Scholar] [CrossRef]
- Omrani, H.R.; Daraizade, A. Cholecalciferol versus Calcitriol to Manage Secondary Hyperparathyroidism in Hemodialysis Patients. J. Parathyr. Dis. 2018, 5, 87–90. [Google Scholar] [CrossRef]
- Mieczkowski, M.; Żebrowski, P.; Wojtaszek, E.; Stompór, T.; Przedlacki, J.; Bartoszewicz, Z.; Sierdziński, J.; Wańkowicz, Z.; Niemczyk, S.; Matuszkiewicz-Rowińska, J. Long-Term Cholecalciferol Administration in Hemodialysis Patients: A Single-Center Randomized Pilot Study. Med. Sci. Moni. 2014, 20, 2228–2234. [Google Scholar] [CrossRef]
- Matuszkiewicz-Rowińska, J.; Kulicki, P.; Zebrowski, P.; Klatko, W.; Sokalski, A.; Niemczyk, S.; Wypych-Birecka, M.; Małyszko, J. Cholecalciferol vs. Small Doses of Alfacalcidol vs. Placebo in Chronic Kidney Disease Patients on Hemodialysis: A Randomized Parallel Group. Study. Front. Med. 2022, 8, 781191. [Google Scholar] [CrossRef]
- Tokmak, F.; Quack, I.; Schieren, G.; Sellin, L.; Rattensperger, D.; Holland-letz, T.; Weiner, S.M.; Rump, L.C. High-Dose Cholecalciferol to Correct. Vitamin D Deficiency in Haemodialysis Patients. Nephrol. Dial. Transpl. 2008, 23, 4016–4020. [Google Scholar] [CrossRef] [PubMed]
- Massart, A.; Debelle, F.D.; Racape, J.; Gervy, C.; Husson, C.; Dhaene, M.; Wissing, K.M.; Nortier, L. Original Investigation Biochemical Parameters After Cholecalciferol Repletion in Hemodialysis: Results From the VitaDial Randomized Trial. Am. J. Kidney Dis. 2014, 64, 696–705. [Google Scholar] [CrossRef] [PubMed]
- Jean, G.; Souberbielle, J.-C.; Chazot, C. Monthly Cholecalciferol Administration in Haemodialysis Patients: A Simple and Efficient Strategy for Vitamin D Supplementation. Nephrol. Dial. Transpl. 2009, 24, 3799–3805. [Google Scholar] [CrossRef] [PubMed]
- Wasse, H.; Huang, R.; Long, Q.; Singapuri, S.; Raggi, P.; Tangpricha, V. Efficacy and Safety of a Short Course of Very-High-Dose Cholecalciferol in Hemodialysis. Am. J. Clin. Nutr. 2012, 95, 522–528. [Google Scholar] [CrossRef] [PubMed]
- Guella, A.; Abduelkarem, A.R.; Hassanein, M.M. The Effects and Safety of High Dose Vitamin D3 in Hemodialysis Patients. Pharm. Pract. 2023, 21, 2773. [Google Scholar] [CrossRef]
- Jean, G.; Terrat, J.C.; Vanel, T.; Hurot, J.M.; Lorriaux, C.; Mayor, B.; Chazot, C. Evidence for Persistent Vitamin D 1-Alpha-Hydroxylation in Hemodialysis Patients: Evolution of Serum 1,25-Dihydroxycholecalciferol after 6 Months of 25-Hydroxycholecalciferol Treatment. Nephron Clin. Pract. 2008, 110, c58–c65. [Google Scholar] [CrossRef]
- Matias, P.J.; Laranjinha, I.; Ávila, G.; Azevedo, A.; Jorge, C.; Ferreira, C.; Aires, I.; Amaral, T.; Gil, C.; Ferreira, A. Long-Term Cholecalciferol Supplementation in Hemodialysis Patients: Effects on Mineral Metabolism, Inflammation, and Cardiac Parameters. Semin. Dial. 2023, 36, 29–36. [Google Scholar] [CrossRef] [PubMed]
- Huish, S.A.; Jenkinson, C.; Dunn, J.A.; Meredith, D.J.; Bland, R.; Hewison, M. Low serum 1,25(OH)2D3 in end-stage renal disease: Is reduced 1α-hydroxylase the only problem? Endocr. Connect. 2021, 10, 1291–1298. [Google Scholar] [CrossRef]
- Friedl, C.; Zitt, E. Vitamin D Prohormone in the Treatment of Secondary Hyperparathyroidism in Patients with Chronic Kidney Disease. Int. J. Nephrol. Renov. Dis. 2017, 10, 109–122. [Google Scholar] [CrossRef]
- Strugnell, S.A.; Sprague, S.M.; Ashfaq, A.; Petkovich, M.; Bishop, C.W. Rationale for Raising Current Clinical Practice Guideline Target for Serum 25-Hydroxyvitamin D in Chronic Kidney Disease. Am. J. Nephrol. 2019, 49, 284–293. [Google Scholar] [CrossRef]
- Marcinowska-Suchowierska, E.; Kupisz-Urbańska, M.; Łukaszkiewicz, J.; Płudowski, P.; Jones, G. Vitamin D Toxicity—A Clinical Perspective. Front. Endocrinol. 2018, 20, 550. [Google Scholar] [CrossRef] [PubMed]
- Brandenburg, V.; Ketteler, M. Vitamin D and Secondary Hyperparathyroidism in Chronic and the Future. Nutrients 2022, 14, 3009. [Google Scholar] [CrossRef]


| Parameters | Serum Concentration at T0 | Serum Concentration at Tmax | p-Value |
|---|---|---|---|
| Calcium [mg/dL] | 9.04 (7.8–8.8) | 9.1 (9.84–8.3) | 0.23 |
| Phosphorus [mg/dL] | 4.95 (3.9–5.7) | 5.05 (3.9–5.7) | 0.93 |
| 1–84 PTH [pg/mL] | 416 (275–685) | 214.0 (215–636) | <0.005 |
| 25(OH)D [ng/mL] | 32.9 (31.6–35.2) | 81.05 (69–90.1) | <0.005 |
| 1,25(OH)2D [pg/mL] | 12.05 (8.9–9.3) | 22.8 (16.6–34.4) | <0.005 |
| 25(OH)D Range [ng/mL] | 1,25(OH)2 D [pg/mL] | 1,25(OH)2D in Normal Range |
|---|---|---|
|
30–49.9 (n = 78) | 13.95 (10.5–21.4) | 15.39% |
|
50–75 (n = 38) | 20.45 (16.3–33.0) | 42.11% |
|
over 75 (n = 13) | 19.70 (12.3–26.1) | 46.15% |
Disclaimer/Publisher’s Note: The statements, opinions and data contained in all publications are solely those of the individual author(s) and contributor(s) and not of MDPI and/or the editor(s). MDPI and/or the editor(s) disclaim responsibility for any injury to people or property resulting from any ideas, methods, instructions or products referred to in the content. |
© 2024 by the authors. Published by MDPI on behalf of the Lithuanian University of Health Sciences. Licensee MDPI, Basel, Switzerland. This article is an open access article distributed under the terms and conditions of the Creative Commons Attribution (CC BY) license (https://creativecommons.org/licenses/by/4.0/).
Share and Cite
Tarasewicz, A.; Dąbrowska, M.; Komorniczak, M.; Zakrzewska, A.; Biedunkiewicz, B.; Małgorzewicz, S.; Jankowska, M.; Jasiulewicz, K.; Płonka, N.; Dębska-Ślizień, A.; et al. Hemodialysis Patients May Benefit from Cholecalciferol Treatment Targeting High Level of 25(OH)D. Medicina 2024, 60, 1831. https://doi.org/10.3390/medicina60111831
Tarasewicz A, Dąbrowska M, Komorniczak M, Zakrzewska A, Biedunkiewicz B, Małgorzewicz S, Jankowska M, Jasiulewicz K, Płonka N, Dębska-Ślizień A, et al. Hemodialysis Patients May Benefit from Cholecalciferol Treatment Targeting High Level of 25(OH)D. Medicina. 2024; 60(11):1831. https://doi.org/10.3390/medicina60111831
Chicago/Turabian StyleTarasewicz, Agnieszka, Małgorzata Dąbrowska, Michał Komorniczak, Agnieszka Zakrzewska, Bogdan Biedunkiewicz, Sylwia Małgorzewicz, Magdalena Jankowska, Katarzyna Jasiulewicz, Natalia Płonka, Alicja Dębska-Ślizień, and et al. 2024. "Hemodialysis Patients May Benefit from Cholecalciferol Treatment Targeting High Level of 25(OH)D" Medicina 60, no. 11: 1831. https://doi.org/10.3390/medicina60111831
APA StyleTarasewicz, A., Dąbrowska, M., Komorniczak, M., Zakrzewska, A., Biedunkiewicz, B., Małgorzewicz, S., Jankowska, M., Jasiulewicz, K., Płonka, N., Dębska-Ślizień, A., & Tylicki, L. (2024). Hemodialysis Patients May Benefit from Cholecalciferol Treatment Targeting High Level of 25(OH)D. Medicina, 60(11), 1831. https://doi.org/10.3390/medicina60111831