
Favorable Mortality-to-Incidence Ratio Trends of Lung Cancer in Countries with High Computed Tomography Density
 ,
,  ,
, 
Abstract
1. Introduction
2. Materials and Methods
3. Results
3.1. Human Development Index and the CT Density in Selected Countries
3.2. CT Density and Incidence Crude Rates, MIR, and MIR Disparity in Lung Cancer
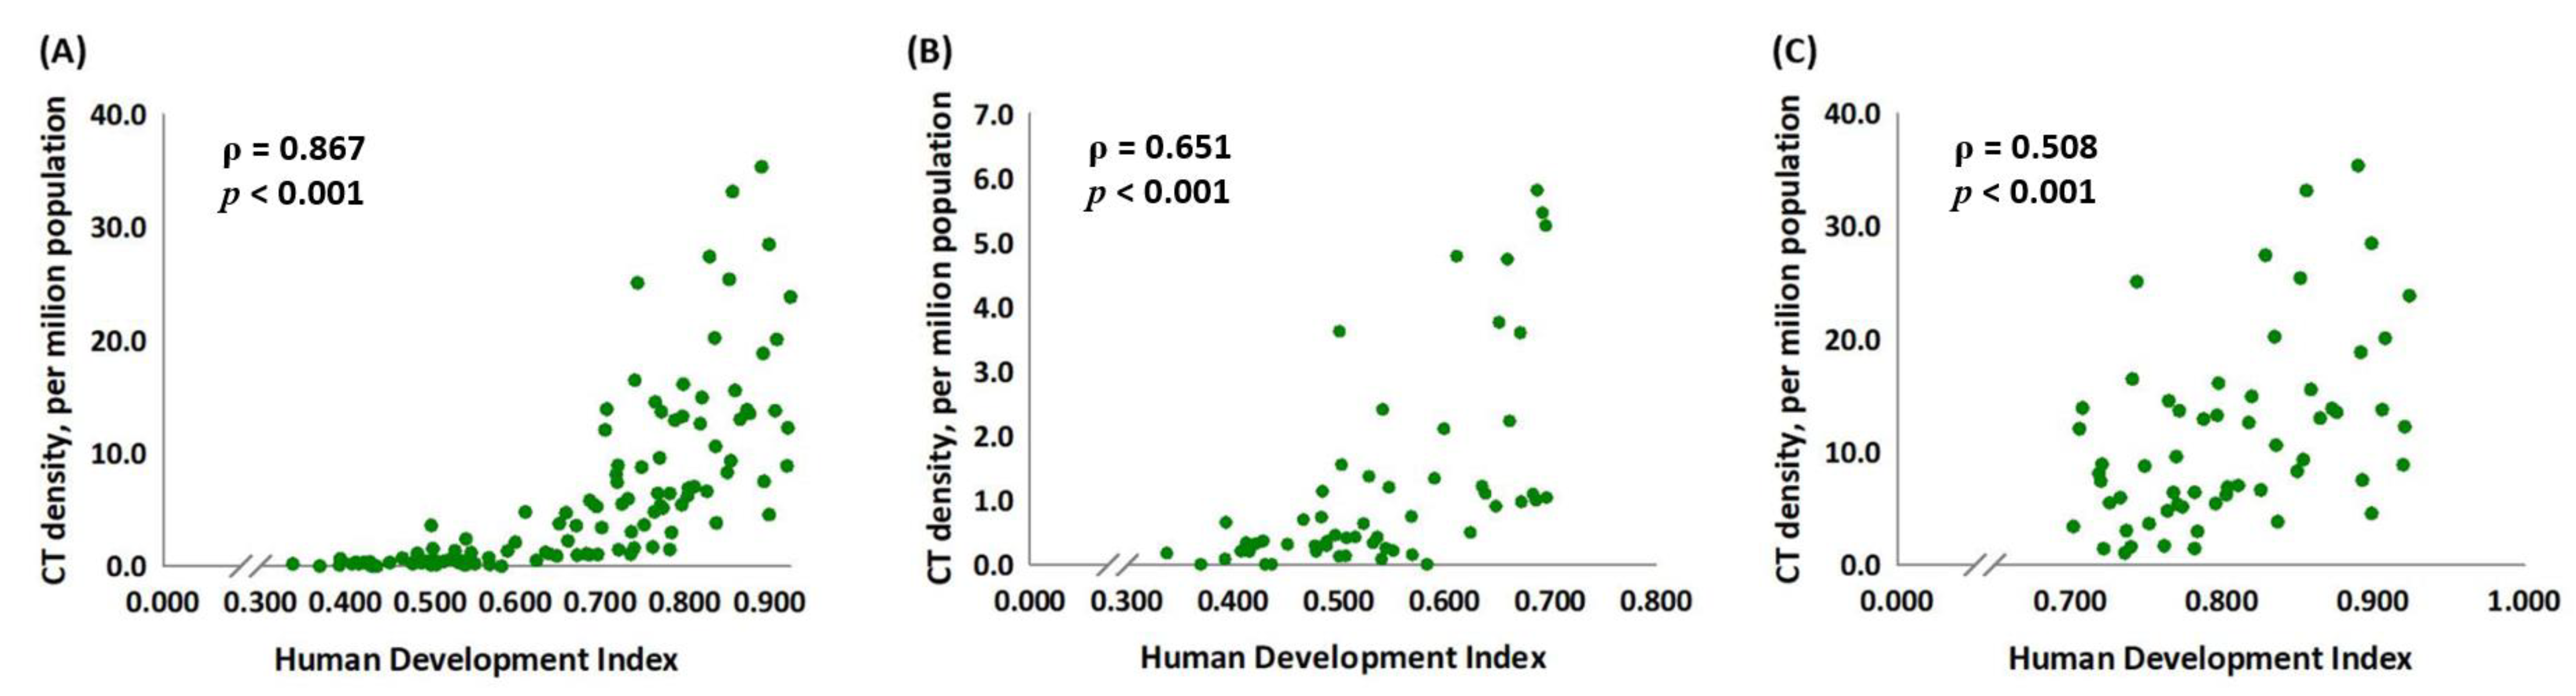
3.3. CT Density Is Significantly Associated with the HDI Score
3.4. The Association between CT Density and MIR in 2012 and 2018 and δMIR
4. Discussion
5. Conclusions
Author Contributions
Funding
Institutional Review Board Statement
Informed Consent Statement
Data Availability Statement
Conflicts of Interest
References
- Bray, F.; Ferlay, J.; Soerjomataram, I.; Siegel, R.L.; Torre, L.A.; Jemal, A. Global cancer statistics 2018: GLOBOCAN estimates of incidence and mortality worldwide for 36 cancers in 185 countries. CA Cancer J. Clin. 2018, 68, 394–424. [Google Scholar] [CrossRef] [PubMed]
- Hoffman, R.M.; Sanchez, R. Lung Cancer Screening. Med. Clin. N. Am. 2017, 101, 769–785. [Google Scholar] [CrossRef] [PubMed]
- Goldstraw, P. The 7th Edition of TNM for Lung and Pleural Tumours. J. Clin. Anal. Med. 2012, 3, 123–127. [Google Scholar]
- Del Ciello, A.; Franchi, P.; Contegiacomo, A.; Cicchetti, G.; Bonomo, L.; Larici, A.R. Missed lung cancer: When, where, and why? Diagn. Interv. Radiol. 2017, 23, 118–126. [Google Scholar] [CrossRef]
- Becker, N.; Motsch, E.; Trotter, A.; Heussel, C.P.; Dienemann, H.; Schnabel, P.A.; Kauczor, H.U.; Maldonado, S.G.; Miller, A.B.; Kaaks, R.; et al. Lung cancer mortality reduction by LDCT screening-Results from the randomized German LUSI trial. Int. J. Cancer 2020, 146, 1503–1513. [Google Scholar] [CrossRef]
- Rampinelli, C.; De Marco, P.; Origgi, D.; Maisonneuve, P.; Casiraghi, M.; Veronesi, G.; Spaggiari, L.; Bellomi, M. Exposure to low dose computed tomography for lung cancer screening and risk of cancer: Secondary analysis of trial data and risk-benefit analysis. BMJ 2017, 356, j347. [Google Scholar] [CrossRef]
- Ono, K.; Hiraoka, T.; Ono, A.; Komatsu, E.; Shigenaga, T.; Takaki, H.; Maeda, T.; Ogusu, H.; Yoshida, S.; Fukushima, K.; et al. Low-dose CT scan screening for lung cancer: Comparison of images and radiation doses between low-dose CT and follow-up standard diagnostic CT. SpringerPlus 2013, 2, 393. [Google Scholar] [CrossRef]
- Heuvelmans, M.A.; Vonder, M.; Rook, M.; Groen, H.J.M.; De Bock, G.H.; Xie, X.; Ijzerman, M.J.; Vliegenthart, R.; Oudkerk, M. Screening for Early Lung Cancer, Chronic Obstructive Pulmonary Disease, and Cardiovascular Disease (the Big-3) Using Low-dose Chest Computed Tomography: Current Evidence and Technical Considerations. J. Thorac. Imaging 2019, 34, 160–169. [Google Scholar] [CrossRef]
- Field, J.K.; Vulkan, D.; Davies, M.P.A.; Baldwin, D.R.; Brain, K.E.; Devaraj, A.; Eisen, T.; Gosney, J.; Green, B.A.; Holemans, J.A.; et al. Lung cancer mortality reduction by LDCT screening: UKLS randomised trial results and international meta-analysis. Lancet Reg. Health Eur. 2021, 10, 100179. [Google Scholar] [CrossRef]
- Sunkara, V.; Hebert, J.R. The colorectal cancer mortality-to-incidence ratio as an indicator of global cancer screening and care. Cancer 2015, 121, 1563–1569. [Google Scholar] [CrossRef]
- Chen, S.L.; Wang, S.C.; Ho, C.J.; Kao, Y.L.; Hsieh, T.Y.; Chen, W.J.; Chen, C.J.; Wu, P.R.; Ko, J.L.; Lee, H.; et al. Prostate Cancer Mortality-To-Incidence Ratios Are Associated with Cancer Care Disparities in 35 Countries. Sci. Rep. 2017, 7, 40003. [Google Scholar] [CrossRef]
- Sung, W.W.; Wang, S.C.; Hsieh, T.Y.; Ho, C.J.; Huang, C.Y.; Kao, Y.L.; Chen, W.J.; Chen, S.L. Favorable mortality-to-incidence ratios of kidney Cancer are associated with advanced health care systems. BMC Cancer 2018, 18, 792. [Google Scholar] [CrossRef]
- Wang, S.C.; Sung, W.W.; Kao, Y.L.; Hsieh, T.Y.; Chen, W.J.; Chen, S.L.; Chang, H.R. The gender difference and mortality-to-incidence ratio relate to health care disparities in bladder cancer: National estimates from 33 countries. Sci. Rep. 2017, 7, 4360. [Google Scholar] [CrossRef]
- Wang, S.C.; Chan, L.; Hsieh, T.Y.; Wang, C.H.; Chen, S.L.; Sung, W.W. Limited improvement in prostate cancer mortality-to-incidence ratios in countries with high health care expenditures. Aging 2020, 12, 21308–21315. [Google Scholar] [CrossRef]
- Boogaard, H.; Patton, A.P.; Atkinson, R.W.; Brook, J.R.; Chang, H.H.; Crouse, D.L.; Fussell, J.C.; Hoek, G.; Hoffmann, B.; Kappeler, R.; et al. Long-term exposure to traffic-related air pollution and selected health outcomes: A systematic review and meta-analysis. Environ. Int. 2022, 164, 107262. [Google Scholar] [CrossRef]
- Uguen, M.; Dewitte, J.D.; Marcorelles, P.; Loddé, B.; Pougnet, R.; Saliou, P.; De Braekeleer, M.; Uguen, A. Asbestos-related lung cancers: A retrospective clinical and pathological study. Mol. Clin. Oncol. 2017, 7, 135–139. [Google Scholar] [CrossRef]
- Barone-Adesi, F.; Chapman, R.S.; Silverman, D.T.; He, X.; Hu, W.; Vermeulen, R.; Ning, B.; Fraumeni, J.F., Jr.; Rothman, N.; Lan, Q. Risk of lung cancer associated with domestic use of coal in Xuanwei, China: Retrospective cohort study. BMJ 2012, 345, e5414. [Google Scholar] [CrossRef]
- Alberg, A.J.; Samet, J.M. Epidemiology of lung cancer. Chest 2003, 123 (Suppl. 1), 21s–49s. [Google Scholar] [CrossRef]
- Centers for Disease Control and Prevention; National Center for Chronic Disease Prevention and Health Promotion; Office on Smoking and Health; Health, Publications and Reports of the Surgeon General. How Tobacco Smoke Causes Disease: The Biology and Behavioral Basis for Smoking-Attributable Disease: A Report of the Surgeon General; Centers for Disease Control and Prevention: Atlanta, GA, USA, 2010. [Google Scholar]
- Valavanidis, A.; Vlachogianni, T.; Fiotakis, K. Tobacco smoke: Involvement of reactive oxygen species and stable free radicals in mechanisms of oxidative damage, carcinogenesis and synergistic effects with other respirable particles. Int. J. Environ. Res. Public Health 2009, 6, 445–462. [Google Scholar] [CrossRef]
- Hecht, S.S. Tobacco smoke carcinogens and lung cancer. J. Natl. Cancer Inst. 1999, 91, 1194–1210. [Google Scholar] [CrossRef]
- Pfeifer, G.P.; Denissenko, M.F.; Olivier, M.; Tretyakova, N.; Hecht, S.S.; Hainaut, P. Tobacco smoke carcinogens, DNA damage and p53 mutations in smoking-associated cancers. Oncogene 2002, 21, 7435–7451. [Google Scholar] [CrossRef] [PubMed]
- Manser, R.; Lethaby, A.; Irving, L.B.; Stone, C.; Byrnes, G.; Abramson, M.J.; Campbell, D. Screening for lung cancer. Cochrane Database Syst. Rev. 2013, 2013, Cd001991. [Google Scholar] [CrossRef] [PubMed]
- Taubmann, O.; Berger, M.; Bögel, M.; Xia, Y.; Balda, M.; Maier, A. Computed Tomography. In Medical Imaging Systems: An Introductory Guide; Maier, A., Steidl, S., Christlein, V., Hornegger, J., Eds.; Springer: Cham, Switzerland, 2018; pp. 147–189. [Google Scholar]
- Farwell, M.D.; Pryma, D.A.; Mankoff, D.A. PET/CT imaging in cancer: Current applications and future directions. Cancer 2014, 120, 3433–3445. [Google Scholar] [CrossRef] [PubMed]
- National Lung Screening Trial Research Team; Aberle, D.R.; Adams, A.M.; Berg, C.D.; Black, W.C.; Clapp, J.D.; Fagerstrom, R.M.; Gareen, I.F.; Gatsonis, C.; Marcus, P.M.; et al. Reduced Lung-Cancer Mortality with Low-Dose Computed Tomographic Screening. N. Engl. J. Med. 2011, 365, 395–409. [Google Scholar]
- Pinsky, P.F. Lung cancer screening with low-dose CT: A world-wide view. Transl. Lung Cancer Res. 2018, 7, 234–242. [Google Scholar] [CrossRef]
- Odahowski, C.L.; Zahnd, W.E.; Eberth, J.M. Challenges and Opportunities for Lung Cancer Screening in Rural America. J. Am. Coll. Radiol. 2019, 16 Pt B, 590–595. [Google Scholar] [CrossRef]
- Yousaf-Khan, U.; van der Aalst, C.; de Jong, P.A.; Heuvelmans, M.; Scholten, E.; Lammers, J.W.; van Ooijen, P.; Nackaerts, K.; Weenink, C.; Groen, H.; et al. Final screening round of the NELSON lung cancer screening trial: The effect of a 2.5-year screening interval. Thorax 2017, 72, 48–56. [Google Scholar] [CrossRef]
- Heuvelmans, M.A.; Walter, J.E.; Peters, R.B.; Bock, G.H.; Yousaf-Khan, U.; Aalst, C.M.V.; Groen, H.J.M.; Nackaerts, K.; Ooijen, P.M.V.; Koning, H.J.; et al. Relationship between nodule count and lung cancer probability in baseline CT lung cancer screening: The NELSON study. Lung Cancer 2017, 113, 45–50. [Google Scholar] [CrossRef]
- Biederer, J.; Ohno, Y.; Hatabu, H.; Schiebler, M.L.; van Beek, E.J.R.; Vogel-Claussen, J.; Kauczor, H.U. Screening for lung cancer: Does MRI have a role? Eur. J. Radiol. 2017, 86, 353–360. [Google Scholar] [CrossRef]
- Moyer, V.A. Screening for lung cancer: U.S. Preventive Services Task Force recommendation statement. Ann. Intern. Med. 2014, 160, 330–338. [Google Scholar] [CrossRef]
- Sharma, R.; Aashima; Nanda, M.; Fronterre, C.; Sewagudde, P.; Ssentongo, A.E.; Yenney, K.; Arhin, N.D.; Oh, J.; Amponsah-Manu, F.; et al. Mapping Cancer in Africa: A Comprehensive and Comparable Characterization of 34 Cancer Types Using Estimates From GLOBOCAN 2020. Front. Public Health 2022, 10, 839835. [Google Scholar] [CrossRef]
- Lopci, E.; Castello, A.; Morenghi, E.; Tanzi, D.; Cavuto, S.; Lutman, F.; Chiesa, G.; Vanni, E.; Alloisio, M.; Infante, M. Cost-effectiveness of second-line diagnostic investigations in patients included in the DANTE trial: A randomized controlled trial of lung cancer screening with low-dose computed tomography. Nucl. Med. Commun. 2019, 40, 508–516. [Google Scholar] [CrossRef]
- Tas, F.; Ciftci, R.; Kilic, L.; Karabulut, S. Age is a prognostic factor affecting survival in lung cancer patients. Oncol. Lett. 2013, 6, 1507–1513. [Google Scholar] [CrossRef]
- Nesbitt, J.C.; Putnam, J.B., Jr.; Walsh, G.L.; Roth, J.A.; Mountain, C.F. Survival in early-stage non-small cell lung cancer. Ann. Thorac. Surg. 1995, 60, 466–472. [Google Scholar] [CrossRef]


| Human Development Index | Incidence | Mortality | Mortality-to-Incidence Ratio | |||||||||
|---|---|---|---|---|---|---|---|---|---|---|---|---|
| Country | Score | Rank | CT Density | Number | ASR | CR | Number | ASR | CR | 2012 | 2018 | δMIR |
| Afghanistan | 0.479 | 153 | 0.20 | 1019 | 2.8 | 6.1 | 1022 | 2.8 | 6.1 | 0.87 | 1.00 | −0.13 |
| Albania | 0.771 | 61 | 5.36 | 1087 | 37.4 | 21.1 | 961 | 33.1 | 18.1 | 0.95 | 0.89 | 0.06 |
| Angola | 0.537 | 135 | 0.42 | 401 | 1.3 | 3.2 | 396 | 1.3 | 3.2 | 0.88 | 1.00 | −0.12 |
| Armenia | 0.737 | 75 | 3.02 | 1266 | 43.7 | 27.8 | 1186 | 40.9 | 26.1 | 0.90 | 0.94 | −0.04 |
| Austria | 0.899 | 15 | 28.49 | 4845 | 56.9 | 27.3 | 4012 | 47.1 | 21.1 | 0.80 | 0.83 | −0.03 |
| Azerbaijan | 0.736 | 78 | 1.06 | 1346 | 13.6 | 12.5 | 1265 | 12.8 | 11.7 | 0.88 | 0.94 | −0.06 |
| Bahamas | 0.797 | 51 | 13.25 | 33 | 8.3 | 6.1 | 32 | 8.1 | 6.0 | 0.93 | 0.98 | −0.05 |
| Barbados | 0.811 | 44 | 7.03 | 46 | 16.3 | 8.7 | 41 | 14.5 | 7.6 | 1.00 | 0.89 | 0.11 |
| Belarus | 0.803 | 46 | 6.20 | 4118 | 44.3 | 25.0 | 2839 | 30.5 | 17.0 | 0.85 | 0.69 | 0.16 |
| Belize | 0.706 | 90 | 12.05 | 25 | 6.6 | 9.8 | 25 | 6.6 | 9.8 | 0.96 | 1.00 | −0.04 |
| Benin | 0.489 | 149 | 0.29 | 65 | 0.6 | 1.0 | 64 | 0.6 | 1.0 | 1.00 | 0.98 | 0.02 |
| Bhutan | 0.591 | 120 | 1.33 | 48 | 5.9 | 7.9 | 44 | 5.4 | 7.3 | 0.94 | 0.92 | 0.02 |
| Bosnia andHerzegovina | 0.741 | 73 | 16.45 | 2379 | 69.1 | 35.9 | 2034 | 59.0 | 29.5 | 1.01 | 0.85 | 0.16 |
| Botswana | 0.687 | 96 | 0.99 | 45 | 1.9 | 2.9 | 44 | 1.9 | 2.9 | 0.91 | 1.00 | −0.09 |
| Burkina Faso | 0.394 | 170 | 0.65 | 243 | 1.2 | 2.7 | 231 | 1.2 | 2.6 | 0.89 | 1.00 | −0.11 |
| Burundi | 0.416 | 166 | 0.20 | 86 | 0.8 | 1.6 | 81 | 0.7 | 1.6 | 0.89 | 0.94 | −0.05 |
| Cambodia | 0.548 | 129 | 1.19 | 1544 | 9.5 | 13.0 | 1497 | 9.2 | 12.6 | 0.88 | 0.97 | −0.09 |
| Cameroon | 0.524 | 138 | 0.63 | 294 | 1.2 | 2.3 | 293 | 1.2 | 2.3 | 0.89 | 1.00 | −0.11 |
| Canada | 0.906 | 12 | 13.76 | 22,340 | 61.9 | 28.4 | 17,566 | 48.7 | 21.7 | 0.79 | 0.79 | 0.00 |
| Central African Republic | 0.370 | 172 | 0.00 | 56 | 1.2 | 2.2 | 54 | 1.1 | 2.1 | 0.89 | 0.92 | −0.03 |
| Chad | 0.393 | 171 | 0.08 | 102 | 0.7 | 1.5 | 95 | 0.6 | 1.5 | 0.83 | 0.93 | −0.10 |
| Chile | 0.818 | 43 | 12.60 | 3432 | 19.1 | 12.5 | 3163 | 17.6 | 11.5 | 0.96 | 0.92 | 0.04 |
| Comoros | 0.529 | 137 | 1.36 | 1 | 0.1 | 0.2 | 1 | 0.1 | 0.2 | 1.00 | 1.00 | 0.00 |
| Costa Rica | 0.774 | 59 | 5.13 | 405 | 8.3 | 6.1 | 335 | 6.8 | 4.9 | 0.70 | 0.82 | −0.12 |
| Côte d’Ivoire | 0.467 | 155 | 0.69 | 276 | 1.1 | 2.2 | 267 | 1.1 | 2.2 | 0.90 | 1.00 | −0.10 |
| Croatia | 0.820 | 42 | 14.92 | 2817 | 69.3 | 31.7 | 2684 | 66.0 | 29.7 | 0.91 | 0.95 | −0.04 |
| Cuba | 0.764 | 66 | 4.79 | 6318 | 56.1 | 29.9 | 5267 | 46.8 | 24.5 | 0.94 | 0.83 | 0.11 |
| Cyprus | 0.852 | 30 | 25.41 | 454 | 38.7 | 23.0 | 456 | 38.9 | 22.7 | 0.93 | 1.01 | −0.08 |
| Czechia | 0.865 | 26 | 12.99 | 6204 | 59.6 | 26.5 | 4821 | 46.3 | 20.2 | 0.78 | 0.78 | 0.00 |
| Denmark | 0.924 | 5 | 23.85 | 4546 | 80.8 | 35.2 | 3487 | 62.0 | 25.5 | 0.83 | 0.77 | 0.06 |
| Dominican Republic | 0.708 | 89 | 13.89 | 1236 | 11.5 | 11.7 | 1106 | 10.2 | 10.3 | 0.90 | 0.89 | 0.01 |
| Ecuador | 0.740 | 74 | 1.59 | 965 | 5.8 | 5.5 | 888 | 5.3 | 5.0 | 1.01 | 0.91 | 0.10 |
| El Salvador | 0.660 | 107 | 4.73 | 362 | 5.7 | 4.9 | 343 | 5.4 | 4.6 | 0.89 | 0.95 | −0.06 |
| Eritrea | 0.422 | 165 | 0.32 | 79 | 1.5 | 2.8 | 77 | 1.5 | 2.8 | 0.91 | 1.00 | −0.09 |
| Estonia | 0.859 | 27 | 15.54 | 790 | 62.1 | 28.8 | 653 | 51.3 | 22.7 | 1.05 | 0.83 | 0.22 |
| Eswatini/Swaziland | 0.542 | 133 | 2.40 | 18 | 1.3 | 2.5 | 18 | 1.3 | 2.6 | 1.00 | 1.00 | 0.00 |
| Ethiopia | 0.429 | 163 | 0.36 | 2033 | 1.9 | 3.5 | 2032 | 1.9 | 3.5 | 0.89 | 1.00 | −0.11 |
| Fiji | 0.702 | 91 | 3.40 | 54 | 5.9 | 5.9 | 51 | 5.6 | 5.6 | 0.88 | 0.95 | −0.07 |
| Finland | 0.908 | 9 | 20.09 | 2480 | 46.0 | 18.4 | 2035 | 37.7 | 14.7 | 0.86 | 0.82 | 0.04 |
| Gabon | 0.672 | 103 | 3.59 | 95 | 4.6 | 6.7 | 92 | 4.5 | 6.6 | 0.93 | 0.98 | −0.05 |
| Georgia | 0.749 | 69 | 8.75 | 1148 | 29.8 | 16.7 | 1070 | 27.8 | 15.9 | 0.90 | 0.93 | −0.03 |
| Ghana | 0.570 | 124 | 0.15 | 234 | 0.8 | 1.4 | 217 | 0.7 | 1.3 | 0.86 | 0.93 | −0.06 |
| Greece | 0.856 | 28 | 33.16 | 9229 | 85.6 | 39.6 | 7498 | 69.5 | 30.8 | 0.93 | 0.81 | 0.12 |
| Guinea-Bissau | 0.437 | 161 | 0.00 | 18 | 0.9 | 1.8 | 18 | 0.9 | 1.8 | 1.00 | 1.00 | 0.00 |
| Guinea | 0.431 | 162 | 0.00 | 184 | 1.4 | 2.4 | 165 | 1.3 | 2.2 | 0.88 | 0.93 | −0.05 |
| Guyana | 0.652 | 108 | 3.75 | 21 | 2.7 | 3.0 | 21 | 2.7 | 3.0 | 0.94 | 1.00 | −0.06 |
| Haiti | 0.478 | 154 | 0.29 | 491 | 4.4 | 5.9 | 441 | 4.0 | 5.4 | 0.91 | 0.91 | 0.00 |
| Honduras | 0.600 | 118 | 2.10 | 363 | 3.9 | 5.5 | 321 | 3.4 | 4.8 | 0.93 | 0.87 | 0.06 |
| Hungary | 0.826 | 39 | 6.63 | 10,550 | 111.1 | 55.8 | 8457 | 89.0 | 43.5 | 0.87 | 0.80 | 0.07 |
| Iceland | 0.908 | 10 | 39.45 | 174 | 52.5 | 29.6 | 125 | 37.7 | 19.4 | 0.87 | 0.72 | 0.15 |
| Iraq | 0.662 | 106 | 2.22 | 2075 | 5.3 | 10.4 | 2019 | 5.1 | 10.1 | 0.90 | 0.96 | −0.06 |
| Ireland | 0.899 | 16 | 4.54 | 2694 | 56.9 | 31.8 | 1778 | 37.6 | 20.2 | 0.78 | 0.66 | 0.12 |
| Israel | 0.893 | 19 | 7.50 | 2304 | 27.7 | 20.1 | 1997 | 24.0 | 17.1 | 0.86 | 0.87 | −0.01 |
| Jamaica | 0.722 | 84 | 1.44 | 481 | 16.8 | 13.2 | 439 | 15.3 | 11.9 | 0.90 | 0.91 | −0.01 |
| Jordan | 0.726 | 83 | 5.50 | 1093 | 11.1 | 17.3 | 972 | 9.8 | 15.6 | 0.90 | 0.88 | 0.02 |
| Kazakhstan | 0.782 | 57 | 1.46 | 4239 | 23.1 | 21.3 | 3798 | 20.7 | 19.1 | 0.90 | 0.90 | 0.00 |
| Kenya | 0.545 | 132 | 0.25 | 665 | 1.3 | 2.9 | 651 | 1.3 | 2.9 | 0.92 | 1.00 | −0.08 |
| Kyrgyzstan | 0.649 | 109 | 0.90 | 657 | 10.7 | 13.9 | 606 | 9.9 | 12.7 | 0.89 | 0.93 | −0.04 |
| Laos | 0.569 | 125 | 0.74 | 861 | 12.4 | 18.3 | 829 | 11.9 | 17.8 | 0.87 | 0.96 | −0.09 |
| Lebanon | 0.744 | 70 | 25.09 | 1546 | 25.5 | 22.2 | 1396 | 23.1 | 19.9 | 0.89 | 0.91 | −0.02 |
| Lithuania | 0.835 | 36 | 20.22 | 1530 | 54.6 | 26.0 | 1269 | 45.3 | 21.1 | 0.83 | 0.83 | 0.00 |
| Luxembourg | 0.892 | 20 | 18.85 | 278 | 48.1 | 27.0 | 203 | 35.1 | 19.1 | 0.84 | 0.73 | 0.11 |
| Madagascar | 0.507 | 141 | 0.13 | 148 | 0.6 | 1.0 | 133 | 0.5 | 0.9 | 0.89 | 0.91 | −0.02 |
| Malawi | 0.452 | 158 | 0.31 | 127 | 0.7 | 1.5 | 121 | 0.6 | 1.4 | 0.80 | 0.95 | −0.15 |
| Malaysia | 0.782 | 56 | 6.43 | 4547 | 14.2 | 14.7 | 3903 | 12.2 | 12.6 | 0.94 | 0.86 | 0.08 |
| Maldives | 0.688 | 95 | 5.80 | 38 | 8.6 | 11.9 | 32 | 7.2 | 10.3 | 1.00 | 0.84 | 0.16 |
| Mali | 0.408 | 168 | 0.20 | 246 | 1.3 | 3.0 | 239 | 1.3 | 3.0 | 0.91 | 1.00 | −0.09 |
| Malta | 0.854 | 29 | 9.32 | 184 | 43.3 | 18.3 | 170 | 40.0 | 16.4 | 0.77 | 0.92 | −0.15 |
| Mauritania | 0.503 | 143 | 1.54 | 60 | 1.3 | 2.4 | 60 | 1.3 | 2.4 | 1.00 | 1.00 | 0.00 |
| Mauritius | 0.768 | 63 | 6.43 | 196 | 15.6 | 9.9 | 172 | 13.7 | 8.6 | 1.37 | 0.88 | 0.49 |
| Mexico | 0.752 | 68 | 3.65 | 6952 | 5.4 | 5.4 | 5921 | 4.6 | 4.6 | 0.90 | 0.85 | 0.05 |
| Moldova | 0.693 | 94 | 5.45 | 1678 | 41.9 | 27.3 | 1302 | 32.5 | 21.0 | 0.83 | 0.78 | 0.05 |
| Mongolia | 0.719 | 87 | 8.10 | 429 | 13.8 | 18.6 | 368 | 11.8 | 16.1 | 0.93 | 0.86 | 0.07 |
| Montenegro | 0.798 | 49 | 16.09 | 407 | 65.6 | 39.2 | 333 | 53.6 | 30.6 | 0.95 | 0.82 | 0.13 |
| Morocco | 0.636 | 111 | 1.21 | 6391 | 17.7 | 17.0 | 6303 | 17.5 | 16.8 | 0.90 | 0.99 | −0.09 |
| Myanmar | 0.541 | 134 | 0.08 | 7524 | 14.0 | 14.8 | 7347 | 13.7 | 14.5 | 0.89 | 0.98 | −0.09 |
| Namibia | 0.612 | 116 | 4.78 | 62 | 2.4 | 4.2 | 61 | 2.4 | 4.1 | 0.95 | 1.00 | −0.05 |
| Netherlands | 0.921 | 6 | 12.23 | 11,713 | 70.1 | 32.4 | 9652 | 57.8 | 24.9 | 0.89 | 0.82 | 0.07 |
| Nicaragua | 0.625 | 114 | 0.49 | 289 | 4.6 | 5.5 | 269 | 4.3 | 5.1 | 0.90 | 0.93 | −0.03 |
| Niger | 0.338 | 173 | 0.17 | 40 | 0.2 | 0.4 | 40 | 0.2 | 0.4 | 1.00 | 1.00 | 0.00 |
| Oman | 0.804 | 45 | 6.88 | 109 | 2.3 | 4.5 | 106 | 2.2 | 4.4 | 0.92 | 0.96 | −0.04 |
| Pakistan | 0.533 | 136 | 0.33 | 9574 | 4.8 | 6.9 | 9069 | 4.5 | 6.6 | 0.87 | 0.94 | −0.07 |
| Panama | 0.770 | 62 | 9.58 | 378 | 9.2 | 8.2 | 333 | 8.1 | 7.2 | 0.90 | 0.88 | 0.02 |
| Papua New Guinea | 0.508 | 140 | 0.41 | 603 | 7.2 | 11.6 | 597 | 7.1 | 11.5 | 0.88 | 0.99 | −0.11 |
| Paraguay | 0.697 | 92 | 1.03 | 700 | 10.2 | 11.2 | 667 | 9.7 | 10.7 | 0.89 | 0.95 | −0.06 |
| Philippines | 0.684 | 98 | 1.09 | 16,597 | 15.6 | 19.9 | 14,803 | 13.9 | 17.9 | 0.86 | 0.89 | −0.03 |
| Poland | 0.836 | 35 | 10.60 | 26,968 | 72.3 | 35.7 | 24,910 | 66.7 | 32.3 | 0.89 | 0.92 | −0.03 |
| Portugal | 0.829 | 38 | 27.43 | 4766 | 47.8 | 21.9 | 4144 | 41.5 | 18.2 | 0.82 | 0.87 | −0.05 |
| Qatar | 0.850 | 31 | 8.30 | 71 | 2.6 | 7.8 | 66 | 2.4 | 7.5 | 0.90 | 0.92 | −0.02 |
| Romania | 0.796 | 52 | 5.44 | 10,862 | 56.6 | 29.3 | 9804 | 51.1 | 25.9 | 0.87 | 0.90 | −0.03 |
| Samoa | 0.696 | 93 | 5.25 | 56 | 28.5 | 34.2 | 27 | 13.7 | 16.3 | 1.00 | 0.48 | 0.52 |
| Saudi Arabia | 0.837 | 34 | 3.82 | 898 | 2.7 | 4.1 | 754 | 2.3 | 3.6 | 0.90 | 0.85 | 0.05 |
| Senegal | 0.489 | 148 | 0.35 | 182 | 1.1 | 2.2 | 170 | 1.0 | 2.1 | 0.89 | 0.91 | −0.02 |
| Serbia | 0.772 | 60 | 13.67 | 7851 | 91.1 | 49.8 | 6619 | 76.8 | 39.4 | 0.89 | 0.84 | 0.05 |
| Sierra Leone | 0.413 | 167 | 0.33 | 84 | 1.1 | 2.3 | 80 | 1.0 | 2.2 | 1.00 | 0.91 | 0.09 |
| Slovenia | 0.876 | 23 | 13.51 | 1390 | 68.5 | 32.1 | 1176 | 58.0 | 26.1 | 0.83 | 0.85 | −0.02 |
| South Africa | 0.673 | 102 | 0.97 | 7867 | 13.7 | 16.4 | 7398 | 12.9 | 15.5 | 0.90 | 0.94 | −0.04 |
| South Korea | 0.890 | 21 | 35.38 | 26,285 | 52.1 | 26.0 | 17,579 | 34.8 | 16.2 | 0.78 | 0.67 | 0.11 |
| Spain | 0.873 | 25 | 13.85 | 24,812 | 55.3 | 26.3 | 19,998 | 44.6 | 20.4 | 0.79 | 0.81 | −0.02 |
| Sri Lanka | 0.762 | 67 | 1.69 | 1386 | 6.7 | 5.0 | 1143 | 5.5 | 4.1 | 0.89 | 0.82 | 0.07 |
| Sudan | 0.485 | 150 | 1.13 | 541 | 1.3 | 2.2 | 508 | 1.2 | 2.1 | 0.90 | 0.92 | −0.02 |
| Suriname | 0.720 | 86 | 7.42 | 95 | 16.8 | 15.4 | 91 | 16.1 | 14.8 | 0.91 | 0.96 | −0.05 |
| Tajikistan | 0.639 | 110 | 1.10 | 322 | 3.5 | 5.4 | 304 | 3.3 | 5.1 | 0.91 | 0.94 | −0.03 |
| Tanzania | 0.501 | 145 | 0.12 | 149 | 0.3 | 0.5 | 148 | 0.3 | 0.5 | 1.00 | 1.00 | 0.00 |
| Thailand | 0.733 | 81 | 5.95 | 21,492 | 31.4 | 18.9 | 19,816 | 29.0 | 17.8 | 0.91 | 0.92 | −0.01 |
| Togo | 0.484 | 151 | 0.73 | 75 | 0.9 | 1.9 | 74 | 0.9 | 1.8 | 0.88 | 0.99 | −0.11 |
| Trinidad andTobago | 0.784 | 55 | 2.98 | 239 | 17.5 | 12.4 | 197 | 14.5 | 10.2 | 0.90 | 0.83 | 0.07 |
| Tunisia | 0.721 | 85 | 8.91 | 1851 | 16.0 | 13.6 | 1760 | 15.2 | 13.0 | 0.90 | 0.95 | −0.05 |
| Turkey | 0.765 | 65 | 14.52 | 33,235 | 40.8 | 35.6 | 32,377 | 39.8 | 34.8 | 0.89 | 0.98 | −0.09 |
| Uganda | 0.497 | 147 | 0.45 | 464 | 1.0 | 2.7 | 439 | 1.0 | 2.7 | 0.91 | 0.99 | −0.08 |
| Uruguay | 0.788 | 53 | 12.91 | 1452 | 42.9 | 27.2 | 1315 | 38.8 | 24.2 | 0.95 | 0.90 | 0.05 |
| Vanuatu | 0.584 | 122 | 0.00 | 14 | 5.0 | 8.0 | 15 | 5.3 | 8.7 | 0.92 | 1.06 | −0.14 |
| Yemen | 0.501 | 146 | 3.61 | 544 | 1.9 | 3.9 | 542 | 1.9 | 3.9 | 0.88 | 1.00 | −0.12 |
| Zambia | 0.552 | 128 | 0.21 | 233 | 1.3 | 3.4 | 228 | 1.3 | 3.4 | 1.00 | 1.00 | 0.00 |
| Zimbabwe | 0.516 | 139 | 0.42 | 310 | 1.8 | 4.0 | 298 | 1.8 | 4.0 | 0.90 | 1.00 | −0.10 |
Disclaimer/Publisher’s Note: The statements, opinions and data contained in all publications are solely those of the individual author(s) and contributor(s) and not of MDPI and/or the editor(s). MDPI and/or the editor(s) disclaim responsibility for any injury to people or property resulting from any ideas, methods, instructions or products referred to in the content. |
© 2023 by the authors. Licensee MDPI, Basel, Switzerland. This article is an open access article distributed under the terms and conditions of the Creative Commons Attribution (CC BY) license (https://creativecommons.org/licenses/by/4.0/).
Share and Cite
Wang, Y.-T.; Chen, B.-S.; Wu, H.-R.; Chang, Y.-C.; Yu, C.-Y.; Sung, W.-W. Favorable Mortality-to-Incidence Ratio Trends of Lung Cancer in Countries with High Computed Tomography Density. Medicina 2023, 59, 322. https://doi.org/10.3390/medicina59020322
Wang Y-T, Chen B-S, Wu H-R, Chang Y-C, Yu C-Y, Sung W-W. Favorable Mortality-to-Incidence Ratio Trends of Lung Cancer in Countries with High Computed Tomography Density. Medicina. 2023; 59(2):322. https://doi.org/10.3390/medicina59020322
Chicago/Turabian StyleWang, Yao-Tung, Brian-Shiian Chen, Han-Ru Wu, Ya-Chuan Chang, Chia-Ying Yu, and Wen-Wei Sung. 2023. "Favorable Mortality-to-Incidence Ratio Trends of Lung Cancer in Countries with High Computed Tomography Density" Medicina 59, no. 2: 322. https://doi.org/10.3390/medicina59020322
APA StyleWang, Y.-T., Chen, B.-S., Wu, H.-R., Chang, Y.-C., Yu, C.-Y., & Sung, W.-W. (2023). Favorable Mortality-to-Incidence Ratio Trends of Lung Cancer in Countries with High Computed Tomography Density. Medicina, 59(2), 322. https://doi.org/10.3390/medicina59020322