Effects of Field Position on Fluid Balance and Electrolyte Losses in Collegiate Women’s Soccer Players

 , ,
, ,
Abstract
1. Introduction
2. Materials and Methods
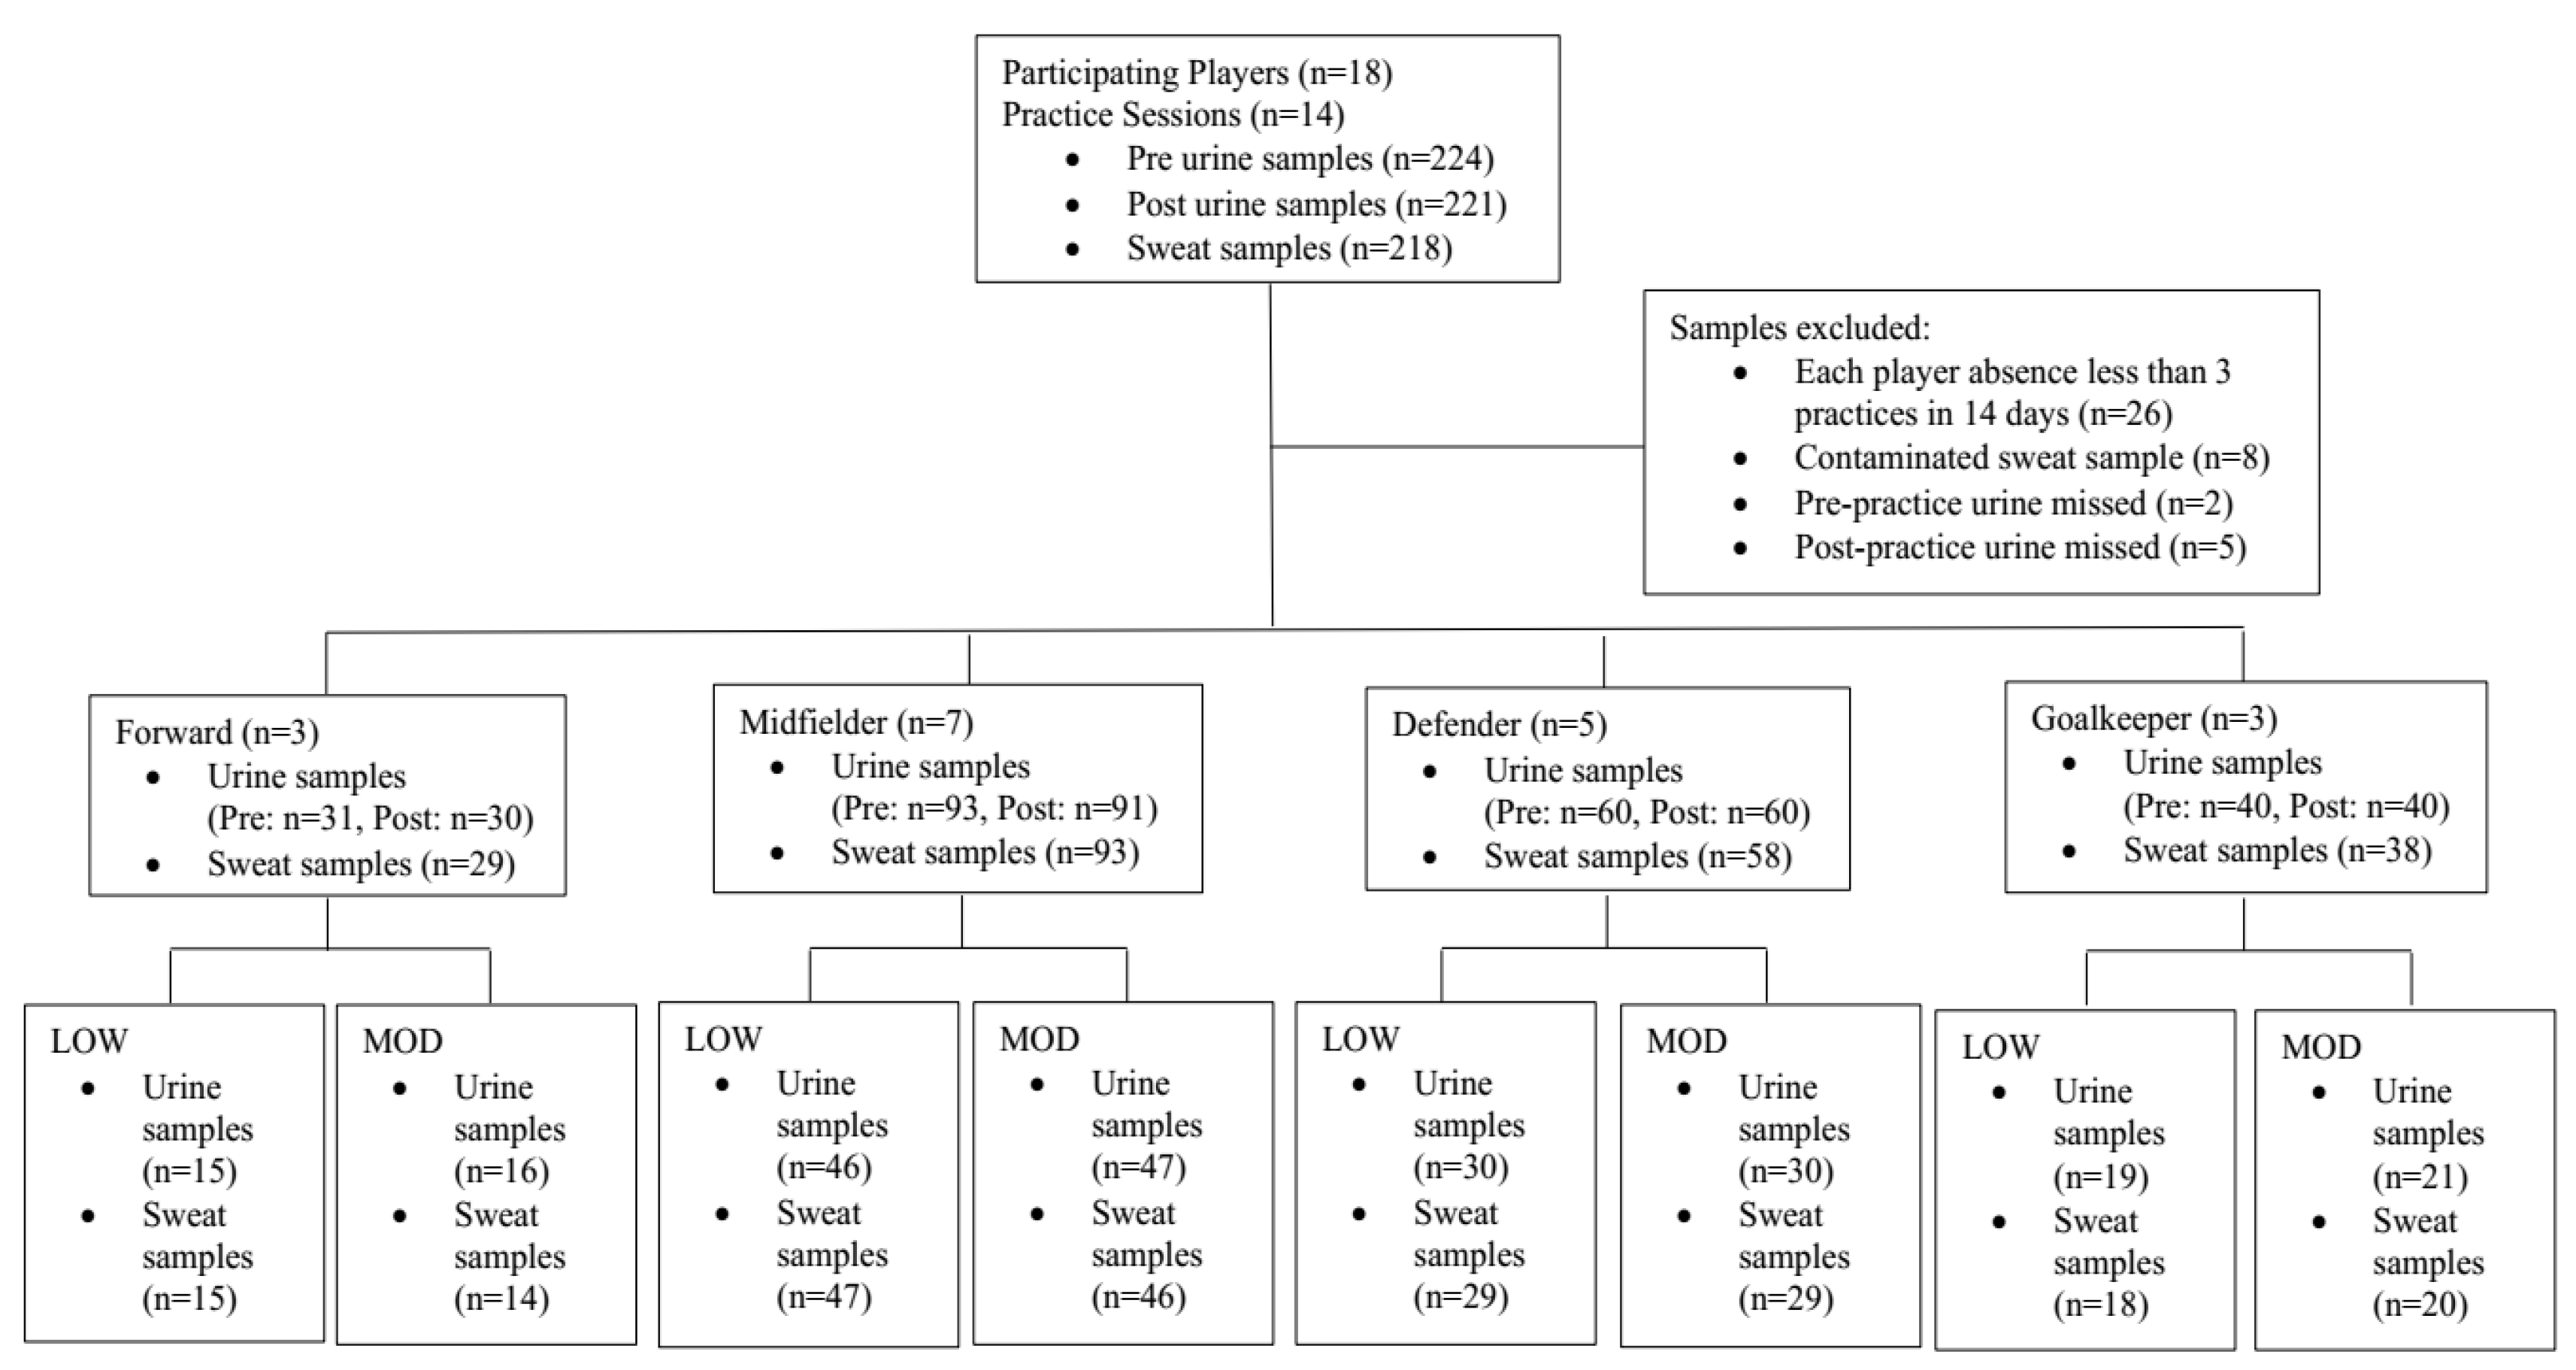
2.1. Participants
2.2. Experiment Design
2.3. Body Mass
2.4. Fluid Intake
2.5. Urine Assessments
2.6. Sweat Assessments
2.7. Heart Rate
2.8. Statistical Analysis
3. Results
3.1. Team Data
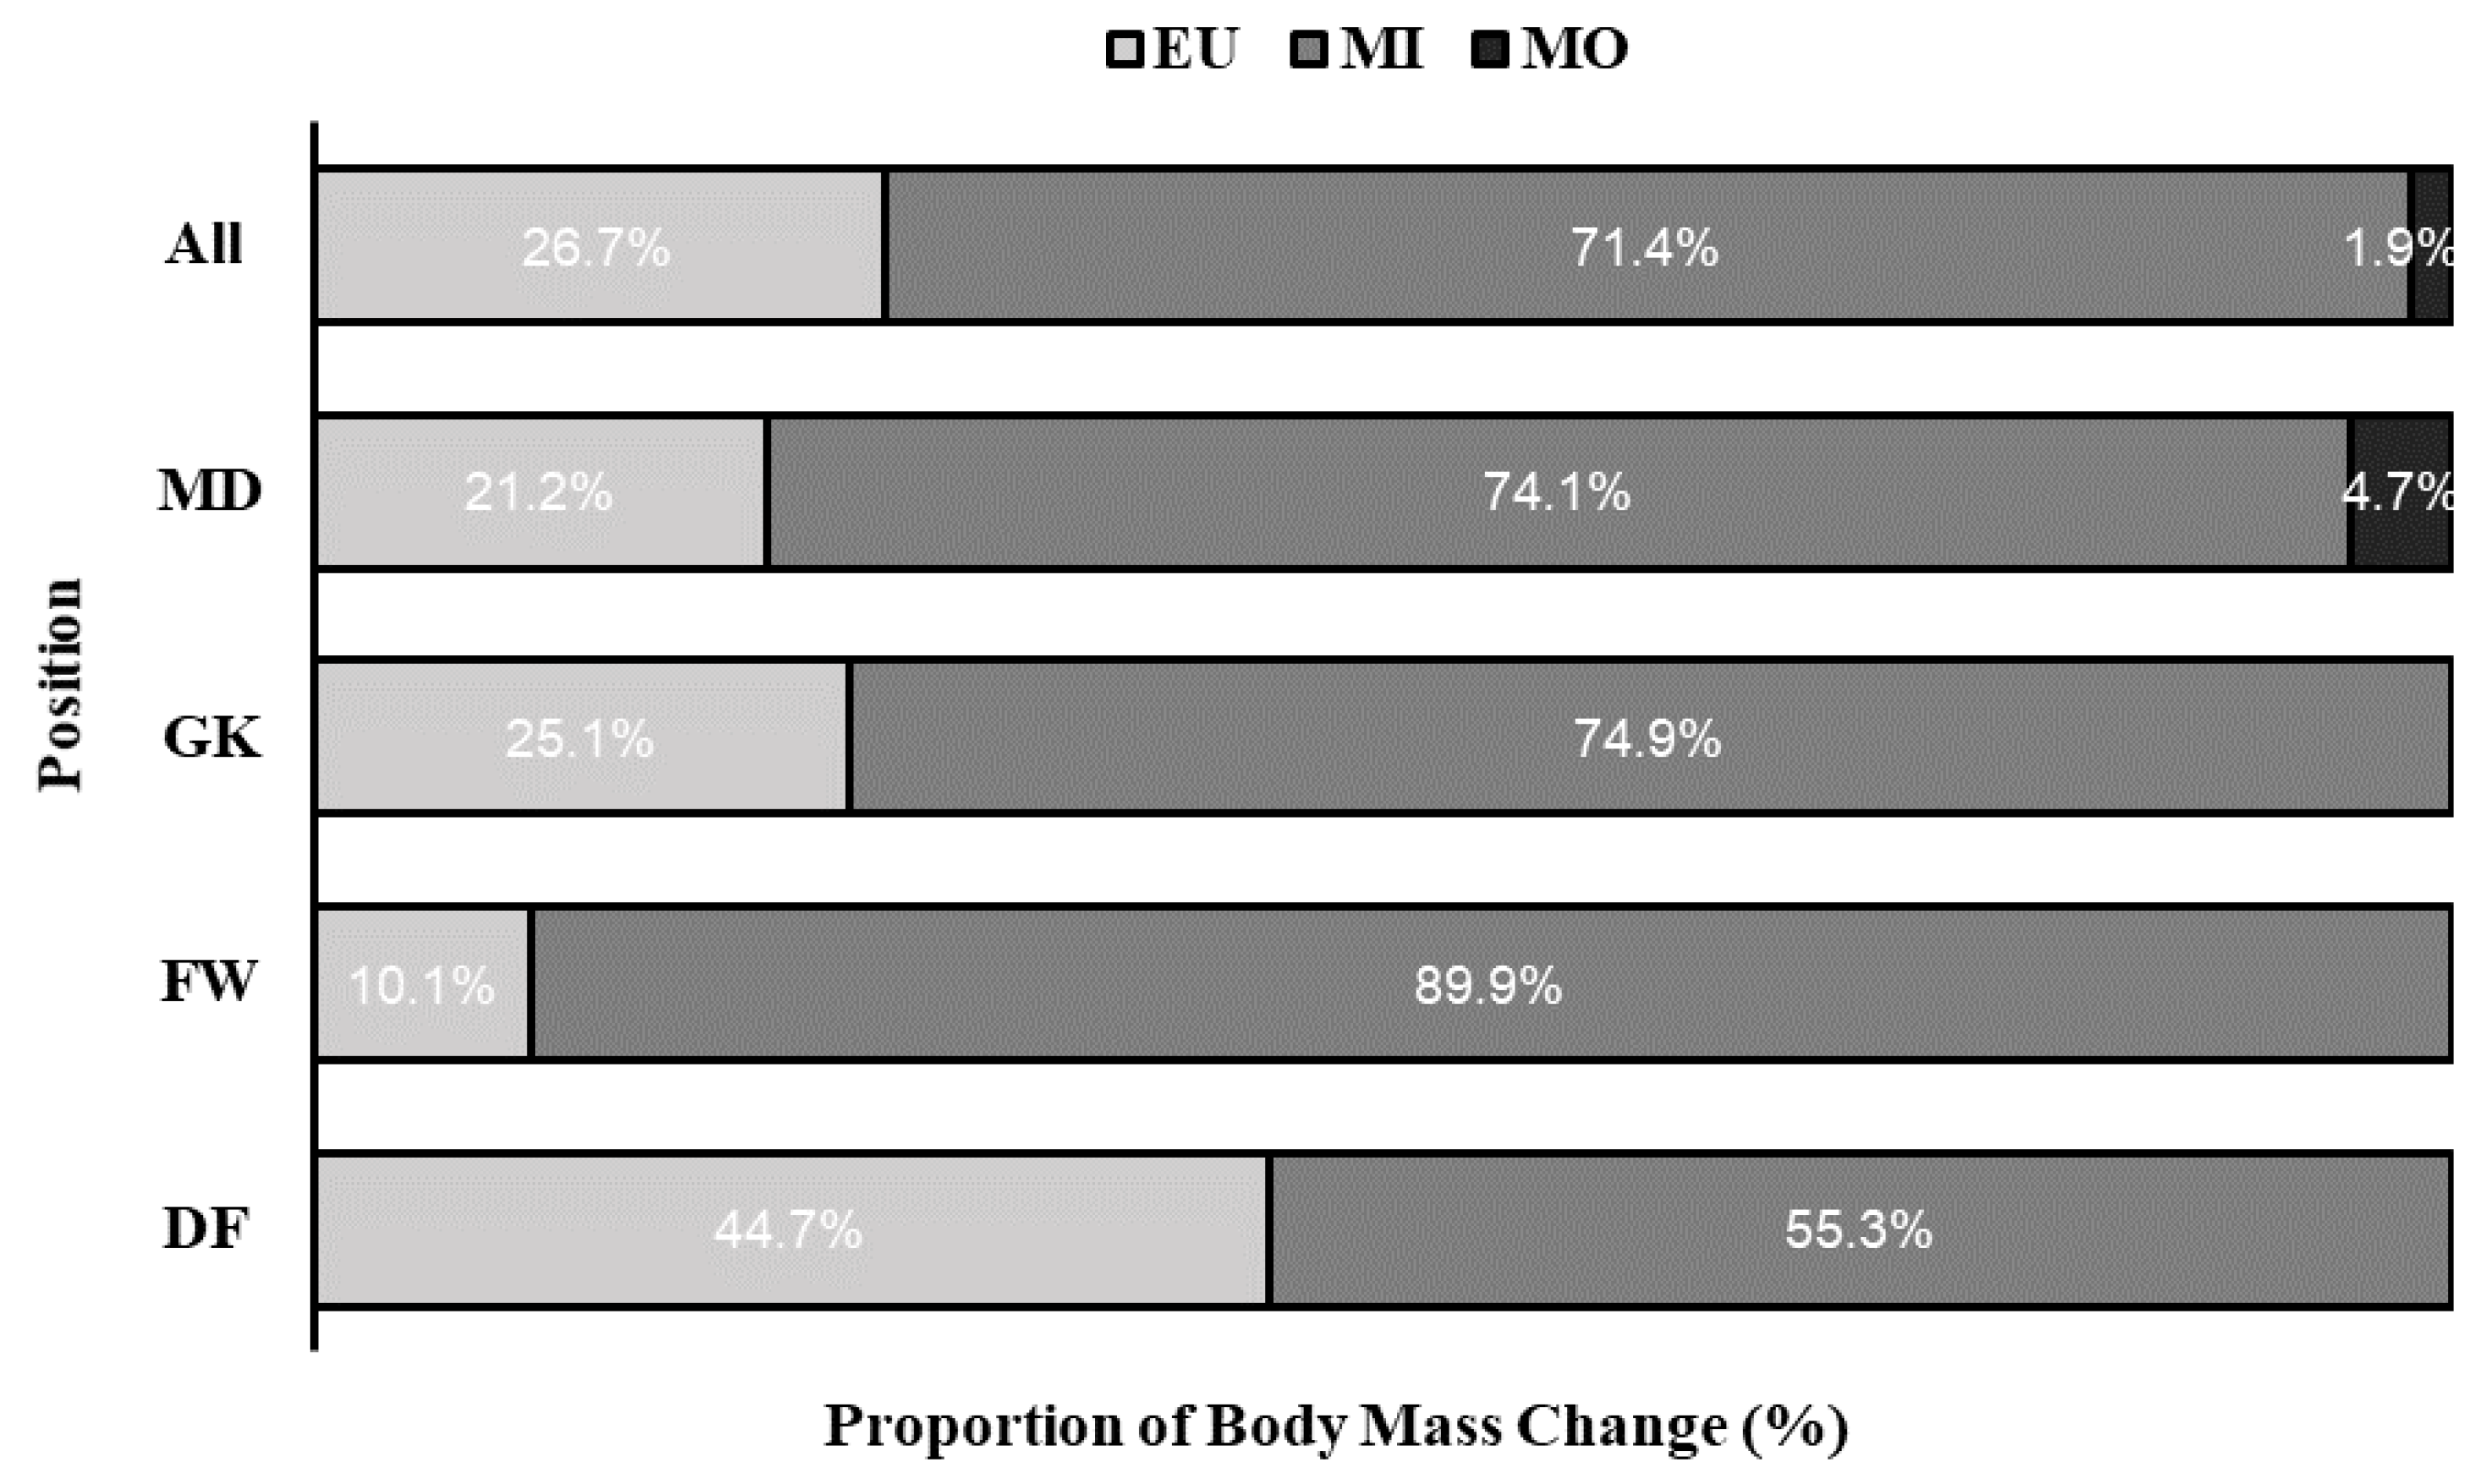
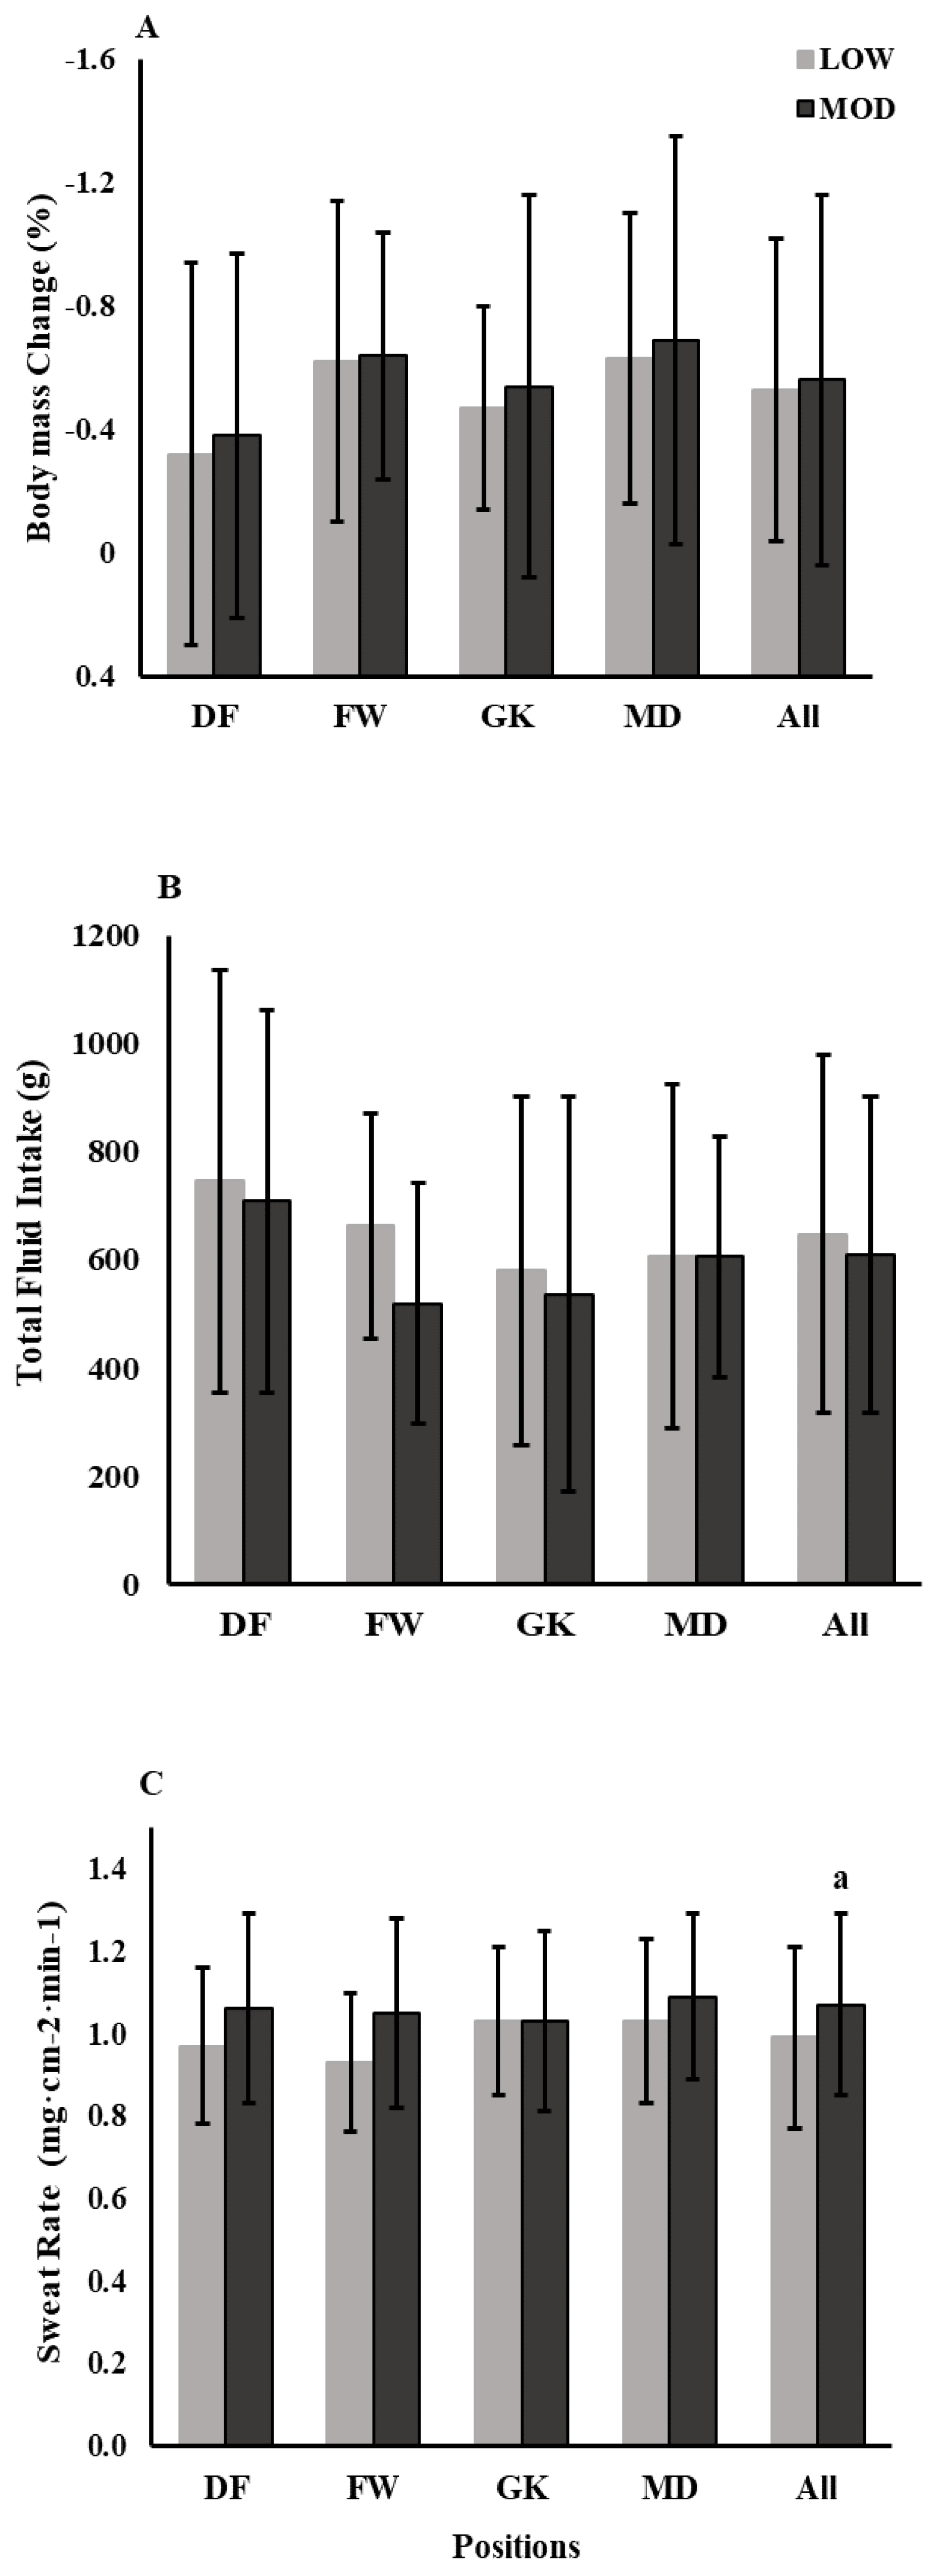
3.2. Position Data
3.3. Heart Rate Data
3.4. Environmental Data
4. Discussion
4.1. Hydration Status
4.2. Positional Differences
4.3. Warm and Cool Environments
4.4. Strengths and Limitations
5. Conclusions
Author Contributions
Funding
Acknowledgments
Conflicts of Interest
References
- Bangsbo, J. Energy demands in competitive soccer. J. Sports Sci. 1994, 12, S5–S12. [Google Scholar] [CrossRef] [PubMed]
- Sporis, G.; Jukic, I.; Ostojic, S.M.; Milanovic, D. Fitness profiling in soccer: Physical and physiologic characteristics of elite players. J. Strength Cond. Res. 2009, 23, 1947–1953. [Google Scholar] [CrossRef] [PubMed]
- Guttierres, A.P.M.; Natali, A.J.; Vianna, J.M.; Reis, V.M.; Marins, J.C.B. Dehydration in Soccer Players After a Match in the Heat. Biol. Sport 2011, 28, 249–254. [Google Scholar] [CrossRef]
- Belval, L.N.; Hosokawa, Y.; Casa, D.J.; Adams, W.M.; Armstrong, L.E.; Baker, L.B.; Burke, L.; Cheuvront, S.; Chiampas, G.; Gonzalez-Alonso, J.; et al. Practical Hydration Solutions for Sports. Nutrients 2019, 11, 1550. [Google Scholar] [CrossRef] [PubMed]
- Maughan, R.J.; Merson, S.J.; Broad, N.P.; Shirreffs, S.M. Fluid and electrolyte intake and loss in elite soccer players during training. Int. J. Sport Nutr. Exerc. Metab. 2004, 14, 333–346. [Google Scholar] [CrossRef]
- Sawka, M.N.; Burke, L.M.; Eichner, E.R.; Maughan, R.J.; Montain, S.J.; Stachenfeld, N.S. American College of Sports Medicine position stand. Exercise and fluid replacement. Med. Sci. Sports Exerc. 2007, 39, 377–390. [Google Scholar]
- Baron, S.; Courbebaisse, M.; Lepicard, E.M.; Friedlander, G. Assessment of hydration status in a large population. Br. J. Nutr. 2014, 113, 1–12. [Google Scholar] [CrossRef]
- Nuccio, R.P.; Barnes, K.A.; Carter, J.M.; Baker, L.B. Fluid Balance in Team Sport Athletes and the Effect of Hypohydration on Cognitive, Technical, and Physical Performance. Sports Med. 2017, 47, 1951–1982. [Google Scholar] [CrossRef]
- Davis, J.K.; Laurent, C.M.; Allen, K.E.; Green, J.M.; Stolworthy, N.I.; Welch, T.R.; Nevett, M.E. Influence of Dehydration on Intermittent Sprint Performance. J. Strength Cond. Res. 2015, 29, 2586–2593. [Google Scholar] [CrossRef]
- Goulet, E.D. Dehydration and endurance performance in competitive athletes. Nutr. Rev. 2012, 70, S132–S136. [Google Scholar] [CrossRef]
- McDermott, B.P.; Anderson, S.A.; Armstrong, L.E.; Casa, D.J.; Cheuvront, S.N.; Cooper, L.; Kenney, W.L.; O’Connor, F.G.; Roberts, W.O. National Athletic Trainers’ Association Position Statement: Fluid Replacement for the Physically Active. J. Athl. Train. 2017, 52, 877–895. [Google Scholar] [CrossRef] [PubMed]
- Castro-Sepulveda, M.; Astudillo, J.; Letelier, P.; Zbinden-Foncea, H. Prevalence of Dehydration Before Training Sessions, Friendly and Official Matches in Elite Female Soccer Players. J. Hum. Kinet. 2016, 50, 79–84. [Google Scholar] [CrossRef] [PubMed]
- Kilding, A.E.; Tunstall, H.; Wraith, E.; Good, M.; Gammon, C.; Smith, C. Sweat rate and sweat electrolyte composition in international female soccer players during game specific training. Int. J. Sports Med. 2009, 30, 443–447. [Google Scholar] [CrossRef] [PubMed]
- Gibson, J.C.; Stuart-Hill, L.A.; Pethick, W.; Gaul, C.A. Hydration status and fluid and sodium balance in elite Canadian junior women’s soccer players in a cool environment. Appl. Physiol. Nutr. Metab. 2012, 37, 931–937. [Google Scholar] [CrossRef] [PubMed]
- Mohr, M.; Krustrup, P.; Andersson, H.; Kirkendal, D.; Bangsbo, J. Match activities of elite women soccer players at different performance levels. J. Strength Cond. Res. 2008, 22, 341–349. [Google Scholar] [CrossRef] [PubMed]
- Orendurff, M.S.; Walker, J.D.; Jovanovic, M.; Tulchin, K.L.; Levy, M.; Hoffmann, D.K. Intensity and duration of intermittent exercise and recovery during a soccer match. J. Strength Cond. Res. 2010, 24, 2683–2692. [Google Scholar] [CrossRef]
- Sekiguchi, Y.; Adams, W.M.; Curtis, R.M.; Benjamin, C.L.; Casa, D.J. Factors influencing hydration status during a National Collegiate Athletics Association division 1 soccer preseason. J. Sci. Med. Sport 2019, 22, 624–628. [Google Scholar] [CrossRef]
- Nassis, G.P.; Brito, J.; Dvorak, J.; Chalabi, H.; Racinais, S. The association of environmental heat stress with performance: Analysis of the 2014 FIFA World Cup Brazil. Br. J. Sports Med. 2015, 49, 609–613. [Google Scholar] [CrossRef]
- Benjamin, C.L.; Hosokawa, Y.; Curtis, R.M.; Schaefer, D.A.; Bergin, R.T.; Abegg, M.R.; Casa, D.J. Environmental Conditions, Preseason Fitness Levels, and Game Workload: Analysis of a Female NCAA DI National Championship Soccer Season. J. Strength Cond. Res. 2020, 34, 988–994. [Google Scholar] [CrossRef]
- Maughan, R.J. Impact of mild dehydration on wellness and on exercise performance. Eur. J. Clin. Nutr. 2003, 57, S19–S23. [Google Scholar] [CrossRef]
- Casa, D.J.; Armstrong, L.E.; Hillman, S.K.; Montain, S.J.; Reiff, R.V.; Rich, B.S.; Roberts, W.O.; Stone, J.A. National athletic trainers’ association position statement: Fluid replacement for athletes. J. Athl. Train. 2000, 35, 212–224. [Google Scholar] [PubMed]
- Morris, N.B.; Cramer, M.N.; Hodder, S.G.; Havenith, G.; Jay, O. A comparison between the technical absorbent and ventilated capsule methods for measuring local sweat rate. J. Appl. Physiol. 2013, 114, 816–823. [Google Scholar] [CrossRef] [PubMed]
- Baker, L.B.; De Chavez, P.J.D.; Ungaro, C.T.; Sopena, B.C.; Nuccio, R.P.; Reimel, A.J.; Barnes, K.A. Exercise intensity effects on total sweat electrolyte losses and regional vs. whole-body sweat [Na(+)], [Cl(-)], and [K(+)]. Eur. J. Appl. Physiol. 2019, 119, 361–375. [Google Scholar] [CrossRef] [PubMed]
- Miller, K.C.; McDermott, B.P.; Yeargin, S.W. Sweat Characteristics of Cramp-Prone and Cramp-Resistant Athletes. Int. J. Sport Nutr. Exerc. Metab. 2020. [Google Scholar] [CrossRef]
- Olzinski, S.; Beaumont, J.; Toledo, M.; Yudell, A.; Johnston, C.S.; Wardenaar, F.C. Hydration Status and Fluid Needs of Division I Female Collegiate Athletes Exercising Indoors and Outdoors. Sports 2019, 7, 155. [Google Scholar] [CrossRef]
- Baker, L.B.; Dougherty, K.A.; Chow, M.; Kenney, W.L. Progressive dehydration causes a progressive decline in basketball skill performance. Med. Sci. Sports Exerc. 2007, 39, 1114–1123. [Google Scholar] [CrossRef]
- Burke, L.M. Fluid balance during team sports. J. Sports Sci. 1997, 15, 287–295. [Google Scholar] [CrossRef]
- Davis, J.A.; Brewer, J. Applied physiology of female soccer players. Sports Med. 1993, 16, 180–189. [Google Scholar] [CrossRef]
- Datson, N.; Drust, B.; Weston, M.; Jarman, I.H.; Lisboa, P.J.; Gregson, W. Match Physical Performance of Elite Female Soccer Players During International Competition. J. Strength Cond. Res. 2017, 31, 2379–2387. [Google Scholar] [CrossRef]
- Mara, J.K.; Thompson, K.G.; Pumpa, K.L.; Morgan, S. Quantifying the High-Speed Running and Sprinting Profiles of Elite Female Soccer Players During Competitive Matches Using an Optical Player Tracking System. J. Strength Cond. Res. 2017, 31, 1500–1508. [Google Scholar] [CrossRef]
- Lockie, R.G.; Moreno, M.R.; Lazar, A.; Orjalo, A.J.; Giuliano, D.V.; Risso, F.G.; Davis, D.L.; Crelling, J.B.; Lockwood, J.R.; Jalilvand, F. The Physical and Athletic Performance Characteristics of Division I Collegiate Female Soccer Players by Position. J. Strength Cond. Res. 2018, 32, 334–343. [Google Scholar] [CrossRef] [PubMed]
- Gabbett, T.J.; Mulvey, M.J. Time-motion analysis of small-sided training games and competition in elite women soccer players. J. Strength Cond. Res. 2008, 22, 543–552. [Google Scholar] [CrossRef] [PubMed]
- Savoie, F.A.; Dion, T.; Asselin, A.; Goulet, E.D. Sodium-induced hyperhydration decreases urine output and improves fluid balance compared with glycerol- and water-induced hyperhydration. Appl. Physiol. Nutr. Metab. 2015, 40, 51–58. [Google Scholar] [CrossRef] [PubMed]
- Brouns, F. Gastric emptying as a regulatory factor in fluid uptake. Int. J. Sports Med. 1998, 19, S125–S128. [Google Scholar] [CrossRef] [PubMed]
- Maughan, R.J.; Shirreffs, S.M.; Merson, S.J.; Horswill, C.A. Fluid and electrolyte balance in elite male football (soccer) players training in a cool environment. J. Sports Sci. 2005, 23, 73–79. [Google Scholar] [CrossRef] [PubMed]
- Shirreffs, S.M.; Aragon-Vargas, L.F.; Chamorro, M.; Maughan, R.J.; Serratosa, L.; Zachwieja, J.J. The sweating response of elite professional soccer players to training in the heat. Int. J. Sports Med. 2005, 26, 90–95. [Google Scholar] [CrossRef] [PubMed]
- Galloway, S.D.; Maughan, R.J. Effects of ambient temperature on the capacity to perform prolonged cycle exercise in man. Med. Sci. Sports Exerc. 1997, 29, 1240–1249. [Google Scholar] [CrossRef]
- Patterson, M.J.; Galloway, S.D.; Nimmo, M.A. Variations in regional sweat composition in normal human males. Exp. Physiol. 2000, 85, 869–875. [Google Scholar] [CrossRef]
- Shirreffs, S.M.; Sawka, M.N.; Stone, M. Water and electrolyte needs for football training and match-play. J. Sports Sci. 2006, 24, 699–707. [Google Scholar] [CrossRef]
- Weschler, L.B. Sweat electrolyte concentrations obtained from within occlusive coverings are falsely high because sweat itself leaches skin electrolytes. J. Appl. Physiol. 2008, 105, 1376–1377. [Google Scholar] [CrossRef]
- Baker, L.B.; Stofan, J.R.; Lukaski, H.C.; Horswill, C.A. Exercise-induced trace mineral element concentration in regional versus whole-body wash-down sweat. Int. J. Sport Nutr. Exerc. Metab. 2011, 21, 233–239. [Google Scholar] [CrossRef] [PubMed]
- Yeargin, S.W.; Finn, M.E.; Eberman, L.E.; Gage, M.J.; McDermott, B.P.; Niemann, A. Ad libitum fluid consumption via self- or external administration. J. Athl. Train 2015, 50, 51–58. [Google Scholar] [CrossRef] [PubMed]


| LOW | MOD | All | |
|---|---|---|---|
| Practices (n) | 7 | 7 | 14 |
| Pre-urine samples (n) | 110 | 114 | 224 |
| Post-urine samples (n) | 109 | 112 | 221 |
| Sweat samples (n) | 109 | 109 | 218 |
| Ambient temperature (°C) | 20.0 ± 2.7 | 22.3 ± 1.5 a | 21.2 ± 2.4 |
| Relative Humidity (%) | 50.5 ± 13.1 | 77.5 ± 5.0 a | 64.1 ± 16.7 |
| WBGT (°C) | 16.2 ± 2.6 | 20.5 ± 1.5 a | 18.4 ± 3.0 |
| FW (n = 3) | MD (n = 7) | DF (n = 5) | GK (n = 3) | All (n = 18) | p-Value | |
|---|---|---|---|---|---|---|
| Age (years) | 20 ± 1 | 19 ± 1 | 19 ± 1 | 19 ± 1 | 19 ± 1 | 0.09 |
| Weight (kg) | 71.0 ± 6.9 b | 63.5 ± 4.9 b,d | 63.9 ± 6.0 b.d | 82.7 ± 6.1 | 68.5 ± 9.0 | 0.001 |
| Height (cm) | 169.1 ± 4.9 b,c | 165.9 ± 5.1 b | 168.0 ± 8.6 b,c | 174.4 ± 3.4 | 168.4 ± 6.7 | 0.001 |
| Fluid Balance | ||||||
| Body mass change (%) | −0.6 ± 0.5 a | −0.7 ± 0.6 a | −0.3 ± 0.6 | −0.5 ± 0.5 a | −0.5 ± 0.6 | <0.001 |
| WATER intake (g) | 356 ± 239 a | 357 ± 275 a,b | 203 ± 264 | 473 ± 367 a | 333 ± 296 | <0.001 |
| CES intake (g) | 233 ± 248 a,b | 242 ± 256 a,b | 525 ± 351 | 80 ± 179 a | 288 ± 312 | <0.001 |
| %WATER intake | 63 ± 31 a,b | 60 ± 35 a,b | 29 ± 32 | 79 ± 33 a | 55 ± 38 | <0.001 |
| %CES intake | 37 ± 31 a | 40 ± 35 a,b | 71 ± 32 | 21 ± 33 a | 45 ± 38 | <0.001 |
| Sodium intake (mg) | 97 ± 103 a,b | 100 ± 106 a,b | 217 ± 145 | 33 ± 74 a | 119 ± 129 | <0.001 |
| Total fluid intake (g) | 589 ± 225 a | 607 ± 273 a | 728 ± 369 | 559 ± 340 a | 630 ± 312 | 0.03 |
| Urine Analysis | ||||||
| Pre USG | 1.023 ± 0.007c | 1.017 ± 0.009 | 1.021 ± 0.007 c | 1.020 ± 0.007 | 1.020 ± 0.008 | 0.002 |
| Pre (Na+) (mmol·L−1) | 178.5 ± 64.8 | 133.1 ± 72.4 d | 141.5 ± 59.0 d | 151.4 ± 69.3 | 144.8 ± 68.6 | 0.02 |
| Pre (K+) (mmol·L−1) | 42.8 ± 17.0 | 43.0 ± 31.0 | 51.4 ± 27.7 | 56.8 ± 39.9 | 47.7 ± 30.7 | 0.07 |
| Pre (Cl−) (mmol·L−1) | 158.4 ± 57.8 | 128.0 ± 71.9 | 132.2 ± 54.8 | 141.8 ± 75.9 | 135.7 ± 66.9 | 0.16 |
| Post USG | 1.021 ± 0.008 c | 1.017 ± 0.008 | 1.022 ± 0.006 c | 1.021 ± 0.007 c | 1.020 ± 0.008 | 0.001 |
| Post (Na+) (mmol·L−1) | 143.2 ± 54.7 | 96.6 ± 55.6 a,d | 123.1 ± 58.5 | 104.9 ± 50.0 d | 111.3 ± 57.4 | 0.001 |
| Post (K+) (mmol·L−1) | 57.6 ± 24.9 | 50.0 ± 31.8 | 58.1 ± 22.9 | 60.7 ± 30.4 | 55.1 ± 28.6 | 0.16 |
| Post (Cl−) (mmol·L−1) | 140.6 ± 57.3 c | 95.1 ± 58.3 | 120.9 ± 55.2 c | 121.4 ± 65.6 c | 112.7 ± 60.5 | 0.001 |
| Sweat Analysis | ||||||
| Sweat (Na+) (mmol·L−1) | 51.4 ± 9.8 b | 46.0 ± 9.4 b,d | 48.0 ± 6.4 b | 30.9 ± 3.9 d | 44.5 ± 10.4 | <0.001 |
| Sweat (K+) (mmol·L−1) | 4.9 ± 1.4 a | 5.3 ± 0.9 a | 5.8 ± 1.3 | 5.3 ± 1.0 | 5.4 ± 1.1 | 0.03 |
| Sweat (Cl−) (mmol·L−1) | 47.6 ± 9.4 b | 42.1 ± 9.0 b,d | 43.1 ± 6.4 b,d | 29.9 ± 3.3 d | 40.5 ± 9.9 | 0.001 |
| Sweat rate (mg·cm−2·min−1) | 0.99 ± 0.21 | 1.06 ± 0.21 | 1.02 ± 0.21 | 1.03 ± 0.20 | 1.03 ± 0.21 | 0.42 |
© 2020 by the authors. Licensee MDPI, Basel, Switzerland. This article is an open access article distributed under the terms and conditions of the Creative Commons Attribution (CC BY) license (http://creativecommons.org/licenses/by/4.0/).
Share and Cite
Wang, H.; Early, K.S.; Theall, B.M.; Lowe, A.C.; Lemoine, N.P., Jr.; Marucci, J.; Mullenix, S.; Johannsen, N.M. Effects of Field Position on Fluid Balance and Electrolyte Losses in Collegiate Women’s Soccer Players. Medicina 2020, 56, 502. https://doi.org/10.3390/medicina56100502
Wang H, Early KS, Theall BM, Lowe AC, Lemoine NP Jr., Marucci J, Mullenix S, Johannsen NM. Effects of Field Position on Fluid Balance and Electrolyte Losses in Collegiate Women’s Soccer Players. Medicina. 2020; 56(10):502. https://doi.org/10.3390/medicina56100502
Chicago/Turabian StyleWang, Haoyan, Kate S. Early, Bailey M. Theall, Adam C. Lowe, Nathan P. Lemoine, Jr., Jack Marucci, Shelly Mullenix, and Neil M. Johannsen. 2020. "Effects of Field Position on Fluid Balance and Electrolyte Losses in Collegiate Women’s Soccer Players" Medicina 56, no. 10: 502. https://doi.org/10.3390/medicina56100502
APA StyleWang, H., Early, K. S., Theall, B. M., Lowe, A. C., Lemoine, N. P., Jr., Marucci, J., Mullenix, S., & Johannsen, N. M. (2020). Effects of Field Position on Fluid Balance and Electrolyte Losses in Collegiate Women’s Soccer Players. Medicina, 56(10), 502. https://doi.org/10.3390/medicina56100502