Demographic, Social, and Behavioral Determinants of Lung Cancer Perceived Risk and Worries in a National Sample of American Adults; Does Lung Cancer Risk Matter?


Abstract
1. Introduction
2. Methods
2.1. Design and Setting
2.2. Ethical Considerations
2.3. Sampling
2.4. Surveys
2.5. Study Variables
2.6. Independent Variables
2.7. Dependent Variables
2.8. Effect Modifier
2.9. Statistical Analysis
3. Results
3.1. Descriptive Statistics
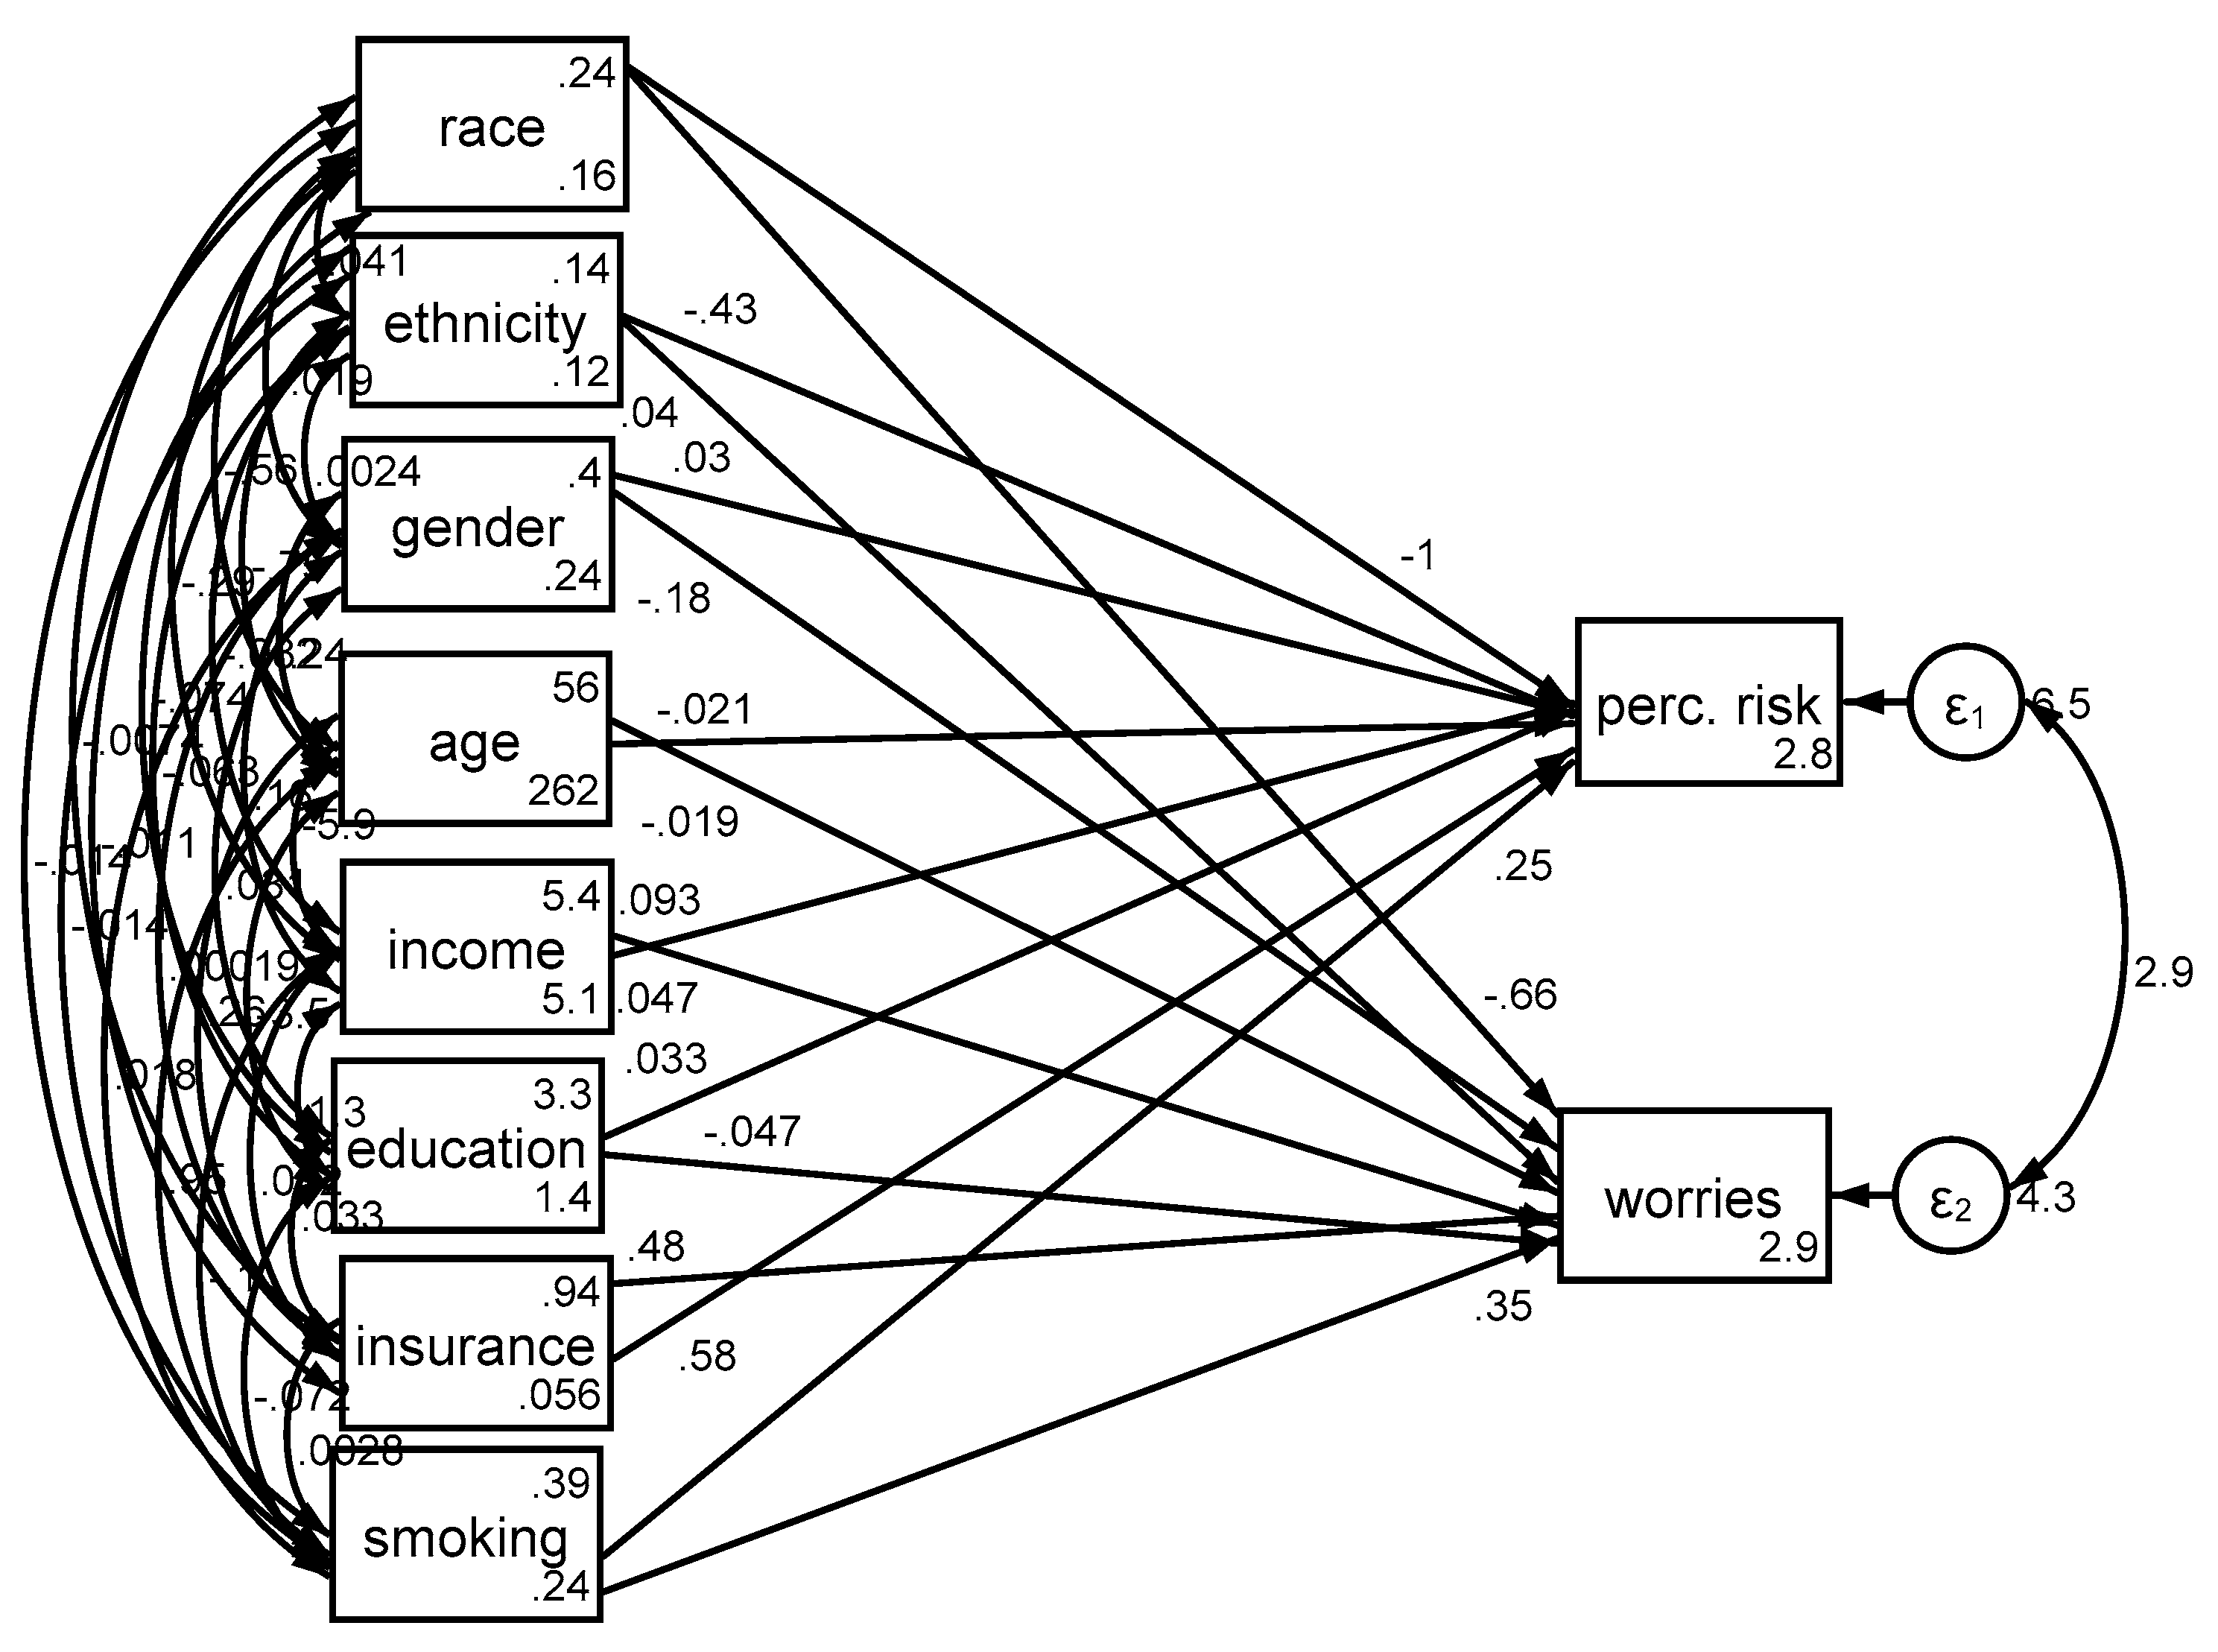
3.2. Determinants in the Pooled Sample
4. Discussion
4.1 Limitations
4.2. Implications
5. Conclusions
Author Contributions
Funding
Acknowledgments
Conflicts of Interest
References
- Siegel, R.L.; Miller, K.D.; Jemal, A. Cancer statistics, 2018. CA Cancer J. Clin. 2018, 68, 7–30. [Google Scholar] [CrossRef] [PubMed]
- Cancer Prevention & Early Detection Facts & Figures [Internet]. American Cancer Society. 2018. Available online: https://www.cancer.org/research/cancer-facts-statistics/cancer-prevention-early-detection.html (accessed on 1 December 2018).
- National Lung Screening Trial Research Team; Aberle, D.R.; Berg, C.D.; Black, W.C.; Church, T.R.; Fagerstrom, R.M.; Galen, B.; Gareen, I.F.; Goldin, J.; Gohagan, J.K.; et al. The National Lung Screening Trial: Overview and study design. Radiology 2011, 258, 243–253. [Google Scholar] [CrossRef] [PubMed]
- Humphrey, L.; Deffebach, M.; Pappas, M.; Baumann, C.; Artis, K.; Mitchell, J.P.; Zakher, B.; Fu, R.; Slatore, C.G. Screening for lung cancer with low-dose computed tomography: A systematic review to update the US Preventive services task force recommendation. Ann. Intern. Med. 2013, 159. [Google Scholar] [CrossRef]
- Bach, P.B.; Mirkin, J.N.; Oliver, T.K.; Azzoli, C.G.; Berry, D.A.; Brawley, O.W.; Byers, T.; Colditz, G.A.; Gould, M.K.; Jett, J.R.; et al. Benefits and harms of CT screening for lung cancer: A systematic review. JAMA 2012, 307, 2418–2429. [Google Scholar] [CrossRef] [PubMed]
- U.S. Preventive Services Task Force. Lung cancer screening: Recommendation statement. Ann. Internal Med. 2004, 140, 738–739. [Google Scholar] [CrossRef]
- Wender, R.; Fontham, E.T.H.; Barrera, E.J.; Colditz, G.A.; Church, T.R.; Ettinger, D.S.; Etzioni, R.; Flowers, C.R.; Scott Gazelle, G.; Kelsey, D.K.; et al. American Cancer Society lung cancer screening guidelines. CA Cancer J. Clin. 2013, 63, 107–117. [Google Scholar] [CrossRef] [PubMed]
- Mazzone, P.; Powell, C.A.; Arenberg, D.; Bach, P.; Detterbeck, F.; Gould, M.K.; Jaklitsch, M.T.; Jett, J.; Naidich, D.; Vachani, A.; et al. Components necessary for high-quality lung cancer screening: American college of chest physicians and American thoracic society policy statement. Chest 2015, 147, 295–303. [Google Scholar] [CrossRef] [PubMed]
- Centers for Medicare & Medicaid Services. Decision Memo for Screening for Lung Cancer with Low-Dose computed Tomography (LDCT); Centers for Medicare & Medicaid Services: Baltimore, MD, USA, 2015. [Google Scholar]
- Jemal, A.; Fedewa, S.A. Lung Cancer Screening with Low-Dose Computed Tomography in the United States—2010 to 2015. JAMA Oncol. 2017, 3, 1278. [Google Scholar] [CrossRef] [PubMed]
- Ferrer, R.A.; Klein, W.M.P.; Persoskie, A.; Avishai-Yitshak, A.; Sheeran, P. The Tripartite Model of Risk Perception (TRIRISK): Distinguishing Deliberative, Affective, and Experiential Components of Perceived Risk. Ann. Behav. Med. 2016, 50, 653–663. [Google Scholar] [CrossRef]
- Rimer, B.; Glanz, K. Theory at a Glance. A Guide for Helath Promotion Practice; National Cancer Institute: Rockville, MD, USA, 2005. Available online: https://cancercontrol.cancer.gov/brp/research/theories_project/theory.pdf (accessed on 01 December 2018).
- Mazières, J.; Pujol, J.L.; Kalampalikis, N.; Bouvry, D.; Quoix, E.; Filleron, T.; Targowla, N.; Jodelet, D.; Milia, J.; Milleron, B.; et al. Perception of lung cancer among the general population and comparison with other cancers. J. Thorac. Oncol. 2015, 10, 420–425. [Google Scholar] [CrossRef]
- Chen, L.-S.; Kaphingst, K.A.; Tseng, T.-S.; Zhao, S. How are lung cancer risk perceptions and cigarette smoking related?—Testing an accuracy hypothesis. Transl. Cancer Res. 2016. [Google Scholar] [CrossRef] [PubMed]
- Tilburt, J.C.; James, K.M.; Sinicrope, P.S.; Eton, D.T.; Costello, B.A.; Carey, J.; Lane, M.A.; Ehlers, S.L.; Erwin, P.J.; Nowakowski, K.E.; et al. Factors influencing cancer risk perception in high risk populations: A. systematic review. Hered. Cancer Clin. Pract. 2011. [Google Scholar] [CrossRef] [PubMed]
- Hesse, B.W.; Moser, R.P.; Rutten, L.J.F.; Kreps, G.L. The Health Information National Trends Survey: Research from the Baseline. J Health Commun. 2006, 11, 7–16. [Google Scholar] [CrossRef] [PubMed]
- Moser, R.P.; Mccaul, K.; Peters, E.; Nelson, W.; Marcus, S.E. Associations of perceived risk and worry with cancer health-protective actions: Data from the Health Information National Trends Survey (HINTS). J Health Psychol. 2007, 12, 53–65. [Google Scholar] [CrossRef] [PubMed]
- Chen, Y.; Yang, Q. How do cancer risk perception, benefit perception of quitting, and cancer worry influence quitting intention among current smokers: A study using the 2013 HINTS. J. Subst. Use 2017, 22, 555–560. [Google Scholar] [CrossRef]
- Kline, R.B. Principles and Practice of Structural Equation Modeling, 3rd ed.; Guilford Press: New York, NY, USA, 2010. [Google Scholar]
- Allison, P.D. Missing Data; SAGE: Thousand Oaks, CA, USA, 2002. [Google Scholar]
- Arbuckle, J.A. IBM SPSS Amos 20 User’s Guide. Available online: ftp://ftp.software.ibm.com/software/analytics/spss/documentation/amos/20.0/en/Manuals/IBM_SPSS_Amos_User_Guide.pdf (accessed on 7 December 2018).
- Hu, L.; Bentler, P.M. Cutoff criteria for fit indexes in covariance structure analysis: Conventional criteria versus new alternatives. Struct. Equ. Model. A Multidiscip. J. 1999, 6, 1–55. [Google Scholar] [CrossRef]
- Lei, M.; Lomax, R.G. The effect of varying degrees of nonnormality in structural equation modeling. Struct. Equ. Model. 2005, 12, 1–27. [Google Scholar] [CrossRef]
- Orom, H.; O’Quin, K.E.; Reilly, S.; Kiviniemi, M.T. Perceived cancer risk and risk attributions among African-American residents of a low-income, predominantly African-American neighborhood. Ethn. Health 2015, 20, 543–556. [Google Scholar] [CrossRef]
- Buster, K.J.; You, Z.; Fouad, M.; Elmets, C. Skin cancer risk perceptions: A comparison across ethnicity, age, education, gender, and income. J. Am. Acad. Dermatol. 2012, 66, 771–779. [Google Scholar] [CrossRef]
- Institute, N.C. Examples of Cancer Health Disparities. Available online: https://www.cancer.gov/about-nci/organization/crchd/about-health-disparities/examples#underserved (accessed on 01 December 2018).
- Tannenbaum, S.L.; Koru-Sengul, T.; Zhao, W.; Miao, F.; Byrne, M.M. Survival disparities in non-small cell lung cancer by race, ethnicity, and socioeconomic status. Cancer J. 2014, 20, 237–245. [Google Scholar] [CrossRef]
- Japuntich, S.J.; Krieger, N.H.; Salvas, A.L.; Carey, M.P. Racial Disparities in Lung Cancer Screening: An Exploratory Investigation. J. Natl. Med. Assoc. 2018, 110, 424–427. [Google Scholar] [CrossRef] [PubMed]
- Carter-Harris, L.; Slaven, J.E.; Monahan, P.O.; Shedd-Steele, R.; Hanna, N.; Rawl, S.M. Understanding lung cancer screening behavior: Racial, gender, and geographic differences among Indiana long-term smokers. Prev. Med. Rep. 2018. [Google Scholar] [CrossRef] [PubMed]
- Park, E.R.; Ostroff, J.S.; Rakowski, W.; Gareen, I.F.; Diefenbach, M.A.; Feibelmann, S.; Rigotti, N.A. Risk perceptions among participants undergoing lung cancer screening: Baseline results from the national lung screening trial. Ann. Behav. Med. 2009. [Google Scholar] [CrossRef] [PubMed]
- Patel, D.; Akporobaro, A.; Chinyanganya, N.; Hackshaw, A.; Seale, C.; Spiro, S.G.; Griffiths, C. Attitudes to participation in a lung cancer screening trial: A. qualitative study. Thorax 2012. [Google Scholar] [CrossRef] [PubMed]
- Ali, N.; Lifford, K.J.; Carter, B.; McRonald, F.; Yadegarfar, G.; Baldwin, D.R.; Weller, D.; Hansell, D.M.; Duffy, S.W.; Field, J.K.; et al. Barriers to uptake among high-risk individuals declining participation in lung cancer screening: A mixed methods analysis of the UK lung cancer screening (UKLS) trial. BMJ Open 2015. [Google Scholar] [CrossRef]
- White, M.C.; Holman, D.M.; Boehm, J.E.; Peipins, L.A.; Grossman, M.; Jane Henley, S. Age and cancer risk: A potentially modifiable relationship. Am. J. Prev. Med. 2014. [Google Scholar] [CrossRef] [PubMed]
- Yancik, R. Population aging and cancer: A cross-national concern. Cancer J. 2005. [Google Scholar] [CrossRef]
- Katapodi, M.C.; Lee, K.A.; Facione, N.C.; Dodd, M.J. Predictors of perceived breast cancer risk and the relation between perceived risk and breast cancer screening: A meta-analytic review. Prev. Med. 2004. [Google Scholar] [CrossRef] [PubMed]
- Carstensen, B. Age-period-cohort models for the Lexis diagram. Stat. Med. 2007. [Google Scholar] [CrossRef]
- Palmore, E. When Can Age, Period, and Cohort be Separated? Soc. Forces 1978. [Google Scholar] [CrossRef]
- Finucane, M.L.; Slovic, P.; Mertz, C.K.; Flynn, J.; Satterfield, T.A.; Flynn, J.; Satterfield, T.A. Gender, race, and perceived risk: The’white male’effect. Health Risk Soc. 2000, 2, 159–172. [Google Scholar] [CrossRef]
- Gustafson, P.E. Gender differences in risk perception: Theoretical and methodological perspectives. Risk Anal. 1998. [Google Scholar] [CrossRef]
- McLean, C.P.; Anderson, E.R. Brave men and timid women? A review of the gender differences in fear and anxiety. Clin. Psychol. Rev. 2009. [Google Scholar] [CrossRef] [PubMed]
- Depaola, S.J.; Griffin, M.; Young, J.R.; Neimeyer, R.A. Death Anxiety and Attitudes Towardthe Elderly among Older Adults: The Role of Gender and Ethnicity. Death Stud. 2003. [Google Scholar] [CrossRef] [PubMed]
- Altemus, M.; Sarvaiya, N.; Neill Epperson, C. Sex differences in anxiety and depression clinical perspectives. Front. Neuroendocrinol. 2014. [Google Scholar] [CrossRef]
- McLean, C.P.; Asnaani, A.; Litz, B.T.; Hofmann, S.G. Gender differences in anxiety disorders: Prevalence, course of illness, comorbidity and burden of illness. J. Psychiatr. Res. 2011. [Google Scholar] [CrossRef]
- Mayor, E. Gender roles and traits in stress and health. Front. Psychol. 2015. [Google Scholar] [CrossRef]
- Lantz, P.M.; House, J.S.; Lepkowski, J.M.; Williams, D.R.; Mero, R.P.; Chen, J. Socioeconomic Factors, Health Behaviors, and Mortality: Results from a Nationally Representative Prospective Study of US Adults. JAMA 1998. [Google Scholar] [CrossRef]
- Rikard, R.V.; Thompson, M.S.; McKinney, J.; Beauchamp, A. Examining health literacy disparities in the United States: A third look at the National Assessment of Adult Literacy (NAAL). BMC Public Health 2016. [Google Scholar] [CrossRef]
- Assari, S. Over-adjustment bias by controlling for overall health. Int. J. Prev. Med. 2013, 44, 491. [Google Scholar]
- Schisterman, E.F.; Cole, S.R.; Platf, R.W. Overadjustment bias and unnecessary adjustment in epidemiologic studies. Epidemiology 2009. [Google Scholar] [CrossRef] [PubMed]
- Bowen, D.J.; Alfano, C.M.; McGregor, B.A.; Andersen, M.R. The relationship between perceived risk, affect, and health behaviors. Cancer Detect. Prev. 2004. [Google Scholar] [CrossRef] [PubMed]
- Waters, E.A.; Arora, N.K.; Klein, W.M.P.; Han, P.K.J. Perceived Risk, Trust and Health-related Quality of Life Among Cancer Survivors. Ann. Behav. Med. 2010, 39, 91–97. [Google Scholar] [CrossRef] [PubMed]
- Robins, J. A new approach to causal inference in mortality studies with a sustained exposure period-application to control of the healthy worker survivor effect. Math. Model 1986. [Google Scholar] [CrossRef]
- VanderWeele, T.J.; Hern, M.A.; Robins, J.M. Causal directed acyclic graphs and the direction of unmeasured confounding bias. Epidemiology 2008. [Google Scholar] [CrossRef] [PubMed]
- Shrier, I.; Platt, R.W. Reducing bias through directed acyclic graphs. BMC Med. Res. Methodol. 2008. [Google Scholar] [CrossRef]
- Fleischer, N.L.; Diez Roux, A.V. Using directed acyclic graphs to guide analyses of neighbourhood health effects: An introduction. J. Epidemiol. Community Health 2008. [Google Scholar] [CrossRef]
- Lipkus, I.M.; Kuchibhatla, M.; McBride, C.M.; Bosworth, H.B.; Pollak, K.I.; Siegler, I.C.; Rimer, B.K. Relationships among breast cancer perceived absolute risk, comparative risk, and worries. Cancer Epidemiol. Biomark. Prev. 2000. [Google Scholar] [CrossRef]
- Woloshin, S.; Schwartz, L.M.; Black, W.C.; Welch, H.G. Women’s perceptions of breast cancer risk: How you ask matters. Med. Decis. Mak. 1999. [Google Scholar] [CrossRef]
- Youth and tobacco use. Center for Disease Control and Prevention. Available online: https://www.cdc.gov/tobacco/data_statistics/fact_sheets/youth_data/tobacco_use/ (accessed on 1 December 2018).


| All (n = 2277) | Low Risk (n = 1734) | High Risk (n = 543) | ||||
|---|---|---|---|---|---|---|
| % (SE) | 95% CI | %(SE) | 95% CI | %(SE) | 95% CI | |
| Race | ||||||
| Whites | 86.66 (0.01) | 85.48–87.85 | 85.90(0.01) | 84.53–87.28 | 90.83(0.01) | 87.84–93.82 |
| Blacks | 13.34 (0.01) | 12.15–14.52 | 14.10 (0.01) | 12.72–15.47 | 9.17 (0.01) | 6.18–12.16 |
| Gender | ||||||
| Male | 47.89 (0.01) | 46.57–49.21 | 47.03 (0.01) | 45.50–48.57 | 52.58 (0.02) | 48.61–56.55 |
| Female | 52.11 (0.01) | 50.79–53.43 | 52.97 (0.01) | 51.43–54.50 | 47.42 (0.02) | 43.45–51.39 |
| Health Insurance | ||||||
| No | 7.87 (0.01) | 6.40–9.35 | 8.36 (0.01) | 6.62–10.10 | 5.23 (0.01) | 2.27–8.18 |
| Yes | 92.13 (0.01) | 90.65–93.60 | 91.64 (0.01) | 89.90–93.38 | 94.77 (0.01) | 91.82–97.73 |
| Mean (SE) | 95% CI | Mean (SE) | 95% CI | Mean (SE) | 95% CI | |
| Age | 48.88 (0.34) | 48.19–49.56 | 46.43 (0.38) | 45.65–47.20 | 64.15 (0.28) | 63.58–64.72 |
| Income | 5.60 (0.05) | 5.49–5.70 | 5.67 (0.06) | 5.55–5.78 | 5.16 (0.14) | 4.88–5.44 |
| Education | 3.12 (0.02) | 3.08–3.16 | 3.18 (0.02) | 3.13–3.22 | 2.80 (0.06) | 2.68–2.91 |
| Cancer Perceived Risk | 2.93 (0.02) | 2.83–3.03 | 2.96 (0.05) | 2.86–3.06 | 2.75 (0.17) | 2.41–3.10 |
| Cancer Worries | 2.54 (0.04) | 2.45–2.62 | 2.55 (0.05) | 2.45–2.65 | 2.48 (0.07) | 2.34–2.63 |
| B (SE) | 95% CI | z | p | ||
|---|---|---|---|---|---|
| Ever smoker | Cancer perceived risk | 0.25 (0.10) | 0.05–0.44 | 2.49 | 0.013 |
| Race (Blacks) | Cancer perceived risk | −0.98 (0.20) | −1.37–0.60 | −5.03 | <0.001 |
| Gender (Male) | Cancer perceived risk | 0.03 (0.10) | −0.17–0.23 | 0.31 | 0.757 |
| Age | Cancer perceived risk | −0.02 (0.00) | −0.03–0.01 | −6.18 | <0.001 |
| Income | Cancer perceived risk | 0.09 (0.03) | 0.03–0.15 | 3.12 | 0.002 |
| Education | Cancer perceived risk | 0.03 (0.05) | −0.07–0.13 | 0.61 | 0.544 |
| Health Insurance | Cancer perceived risk | 0.58 (0.20) | 0.19–0.96 | 2.94 | 0.003 |
| Intercept | Cancer perceived risk | 2.83 (0.35) | 2.15–3.51 | 8.17 | <0.001 |
| Ever smoker | Cancer worries | 0.34 (0.08) | 0.18–0.50 | 4.15 | <0.001 |
| Race (Blacks) | Cancer worries | −0.48 (0.15) | − 0.78–0.18 | −3.11 | 0.002 |
| Gender (Male) | Cancer worries | −0.16 (0.08) | −0.33–0.00 | −1.95 | 0.051 |
| Age | Cancer worries | −0.02 (0.00) | −0.03–0.01 | −6.86 | <0.001 |
| Income | Cancer worries | 0.06 (0.03) | 0.01–0.11 | 2.24 | 0.025 |
| Education | Cancer worries | −0.06 (0.04) | −0.14–0.03 | −1.37 | 0.170 |
| Health Insurance | Cancer worries | 0.44 (0.16) | 0.13–0.75 | 2.81 | 0.005 |
| Intercept | Cancer worries | 2.91 (0.29) | 2.34–3.47 | 10.04 | <0.001 |
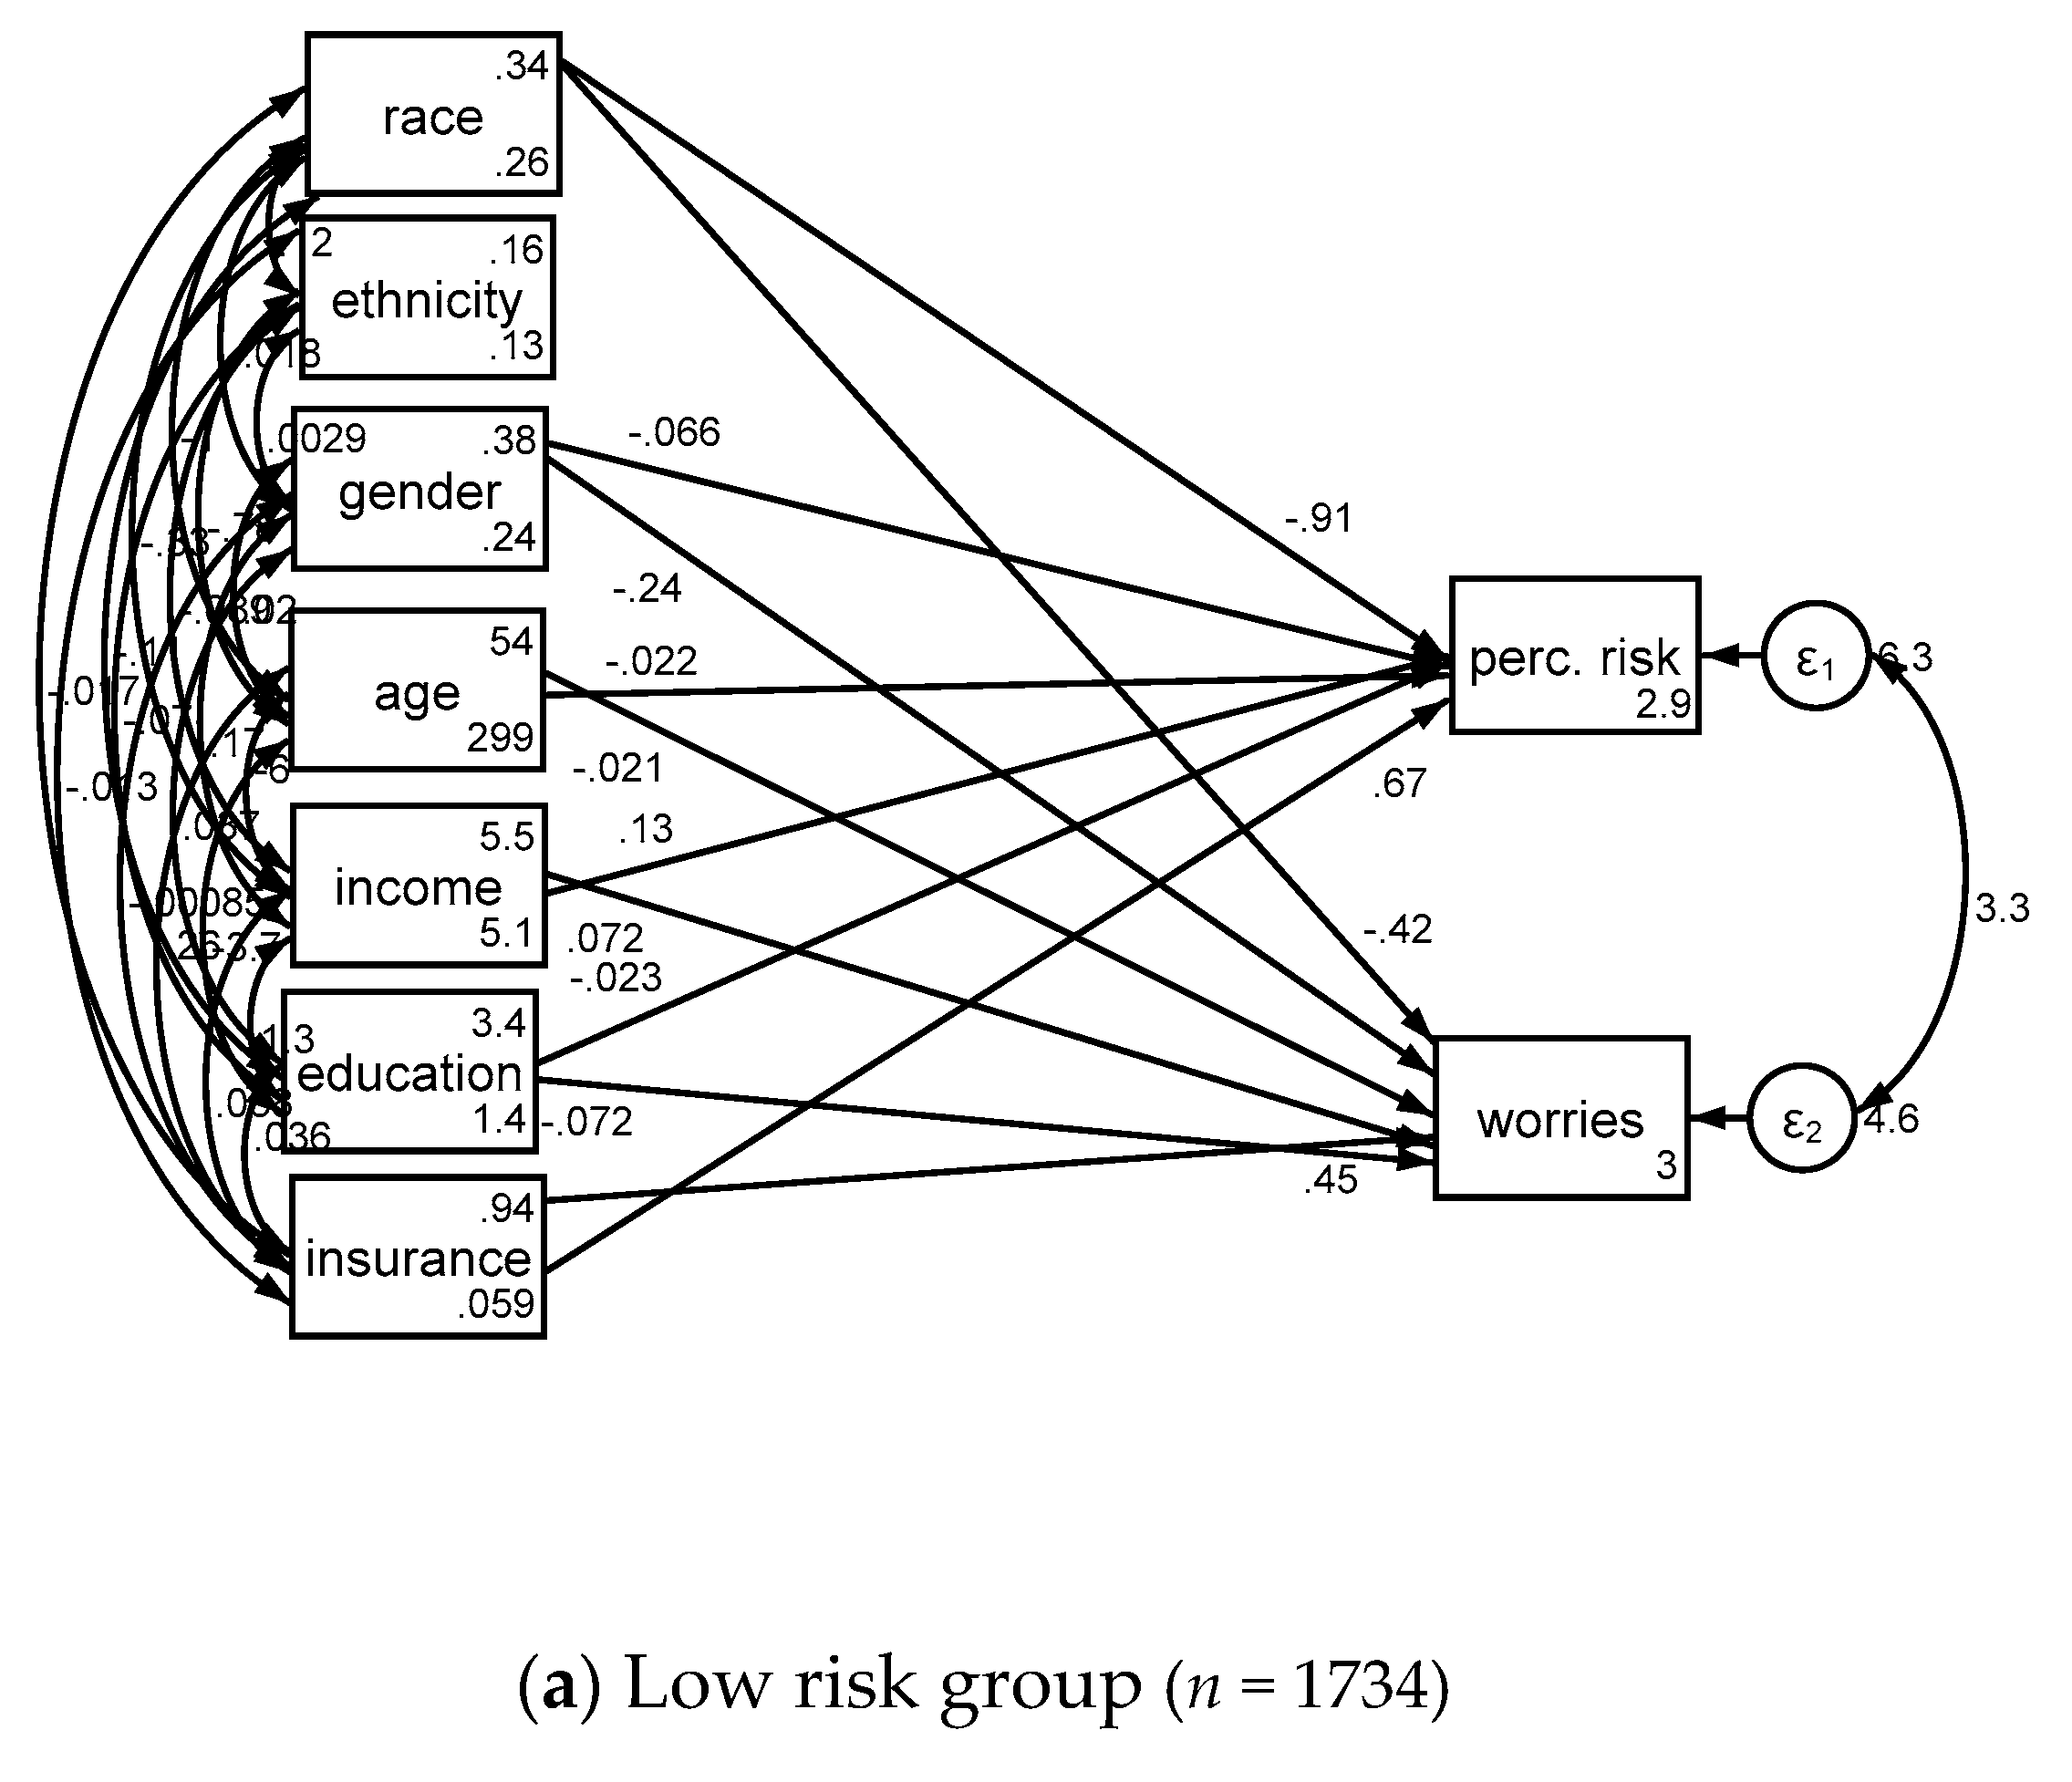
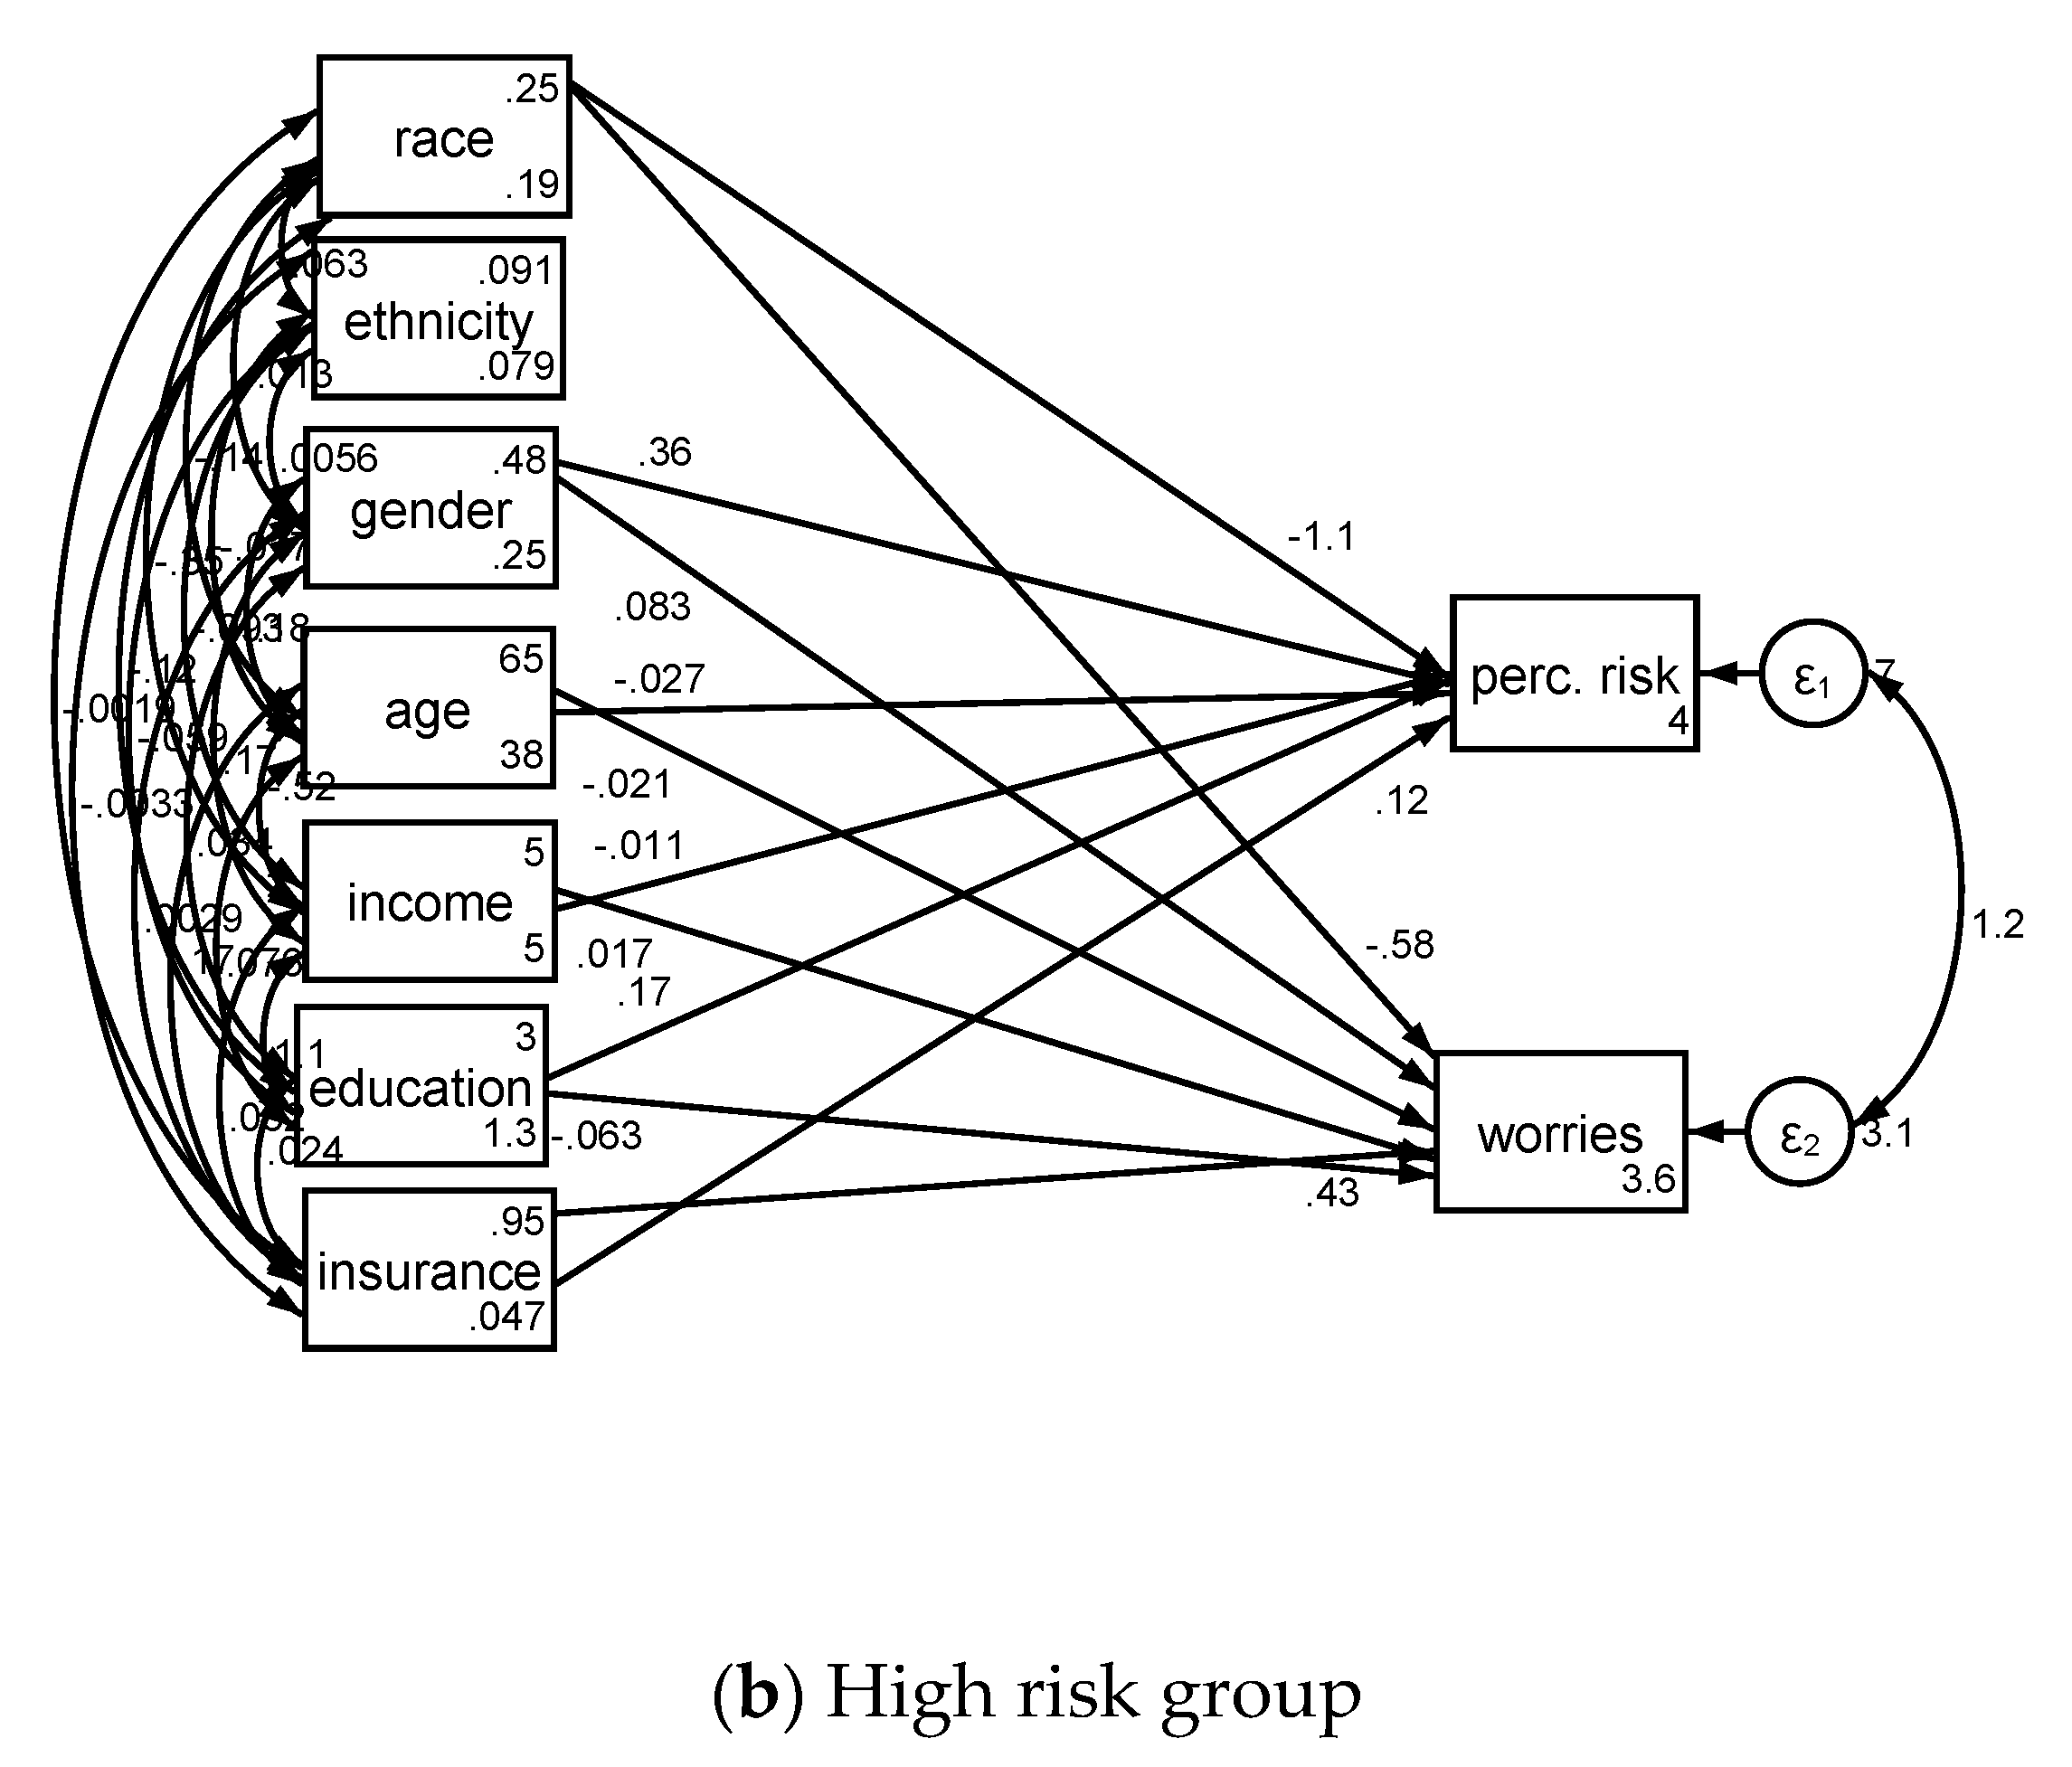
| Low Risk Group (n = 1734) | High Risk Group (n = 543) | ||||||||
|---|---|---|---|---|---|---|---|---|---|
| B (SE) | 95% CI | z | p | B (SE) | 95% CI | z | p | ||
| Race (Blacks) | Cancer perceived risk | −0.91 (0.24) | −1.38–0.44 | −3.79 | <0.001 | −1.13 (0.34) | −1.80–0.46 | −3.29 | 0.001 |
| Gender (Male) | Cancer perceived risk | −0.07 (0.12) | −0.29–0.16 | −0.57 | 0.568 | 0.36 (0.21) | −0.05–0.77 | 1.70 | 0.089 |
| Age | Cancer perceived risk | −0.02 (0.00) | −0.03–0.01 | −6.02 | <0.001 | −0.03 (0.02) | −0.06–0.01 | −1.65 | 0.099 |
| Income | Cancer perceived risk | 0.13 (0.04) | 0.06–0.20 | 3.66 | <0.001 | −0.01 (0.06) | −0.13–0.11 | −0.18 | 0.855 |
| Education | Cancer perceived risk | −0.02 (0.06) | −0.14–0.09 | −0.39 | 0.694 | 0.17 (0.10) | −0.03–0.37 | 1.64 | 0.101 |
| Health Insurance | Cancer perceived risk | 0.67 (0.21) | 0.25–1.10 | 3.15 | 0.002 | 0.12 (0.47) | −0.81–1.05 | 0.25 | 0.800 |
| Intercept | Cancer perceived risk | 2.85 (0.38) | 2.11–3.60 | 7.48 | <0.001 | 3.99 (1.18) | 1.68–6.30 | 3.39 | 0.001 |
| Race (Blacks) | Cancer worries | −0.42 (0.18) | −0.77–0.07 | −2.35 | 0.019 | −0.58 (0.22) | −1.01–0.16 | −2.67 | 0.008 |
| Gender (Male) | Cancer worries | −0.24 (0.10) | −0.44–0.05 | −2.41 | 0.016 | 0.08 (0.14) | −0.19–0.36 | 0.59 | 0.553 |
| Age | Cancer worries | −0.02 (0.00) | −0.03–0.02 | −6.65 | <0.001 | −0.02 (0.01) | −0.04–0.00 | −1.89 | 0.058 |
| Income | Cancer worries | 0.07 (0.03) | 0.01–0.13 | 2.33 | 0.020 | 0.02 (0.04) | −0.06–0.09 | 0.43 | 0.668 |
| Education | Cancer worries | −0.07 (0.05) | −0.17–0.03 | −1.40 | 0.161 | −0.06 (0.07) | −0.20–0.07 | −0.90 | 0.367 |
| Health Insurance | Cancer worries | 0.45 (0.18) | 0.10–0.81 | 2.49 | 0.013 | 0.43 (0.31) | −0.18–1.05 | 1.38 | 0.168 |
| Intercept | Cancer worries | 3.03 (0.33) | 2.37–3.69 | 9.04 | <0.001 | 3.58 (0.78) | 2.05–5.11 | 4.58 | <0.001 |
© 2018 by the authors. Licensee MDPI, Basel, Switzerland. This article is an open access article distributed under the terms and conditions of the Creative Commons Attribution (CC BY) license (http://creativecommons.org/licenses/by/4.0/).
Share and Cite
Chalian, H.; Khoshpouri, P.; Assari, S. Demographic, Social, and Behavioral Determinants of Lung Cancer Perceived Risk and Worries in a National Sample of American Adults; Does Lung Cancer Risk Matter? Medicina 2018, 54, 97. https://doi.org/10.3390/medicina54060097
Chalian H, Khoshpouri P, Assari S. Demographic, Social, and Behavioral Determinants of Lung Cancer Perceived Risk and Worries in a National Sample of American Adults; Does Lung Cancer Risk Matter? Medicina. 2018; 54(6):97. https://doi.org/10.3390/medicina54060097
Chicago/Turabian StyleChalian, Hamid, Pegah Khoshpouri, and Shervin Assari. 2018. "Demographic, Social, and Behavioral Determinants of Lung Cancer Perceived Risk and Worries in a National Sample of American Adults; Does Lung Cancer Risk Matter?" Medicina 54, no. 6: 97. https://doi.org/10.3390/medicina54060097
APA StyleChalian, H., Khoshpouri, P., & Assari, S. (2018). Demographic, Social, and Behavioral Determinants of Lung Cancer Perceived Risk and Worries in a National Sample of American Adults; Does Lung Cancer Risk Matter? Medicina, 54(6), 97. https://doi.org/10.3390/medicina54060097