1. Introduction
Despite the absence of definitive scientific evidence, induction chemotherapy (ICT) for locally advanced squamous cell carcinoma of the head and neck (LA-SCCHN) is often used in clinical practice [
1]. Up to 80–90% of patients with LA-SCCHN respond to cisplatin-based ICT and 20–40% of them achieve complete response (CR) [
2]. Although several studies reported no benefit of ICT in terms of survival [
2,
3,
4], it has a role in selected cases if there is likely to be a delay between diagnosis and starting definitive chemoradiotherapy (CRT) and in organ preservation strategies [
5].
The current guidelines suggest that pre-ICT primary site and nodal gross tumor volumes (GTV) should be used for radiotherapy (RT) planning in cases when ICT is given [
6,
7,
8]. However, possible superiority of post-ICT over pre-ICT GTV is now under investigation [
9,
10]. The potential advantages of using post-ICT imaging for target volume delineation include the reduction of GTV due to tumor shrinkage and the possibility to spare normal tissues. However, it bears a potential risk of missing partial tumor volume and, in some cases, difficulties in GTV delineation due to metabolic switch [
9,
11].
Contrast-enhanced computed tomography and/or magnetic resonance imaging are the standard methods for evaluating tumor response to ICT, and are mostly used for GTV delineation in LA-SCCHN. Recent studies report an emerging role of positron emission tomography (PET) with 18Fluorine-labeled 2-fluoro-2-deoxyglucose integrated with computed tomography (18F-FDG PET/CT) in RT planning for head and neck cancers due to the added biological tumor information. However, there is a lack of knowledge regarding whether the use of 18F-FDG PET/CT based post-ICT GTV delineation in RT planning is a feasible approach.
Furthermore, earlier clinical studies demonstrated, that some parameters of
18F-FDG PET/CT may predict the tumor chemosensitivity and LA-SCCHN patient survival [
12,
13,
14]. Such
18F-FDG PET/CT parameters as maximum standard uptake value (SUV
max), metabolic tumor volume (MTV) and total lesion glycolysis (TLG) have been shown to correlate with LA-SCCHN patient outcome [
15,
16,
17]. However, the prognostic value of the percentage decrease of these FDG uptake parameters from baseline to post-ICT is unknown.
The aims of our prospective phase II study were:
To evaluate the feasibility of 18F-FDG PET/CT-based post-ICT GTV delineation strategy for LA-SCCHN RT planning by analyzing patterns of local and/or nodal disease failure after CRT and assessing progression free survival (PFS) overall survival (OS) and treatment safety;
To assess the correlation of post-ICT percentage decrease of three metabolic18F-FDG PET/CT parameters SUVmax, MTV and TLG in primary tumor and metastatic nodes with the radiological response to ICT, PFS and OS.
2. Material and Methods
2.1. Study Design and Patient Selection
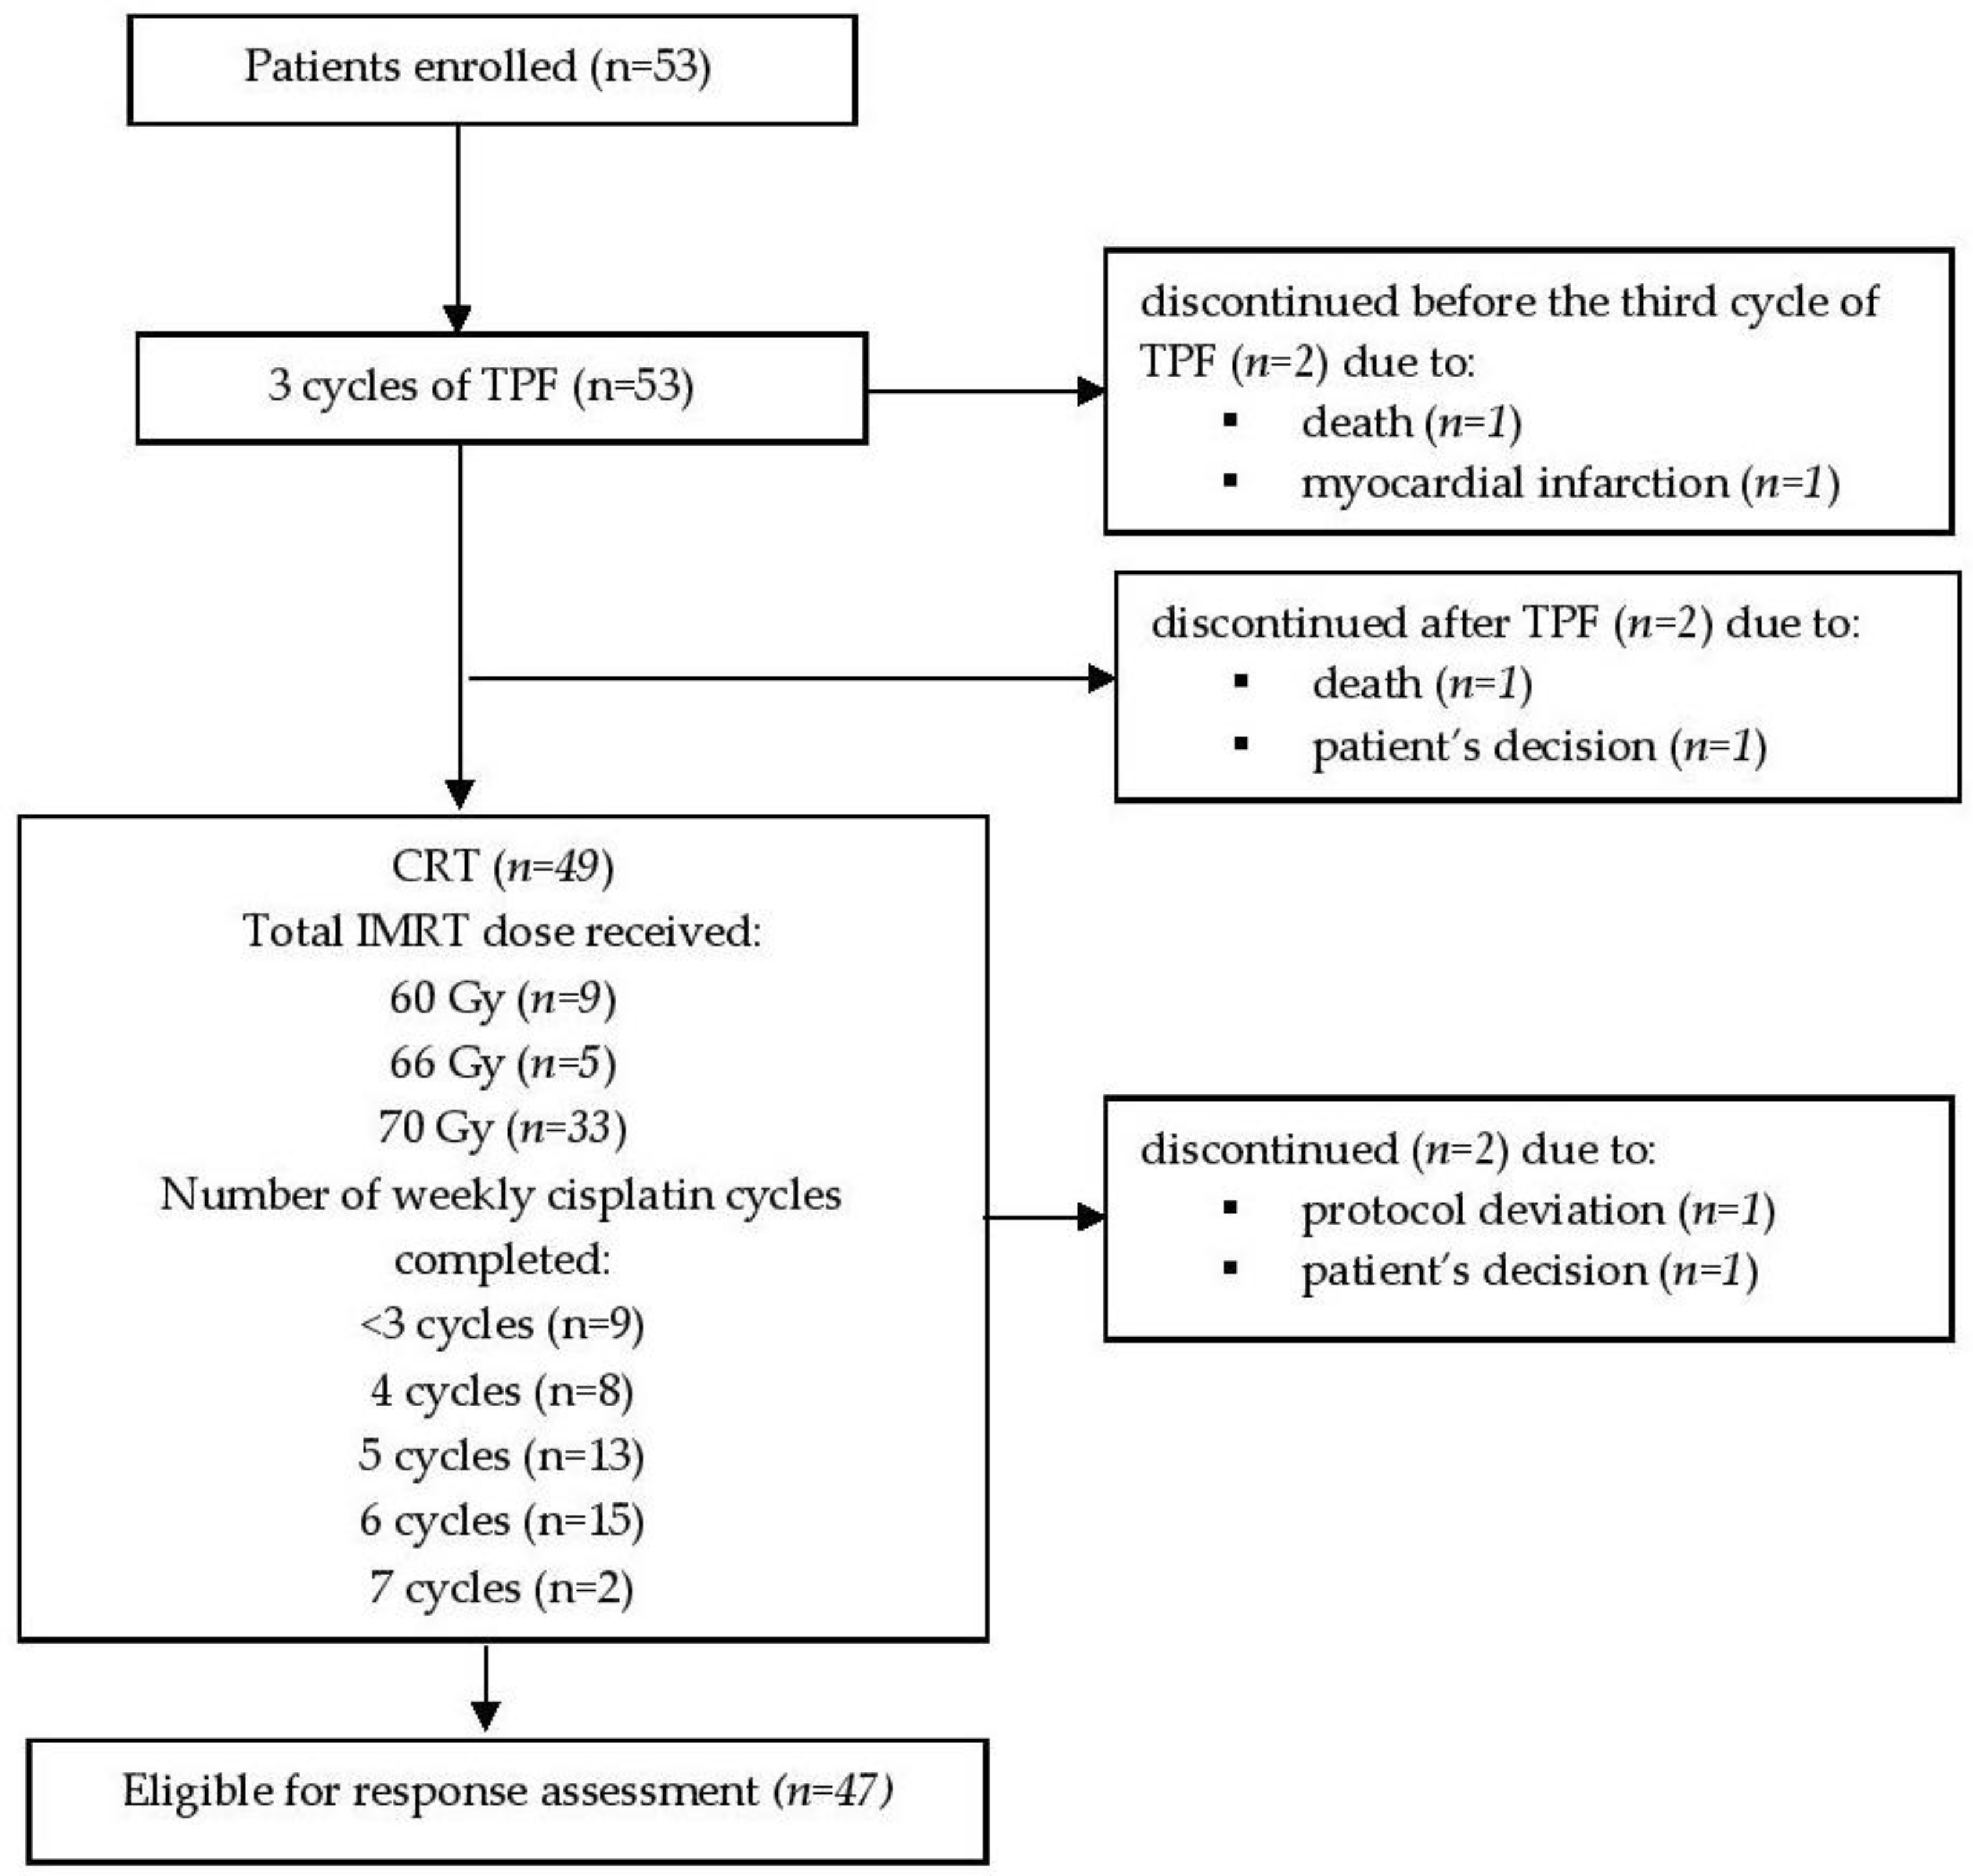
Between September 2013 and January 2016, patients affected by LA-SCCHN were enrolled in this phase 2 prospective cohort study. All subjects signed the informed consent form. The study was conducted in accordance with the Declaration of Helsinki, and the protocol was approved by the Kaunas Regional Ethics Committee for Biomedical Research (No. BE-2-51; 5 November 2013) and was registered at
www.clinicaltrials.gov (identification no. NCT02047201). All patients have been validated by the multidisciplinary team for ICT followed by CRT. The eligibility criteria were as follows: histologically confirmed locally advanced (stage III and IV) head and neck squamous cell carcinoma, Eastern Cooperative Oncology Group performance status (ECOG) 0 or 1, signed written informed consent. Patients with a known history of another cancer or suspected metastatic lesions were excluded.
2.2. Induction Chemotherapy Delivery and Evaluation of Response to ICT
Patients received three cycles of docetaxel, cisplatin, and 5-FU (TPF) ICT consisting of docetaxel (75 mg/m
2) and cisplatin (75 mg/m
2) administered as a 1-h infusion on a day 1 and 5-fluorouracil (5-FU) (750 mg/m
2) administered by continuous infusion on days 1–5 [
18]. Cycles were administered every 3-weeks. The reductions of the docetaxel, cisplatin and 5-FU doses were planned depending on the individual treatment tolerance and toxicity.
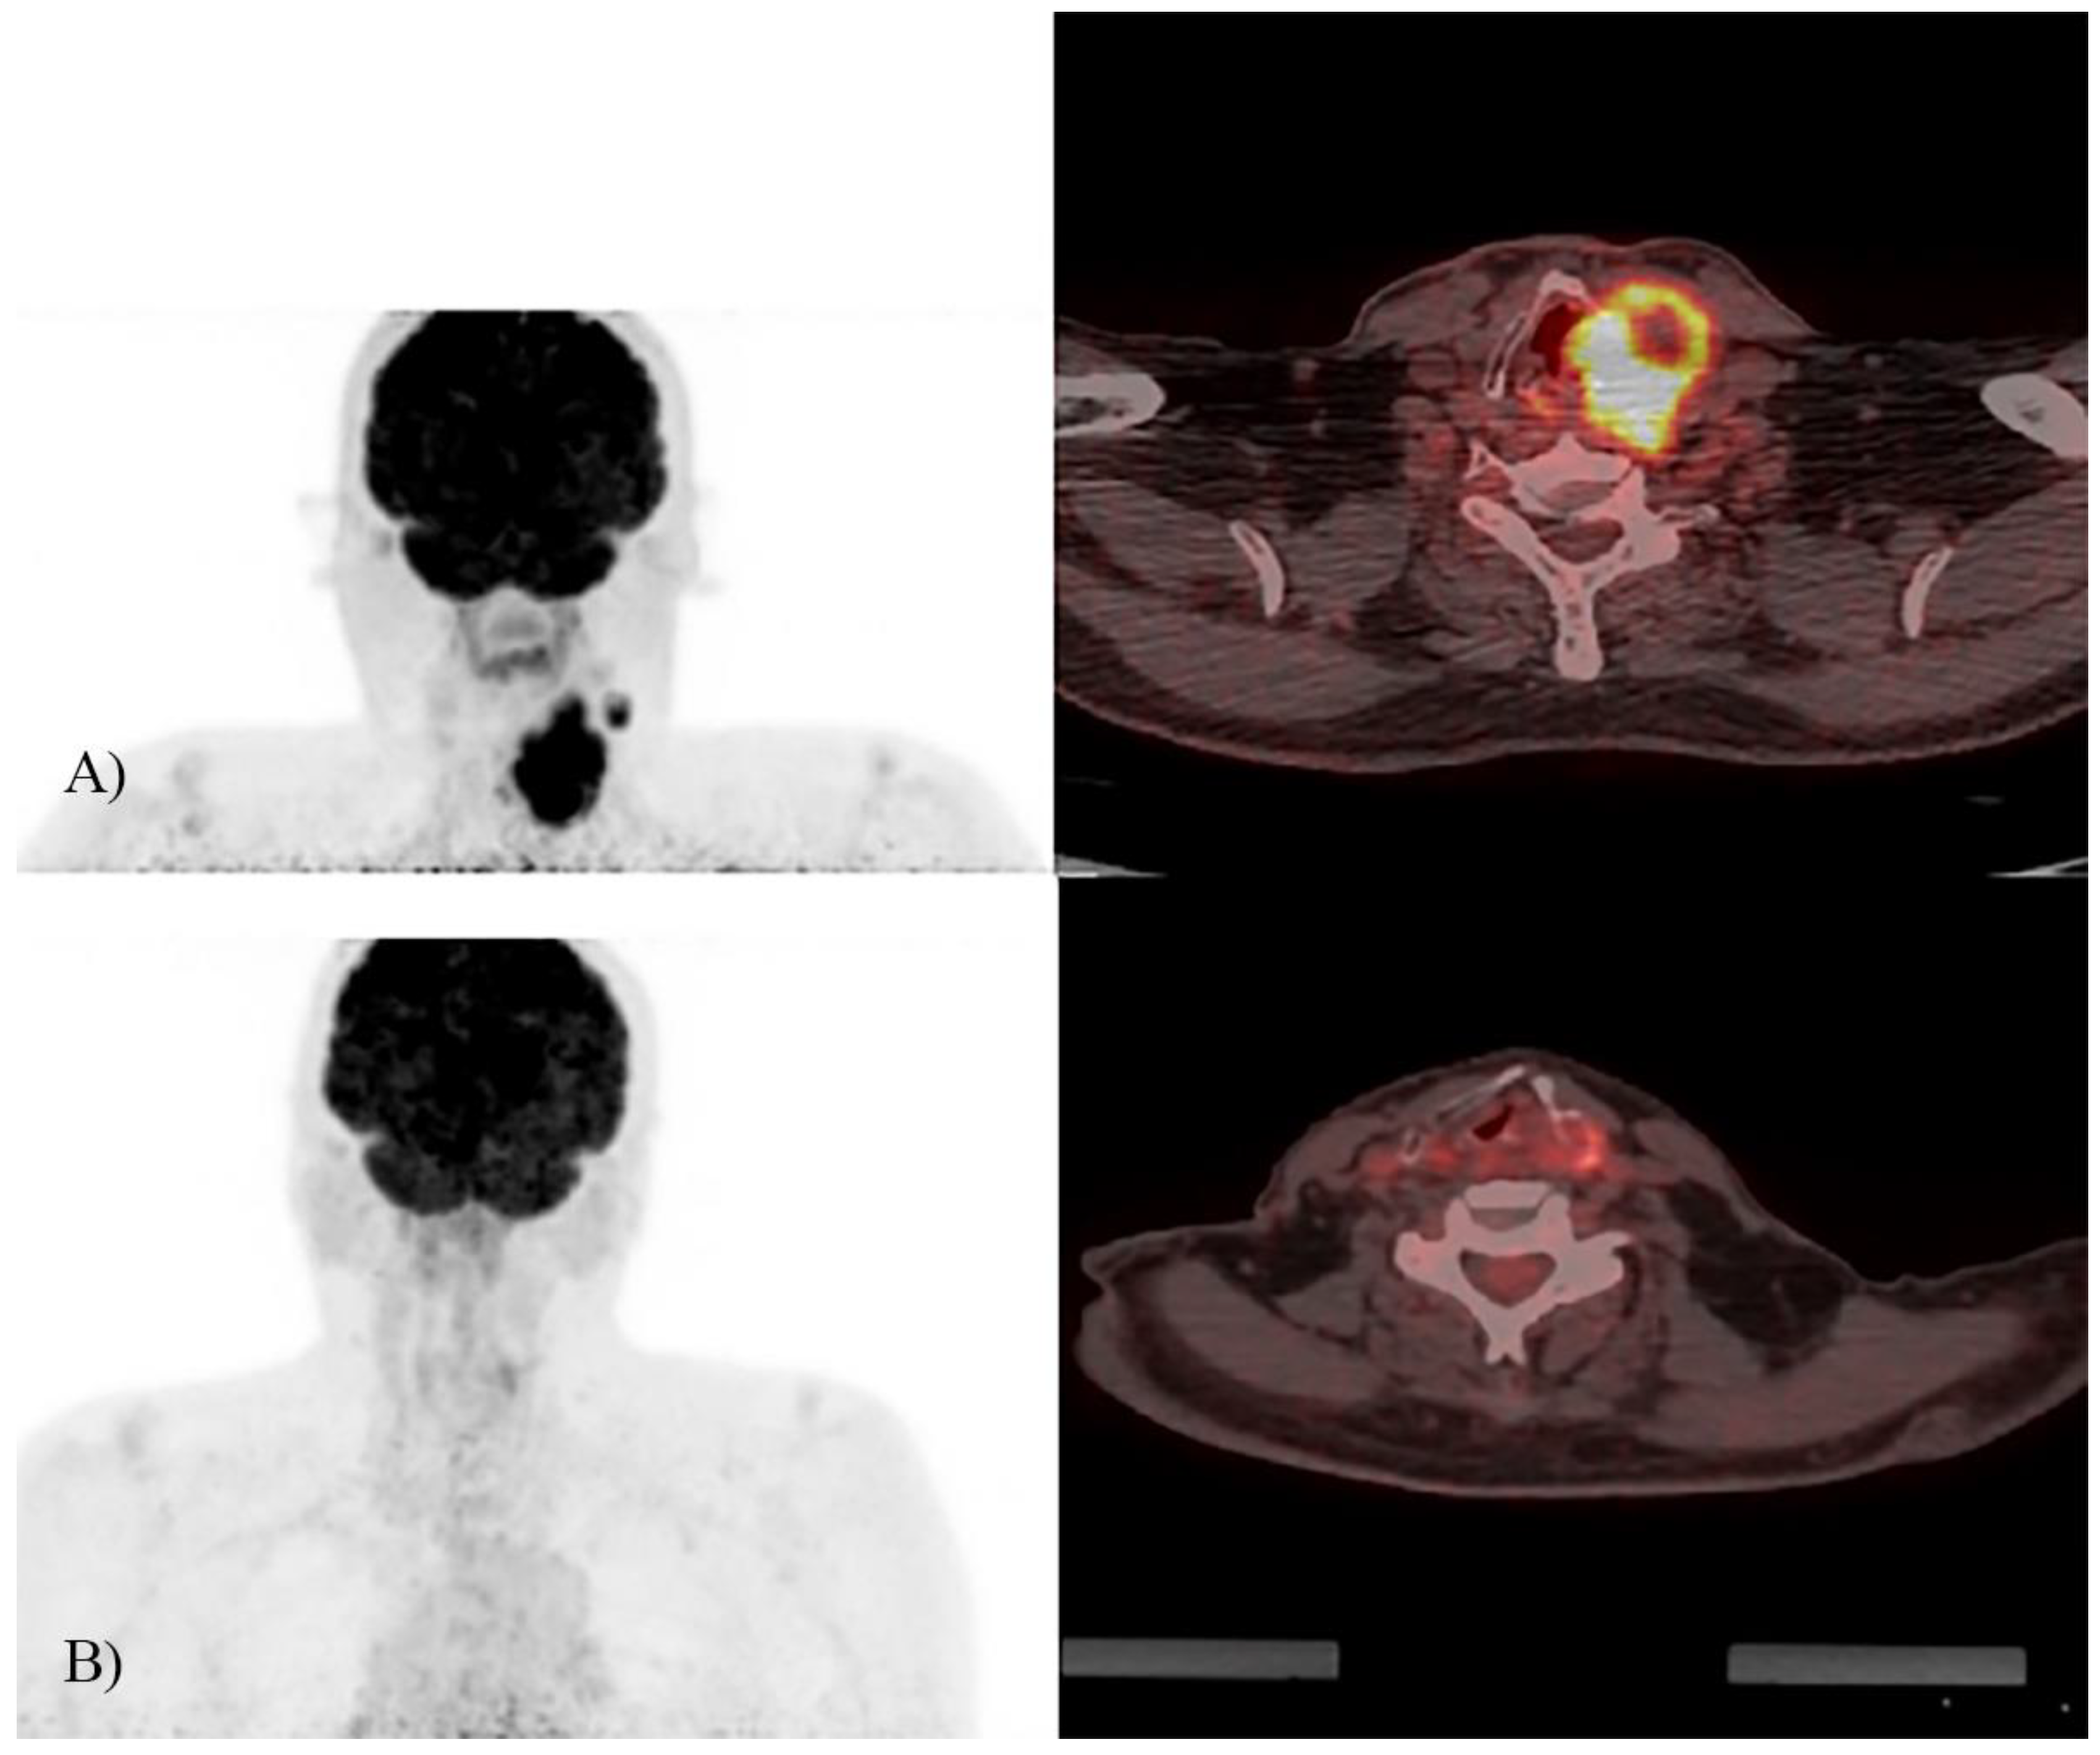
According to post-ICT
18F-FDG PET, patients were classified into: ICT-responders—patients with ≥50% visual tumor volume reduction, and ICT-non-responders—<50% reduction [
19,
20].
2.3. 18F-FDG PET/CT Examination and Gross Tumor Volume Delineation
Two
18F-FDG PET/CT examinations were performed for each patient, both consisting of whole-body scan and localized high-resolution head and neck scan. The first imaging was accomplished prior ICT during initial staging, another one occurred 14 ± 2 days after the last cycle of ICT for therapeutic evaluation and CRT planning [
7,
11,
13]. Patient’s preparation for the scan included a low carbohydrate diet for at least 24 h prior the scan and fasting for more than 6 h. Serum glucose level was measured on the day of the scan and aimed to be <7 mmol/L. The injected activity of
18F-FDG was 4 MBq/kg of body weight. After injection patients remained in a quiet room for approximately 60 min. A whole-body PET/CT scan was acquired from the skull base to the mid-thigh with the patient’s hands above the head. The examination was started with low-dose CT (120 kV, 100 mA, 3.75 mm section thickness) followed by PET acquisition (3 min per bed position). Localized high resolution head and neck PET/CT scan was acquired with the patient positioned with arms along the body. PET acquisition allowed 5 min per bed position. In addition, post-ICT head and neck scan was performed while patients were positioned on a radiation therapy planning table in intensity modulated radiation therapy (IMRT) treatment position with the five-point fixation thermoplastic mask. All
18F-FDGPET/CT studies were performed on GE Discovery XCT (General Electric Healthcare system, United States of America) scanner. All PET/CT images were reconstructed with the ordered subset expectation maximization (OSEM) iterative algorithm using scatter correction with the 5 mm Gaussian filter on 128 × 128 and 256 × 256 matrixes.
All acquired data was transferred to radiotherapy treatment planning system Eclipse (version v8.6) and registered by aligning the centers of the datasets. Planning CT was rigidly co-registered with post-ICT 18F-FDGPET/CT for delineation of treatment volumes. The gross tumor volume GTV70 and gross nodal volume GTV60 were manually contoured using a visual interpretation technique on post-ICT PET images by radiation oncologist in collaboration with an experienced nuclear medicine physician. Clinical target volumes (CTV) of primary tumor CTV70 obtained by adding 5 mm margin to GTV70. CTV60 involved GTV70 and GTV60 plus 5 mm margin. The elective CTV (CTV50) included CTV70, CTV60 and bilateral elective lymph nodes. The margin of 3 mm was added for each CTV to create the planning target volumes (PTV) PTV70, PTV60 and PTV50 (during RT delivery daily cone-beam CT (CBCT) for image guidance was used). For high-risk volumes PTV70 and PTV60 the prescribed doses were 70 Gy and 60 Gy respectively, for PTV50—50 Gy.
Three metabolic parameters (SUVmax, MTV and TLG) were measured in pre-ICT and post-ICT 18F-FDGPET/CT scans for both primary tumor and metastatic regional lymphnodes. Around every suspicious lesion, the isocontour region of interest centered on the maximum value pixel was drawn automatically by workstation tools (Metavol software v. 1.4.) generating SUVmax and mean SUV (SUVmean) of the region. Metabolic tumor volume was drawn manually contouring margin of every lesion and then segmented semi-automatically in three dimensions. MTV was defined as the summed volume in cubic centimeters (cm3). TLG was calculated as the product of MTV and SUVmean.
2.4. Chemoradiotherapy
CRT consisted of cisplatin 40 mg/m² weekly concomitant with conventionally fractionated RT (2 Gy per once-daily fraction, 5 days a week until the total prescribed dose of 70 Gy will be collected) [
21,
22]. The cisplatin dose was individually modified according to the level of hematologic toxicity, hepatic and renal function and the infectious diseases. Non-completion of prescribed radiotherapy dose was related to individual patient tolerance.
2.5. End Points
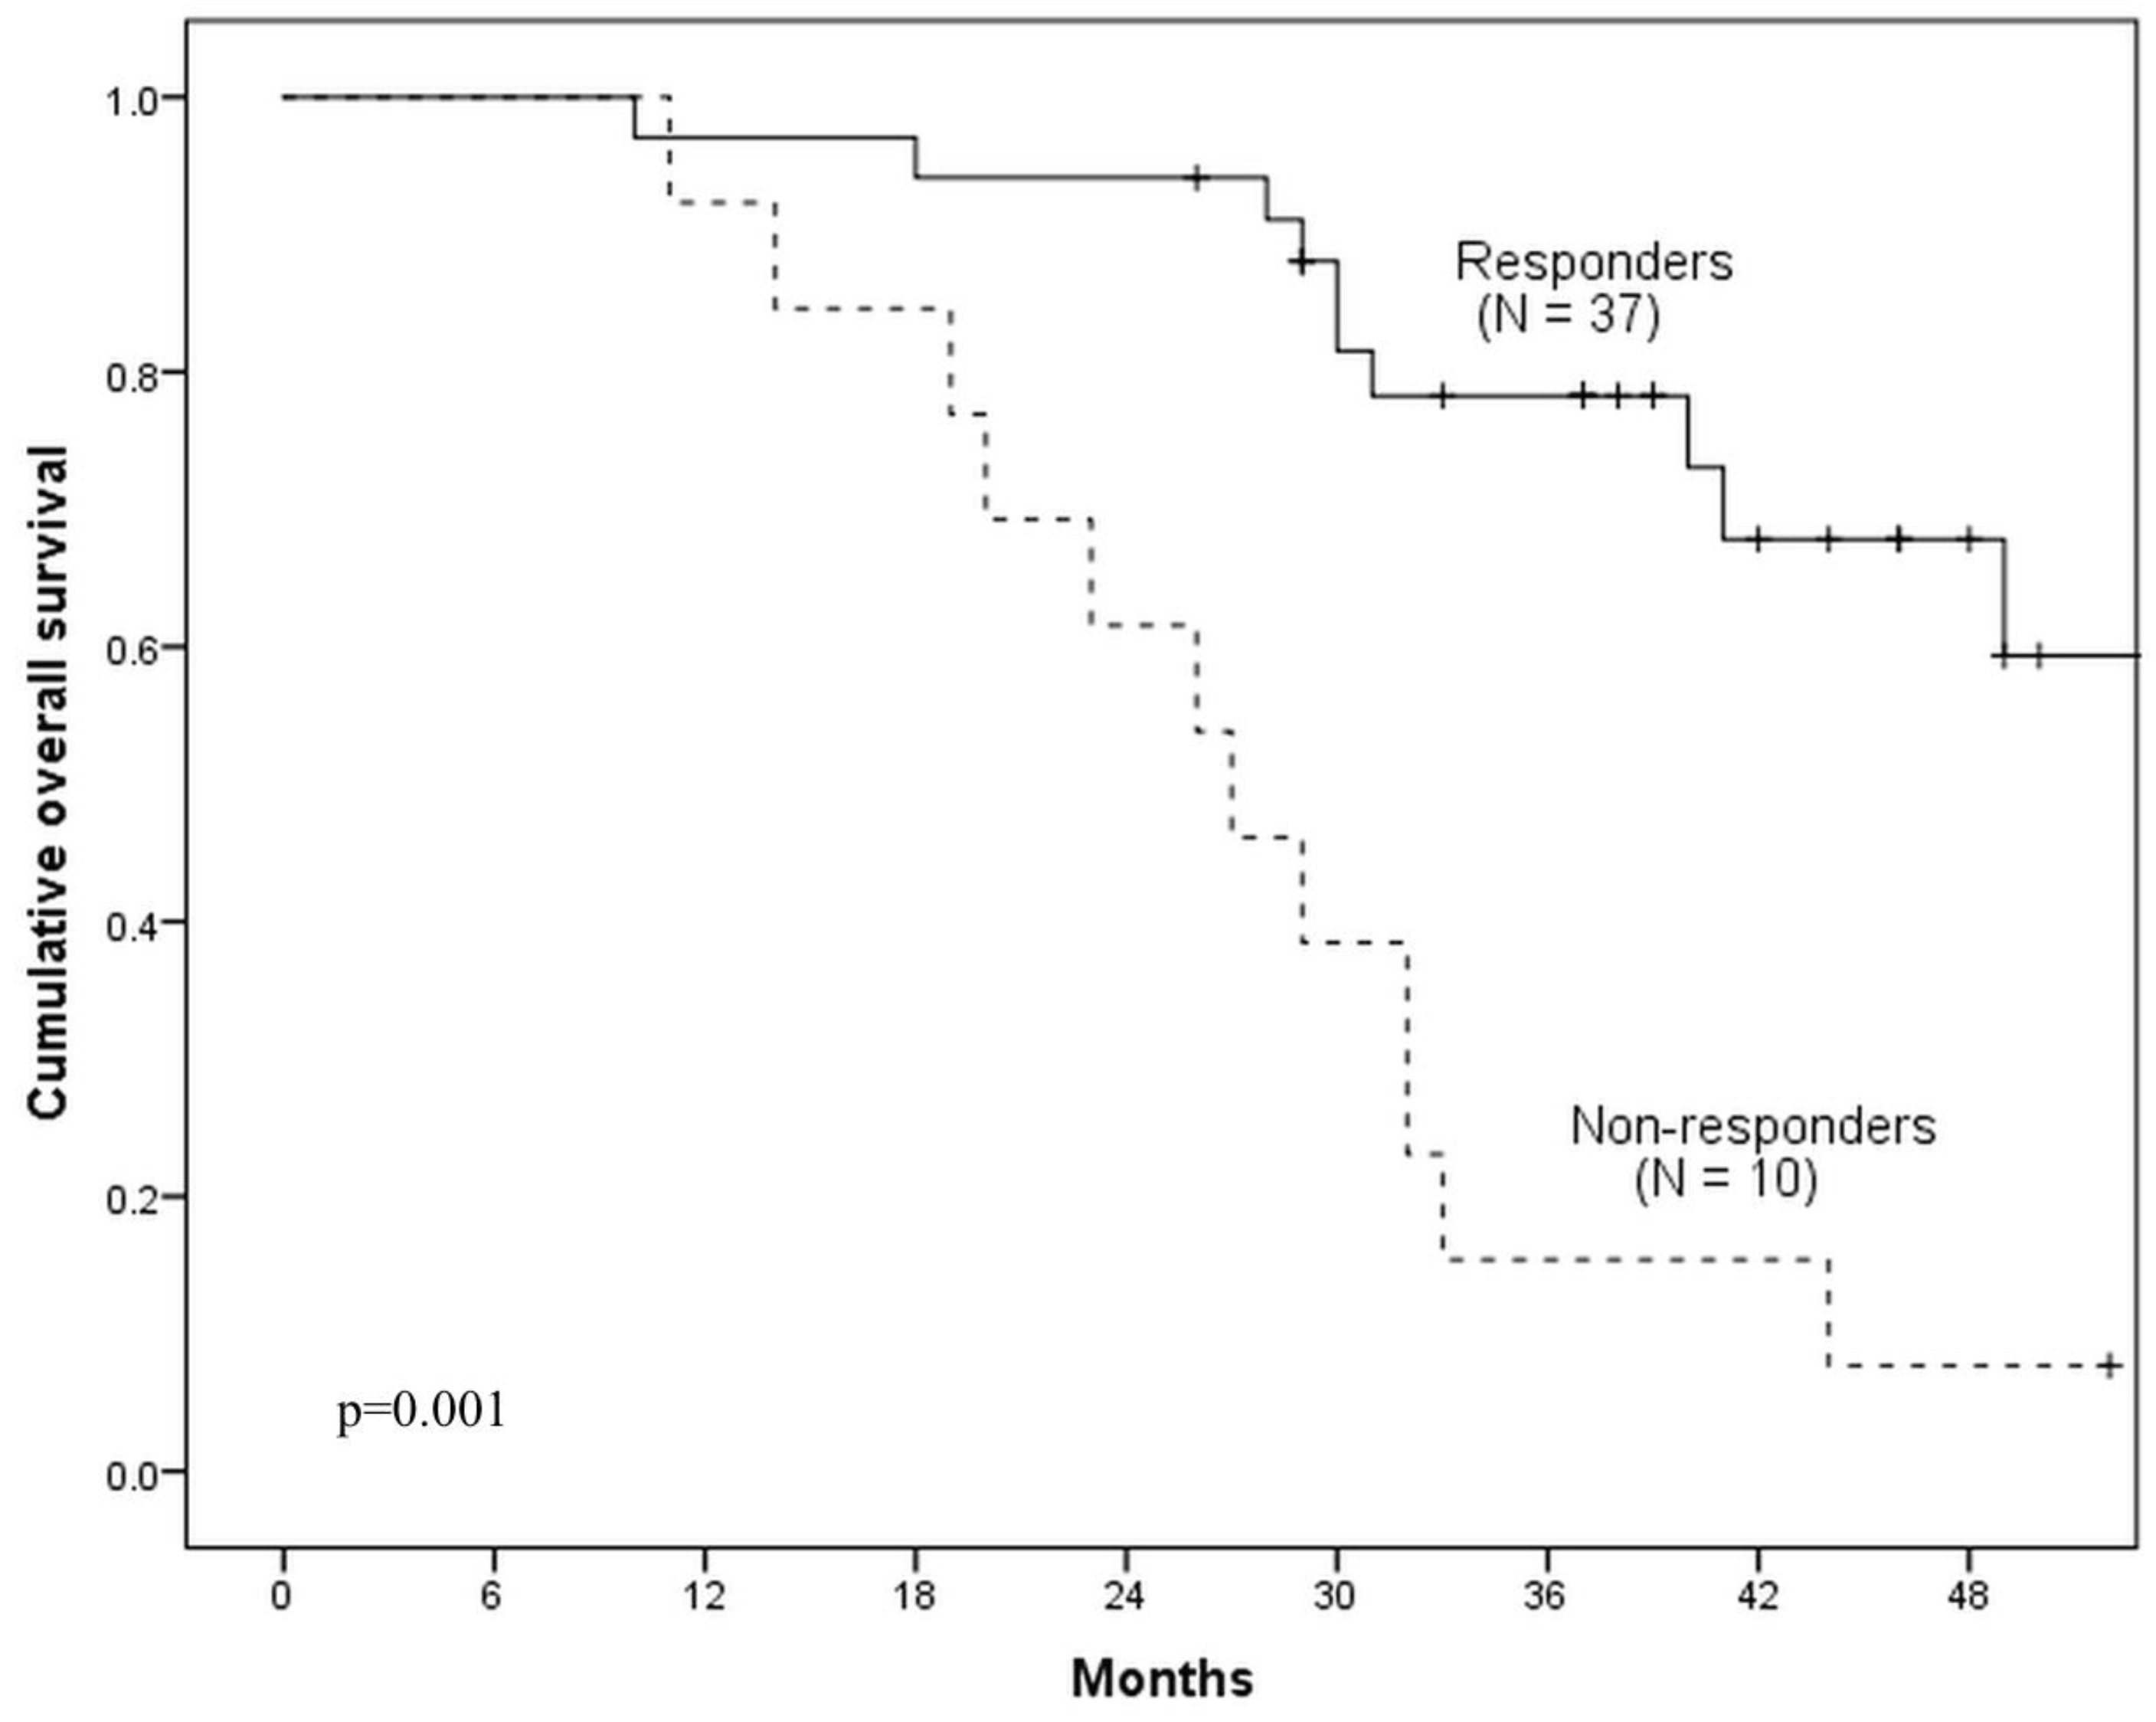
PFS and OS were used as the clinical endpoints to evaluate the feasibility of 18F-FDG PET/CT-based post-ICT GTV delineation and the prognostic value of the 18F-FDG PET metabolic parameters. PFS was defined as the time from day 1 of the ICT first cycle until disease progression or death from any reason. OS was defined as the period from day 1 of the ICT first cycle until death from any reason. Furthermore, to evaluate the safety of new target volume delineation technique, treatment toxicity during ICT and CRT was evaluated on a weekly basis according to the National Cancer Institute Common Toxicity Criteria (NCI CTCAE) v.4.0. Late adverse events related with RT were assessed every three months after CRT using RTOG (Radiation Therapy Oncology Group)/EORT (European Organization for Research and Treatment of Cancer) toxicity criteria.
2.6. Analysis of Loco-Regional Failure Patterns
Diagnostic CT or PET/CT documenting recurrence was co-registered with planning CT and pre-ICT PET/CT using rigid image registration technique. Alternative IMRT treatment plans basing on pre-ICT PET/CT were also created to investigate the relationship between failure site and primary PET/CT visual tumor volume. Loco-regional failures were classified depending on the percentage volume which received in total 95% of the prescribed dose: failures were classified as “in-field” (>95%), “marginal” (≥20%; ≤95%) and “out-field” (<20%) [
23,
24]. Mean, minimum and maximum dose and D95 to the failure volume were estimated.
2.7. Statistics
Means of pre-ICT, post-ICT and the percentage decrease of SUVmax, MTV and TLG were compared between ICT-responder versus ICT-non-responder groups using Student’s t-test. ROC curve analysis was applied to identify the best discriminating cut-off values for SUVmax, MTV, and TLG to predict PFS and OS. Appropriate cut-off was defined as the point on the curve nearest to the upper left corner of the receiver operating characteristics (ROC) graph. The area under the curve (AUC) was used to evaluate the accuracy of the metabolic parameters as a prognostic factor. The Kaplan—Meier method was applied to estimate PFS and OS. The Cox regression model was applied for the estimation of the hazard ratio (HR); and for the multivariate analysis using a forward selection. Log-rank test (Mantel–Cox) was used to compare survival distributions. All tests were two-sided, and the significance threshold was set at p < 0.05. All statistical analyses were performed using IBM SPSS 22.0 (Statistical Package for Social Sciences 22.0 for Windows) statistical software.
4. Discussion
Our study is the first to investigate the feasibility of target volume delineation based on post-ICT
18F-FDG PET/CT images for LA-SCCHN IMRT planning. The rationale for this approach is the potential reduction of GTV after ICT leading to mitigation of RT toxicities by sparing normal tissues. Several authors in their publications have discussed post-ICT imaging-based target volume delineation strategy [
6,
8,
9,
25]. However, due to the lack of supportive data they still recommend the use of pre-induction primary tumour and nodal GTVs but further clinical research is needed.
Survival data from our study cannot be directly compared with the results of other authors because there are no completed clinical trials analysing post-ICT PET/CT based RT planning. For indirect comparison patients’ outcomes of several clinical studies, where ICT plus CRT approach was used for LA-SCCHN treatment are presented in
Table 9. One of the earliest published studies analysing LA-SCCHN patients treated with ICT (TPF) plus CRT was TAX-324 [
26]. In this study 3-year PFS and OS rates were 50% and 62% respectively. In the PARADIGM study published by Haddad et al., patients in ICT arm received 3 cycles of TPF plus CRT with weekly carboplatin, 67% of patients were progress free and 73% were alive in 3 years after treatment [
4]. Takacsi-Nagy et al. in phase II clinical trial involving 66 LA-SCCHN patients demonstrated that after 2 cycles of TPF followed by CRT (total dose of 70 Gy in 7 weeks with 3 concurrent cycles of cisplatin on days 1, 22 and 43 of radiotherapy) 3-year PFS rate was 41% and OS rate - 43% [
27]. Ghi et al. analysed 208 patients randomised for either CRT with cisplatin (n = 129) or radiotherapy with cetuximab (n = 79) after initial 3 cycles of TPF [
28]. 3-year PFS and OS rates were 47% and 57.5% respectively. In our study, involving 47 patients treated with 3 cycles of TPF plus CRT (70 Gy in 7 weeks with weekly cisplatin 40 mg/m2), we demonstrated 3-year PFS rates of 67% and 3-year OS rates of 61%. Summarizing the data, 3-year PFS and OS rates in our study were non-inferior comparing to survival results in studies with the standard treatment approach.
According to the survival data presented above, we suggest that 18F-FDG PET/CT scan obtained after TPF-based ICT might be used for LA-SCCHN IMRT planning. Loco-regional failure analysis also supports this approach. In our study 15 patients (31.9%) developed loco-regional disease progression with a total of 32 progressive lesions. 8 lesions were in the primary tumor site and 24 in the regional lymphnode sites. 90.6% of progresses were in-field with highest levels localized in high-to-intermediate risk volumes GTV70 (87.5%) and CTV60 (87.5%) and none in PTV50 volume. For comparison, De Felice et al. presented the retrospective analysis of 56 patients who were diagnosed with loco-regional progress of LA-SCCHN after ICT plus CRT [
23]. In total 68 sites of progression were analyzed, of them 35 were in primary tumor site and 33 in regional nodes. 95.6% of progressive lesions were in-field, 82.9% in high-dose primary tumor CTV (GTV + 10 mm), and 72.7% in nodal high-dose CTV. Similar results were demonstrated by Bayman et al. [
29]. This study involved 136 patients with carcinoma of the head and neck. 29 (21%) patients were treated with ICT plus CRT. 16 (12%) of patients progressed, all in high-dose regions. The main difference between the studies mentioned above and our study is GTV to CTV margin. In both earlier studies CTV was defined as GTV plus 10 mm margin and PTV–CTV plus 4 mm. In our study smaller 5 mm GTV to CTV margin and 3 mm CTV to PTV margin (accounting for daily CBCT image guidance) was used. We want to point-out that despite the smaller margins, results of loco-regional control were similar to previous studies, therefore we suggest that 5 mm CTV and 3 mm PTV margins (with daily CBCT image guidance) might be considered for
18F-FDG PET/CT based IMRT planning after ICT for LA-SCCHN patients.
In recent years several authors demonstrated a prognostic value of
18F-FDG PET/CT metabolic parameters in LA-SCCHN [
15,
16,
30,
31,
32]. In publication by Paidpally et al. SUV
max, MTV and TLG were proposed as non-invasive prognostic factors usable in management of LA-SCCHN [
30]. These parameters might be used for disease response evaluation, RT planning and follow-up. David et al. analyzed 74 LA-SCCHN patients with N2 or N3 nodal status [
15]. SUV
max, SUV
peak (mean SUV within a 1-cm sphere centered on SUV
max) of the primary tumor and LN were evaluated before and after treatment. Neither initial nor post-treatment SUV
max and SUV
peak were associated with disease outcome. Choosing the different approach and analyzing the dynamics of SUV
max (percentage decrease of the value after ICT) on patient survival, we provide new evidence that the decrease of primary tumor SUV
max by at least 74% and LN SUV
max by 68–69% may be used as independent LA-SCCHN prognostic factors. However, our results contradict the results of Yu et al., who did not find an association between SUV
max percentage decrease and LA-SCCHN patient survival [
16].
Few authors also investigated the prognostic value of MTV and TLG. In the study of David et al., pre-treatment MTV value was linked with PFS and OS [
15]. Yu et al. found that post-ICT MTV percentage decrease by more than 42% and TLG by more than 55% significantly prolonged event-free survival [
16]. In our study it was found that larger percentage decrease of MTV and TLG in primary tumor and TLG in regional LN correlate with better 3-year PFS and OS rates, however different cut-off points were established. MTV percentage decrease cut-off point for PFS prediction was 68%, for OS 69%. Only primary tumor MTV decrease was significantly associated with disease outcome. As for TLG better PFS was observed in patients with ≥76% primary tumor TLG decrease and ≥74% nodal TLG decrease with similar results for OS ≥74% and ≥73% decrease respectively.
Limitations of this study include the usage of rigid image registration technique, which was used for IMRT treatment planning and evaluation of recurrence patterns. There are no clear recommendations in the literature regarding which image registration technique should be used for LA-SCHHN IMRT planning. However, deformable registration seems to be a superior technique. Another limitation was the lack of endoscopic tumor evaluation after ICT (21 out of 47 patients refused the second examination). Due to this limitation, comparison of post-ICT residual primary tumor between PET/CT with objective endoscopic evaluation method was not possible.

 ,
, 


