Abstract
This study aimed to determine the use of selected vegetables (pumpkin, cauliflower, broccoli, carrot) as carriers of potassium iodide (KI) and potassium iodate (KIO3) by determining changes in iodine content under various conditions of impregnation as the degree of hydration, impregnated sample temperature, and impregnation time. The influence of these conditions on iodine contents in vegetables after their fortification and storage (21 °C/230 days) was analyzed. The results showed that all selected vegetables could be efficient iodine carriers. However, the conditions of the impregnation process are crucial for fortification efficiency, particularly the degree of hydration and the temperature of the impregnated samples before drying. The results showed that the lowest iodine content was in samples fortified at 4 °C and 1:4 hydration. On the other hand, the highest reproducibility of iodine was for the following fortification conditions: temperature of −76 °C and hydration of 1:1. The studies confirmed the higher stability of iodine in KIO3 form compared to KI. To increase recovery of the introduced iodine in the product after drying, using the conditioning step at 4 °C is not recommended. We recommend freezing vegetables immediately after the impregnation process
1. Introduction
Nutrient deficiencies are common in developing countries, but they are also found in developed ones [1,2]. Iodine deficiency is one of the most common nutrient deficiencies [3,4]. The crucial cause of iodine deficiency is low levels of iodine in foods [5]. The daily requirement for iodine is 150 mcg/day. Food enrichment offers significant benefits, from reducing the prevalence of nutritional deficiencies to providing benefits for societies and economies [6,7,8,9,10,11].
The possible forms of food enrichment include agricultural strategies of biofortification of plants with nutrients, such as iron, iodine, zinc, or folic acid [12]. These methods aim to enrich consumers’ diets with nutrients, including iodine, by increasing the concentration of a particular element in the edible part of the plant before harvesting [12,13,14]. Pilot studies confirm that it is possible to use iodine for the biofortification of vegetables [4,15]. The undoubted advantage of agronomic biofortification is the possibility of increasing the content of this element in plants during their natural growth [7,16]. However, biofortification with iodine can also affect the content of other minerals. These changes can be negative, as they can reduce the plant’s nutrition with other important micro- and macro-nutrients, thereby reducing the nutrient content of plant food products. Biofortification of plants with iodine is a relatively time-consuming method, requiring yield quality control at many stages of plant growth, thus generating additional costs [17].
Another method of enrichment is to introduce nutrients during the production process after harvesting the plant. This method is considered to be the most effective and cost-efficient way to prevent mineral and vitamin deficiencies, even safer than supplementation [4,18,19].
Enriching foods with iodine may be another way to eliminate iodine deficiency, usually by table salt iodization [20,21,22,23,24]. Potassium iodide and potassium iodate are sources of iodine in table salt. Table salt iodization is used as an intervention fortification in many countries, including Poland [3,23]. However, in 2006 the World Health Organisation introduced a recommendation to limit salt intake to 5 g/d as it is a risk factor for atherosclerosis and hypertension. It is, therefore, necessary to find new carriers for iodine salts [25,26,27].
Previous studies have confirmed the feasibility of applying iodine salts (KI and KIO3) to protein preparations such as collagen, soy preparations, and fiber preparations. Methods for the enrichment of protein preparations have already been developed [28,29,30,31]. Nevertheless, high protein intake is not advisable in some diets [32]. Consumers may also show little confidence in high-protein preparations, associating them with the diets of physically active people rather than as a standard part of everyday diet [33,34,35]. The application of protein preparations, especially soy, may be limited for allergy sufferers [36].
The fortification of vegetables may constitute an attractive alternative source of iodine for all groups of consumers, especially vegetarians and vegans [37,38,39,40]. The selection of plant-based products also allows for an increase in the dietary intake of fiber, for which dieticians recommend increasing daily amounts in an adult’s diet to 25–35 g [41,42].
Food fortification is a relatively simple and highly effective method of preventing and treating the most common nutrient deficiencies in the population, including iodine deficiency [6,18,43]. Economically and politically, it is quite profitable and is easily accepted by society [40,44]. It can be nationally standardized and controlled. However, it should be noted that the effectiveness of a food fortification program is measured based on the improvement of the nutritional and health status of the target population [6,45]. This result can be achieved, among other things, by identifying the critical points of the adopted fortification stages [46,47]. Therefore, when designing a food fortification program, it is necessary to identify the optimum impregnation conditions related to the choice of the nutrient form, matrix, variable conditions of fortification, water removal as well as storage to maximize the content of the nutrient in the final product [48,49]. This will make it possible to identify the maximum shelf life for the product under specified conditions and to indicate it correctly on the label.
The stability of nutrients is related to conditions of application of the nutrient to the matrix [20,30,50,51,52]. Iodate is a strong oxidizing agent, and iodide is a reducing agent, which can lead to the initiation of redox reactions in foods. These reactions may be, in turn, associated with changes in the stability and shelf life of food ingredients [30,53,54]. Iodine is also sensitive to light and temperature [55]. During the fortification process, it is crucial to determine the optimum time and hydration [56] of the matrix to achieve even distribution and, at the same time, stability of the introduced compound during processes related to the storage or production of new food products [30,48,55]. Therefore, this study aimed to investigate the use of selected vegetables (pumpkin, cauliflower, broccoli, carrot) as carriers of potassium iodide (KI) and potassium iodate (KIO3) by determining changes in the iodine content under various conditions of impregnation with iodine compounds. It was also hypothesized that the fortification parameters affect the continued stability of the applied iodine during the storage of the enriched dried product. Our study assessed the impact of the treatment after the impregnation process. It was investigated whether a conditioning step of the fortified plant material at 4 °C was required before freeze-drying or if it was better to freeze it immediately for the process. The influence of the freezing temperature on iodine retention (−21 °C and −76 °C) was also investigated.
2. Results and Discussion
2.1. L*a*b* Color Properties
The tables containing all the color parameters data are included in Supplementary Materials Tables S1–S8. It was found that the application of iodine to the analyzed vegetables did not affect their color parameters (L*a*b*). Additionally, the application of variable impregnation conditions did not alter these parameters (Tables S1–S8). It was confirmed that regardless of the variant of the fortification process used (hydration, temperature, and time) within the same vegetables, the differences were statistically insignificant.
2.2. Iodine Content after Fortification
Results of the study confirmed the effectiveness of the application of vegetables as a matrix for iodine application. This was true for all analyzed vegetables and the forms of iodine (KI, KIO3). Figure 1, Figure 2 and Figure 3 show the iodine content (%) of enriched vegetables (pumpkin, broccoli, cauliflower, and carrot) after the drying process of samples fortified with iodine KI and KIO3 using variable parameters of fortification, i.e., temperature (4, −21, −76 °C) and time (1, 2, 6, 12 h) of conditioning, at three hydration conditions (1:1, 1:2, and 1:4, respectively).
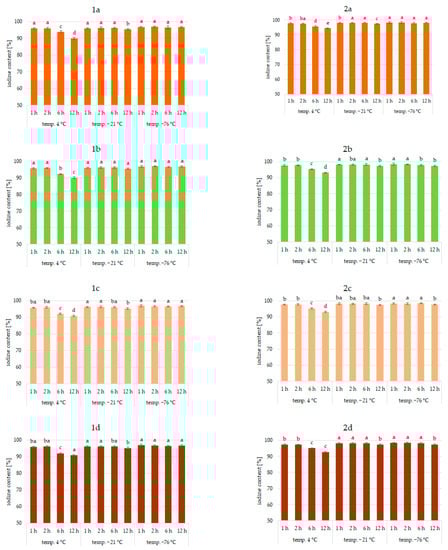
Figure 1.
Iodine content (%) in pumpkin (1a,2a), broccoli (1b,2b), cauliflower (1c,2c), and carrot (1d,2d) fortified with KI and KIO3, respectively, at hydration ratio 1:1 and different temperatures (4 °C, −21 °C, −76 °C) and times; different letters (a–e) denote a significant difference at p < 0.05 (one-way ANOVA, and post hoc Tukey test). Mean values (n = 4). Error bars are confidence intervals with a confi-dence coefficient of 0.95.
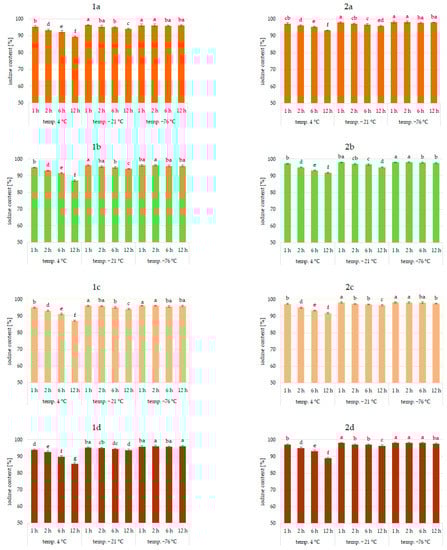
Figure 2.
Iodine content (%) in pumpkin (1a,2a), broccoli (1b,2b), cauliflower (1c,2c), and carrot (1d,2d) fortified with KI and KIO3, respectively, at hydration ratio 1:2 and different temperatures (4 °C, −21 °C, −76 °C) and times; different letters (a–g) denote a significant difference at p < 0.05 (one-way ANOVA, and post hoc Tukey test). Mean values (n = 4). Error bars are confidence intervals with a confidence coefficient of 0.95.
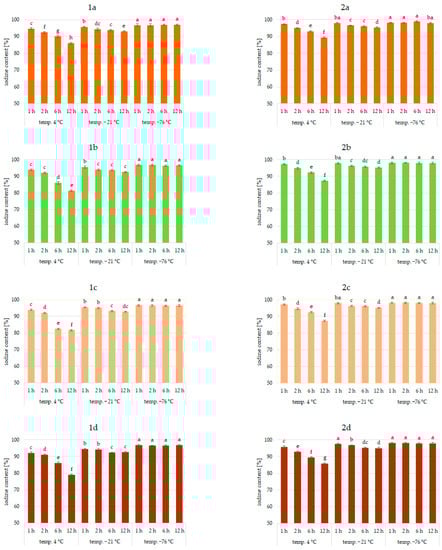
Figure 3.
Iodine content (%) in pumpkin (1a,2a), broccoli (1b,2b), cauliflower (1c,2c), and carrot (1d,2d) fortified with KI and KIO3, respectively, at hydration ratio 1:4 and different temperatures (4 °C, −21 °C, −76 °C) and times; different letters (a–h) denote a significant difference at p < 0.05 (one-way ANOVA, and post hoc Tukey test). Mean values (n = 4). Error bars are confidence intervals with a confidence coefficient of 0.95.
An analysis of iodine content (Figure 1, Figure 2 and Figure 3) showed a recovery of the introduced iodine in the product after drying to 98%. This level can be considered very high [30,57,58]. Previous data on the fortification of protein preparations confirm the maximum reproducibility of iodine in fortified matrices at a similar level. However, there was considerable variability in the results related to the variable parameters of iodine fortification.
The differences in iodine content in the range of 78–97% were confirmed, depending on the selected fortification method. The lowest iodine content (78%) was found in KI-enriched carrot samples fortified after 1:4 hydration at 4 °C for 6 h. The highest reproducibility of iodine was found when the pumpkin matrix was fortified using KIO3 at the temperature of −76 °C and 1:1 hydration conditions.
The analysis of covariance showed (Table 1) a statistically significant effect (p < 0.05) of the type of iodine compound used for fortification (KI, KIO3). However, taking all predictive factors into account (Table 1), the impregnation temperature, followed by the degree of hydration associated with iodine application, was confirmed to have a stronger effect on the final iodine content than the form of iodine.

Table 1.
Statistical significance of predictors of covariance models for changes in iodine content in selected iodine carriers during impregnation.
It was found that the total iodine content after drying the samples was most strongly correlated with the degree of hydration (r = 0.903) and the temperature of the impregnated samples (r = 0.99). This is also confirmed by previous studies [30,56,59,60]. The lowest stability of iodine was shown for samples impregnated at 4 °C. This phenomenon can be explained by the fact that the higher the temperature, the higher the rate of conversion of iodine compounds, especially potassium iodide. A higher rate of conversion of iodine compounds to free iodine is related to the lower activation energy required for this process [61]. All unfrozen water is maintained under these conditions, resulting in increased activity of the iodine compounds dissolved in a solution. In addition, in a non-frozen structure, the passage of iodine to the atmosphere through diffusion is much more efficient [62]. The lower the temperature of the samples, the lower the activity of this process [54,59,63].
The lowest iodine content (79%) was in samples impregnated with 1:4 hydration. Regardless of the impregnation temperature, the iodine content of the sample was lower by 11% compared to samples impregnated at 1:1 hydration. This fact could be attributed to the accelerating chemical reactions of KI and KIO3 with increasing water content in the system and decreasing activation energy for the conversion of iodine compounds and evaporation [59,62,64]. The highest differences (11%) were observed for samples impregnated at an impregnation temperature of 4 °C. Using an impregnation temperature of −76 °C, iodine losses at 1:2 hydration were only 4% higher on average, and at 1:1 were statistically insignificant. This fact is confirmed by the increase in activity at 4 °C.
Impregnation time was also a factor affecting iodine content (r = 0.765). However, the significance of this factor depended on the degree of hydration and even more on the impregnation temperature [30,55,60,62,65]. The use of 1:4 hydration and impregnation temperature of 4 °C yielded total iodine ranging from 78 to 97%. The lowest iodine content (78%) was in samples fortified at 4 °C for 12 h.
For an incubation temperature of −21 °C and hydration of 1:4, the content of total iodine in samples fortified for 12 h was higher by 6–7% compared to 4 °C, and for the hydration of samples of 1:2, by 6–9%. The effect of incubation time for the impregnation temperature of −76 °C was statistically insignificant. These trends concerning the effect of impregnation time are confirmed by previous studies indicating that prolonged exposure of components to adverse factors increases iodine loss [59,61,64]. Increased time at conditions of the highest potassium iodide and potassium iodate activity promotes the transition to free iodine forms and facilitates volatilization [20,57,59].
When analyzing the form of iodine, KI showed higher sensitivities to impregnation conditions, which was especially true for 1:4 hydration and a fortification temperature of 4 °C. Differences varied up to 12%. Previous studies also confirmed the higher instability of iodine in the form of KI [30,53,54]. Iodine in this form is easily sublimed and then quickly lost to the atmosphere by diffusion. The lower activation energy of this process compared to iodate transformations can explain this. Potassium iodate can be reduced by agents present in the carrier, e.g., iron ions or environmental reaction, but the process is longer. An increase in temperature and water content increased the rate of both reactions [61,64].
Significant differences in the iodine content of the samples depending on the type of vegetable were not found. The only exception was impregnation conditions of 1:4 hydration, fortification temperature of 4 °C, and an impregnation time of more than 6 h, where a significant effect of the type of enriched vegetable was found (r > 0.985). The highest losses were confirmed for samples of carrots and the lowest for pumpkin. The highest stability of iodine applied to pumpkins may be related to the higher protein content and lower pH of the product compared to carrots [66,67]. This is confirmed by previous data on the impregnation of vegetables with thiamine [42].
Principal Component Analysis (PCA)
Principal component analysis (PCA) was applied to observe possible clusters in fortified pumpkin, broccoli, cauliflower, and carrot prepared at different times, hydration degrees, and temperatures. The result of the distribution of the samples depending on the differentiating factor (time, hydration degree, and temperature) is shown in Figure 4.
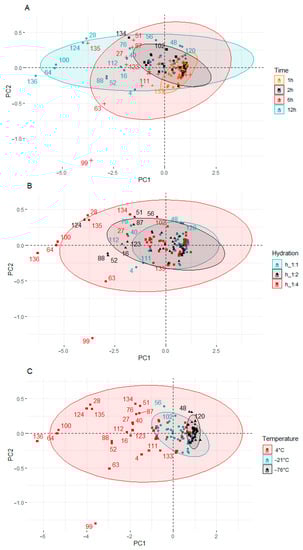
Figure 4.
Principal component analysis (PCA) of the score plot of data from KIO3 and KI content in pumpkin, broccoli, cauliflower, and carrot fortified at different times (A), hydration ratios (B), and temperatures (C).
Four clusters were found (Figure 4A) when time effect was analyzed. Samples fortified 1 and 2 h are located close to the plot center, not far from each other. The exception to this is a cauliflower sample fortified for 2 h at 4 °C and 1:4 hydration (134). This sample had the lowest content of KIO3 and KI among the samples fortified for 2 h.
In the two remaining groups, a much greater dispersion of the samples was observed. When the fortification time was 6 h, most of the samples were on the left side of the y-axis. Two outliers were also observed in this group: broccoli (63) and cauliflower (99) samples, which were fortified at 4 °C and 1:4 hydrations. Both samples were below the x-axis. The samples fortified for 12 h showed the highest dispersion. All samples in this group were distributed along the y-axis.
When analyzing hydration degree, a much larger dispersion of the samples was observed (Figure 4B) compared to the plot when the differentiating factor was time. In the first two groups (hydration 1:1 and 1:2), the dispersion scale of the samples was similar. When the hydration was 1:4, many outliers outside the group of samples located near the center of the plot could be observed. The outliers, apart from the highest hydration, were also characterized by the longest fortification time (12 h) carried out at the highest temperature (4 °C).
When the process was carried out at −76 °C, the content of KIO3 and KI was the highest, and the samples were the least diverse. This group of samples is located to the right of the y axis and at a small distance from each other. The KIO3 and KI content ranged from 2.4847 to 2.5246 (mg DM I kg−1) and from 2.4449 to 2.4786 (mg DM I kg−1), respectively. When the temperature was higher (−21 °C), the samples were still well grouped, but their dispersion was bigger. The samples were shifted to the left towards the center of the graph. In samples prepared at −21 °C, the content of KIO3 and KI was lower and ranged from 2.4280 to 2.5093 (mg DM I kg−1) and from 2.3585 to 2.4600 (mg DM I kg−1), respectively. The highest dispersion of the results was characteristic of the process carried out at the temperature of 4 °C. In this cluster, there were samples with both the highest and the lowest content of KIO3 and KI.
The factor that most influenced the diversity of the groups was the temperature of the fortification process (Figure 4C). There are three clusters in the score plot.
The PCA results showed differences between the individual vegetable samples fortified under different conditions of time, temperature, and hydration. The samples prepared under the conditions of 1 h, 1:1 hydration ratio, and temperature of −76 °C were characterized by the lowest variability and the highest KIO3 and KI content. The extension of the processing time, the increase in the degree of hydration, and the temperature were related to the decrease in the content of iodine compounds in the analyzed samples. The differentiation of the samples resulted to a greater extent from the process conditions than from the type of vegetable used.
2.3. Storage of Iodine Sources
This study showed the significant effect of the impregnation conditions on the stability of iodine during storage. The tables containing all the iodine concentration data are included in the Supplementary Materials Tables S9–S16. The experiment assumed storage at 21 °C. Analysis of the dynamics of changes in iodine content (half-life T(1/2)) based on the adopted model (Table 2) [30] showed that all variable impregnation conditions, i.e., temperature, degree of hydration, and time, significantly affected the stability of iodine in vegetable matrices. Iodine content (% relative to the amount after drying) of fortified vegetables after 230 days of storage differed, ranging from 83 to 67% (Tables S9–S16). The stability of iodine in the vegetable carriers during storage was at least as high as in protein and fiber carriers and higher than in table salt shown in previous studies [30,54,65,68].
Table 2.
Dynamic of changes in iodine content (mg kg−1) during 230 days of storage of the dried iodine fortified vegetables under various conditions (temperature, hydration, and time).
It was confirmed that the most unfavorable iodine impregnation conditions decreased iodine stability the most during sample storage (Table 2).
This was especially true for KI, for which the rate of iodine loss was faster, up to 11%, compared to KIO3. This observation is explained by the lower stability of KI and a higher rate of iodine transformation transition to free iodine during impregnation [56].
It was found that the total iodine content after the storage (230 days) of dried fortified samples was correlated most strongly with the degree of hydration (r = −0.801), especially for impregnation at 4 °C (r = −0.972). Iodine losses were the lowest for samples impregnated at −76 °C (22–24%) and highest for those impregnated at 4 °C (27–32%). The half-life values (Table 2) suggest that the lower the impregnation temperature and the degree of hydration of the vegetables, the lower the dynamics of iodine loss during dried storage. For samples fortified at −21 °C, the iodine losses were higher compared to −76 °C (by an average of 10%) and lower than at 4 °C (by about 7%).
The rate of iodine transformation during storage was the highest for samples impregnated at 1:4 hydration and 4 °C, irrespective of the form of iodine applied or matrix. For samples impregnated at the hydration degree of 1:4 and the temperature of 4 °C, the incubation time was also a relevant factor affecting losses during sample storage. Increasing the incubation time to 12 h resulted in a reduction in T(1/2) of iodine up to 20% (1:4) and 9% (1:2) during storage. At lower temperatures (−76 °C), the impregnation time did not affect its stability.
The least significant factor affecting the stability of applied iodine during storage was the type of vegetable. The vegetable matrix only influenced iodine stability in stored vegetable samples pre-impregnated at 1:4 hydration and 4 °C. The half-lives of iodine T(1/2) for pumpkin impregnated in these parameters were longer, up to 20%, compared to the samples of carrot. The ranking of vegetables according to increasing sensitivity to changing conditions of pre-impregnation during storage was as follows: pumpkin > cauliflower = broccoli > carrot.
Further research on the correlation between the type of vegetable carriers (especially pumpkin and carrot) and the stability of iodine is necessary to clarify this point. The results may be interesting for nutritionists, as well as for food producers who offer food for consumers at risk of iodine deficiency, for example, vegans and vegetarians.
3. Materials and Methods
3.1. Material
Vegetables, i.e., pumpkin (Cucurbita pepo L.), cauliflower (Brassica oleracea var. botrytis L.), broccoli (Brassica oleracea L.), and carrot (Daucus carota L.), were used as a matrix for the iodine. The products in a ripe state were purchased in the retail trade in the months of September and October. The KI and KIO3 constituted the sources of iodine (Merck, Darmstadt, Germany).
3.1.1. Conditions of Impregnation
The experimental scheme is presented in Figure 5. The vegetables were washed under running tap water. The pumpkin and carrot were peeled with knives, and the seeds of the pumpkin were removed. The vegetables were cut into small pieces: pumpkins into cubes in size about 4 × 4 × 4 cm, carrots in slices 4 cm thick, and cauliflower and broccoli in florets. Next, the vegetables were steamed (100 °C; 100% steam/10 min) in a convection oven (Rational, Landsberg am Lech, Germany). The vegetables were subsequently drained and subjected to homogenization (homogenizer—Foss, Hilleroed, Denmark) to obtain a particle size of 250 µm. The next stage of impregnation was the conditioning of the vegetables in an aqueous solution of KI/KIO3 (Table 3). For the next impregnation steps, the variability of conditions was assumed:
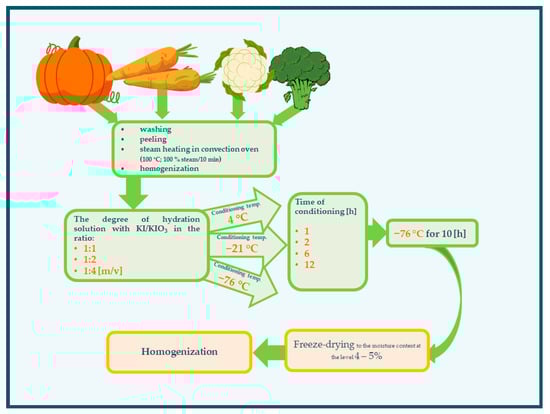
Figure 5.
Scheme of the impregnation conditions of vegetables with iodine.
Table 3.
Parameters of carrier iodination of the iodine carriers.
- Degree of hydration—in the ratio 1:1, 1:2, 1:4 (m/v) at temperature 21 °C;
- Temperature of conditioning (4, −21, −76 °C);
- Time of conditioning (1, 2, 6, 12 h).
All the samples (including those impregnated at −76 °C) were stored at −76 °C for 10 h before drying. Then, the impregnated preparations were freeze-dried (Alpha 1–4 443 LSC Freeze dryer; Christ, Hagen, Germany; at the temperature of the shelf 14 °C and condenser −54 °C, and vacuum 0.520 mbar) to the moisture content at the level of 4–5%. Freeze-drying times for samples hydrated in the ratio 1:1 were 28–30 h, and 1:3 and 1:4 were 49–53 h and 69–74 h, respectively. The dried vegetables were subjected to homogenization (homogenizer—Foss, Hilleroed, Denmark) to obtain a powder particle size of approximately 250 µm.
3.1.2. Storage Conditions of Iodine Sources
The impregnated and freeze-dried vegetables under investigation were stored in jars (black glass, closed with screw top, d = 7 cm, h = 10 cm). The influence of storage conditions on the stability of KI and KIO3 was tested during storage of 21 ± 1 °C.
The iodine contents in the investigated carriers were monitored on the selected storage days: 1, 30, 60, 90, 120, 150, 180, and 230.
3.2. Methods
3.2.1. Stability of Iodine
In order to determine the effectiveness of the iodine impregnation conditions, the iodine content of the vegetables was determined after the application of iodine and storage.
Directly after drying of fortified samples, quantitative changes in the total and inorganic iodine were determined with a macro chemical method with potassium thiocyanate described by Kuhne, Wirth, and Wagner [69] and Moxon and Dixon [70]. The details of the method were described previously by Waszkowiak and Szymandera-Buszka [71].
3.2.2. Dry Mass
Iodine content was converted to dry weight. For this purpose, the dry mass (DM) of iodine carriers was estimated by drying at 105 °C to constant weight [72].
3.2.3. L*a*b* Color Properties
For L*, a*,b* color evaluation of powdered vegetables, an NH310 portable colorimeter (Shenzhen Three NH Technology Co., Ltd., Shiyan, China) equipped with Light Source is LED blue light excitation with illuminating/viewing geometry 8/d, and internal software was applied. Before the measurements, the colorimeter was calibrated with the use of a white plate (provided by the manufacturer), and the black color calibration was manually performed (calibration on air). During measurements, the powder of the vegetables was inserted into the dedicated powder dark chamber.
The color tests were repeated 10 times, and average values with SD were recorded [73].
3.3. Statistical Analysis
STATISTICA PL 13.3 (Tibco Software Inc., Palo Alto, CA, USA) and R software (version 4.1 with packages FactoMineR v.2.4 and factoextra v.1.0.7) were the software used for principal components analysis (PCA) and calculating significant differences between means (p < 0.05, analysis of variance ANOVA), Tukey’s multiple range test.
The iodine content of the tested samples was analyzed in 6 samples (2 independent samples and 3 measurements for each sample). Hypotheses were tested at α = 0.01. To predict the dynamics of changes in iodine content in carriers during storage, the half-life value (T1/2) was used. This is a term that describes the time within which the initial iodine content decreases by half. The half-life was calculated from an exponential decay mode [30]. The accuracy of the models was estimated using the coefficient of determination (R2) and root mean square error (RMSE). The significance level for all analyses was set at 5%.
4. Conclusions
The research presented in this paper shows that all selected vegetables (pumpkin, broccoli, cauliflower, and carrots) can be used as iodine carriers and can therefore be an alternative to table salt and even protein preparations. The presence of introduced iodine did not affect the color parameters of the dry vegetables fortified with iodine.
The results confirmed the hypothesis that the fortification parameters affect the stability of the iodine during fortification and continued storage.
After drying the samples, the total iodine content was most strongly correlated with the degree of hydration and the temperature of the impregnation process. The lowest iodine content was in samples fortified with 1:4 hydration at 4 °C for 6 h. The highest reproducibility of iodine was for the following fortification conditions: temperature of −76 °C and 1:1 hydration.
This study confirms that the most unfavorable iodine impregnation conditions also decreased iodine stability during storage of the fortified samples. The preferred form of iodine was KIO3 rather than KI.
In order to maximize recovery of the introduced iodine in the product after drying up, using the conditioning step at 4 °C is not recommended. On the other hand, freezing fortified vegetables immediately after the impregnation process is strongly recommended.
Supplementary Materials
The following supporting information can be downloaded at: https://www.mdpi.com/article/10.3390/molecules27103351/s1, Table S1: The color parameters of fortified pumpkin with KI; Table S2. The color parameters of fortified pumpkin with KIO3; Table S3: The color parameters of fortified broccoli with KI; Table S4: The color parameters of fortified broccoli with KIO3; Table S5: The color parameters of fortified cauliflower with KI; Table S6: The color parameters of fortified cauliflower with KIO3; Table S7: The color parameters of fortified carrot with KI; Table S8: The color parameters of fortified carrot with KIO3; Table S9: The iodine content (%) during 230 days of storage of the dried KI fortified pumpkin at various conditions (temperature, hydration, and time); Table S10: The iodine content (%) during 230 days of storage of the dried KIO3 fortified pumpkin at various conditions (temperature, hydration, and time); Table S11: The iodine content (%) during 230 days of storage of the dried KI fortified broccoli at various conditions (temperature, hydration, and time); Table S12: The iodine content (%) during 230 days of storage of the dried KIO3 fortified broccoli at various conditions (temperature, hydration, and time); Table S13: The iodine content (%) during 230 days of storage of the dried KI fortified cauliflower at various conditions (temperature, hydration, and time); Table S14: The iodine content (%) during 230 days of storage of the dried KIO3 fortified cauliflower at various conditions (temperature, hydration, and time); Table S15: The iodine content (%) during 230 days of storage of the dried KI fortified carrot at various conditions (temperature, hydration, and time); Table S16: The iodine content (%) during 230 days of storage of the dried KIO3 fortified carrot at various conditions (temperature, hydration, and time).
Author Contributions
Conceptualization, A.Z., K.W., and K.S.-B.; methodology, K.W., M.J., and K.S.-B.; software, D.K.; validation, A.Z., D.K., A.J.-G., and K.S.-B.; formal analysis, A.Z., M.J., and K.S.-B.; writing—original draft preparation, A.Z., K.W., A.J.-G., and K.S.-B.; writing—review and editing, A.Z., K.W., A.J.-G., and K.S.-B.; visualization, A.Z., D.K., A.J.-G., and K.S.-B.; supervision, K.S.-B.; All authors have read and agreed to the published version of the manuscript.
Funding
This research was funded by statutory funds of the Department of Gastronomy Science and Functional Foods of Poznan University of Life Sciences (grant no. 506.751.03.00). The publication was financed within the framework of the Polish Ministry of Science and Higher Education’s program “Regional Initiative Excellence” in the years 2019–2022 (no. 005/RID/2018/19)”, financing amount of 12,000,000 PLN.
Institutional Review Board Statement
Not applicable.
Informed Consent Statement
Not applicable.
Data Availability Statement
Not applicable.
Conflicts of Interest
The authors declare no conflict of interest.
Sample Availability
Samples of the compounds are available from the authors.
References
- Kreutz, J.M.; Adriaanse, M.P.M.; van der Ploeg, E.M.C.; Vreugdenhil, A.C.E. Narrative review: Nutrient deficiencies in adults and children with treated and untreated celiac disease. Nutrients 2020, 12, 500. [Google Scholar] [CrossRef] [PubMed]
- Gunnarsdottir, I.; Dahl, L. Iodine intake in human nutrition: A systematic literature review. Food Nutr. Res. 2012, 56, 19731. [Google Scholar] [CrossRef] [PubMed]
- Krela-Kaźmierczak, I.; Czarnywojtek, A.; Skoracka, K.; Rychter, A.M.; Ratajczak, A.E.; Szymczak-Tomczak, A.; Ruchała, M.; Dobrowolska, A. Is there an ideal diet to protect against iodine deficiency? Nutrients 2021, 13, 513. [Google Scholar] [CrossRef] [PubMed]
- Van Der Straeten, D.; Bhullar, N.K.; De Steur, H.; Gruissem, W.; MacKenzie, D.; Pfeiffer, W.; Qaim, M.; Slamet-Loedin, I.; Strobbe, S.; Tohme, J.; et al. Multiplying the efficiency and impact of biofortification through metabolic engineering. Nat. Commun. 2020, 11, 5203. [Google Scholar] [CrossRef]
- Fallon, N.; Dillon, S.A. Low Intakes of Iodine and Selenium Amongst Vegan and Vegetarian Women Highlight a Potential Nutritional Vulnerability. Front Nutr. 2020, 7, 72. [Google Scholar] [CrossRef]
- Olson, R.; Gavin-Smith, B.; Ferraboschi, C.; Kraemer, K. Food fortification: The advantages, disadvantages and lessons from sight and life programs. Nutrients 2021, 13, 1118. [Google Scholar] [CrossRef]
- Krzepiłko, A.; Zych-Wężyk, I.; Molas, J. Alternative ways of enriching the human diet with iodine. J. Pre-Clin. Clin. Res. 2015, 9, 167–171. [Google Scholar] [CrossRef][Green Version]
- Seyed, M.M.J.; Seid, T.G. The importance of minerals in human nutrition: Bioavailability, food fortification, processing effects and nanoencapsulation. Trends Food Sci. Technol. 2017, 62, 119–132. [Google Scholar] [CrossRef]
- Kulczyński, B.; Suliburska, J.; Rybarczyk, M.; Gramza-Michałowska, A. The effect of osmotic dehydration conditions on the calcium content in plant matrice. Food Chem. 2021, 343, 128519. [Google Scholar] [CrossRef]
- Melero, V.; Runkle, I.; Garcia, N.; Torre, D.; De Miguel, P.; Valerio, J.; Valle, L.; Barabash, A.; Moraga, I.; Familiar, C.; et al. The Consumption of Food-Based Iodine in the Immediate Pre-Pregnancy Period in Madrid Is Insufficient. San Carlos and Pregnancy Cohort Study. Nutrients 2021, 13, 4458. [Google Scholar] [CrossRef]
- Shahzad, R.; Jamil, S.; Ahmad, S.; Nisar, A.; Khan, S.; Amina, Z.; Kanwal, S.; Aslam, H.M.U.; Gill, R.A.; Zhou, W. Biofortification of Cereals and Pulses Using New Breeding Techniques: Current and Future Perspectives. Front. Nutr. 2021, 8, 721728. [Google Scholar] [CrossRef] [PubMed]
- Grzanka, M.; Smoleń, S.; Skoczylas, Ł.; Grzanka, D. Biofortification of sweetcorn with iodine: Interaction of organic and inorganic forms of iodine combined with vanadium. Agronomy 2021, 11, 1720. [Google Scholar] [CrossRef]
- Smoleń, S.; Czernicka, M.; Kowalska, I.; Kȩska, K.; Halka, M.; Grzebelus, D.; Grzanka, M.; Skoczylas, Ł.; Pitala, J.; Koronowicz, A.; et al. New Aspects of Uptake and Metabolism of Non-organic and Organic Iodine Compounds—The Role of Vanadium and Plant-Derived Thyroid Hormone Analogs in Lettuce. Front. Plant Sci. 2021, 12, 608. [Google Scholar] [CrossRef] [PubMed]
- Medrano-Macías, J.; Leija-Martínez, P.; González-Morales, S.; Juárez-Maldonado, A.; Benavides-Mendoza, A. Use of iodine to biofortify and promote growth and stress tolerance in crops. Front. Plant Sci. 2016, 7, 1146. [Google Scholar] [CrossRef] [PubMed]
- Bouis, H.E.; Saltzman, A. Improving nutrition through biofortification: A review of evidence from HarvestPlus, 2003 through 2016. Glob. Food Sec. 2017, 12, 49–58. [Google Scholar] [CrossRef]
- Gonzali, S.; Kiferle, C.; Perata, P. Iodine biofortification of crops: Agronomic biofortification, metabolic engineering and iodine bioavailability. Curr. Opin. Biotechnol. 2017, 44, 16–26. [Google Scholar] [CrossRef]
- Stangoulis, J.C.R.; Knez, M. Biofortification of major crop plants with iron and zinc—Achievements and future directions. Plant Soil 2022. [Google Scholar] [CrossRef]
- Mackerras, D.; Powers, J.; Boorman, J.; Loxton, D.; Giles, G.G. Estimating the impact of mandatory fortification of bread with iodine on pregnant and post-partum women. J. Epidemiol. Community Health 2011, 65, 1118–1122. [Google Scholar] [CrossRef]
- Charlton, K.; Skeaff, S. Iodine fortification: Why, when, what, how, and who? Curr. Opin. Clin. Nutr. Metab. Care 2011, 14, 618–624. [Google Scholar] [CrossRef]
- Diosady, L.L.; Alberti, J.O.; Venkatesh Mannar, M.G.; FitzGerald, S.; Helmyati, S.; Narendra, Y.H.; Septi, P.; Rochyana, I.; Endri, Y.; Codex Alimentarius Commission; et al. The molecular properties of peanut protein: Impact of temperature, relative humidity and vacuum packaging during storage. Molecules 2014, 23, 2618. [Google Scholar] [CrossRef]
- Diosady, L.L.; Mannar, V.M.G. Stability of iodine in iodized salt. In Proceedings of the 8th World Salt Symposium, The Hague, The Netherlands, 7–11 May 2000; pp. 977–982. [Google Scholar]
- Modupe, O.; Krishnaswamy, K.; Diosady, L.L. Technology for triple fortification of salt with folic acid, iron, and iodine. J. Food Sci. 2019, 84, 2499–2506. [Google Scholar] [CrossRef] [PubMed]
- Trofimiuk-Müldner, M.; Konopka, J.; Sokołowski, G.; Dubiel, A.; Kieć-Klimczak, M.; Kluczyński, Ł.; Motyka, M.; Rzepka, E.; Walczyk, J.; Sokołowska, M.; et al. Current iodine nutrition status in Poland (2017): Is the Polish model of obligatory iodine prophylaxis able to eliminate iodine deficiency in the population? Public Health Nutr. 2020, 23, 2467–2477. [Google Scholar] [CrossRef] [PubMed]
- Chotivichien, S.; Chongchaithet, N.; Aksornchu, P.; Boonmongkol, N.; Duangmusik, P.; Knowles, J.; Sinawat, S. Assessment of the contribution of industrially processed foods to salt and iodine intake in Thailand. PLoS ONE 2021, 16, e0253590. [Google Scholar] [CrossRef]
- Pyka, B.; Zieleń-Zynek, I.; Kowalska, J.; Ziółkowski, G.; Hudzik, B.; Gąsior, M.; Zubelewicz-Szkodzińska, B. Dietary recommendations for iodine intake - in search of a consensus between cardiologists and endocrinologists. Folia Cardiol. 2019, 14, 156–160. [Google Scholar] [CrossRef]
- Pyka, Ł.; Hawranek, M.; Wilczek, K.; Piegza, J.; Szkodziński, J.; Lekston, A.; Gąsior, M. Imaging-guided percutaneous coronary intervention with ultra-low contrast angiographic control for patients at extreme risk of contrast induced nephropathy. Cardiol. J. 2019, 26, 796–798. [Google Scholar] [CrossRef] [PubMed]
- WHO. Reducing Salt Intake in Population; WHO Press: Geneva, Switzerland, 2006.
- Waszkowiak, K.; Szymandera-Buszka, K. Utilization preparations of connective tissue proteins as carriers of potassium iodide – studies of iodine retention during their storage. Polish J. Hum. Nutr. Metab. 2005, 32, 1130–1134. [Google Scholar]
- Waszkowiak, K.; Szymandera-Buszka, K. Effect of collagen preparations used as carriers of potassium iodide on retention of iodine and thiamine during cooking and storage of pork meatballs. J. Sci. Food Agric. 2007, 87, 1473–1479. [Google Scholar] [CrossRef]
- Szymandera-Buszka, K.; Waszkowiak, K.; Kaczmarek, A.; Zaremba, A. Wheat dietary fibre and soy protein as new carriers of iodine compounds for food fortification—The effect of storage conditions on the stability of potassium iodide and potassium iodate. LWT 2021, 137, 110424. [Google Scholar] [CrossRef]
- Hęś, M.; Waszkowiak, K.; Szymandera-Buszka, K. The effect of iodine salts on lipid oxidation and changes in nutritive value of protein in stored processed meats. Meat Sci. 2012, 92, 139–143. [Google Scholar] [CrossRef]
- Delimaris, I. Adverse Effects Associated with Protein Intake above the Recommended Dietary Allowance for Adults. ISRN Nutr. 2013, 2013, 126929. [Google Scholar] [CrossRef]
- Sakkas, H.; Bozidis, P.; Touzios, C.; Kolios, D.; Athanasiou, G.; Athanasopoulou, E.; Gerou, I.; Gartzonika, C. Nutritional Status and the Influence of the Vegan Dieton the Gut Microbiota and Human Health. Medicina 2020, 56, 88. [Google Scholar] [CrossRef] [PubMed]
- Varela, P.; Arvisenet, G.; Gonera, A.; Myhrer, K.S.; Fifi, V.; Valentin, D. Meat replacer? No thanks! The clash between naturalness and processing: An explorative study of the perception of plant-based foods. Appetite 2022, 169, 105793. [Google Scholar] [CrossRef] [PubMed]
- Hartmann, C.; Furtwaengler, P.; Siegrist, M. Consumers’ evaluation of the environmental friendliness, healthiness and naturalness of meat, meat substitutes, and other protein-rich foods. Food Qual. Prefer. 2022, 97, 104486. [Google Scholar] [CrossRef]
- Jedrusek-Golinska, A.; Piasecka-Kwiatkowska, D.; Zielinska, P.; Zielinska-Dawidziak, M.; Szymandera-Buszka, K.; Hes, M. Soy preparations are potentially dangerous factors in the course of a food allergy. Foods 2019, 8, 655. [Google Scholar] [CrossRef]
- Wang, Z.; Wang, J.; Xu, W.; Xu, J.; Li, X.; Zhao, J.; Wang, G.; Yang, X. Iodine Content of Processed Foods and Condiments Sampled in China, 2017-2019. Food Nutr. Sci. 2021, 12, 1217–1231. [Google Scholar] [CrossRef]
- Bath, S.C.; Hill, S.; Infante, H.G.; Elghul, S.; Nezianya, C.J.; Rayman, M.P. Iodine concentration of milk-alternative drinks available in the UK in comparison with cows’ milk. Br. J. Nutr. 2017, 118, 525–532. [Google Scholar] [CrossRef]
- Eveleigh, E.R.; Coneyworth, L.J.; Avery, A.; Welham, S.J.M. Vegans, vegetarians, and omnivores: How does dietary choice influence iodine intake? A systematic review. Nutrients 2020, 12, 1606. [Google Scholar] [CrossRef]
- Groufh-Jacobsen, S.; Hess, S.Y.; Aakre, I.; Gjengedal, E.L.F.; Pettersen, K.B.; Henjum, S. Vegans, vegetarians and pescatarians are at risk of iodine deficiency in Norway. Nutrients 2020, 12, 3555. [Google Scholar] [CrossRef]
- Li, Y.O.; Komarek, A.R. Dietary fibre basics: Health, nutrition, analysis, and applications. Food Qual. Saf. 2017, 1, 47–59. [Google Scholar] [CrossRef]
- Szymandera-Buszka, K.; Piechocka, J.; Zaremba, A.; Przeor, M.; Jędrusek-Golińska, A. Pumpkin, Cauliflower and Broccoli as New Carriers of Thiamine Compounds for Food Fortification. Foods 2021, 10, 578. [Google Scholar] [CrossRef]
- Chadare, F.J.; Idohou, R.; Nago, E.; Affonfere, M.; Agossadou, J.; Fassinou, T.K.; Kénou, C.; Honfo, S.; Azokpota, P.; Linnemann, A.R.; et al. Conventional and food-to-food fortification: An appraisal of past practices and lessons learned. Food Sci. Nutr. 2019, 7, 2781–2795. [Google Scholar] [CrossRef] [PubMed]
- Schaffner, M.; Rochau, U.; Mühlberger, N.; Conrads-Frank, A.; Rushaj, V.Q.; Sroczynski, G.; Koukkou, E.; Thuesen, B.H.; Völzke, H.; Oberaigner, W.; et al. The economic impact of prevention, monitoring and treatment strategies for iodine deficiency disorders in Germany. Endocr. Connect. 2021, 10, 1–12. [Google Scholar] [CrossRef] [PubMed]
- Friesen, V.M.; Aaron, G.J.; Myatt, M.; Neufeld, L.M. Assessing coverage of population-based and targeted fortification programs with the use of the Fortification Assessment Coverage Toolkit (FACT): Background, toolkit development, and supplement overview. J. Nutr. 2017, 147, 981S–983S. [Google Scholar] [CrossRef] [PubMed]
- Osendarp, S.J.M.; Martinez, H.; Garrett, G.S.; Neufeld, L.M.; De-Regil, L.M.; Vossenaar, M.; Darnton-Hill, I. Large-Scale Food Fortification and Biofortification in Low- and Middle-Income Countries: A Review of Programs, Trends, Challenges, and Evidence Gaps. Food Nutr. Bull. 2018, 39, 315–331. [Google Scholar] [CrossRef]
- Gorstein, J.L.; Bagriansky, J.; Pearce, E.N.; Kupka, R.; Zimmermann, M.B. Estimating the Health and Economic Benefits of Universal Salt Iodization Programs to Correct Iodine Deficiency Disorders. Thyroid 2020, 30, 1802–1809. [Google Scholar] [CrossRef]
- Dwyer, J.T.; Wiemer, K.L.; Dary, O.; Keen, C.L.; King, J.C.; Miller, K.B.; Philbert, M.A.; Tarasuk, V.; Taylor, C.L.; Gaine, P.C.; et al. Fortification and health: Challenges and opportunities. Adv. Nutr. 2015, 6, 124–131. [Google Scholar] [CrossRef]
- Garg, M.; Sharma, A.; Vats, S.; Tiwari, V.; Kumari, A.; Mishra, V.; Krishania, M. Vitamins in Cereals: A Critical Review of Content, Health Effects, Processing Losses, Bioaccessibility, Fortification, and Biofortification Strategies for Their Improvement. Front. Nutr. 2021, 8, 254. [Google Scholar] [CrossRef]
- Wawrzyniak, N.; Suliburska, J.; Kulczyński, B.; Kołodziejski, P.; Kurzawa, P.; Gramza-Michałowska, A. Calcium-enriched pumpkin affects serum leptin levels and fat content in a rat model of postmenopausal osteoporosis. Nutrients 2021, 13, 2334. [Google Scholar] [CrossRef]
- Keats, E.C.; Das, J.; Siddiqua, A.; Als, D.; Bhutta, Z.A. PROTOCOL: Large-scale food fortification (LSFF) efforts for improving health outcomes in low- and middle-income countries: A systematic review. Campbell Syst. Rev. 2018, 14, 1–30. [Google Scholar] [CrossRef]
- Szymandera-Buszka, K.; Waszkowiak, K. Unstability of iodine in iodized table salt during storage. Polish J. Environ. Stud. 2004, 13, 562–565. [Google Scholar]
- Szymandera-Buszka, K.; Waszkowiak, K. Iodine retention in ground pork burgers fried in fat free conditions. Acta Sci. Pol. Technol. Aliment. 2004, 3, 157–162. [Google Scholar]
- Waszkowiak, K.; Szymandera-Buszka, K. Effect of storage conditions on potassium iodide stability in iodised table salt and collagen preparations. Int. J. Food Sci. Technol. 2008, 43, 895–899. [Google Scholar] [CrossRef]
- Fallah, S.H.; Khalilpour, A.; Amouei, A.; Rezapour, M.; Tabarinia, H. Stability of iodine in iodized salt against heat, light and humidity. Int. J. Heal. Life Sci. 2020, 6, e100098. [Google Scholar] [CrossRef]
- Shi, H. Adding an oxidant increases the stability of iodine in iodized salt. Food Nutr. Bull. 2004, 25, 137–141. [Google Scholar] [CrossRef]
- Ekott, E.; Etukudo, U. Iodine Stability in Commercial Salt Brands in Nigeria. Int. J. Eng. Tech. Res. 2017, 7, 10–13. [Google Scholar]
- Shawel, D.; Hagos, S.; Lachat, C.K.; Kimanya, M.E.; Kolsteren, P. Post-production losses in iodine concentration of salt hamper the control of iodine deficiency disorders: A case study in Northern Ethiopia. J. Heal. Popul. Nutr. 2010, 28, 238–244. [Google Scholar] [CrossRef]
- Diosady, L.L.; Alberti, J.O.; Mannar, M.G.V.; Stone, T.G. Stability of iodine in iodized salt used for correction of iodine-deficiency disorders. Food Nutr. Bull. 1997, 18, 388–397. [Google Scholar] [CrossRef]
- Vithanage, M.; Herath, I.; Achinthya, S.S.; Bandara, T.; Weerasundara, L.; Mayakaduwa, S.S.; Jayawardhana, Y.; Kumarathilaka, P. Iodine in commercial edible iodized salts and assessment of iodine exposure in Sri Lanka. Arch. Public Health 2016, 74. [Google Scholar] [CrossRef]
- Biber, F.Z.; Unak, P.; Yurt, F. Stability of iodine content in iodized salt. Isotopes Environ. Health Stud. 2002, 38, 78–93. [Google Scholar] [CrossRef]
- Saiz-Lopez, A.; Blaszczak-Boxe, C.S.; Carpenter, L.J. A mechanism for biologically induced iodine emissions from sea ice. Atmos. Chem. Phys. 2015, 15, 9731–9746. [Google Scholar] [CrossRef]
- Szymandera-Buszka, K.; Waszkowiak, K. Stability of iodinated salts during roasting and storage of pork meatballs. Polish J. food Nutr. Sci. 2007, 57, 335–338. [Google Scholar]
- Rana, R.; Raghuvanshi, R.S. Effect of different cooking methods on iodine losses. J. Food Sci. Technol. 2013, 50, 1212–1216. [Google Scholar] [CrossRef] [PubMed][Green Version]
- Diosady, L.L.; Alberti, J.O.; Ramcharan, K.; Mannar, M.G.V. Iodine stability in salt double-fortified with iron and iodine. Food Nutr. Bull. 2002, 23, 196–207. [Google Scholar] [CrossRef] [PubMed]
- Kulczynski, B.; Gramza-Michałowska, A. The profile of secondary metabolites and other bioactive compounds in cucurbita Pepo L. And cucurbita moschata pumpkin cultivars. Molecules 2019, 24, 2945. [Google Scholar] [CrossRef] [PubMed]
- Hassan, M.F.Y.; Barakat, H. Effect of Carrot and Pumpkin Pulps Adding on Chemical, Rheological, Nutritional and Organoleptic Properties of Ice Cream. Food Nutr. Sci. 2018, 9, 969–982. [Google Scholar] [CrossRef][Green Version]
- Tariku, W.B.; Mazengia, A.L. Knowledge and Utilization of Iodized Salt and Its Associated Factors at Household Level in Mecha District, Northwest Ethiopia. J. Nutr. Metab. 2019, 2019, 9763830. [Google Scholar] [CrossRef]
- Kuhne, D.; Wirth, F.; Wagner, H. Iodine determination in iodized meat products. Fleischwirtschaft 1993, 73, 175–178. [Google Scholar]
- Moxon, R.E.; Dixon, E.J. Semi-automatic method for the determination of total iodine in food. Analyst 1980, 105, 344–352. [Google Scholar] [CrossRef]
- Waszkowiak, K.; Szymandera-Buszka, K. The application of wheat fibre and soy isolate impregnated with iodine salts to fortify processed meats. Meat Sci. 2008, 80, 1340–1344. [Google Scholar] [CrossRef]
- ISO 2483:1973; Sodium Chloride for Industrial Use—Determination of the Loss of Mass at 110 Degrees C (Reviewed and Confirmed in 2018). International Organization for Standardization: Geneva, Switzerland, 2018.
- Siejak, P.; Smułek, W.; Fathordobady, F.; Grygier, A.; Baranowska, H.M.; Rudzińska, M.; Masewicz, Ł.; Jarzębska, M.; Nowakowski, P.T.; Makiej, A.; et al. Multidisciplinary studies of folk medicine “five thieves’ oil” (Olejek pięciu złodziei) components. Molecules 2021, 26, 2931. [Google Scholar] [CrossRef]


Publisher’s Note: MDPI stays neutral with regard to jurisdictional claims in published maps and institutional affiliations. |
© 2022 by the authors. Licensee MDPI, Basel, Switzerland. This article is an open access article distributed under the terms and conditions of the Creative Commons Attribution (CC BY) license (https://creativecommons.org/licenses/by/4.0/).