Article

Research on the Spatial-Temporal Differentiation and Path Analysis of China’s Provincial Regions’ High-Quality Economic Development

1
Centre for Polish Studies, School of International Relations, Xi’an International Studies University, Xi’an 710128, China
2
School of English Studies, Xi’an International Studies University, Xi’an 710128, China
3
Economics Teaching Section, Party School of Guangdong Provincial Committee of Communist Party of China, Guangzhou 510053, China
4
College of Economics and Management, Northwest A&F University, Xianyang 712000, China
5
School of Public Administration and Policy, Renmin University of China, Beijing 100872, China
*
Author to whom correspondence should be addressed.
Sustainability 2022, 14(10), 6348; https://doi.org/10.3390/su14106348
Submission received: 18 April 2022 / Revised: 16 May 2022 / Accepted: 19 May 2022 / Published: 23 May 2022

Abstract

:
High-quality economic development is an important approach for achieving sustainable economic development, and it is an essential condition for coordinated development between economic systems and ecosystems. This paper starts from five key points, namely, “innovation, coordination, opening-up, sharing and greenness”, to construct an evaluation system for the index of high-quality economic development, using the AHP and EVM methods to measure the level of high-quality economic development of 30 regions in China from 2004 to 2019. It uses the kernel density estimation model (hereinafter referred to briefly as KDE) and clustering method to analyze time evolution trends and spatial variation characteristics. Moreover, the LSE model is adopted to explore and analyze the factors influencing high-quality economic development in different regions. Additionally, the driving forces of China’s high-quality economic development are analyzed by means of path analysis combined with the average value of each index. The results show the following: (1) The high-quality economic development of 30 regions in China (excluding Hong Kong, Macao, Taiwan and Tibet) is spatially clustered, with obviously different development levels, characterized by the eastern region being better developed than the central and western regions. (2) With the passage of time, the polarization of China’s 30 regions has been alleviated, but they are still facing challenging development situations; (3) The factors affecting the high-quality economic development of these 30 regions in China can be divided into four types: three-factors, four-factors-I, four-factors-II and five-factors. Contributing regional factors show different distribution characteristics. The above conclusion provides a reference and scientific basis for the government to formulate policies of high-quality economic development and to solve problems facing coordinated sustainable development among regional societies, their economies and the environment.

1. Introduction

Over the course of 42 years, following the launch of reform and opening-up in 1978, China’s GDP grew from USD 0.06 trillion to USD 15.88 trillion (as of 2020), second only to the U.S., whose GDP increased to USD 20.89 trillion over the same period, making China the world’s second-largest economy. The gap between China and the U.S. is gradually narrowing. However, alongside rapid economic growth and the undeniably remarkable achievements it has made, China has encountered many problems in resource utilization and social management, such as energy shortages, land pollution, water resource destruction, regional development imbalances, and income gaps [1,2,3]. According to a research report from the World Bank [4], as the world’s largest emitter of sulfur dioxide (SO2) and carbon dioxide (CO2), China has 16 of the 20 most polluted cities in the world; 58% of China’s cities have an average annual PM10 concentration of more than 100 μg/m3, and only 1% of China’s urban population lives in areas with an average annual PM10 concentration of less than 40 μg/m3. Furthermore, 54% of the water in China’s seven major water systems is not suitable for human use. As early as 2003, the health costs caused by air pollution accounted for 1.16–3.8% of the GDP in that year [4]. At the same time, agricultural nonpoint-source pollution continues to expand, with the pesticide adhesion rate only reaching 10~20%; the remaining 80~90% is lost in soil, water, and air. Meanwhile, the agricultural film residue rate is more than 42% [5]. A report by the Global Environmental Performance Index in 2020 showed that China was ranked 120th out of 180 countries, with 37.3 points, indicating that China’s current economic development, reliant on high-energy consumption and high input, has become a major constraint for the sustainable development of the country’s social economy [6,7]. China’s achievements in economic growth and social progress have been impressive, but they have come at a heavy cost in terms of resources, the environment and even the widening gap between rich and poor. The negative effects brought about by economic development have already been recognized by China and many other countries. The 2030 Agenda for Sustainable Development released and implemented by the United Nations provides clear and specific guidance for countries around the world in the face of increasingly serious natural resource depletion, ecological and environmental damage crises and downward pressure on economic growth, thereby making resource conservation and environmentally friendly economic growth the common trends of global development. In the face of development difficulties, the Chinese government has made continuous efforts, including putting forward a series of ideas and measures such as “scientific outlook on development”, “building a resource-saving and environment-friendly society” and “high-quality development”, trying to transform China’s economy from high-speed growth to a green, low-carbon and circular economic system [8]. At the same time, many scholars have put forward different views and suggestions on the transformation of China’s economic model. For example, Zhou and others [9] proposed that in the process of industrial development and transformation, western China should continue to strengthen the development of environmental protection technologies, while the eastern region should encourage energy-saving innovative technologies; Hussain [10] and other scholars believed that the Chinese government should continue to maintain GDP growth to effectively combat environmental degradation. It is necessary to reconsider policies related to population development, to reduce the environmental pressure caused by carbon dioxide emissions and limit China’s ecological footprint. A change in economic model, based on the pursuit of quality instead of quantity, can help China’s economy adapt to the new changes of the global social and economic situation, while effectively building harmonious coexistence between man and nature [4,5,11].To promote the harmonious development of the economy and the environment, decision-making concepts have successively emerged including ecological civilization construction, high-quality economic development and new development patterns, which systematically and scientifically expound the importance and necessity of coordinated development in society, the economy and the environment [11]. As the core dimension of China’s sustainable social and economic development, high-quality economic development continues, and has adopted the concept of sustainable development, replacing traditional development models by optimizing economic structure, transforming growth drivers and enhancing innovation capacity, etc. [11,12,13]. High quality economic development is a process of upgrading from economic development focusing on “quantity” to “quality”. Its essence is quality and efficiency. Feng [14], Guan [15], Miao [16], and other scholars have defined high-quality economic development as the realization of high-quality development at three different levels of industry. The quality of factor input has gradually become the cornerstone of high-quality development across the whole economy, supporting the iterative upgrading of new technologies, processes, and products. This includes the supply quality not only of environmental resources such as capital, land, and the environment, but also, for example, within universities in terms of the supply quality of innovative subjects such as research institutions and enterprises. However, the high-quality development of industry is mainly realized through industrial innovation and innovative industry. Industrial innovation is the process of introducing scientific and technological achievements into traditional industries, and promoting the transformation and upgrading of traditional industries through efficient technology transfer activities. Innovative industry is the process of incubating new technologies into new products, enterprises and models, and promoting the emergence of new industries, and formats. Realizing high-quality regional development is a process of factor endowment to collaborative innovation through innovative cooperation, industrial integration, and coordinated development, so that the achievements of high-quality development can be shared by the people, meet the people’s growing needs for a better life, and realize balanced, efficient, green and sustainable development across regions. This new model is in essence a methodology to solve the problem of unbalanced development within the economy, the environment and access to resources in China [12]. It expands the breadth of solutions to the problems of resource and environmental sustainability, from the ecological environmental domain to areas of human development and social economy [12,13,17]. What is the current situation of high-quality economic development in China’s regions? What are its evolutionary characteristics? Which factors play an important role in driving and influencing that development? Research on these issues will help clarify the arrangement and understand the pros and cons of high-quality economic development in provinces, providing important theoretical significance and practical value for the management and promotion of the sustainable development of China’s social economy.
After the emergence of classical and neoclassical economics, the majority of studies have analyzed only economic growth itself, from the perspective of a single factor or all factors, without involving the coordinated development of society, humanity, resources and the environment [18,19]. Since the 20th century, academics have gradually expanded the study from economic growth to the co-development of economy and quality, due to increasingly prominent development contradictions of various kinds. At the same time, as a developing country, China’s extensive economic growth with worsening side-effects in recent years has led an increasing number of experts and scholars to focus from multiple perspectives on how China’s economy should transform from high-speed to high-quality growth, mainly regarding the significance and evaluation of high-quality economic development [19,20,21]. From the aspects of the significance of high-quality economic development, Liu [22], Li [23], Zhao [24], Liu [25], and other experts and scholars have analyzed all-factor productivity, economic growth, the philosophy of dialectical unification, financial asset allocation and local debt. Cosimo Magazzino [26] probed into the features of China’s economic growth from the perspective of transportation infrastructure. American scholar Thomas redefined the meaning of economic quality growth from the perspective of social capital, natural capital and social welfare [27]. Zhou [9] has discussed the U-shaped relationship between technological innovation and China’s economic growth. Zeeshan Khan [28] explored the relationship between natural resource endowment, technological innovation, human capital and financial development, taking China as an example. Researchers such as Mlachila [29] and Martinez [30], from the point of view of developing countries, have defined high-quality economic development as high-growth, sustainable and socially friendly development. From the perspective of the study of evaluation systems of high-quality economic development, Shi [31] constructed an index system for assessing China’s provincial economic development according to six aspects: intensity, stability, rationalization, extroversion, human capital and ecological capital. Hu [32] built a high-quality economic evaluation model based on the spatial Durbin model, which included five dimensions: economic structure, science technology, people’s livelihood, the environment and opening to the outside world. Song [33] analyzed and compared the gap in economic development quality between China and other developed countries according to three dimensions: competition, people’s livelihood and ecology. Zhan [34], constructed a comprehensive evaluation system to evaluate and measure the high-quality development of China’s regional economy, based on the “five development concepts”.
Although the existing literature of high reference value has studied the high-quality economy from various perspectives, there are some issues that still need to be discussed in depth.
First, through the exploration and research of different perspectives in “growth and development”, “economic growth and economic development”, and “quality of economic growth and economic development”, academic circles at home and abroad have further deepened understanding such issues as “what development is” and, “how to develop”. Through a review of relevant literature, this paper summarizes development as the improvement of economic structure, quality, efficiency and concept, while maintaining smooth operation of the economy, so as to achieve the goal of harmony between man and nature, improve living standards and quality, and accomplish all-round development of man [13]. The concept of high-quality economic development, based especially on “innovation, coordination, greenness, sharing and opening-up”, is the logical route and the only way to build a comprehensive and sustainable development system in China to maintain coordinated development with the three pillars of society, economy and environment [34]. Applying these five development concepts [35] to evaluate China’s high-quality economic development will help clarify the “can do” and “what to do” problems in the process of practical development in the areas of resource utilization, environmental protection and economic growth, and also the internal interactions between each subsystem. This will be conducive to national and local governments’ understanding of the level of social and economic development in various stages and regions. It can provide a certain theoretical basis and reference value for the planning and design services of relevant public departments, enabling administrators to better improve the reliability of schemes and maximize benefits [19,23].
Second, from the perspective of the index weight measurement of high-quality economic development, the complexity and diversity of index weight have previously been ignored or considered with only one calculation method; in this case, the scientificity and comparability of index weight determination need to be optimized and improved. Economic development is a dynamic comprehensive system and closely related to the external environment [3,13,36]. Although some scholars have studied high-quality economic development from various perspectives, the academic circle has not paid enough attention to its causal relationship with time and corresponding relationship with space. In recent years, remote sensing and spatial measurement software, such as the GEOGRAPHIC information system (Arcgis 10.2 ESRI (Environmental Systems Research Institute, Inc.) Redlands, CA, USA), have been widely used in regional evaluation. These technical tools can exert unique visual effects on plane base-maps by searching, storing, processing and analyzing geospatial data, and are closely integrated with geographic analysis tools, which has opened up a new way for people to analyze and address problems [37]. The introduction of these technologies can provide powerful scientific support for the evaluation of high-quality economic development and the formulation of management policies.
Finally, the introduction and application of the LSE model can reveal not only the influencing factors behind regional differences of high-quality economic development and the reasons for these, but also help to formulate accurately relevant development plans by recognizing the mutual relationships inside the internal system. It can promote social and economic development, and the maximum protection and utilization of natural resources, providing data, analytical tools and new research thinking for relevant institutions and planners. The model can help find the most effective measures to achieve comprehensive sustainable development of the population, society, economy, resources and environment in each region [38,39].
In summation, based on reference to the evaluation system of high-quality economic development worldwide, this paper identifies and divides the subsystems of high-quality economic development [2,34,40,41], selects indicators representing the level of high-quality economic growth according to the principle of order parameters, and establishes an evaluation index system at the development level. This article comprehensively analyzes temporal and spatial variation characteristics and influencing factors of China’s high-quality economic development during the study period, using AHP, kernel density estimation and minimum variance, based on data from 30 regions (excluding Hong Kong, Macao, Taiwan, and Tibet) from 2004 to 2019. The research results are intended to reveal the current situation and problems facing high-quality development of China’s economy, and provide a theoretical reference for the formulation of strategies for the sustainable development of the social economy in different regions.

2. Index System Construction and Data Source

2.1. Construction of Index System of High-Quality Economic Development in China

High-quality economic development is a new policy-oriented development concept proposed by the ruling party. Analysis under this framework is a conducive means of extracting problems encountered in its implementation. The framework of high-quality economic development can reflect a series of factors, such as development capacity and benefits to society, the growth capacity of development factors, perfection of the infrastructure, the soundness of the economic structure, the stability of the economy, technological innovation and resource carrying capacity. Therefore, such a framework helps to better understand the operational mechanism of China’s high-quality economic development, as well as the problems facing China’s macro economy itself [42]. The realization of high-quality economic development must start at a national strategic level, to establish an evaluation index system for assessing the quality of economic development in all regions. This way it can clearly and objectively reflect the real situation of high-quality economic development between different regions and provinces, to conduct a comparative evaluation and analysis, so as to effectively guide and promote the whole society. However, the composition of the elements of this system must provide quantitative information with a reference value, for the effective realization of high-quality economic development. The fifth Plenary Session of the 18th Central Committee of the Communist Party of China (hereafter referred to as CPC), therefore, proposed the high-quality development concept of innovation, coordination, greenness, sharing and opening-up, which summarizes the law of China’s social and economic development since the reform and opening-up. It outlines a set of comprehensive indicators that can be used to evaluate quantitatively to a high standard the transformation of national or regional economic development. Based on this, through analysis of relevant documents of the fifth Plenary Session of the 18th CPC Central Committee combined with relevant research literature, this paper constructs an analysis framework of high-quality development of China’s economy, integrated with five dimensions [34,40]: innovation, coordination, greenness, sharing, and opening-up. Several evaluation indicators were set in each dimension, on this basis, AHP was used for weighting.

2.1.1. Innovation (I)

As a major driver of economic growth, innovation pushes the overall economy towards higher quality by improving productivity. According to the index selection principle and the research of Zhan [34], Liu [43] and Wei [44], this paper describes two aspects (Table 1): first, scientific and technological input, including R&D investment intensity and full-time equivalent R&D personnel; second, innovation achievements, including technology market turnover in GDP, the number of patents and the high-tech industry main income growth rate for the three indicators. Among these, the intensity of R&D investment and the full-time equivalent R&D personnel comprehensively reflect local government’s emphasis on science and technology and human resources investment. In particular, full-time equivalent R&D personnel is an internationally used index to compare science and technology and human resources investment. The number of patents, the turnover of the technology market and the growth rate of high-tech industry main income can comprehensively measure technological innovation achievements and sustainable innovation ability.

2.1.2. Coordination (C)

Coordination (Table 2) reflects the realization of better and more coordinated economic development, and sustained and sound economic development on the basis of sustained and stable macroeconomic development. According to the index selection principle and research needs identified by scholars such as Liu [43], Zhao [45] and Sun [46], this paper will explain from the following two aspects: First, economic operation is stable, including the proportion of the primary, secondary and tertiary industries in GDP; Second, the coordination of the economic structure includes the urban–rural consumption gap, binary comparison coefficient and urban–rural income ratio. The primary, secondary and tertiary industries are an important foundation for economic development. Their proportion to GDP is kept within a “reasonable range”, and they play a key role in the stable operation of the macro economy. Urban–rural consumption difference, binary comparison coefficient and urban–rural income ratio directly are the three indicators that reflect the coordination and quality of the urban rural economic structure.

2.1.3. Greenness (G)

Greenness (Table 3) means that with a focus on the speed of economic development, the shift to green production modes should also be emphasized to ensure sustainable economic development. According to the index selection principle and the research of Zhan [34], Sun [46] and Tang [47], this paper considers the two aspects of resource utilization and environmental governance. Resource utilization is represented by the comprehensive utilization rate of industrial solid waste, GDP per unit area, and clean energy consumption. Environmental governance is represented by the proportion of harmless treatment of domestic waste, the ratio of environmental pollution investment to GDP, and the number of days to achieve optimal air quality. The utilization of resources manifests the utilization efficiency of resources and the use of clean energy, while environmental governance shows the improvement of human settlement environments. The above two aspects can comprehensively reflect the development relationship between resources and the environment.

2.1.4. Sharing (S)

Sharing (Table 4) means ensuring equal access to public services, improving people’s lives, and enabling all people to share the benefits of high-quality development. According to the index selection principle and the research of Sun [17], Wei [44] and Duan [48], this paper divides sharing into two aspects: public service and development achievements. Public services include the ratio of urban maintenance to public expenditure, the medical expenditure ratio, and the number of institutions of higher education. The results of high-quality economic development are represented by the proportion of pension insurance participants, Internet coverage, and employment expenditure in public spending.

2.1.5. Opening-Up (O)

Opening-up (Table 5) mainly refers to the level and degree of social and economic development. According to the index selection principle and the research of Sun [17], Zhou [49] and Ma [50], this paper divides opening-up into two aspects: “bringing in” and “going out”. Among these, “import” includes the proportion of foreign investment in GDP, external dependence and foreign exchange income. These three indicators comprehensively reflect China’s opening-up to the outside world. “Going global” includes the turnover of Chinese enterprises’ overseas investment and the ratio of the number of Chinese enterprises’ overseas workers to the number of employees. These two indicators manifest the level of China’s opening-up and its ability to participate in economic globalization.

2.2. Source of Index Data

This paper tooks 30 provinces in Mainland China (excluding Hong Kong, Macao, Taiwan and Tibet) as the research object, with the period from 2004 to 2019 as the research interval. The relevant data were from the “China Statistical Yearbook”, “China Environment Statistical Yearbook”, “China’s Foreign Economic Statistical Yearbook” and further statistical yearbook data related to the provinces. Missing data were calculated and supplemented by the interpolation method. Finally, panel data of 30 provinces for 15 years were obtained. Because there were different units in the selected sample data, in order to avoid deviations in the analysis results caused by inconsistent units, all of the original data were standardized [5] to eliminate the dimensionality effect.

3. Research Methods

3.1. Weight Method

Due to the different units and importance of various indicators, this study adopted a combination of subjective and objective methods to assign weights to all indicators, in which the subjective weight was determined by the analytic hierarchy process (AHP), and the objective weight was determined by entropy method (EVM). In order to achieve subjective and objective unification of index weighting, the comprehensive weight organically combined the two weighting methods [5,38,51], to ensure that the sum of the internal weights of each dimension is 1. The subjective weight vector of indicators determined by the AHP process is:
ω = ( ω 1 , ω 2 , ω 3 ω m ) T
The objective weight vector determined by the EVM is:
μ = ( μ 1 , μ 2 , μ 3 μ n ) T
The comprehensive weight of each indicator is:
ω = ( ω 1 , ω 2 , ω 3 ω n ) T
The standardized decision matrix is:
Z = ( z i j ) n × m o
The smaller the deviation of the decision results under the subjective and objective weights of all scheme indicators, the better.

3.2. The KDE Model

The kernel density estimation (KDE) model estimates the probability density of random variables and uses continuous density curves to describe the distribution patterns. The basic principle of KDE was used in the research of Kuang [52], Hu [53] and Xue [54]. In accordance with its different manifestations, the kernel function can be divided into Gauss, triangle, and quartic types, etc. The shape of different types of kernel function has little influence on the accuracy of the estimation result; that is, any of the available kernel functions can be a valuable tool to study spatial distribution disequilibrium. Based on the estimation of the probability density of the distribution of the variables, variable information including the distribution of position, shape and range of motion, can be described and reflected by density curves. Additionally, the nuclear density function has stronger robustness due to its weak dependence on the model. The KDE function is expressed as:
f ( x ) = 1 n h i = 1 n K ( x i x ¯ h )
In the above formula, n is the number of observations, x i is the observation value, x ¯ is the mean value, h is the bandwidth, and K (•) is the kernel function. Based on the high-quality economic development value, and with the help of Eviews 8.0 software (IHS Global Inc., Irvine, CA, USA), this paper selected the Gauss kernel function, the most widely used function in the theoretical field, for estimation. The formula is as follows:
K ( x ) = 1 2 π exp ( x 2 ¯ 2 )
Two-dimensional KDE maps of 2004, 2011, and 2019 data were drawn to analyze the time-series evolution characteristics of China’s high-quality economic development, by comparing the shape and position of curves in different periods.

3.3. The LSE Model

In the least square error (LSE) method, also known as the Weave composite index, the variance first increases and then decreases with the growing number of data samples. It can obtain the minimum number of samples in the variance value, which can reflect the actual situation of a region. In this study, the LSE model was introduced to conduct a spatial analysis of drivers of green development. Its formula is as follows:
S 2 = 1 𝓃 𝒾 = 1 𝓃 ( X 𝒾 X ¯ ) 2
where: S 2 represents the variance; X 𝒾 represents the sample data; X ¯ represents the average of the samples; 𝓃 represents the number of samples. A theoretical standard needs to be established to determine the proportion of the regional dimension score, considered as the main contributing factor to high-quality economic development. According to Weave’s methodology, the ideal criterion for a “single-factor contribution zone” is that only one dimension accounts for the total score, with the other dimensions scoring zero. The significance of the “two-factor contribution area” is that the scores of two dimensions each account for 50% of high-quality economic development, while the score of the other dimensions is 0. Similarly, three dimensions of the “three-factor contribution area” each account for 33% of the total score for high-quality economic development. By analogy, in terms of the high-quality economic development evaluation score, its composition does not conform to any of the above theories, but the real distribution can be compared to the theoretical distribution. The one with the smallest variance is closest to the theoretical distribution standard, so the real distribution can be defined as belonging to one of the theoretical distributions. According to the established standard, the contribution rate of the dimension of high-quality economic development weighted by region was first calculated with the contribution rate ranked in order. Then, the variance formula was used to calculate the variance when the number of main contributing factors was one to five. The dimension with the smallest value is considered to be the main contributing factor for high-quality economic development [30].

3.4. Path Analysis

Path analysis is a method of attribution analysis that solves the path coefficient through multivariate statistical analysis technology, to analyze effectively and quantitatively the direct and indirect effects of explanatory variables on high-quality economic development. The path coefficient is a standardized variable, unitary partial regression coefficient [55]. On the basis of multiple regression, the influence of explanatory variables on high-quality economic development can be determined by the direct diameter coefficient, indirect diameter coefficient and total diameter coefficient respectively [56]. The specific methods are as follows:
With independent variables X 1 , X 2 , …, X n and the dependent variable Y , the regression equation can be expressed as:
Y = β 0 + β 1 × X 1 + β 2 × X 2 + β k × X k
The least square method is used to solve the regression coefficient and carry out the quantitative change, and the decomposition equation of the correlation coefficient can be obtained:
P 1 Y + γ 12 × P 2 Y + γ 13 × P 3 Y + + γ 1 k × P kY = γ 1 Y γ 21 × P 1 Y + P 1 Y + γ 23 × P 3 Y + + γ 2 k × P kY = γ 2 Y γ k 1 × P kY + γ k 2 × P 2 Y + γ k 3 × P 3 Y + + P kY = γ kY
In the above equation, P iY represents the direct path coefficient of the direct influence of the independent variable X i on Y; r ij is the correlation coefficient of X i and X j ; γ ij × P iY denotes the indirect path coefficient of X i ’s indirect influence on Y through X j . The sum of the direct and indirect diameter coefficients of an independent variable on a dependent variable is exactly equal to its correlation coefficient.

4. Empirical Analysis

4.1. Weighted Score

The EVM (Formula (2)) and AHP (Formula (1), Appendix A) processes were used to obtain the weight coefficients within and between subsystems, as well as the specific index system and weight situation (Table 6). The higher the comprehensive weight score of the index, the more important it is.

4.2. Analysis of the Level of High-Quality Economic Development in China

First, the problem of different measurements of all indicators (Table 6) corresponding to the original data was solved through the data standardization method. Second, the comprehensive weight of each index was calculated and obtained by the objective and subjective weight method. By the weighted sum of each index of the evaluation system of China’s high-quality economic development, the comprehensive evaluation score of each subsystem of 30 regions in China was obtained. Third, the total score of the high-quality economic development of 30 regions in China was obtained by weighted summation of the scores of the internal subsystems. Finally, the evaluation results tend to reflect the actual situation of high-quality economic scores of China’s regions from 2004 to 2019. Due to space limitation, only selected years of data are listed (Table 7).
The smaller the value of high-quality economic development, the worse the regional economic condition, while the higher the value, the better the regional economic conditions. According to the calculation, the values for the 30 regions in China from 2004 to 2019 was between 0.167 and 0.541. Overall, the degree of high-quality economic development showed an upward trend, and the high-quality economic development of each region shows fluctuation of ups and downs year by year, with a steady and rising trend. Seen in Table 7, the higher scoring areas were mainly in the eastern regions. For example, the average scores of Jiangsu, Guangdong, Beijing and Shanghai were 0.421, 0.423, 0.411 and 0.397, respectively, ranking in the leading positions, which shows that during the study period these regions maintained high levels of high-quality economic development, with the economic system in a benign state of development. Most of the regions with low or lower scores were concentrated in the western region. For example, Sichuan and Ningxia showed good levels of high-quality economic development during the period 2004–2011, but their scores dropped sharply after 2011, showing low levels of development. The scores for Gansu, Ningxia, Qinghai and Guizhou were low in each period, and their overall economic development level lagged behind that of the eastern region.
In general, the differentiation phenomenon occurs due to the different levels of economic development among provincial regions with different geographical advantages. The economic development level, industrial structure rationalization, coordinated development of urban and rural areas, level of per capita income and opening-up of the eastern region were better than those of the western region. This reflects the massive transfer of talent to the eastern coastal areas, whereas the overall level of western regions’ development was not optimistic. Regional high-quality economic development has been seriously affected by such problems as weak economic foundation, fragile ecological environment and an imbalance of the industrial structure, with technological innovation lagging behind. Overall development has been characterized by emerging excessive resource consumption and waste emissions, serious environmental pollution, etc. Overall, China’s provincial and regional high-quality economic development is gradually improving, but the speed and degree of improvement need to be strengthened in the central and western regions.

4.3. Analysis of Kernel Density Evolution of High-Quality Economic Development in China

In this study, the kernel density function was used to analyze the characteristics of distributed dynamic evolution. According to Formulas (5) and (6), the kernel density function of high-quality economic development among Chinese provinces was estimated with the help of Eviews 8.0 software. Figure 1 shows the kernel density function estimation results for the 30 regions in China in 2004, 2011 and 2019, respectively.
The kernel density distribution of the value of China’s high-quality economic development was obtained according to the calculation results, to judge the overall development trend of the Chinese economic system. The research results are as follows: First, Figure 1 reflects the evolution of the high-quality economic development of 30 major regions in China during the sample study period. Overall, the initial value on the left side of the kernel density curve changed slightly and evenly, while the value on the right side moved right continuously. Economists call this phenomenon an agglomeration effect due to human capital (network) externality from skilled migration toward a relatively developed region. The peak value continued to decrease and changed from “peak type” to “wide peak type”, whilst its range continued to increase. This shows that the overall level of high-quality economic development within the sample period inspection has been rising, but the gap between regions has widened. Second, in terms of the evolution process, the kernel density curve in 2004 was very steep and presented a slight multi-peak distribution. The kernel density corresponding to the main peak was much higher than other peaks, indicating that the overall level of high-quality economic development in the regions was low, and a slight multi-pole differentiation phenomenon was apparent. In 2011, the main peak value decreased, with eased steepness and a slight peak change, indicating that the regional high-quality economic development gap widened during this period, but the polarization phenomenon was alleviated. In 2019, the center of the density function continued to move to the right, and the wave peak was gentler. The distance of the left tail of the kernel density curve was smaller than that of the right tail, indicating that over time, the proportion of the low-level regions decreased, while that of the high-level regions increased. Third, the kernel density curve did not show multiple peaks in each year, indicating that there was no obvious multi-pole differentiation in high-quality economic development during the study period. Fourth, the shape of the kernel density curve presents a certain right-skewed distribution, and the area to the right of the main peak is larger, indicating that there are many areas with higher than average values of high-quality economic development.

4.4. Analysis of Degree of High-Quality Economic Development in China

According to the calculation results for the level of high-quality economic development in the 30 provincial-level administrative regions in China, the scores from 2004 to 2019 ranged from 0.167 to 0.540, and the higher the score, the better the level of development. Taking the scores of each region in 2004, 2011, 2019 and the 15-year average scores in the study period as indicators, the clustering analysis method was used to classify the high-quality economic development of each provincial region in China in different years using SPSS13.0 statistical software (SPSS 13.0 IBM (International Business Machines Corporation) Armonk, NY, USA). Cluster analysis showed that the degree of China’s high-quality economic development could be divided into four categories: strong, medium, weak and very weak. Specifically, the areas with a high level of development in 2004 included Beijing, Shanghai and Jiangsu; the medium areas comprised nine districts, including Sichuan, Jilin, Zhejiang, Guangdong, Hainan, etc.; the weak areas covered ten districts, including Heilongjiang, Inner Mongolia, Ningxia and Guangxi; the very weak areas comprised eight districts including Xinjiang, Gansu, Qinghai, Yunnan and Guizhou, (Figure 2; 2004). Compared to 2004, the level of China’s high-quality economic development changed significantly in 2011, with Heilongjiang, Inner Mongolia, Ningxia, Hainan and Guangxi falling to the level of “very-weak”; Jilin and Fujian fell into the category of less developed regions. Hunan was upgraded to a less developed region. Guangdong was upgraded from a moderately developed region to a highly developed region. The degree of development in the other areas did not change (Figure 2; 2011). Compared to 2011, there were significant changes in China’s degree of development in 2019. Yunnan, Guangxi, Heilongjiang and Shanxi from the “very-weak” degree were upgraded to the level of “weak”; Sichuan, Chongqing, Hubei, Henan, Jiangxi, Anhui and Fujian, which had been less developed regions, were upgraded to medium developed regions. Zhejiang and Shandong, which had been moderately developed, were upgraded to highly developed regions. In addition, the degree of development in Jilin dropped from relatively “weak” to “very-weak” while the rest of the region showed no change (Figure 2, 2019). In order to observe the changes in the degree of high-quality economic development in different regions more clearly, this study calculated the average scores of high-quality economic development in these regions from 2004 to 2019, and the results once again showed obvious changes compared with the above single years. Among them, Beijing, Jiangsu, Shanghai and Guangdong were highly developed. The medium developed areas comprised seven districts such as Liaoning, Shandong, Tianjin, Hebei, Zhejiang, and Fujian. The weak areas accounted for 12 districts including Heilongjiang, Jilin, Inner Mongolia, Shanxi, Hubei and Guangxi. The remaining seven areas were all very underdeveloped (Figure 2; mean of 2004–2019). In general, whether observed from the year 2004, 2011, or 2019, or from the average value of the 15 years, internal differences of China’s provincial levels of high-quality economic development were apparent, presenting a geographic space gathering phenomenon.
The areas of high and medium levels of high-quality economic development are mainly located in the east and the eastern coastal areas with obviously better development than the other areas. With superior geographical positions, developed transportation, a high level of trade development and relatively good natural resource endowment, each of these regions has a characteristic mode of economic development. Meanwhile, governments at all levels in these areas attach great importance to balanced and reasonable development of the industrial structure, and at the same time invest considerable manpower, material resources and financial resources in the treatment of environmental pollution caused by economic development. The underdeveloped or very underdeveloped regions are mainly located in the center and west of China, and their development can be affected and restricted by natural resource endowment, traffic occlusion, limited economic development level and insufficient government financial resources. In general, the evaluation results basically reflect the actual situation of high-quality economic development in China’s provinces and regions [55,56,57].

4.5. Analysis of the Driving Type of High-Quality Economic Development in China

Based on the calculation process of the LSE method (Formula (7)), this study analyzed the contribution rate of five dimensions to the high-quality economic development of the 30 regions in China, and calculated the driving types of China’s high-quality economic development into the three-factor type, four-factor type I, four-factor type II and the five-factor type (Figure 3).

4.5.1. Three-Factor Type (C, S, and G)

The three-factor type (Table 8) includes 20 inter-provincial regions, such as Hebei, Shanxi, Inner Mongolia, Jilin, Hunan, Gansu and Xinjiang, with coordination, sharing and greenness as contributing factors. It can be clearly seen from Figure 3 that this type of region covers most regions in China, and the level of economic and social development in these regions is limited.
Take Hebei Province as an example. During the research period, the proportion of secondary industry in the GDP of Hebei province decreased from 52% to 45%, and the proportion of tertiary industry in the GDP increased from 33% to 46%. Through the changes in these two indicators, it can be seen that the economic development mode of Hebei Province had transferred from traditional industrial production to the service industry with high added value. The proportion of tertiary industry in GDP exceeded that of secondary industry in GDP, indicating that the economic structure of the province is changing and governments at all levels need to pay close attention to this. In addition, the Hebei provincial government attaches great importance to environmental protection. For example, during the study period, the comprehensive utilization of industrial solid waste increased from 44.67 million tons to 187.41 million tons, and the harmless treatment efficiency of domestic waste rose from 41% to 99%. As these indicators improve, the province is promoting coordinated development between economic growth and environmental protection. Another example is Yunnan Province, an economically underdeveloped region in southwest China. However, during the research period, the urban–rural income ratio index dropped from 4.5 to 3.1, narrowing the gap and promoting the development of the economy in a more coordinated direction. In addition, the ratio of urban and rural public management expenditure to overall public expenditure in Yunnan province increased from 3% in 2004 to 7% in 2013. This shows that governments at all levels have continuously expanded their investment in urban and rural public management, indicating that the people are constantly enjoying the dividends brought about by economic development. In short, for the three-factor regions, all dimensions should be raised for areas of “weak” and “very-weak” degrees, which is not because these three contribution effects perform better than in other regions with moderate or strong development, but because the other two contribution effects (opening-up and innovation) changed little during the study period and have had little impact on high-quality economic development.

4.5.2. Four-Factor Types

Four-Factor Type I (C, S, G, and O)

Four-factor type I (Table 9) including moderately developed Liaoning and Fujian, is dominated by the contribution effects of coordination, sharing, greenness and opening-up. For example, during the study period, the proportion of secondary industry in the GDP of Liaoning Province dropped from 48% to 38%, and the proportion of tertiary industry in GDP increased from 41% to 53%. The focus of economic development was no longer limited to secondary industry, but gradually moved toward a more balanced development of the industrial structure, which promoted the efficiency of high-quality economic development. The urban–rural consumption gap index dropped from 5.35 in 2004 to 3.30 in 2013, indicating that the material living standards gap between urban and rural areas is narrowing. Meanwhile, the overall economic development level of urban and rural areas is also improving. The strong performance of Liaoning Province in the area of coordination reflects the gradual improvement of the proportion of secondary and tertiary industries in GDP, and the narrowing of the gap between urban and rural consumption. Additionally, the case of Fujian, whose low natural gas reserves were negligible but whose usage of natural gas underwent substantial changes in the study period, from 0.04 to 242,393 m3, illustrates the governmental emphasis on clean energy use with continuously strengthened environmental protection awareness. In addition, the number of days with good air quality showed a downward trend (from 358 to 337 days), and the air quality effect showed a negative driving effect, which hindered the contribution of the green dimension to high-quality economic development. Generally speaking, the effects of these four factors make the high-quality economic development of the two provinces of this type relatively small.

Four-Factor Type II (C, S, G, and I)

Four-factor type II (Table 10) includes only one region, Shaanxi, which is less developed, and mainly characterized by the contribution effects of coordination, sharing, greenness and innovation. The urban–rural income ratio index of Shaanxi Province decreased from 4.06 to 2.97 during the study period, indicating that the imbalance of regional economic development is gradually being corrected and the income gap between urban and rural residents is narrowing. At the same time, the Shaanxi provincial government have invested a lot of manpower, material resources and financial resources into social services management. For example, urban and rural public management expenditure as proportion of fiscal expenditure rose from 4% in 2014 to 10%; as the number of higher education institutions increased from 57 to 95 during the study period, the number of people participating in endowment insurance increased 3.62 million to 27.33 million people, and health spending increased as a share of public spending from 4% to 9%. However, the most notable data changes in Shaanxi economic development during the study period were that the secondary industry share of GDP fell from 47% to 46%, and the tertiary industry share of GDP maintained an upward trend (from 39% to 46%), with basically the same level of contribution. This indicates that the province’s economic structure is changing and its transformation and upgrading are at a critical point, when all sectors of society need to pay attention to ensure that the economy of Shaanxi province continues to develop steadily towards high quality. In general, for regions with moderate and weak levels of high-quality economic development, there is still much room for improvement in all aspects, although the first four aspects are the major contributors only because of their relative inadequacy, with the absolute situation of the fifth factor being comparatively better.

4.5.3. Five-Factor Type (C, O, G, I, and S)

The five-factor type (Table 11) is based on the driving effects of coordination, opening-up, greenness, innovation, and sharing, on high-quality economic development. The group comprises Beijing, Jiangsu, Shanghai, Guangdong, Tianjin, Zhejiang, and Shandong, a total of seven regions. These regions are areas with high levels of economic development and very good local economic conditions. Taking Beijing as an example, during the study period, the proportion of the three industries in GDP in Beijing changed significantly (primary industry decreased from 3% to 0.03%, the secondary sector fell from 36% to 19%, and the tertiary sector rose from 62% to 81%); Internet penetration rose from 27% in 2004 to 77% in 2013; R&D investment intensity increased from 5.1 to 6.17; the full-time equivalent of R&D personnel went up from 109,947 to 267,338.4. These data changes prove that as the tertiary industry has become the leading industry in the economic development of the region, scientific and technological innovation and the Internet have turned into new regional growth points and have promoted regional high-quality economic development. Another example is Shanghai, the core area of China’s economic development and an important science and technology center as well as a financial center. During the study period, its GDP ranked among the top, especially in 2018, when it became the first city in China with an economic scale of CNY3 trillion. Compared with other regions, Shanghai was in a leading position in the five aspects of high-quality economic development in China, with no obvious weakness. Jiangsu serves as another example. Located in the eastern coastal area of China, it is an important part of the Yangtze River Delta, with obvious geographical advantages, rich land resources and an important strategic position. Since economic reform and opening-up, the speed and quality of Jiangsu Province’s economic development has been at the forefront within China. The highlight is its export-oriented economy, with foreign exchange income and total foreign investment at the top of the list. Its foreign exchange income increased from USD 1131.87 million to USD 4648.36 million during the study period, ranking fourth only after Guangdong, Beijing and Shanghai according to the 15-year average. Although the proportion of total foreign investment in GDP in this region fell during the study period (from 100% to 79%), its share was still large and ranked among the top in China. Guangdong Province is located in the southern coastal area of China, adjacent to Hong Kong and Macao special administrative regions, with a very advantageous geographical position. It is an economically strong province and occupies a very large proportion of China’s economic aggregate.
As a pioneer of China’s reform and opening-up, the CPC and the central government have provided support and assistance that many inland provinces lacked, enabling Guangdong to achieve a high level of industrial modernization with a reasonable industrial structure, strong high-tech and financial strength, abundant global talent, developed education and an excellent transportation system. In particular, the Pearl River Delta urban agglomeration represented by Guangzhou, Shenzhen, Zhuhai, Dongguan and Foshan has become the most influential and competitive region in China. In the study period, the performance of various indicators in Guangdong Province was better than that in the other regions, and it became the leading region in terms of high-quality economic development in China. Although the performance of the seven inter-provincial regions in these five aspects was better than that of the other regions, and no factor was a shortcoming, some aspects still need to be improved in regions with a moderate development level. For instance, compared to the other five regions, Shandong and Zhejiang had lower average scores of 0.188 and 0.203 in terms of the opening-up dimension. These two provinces have had traditional industrial production modes, with a slow product-updating speed and low added value, resulting in insufficient competitiveness of products in export trade. They share relatively similar structures of products and trade modes. They need to make structural adjustments in terms of import and export trade, getting rid of the traditional ways and increasing the technological content of their products. The average score of Tianjin in the innovation dimension was only 0.194, which was significantly different from the other six regions, an indication of the need to strengthen the high-tech industry and the introduction of scientific and technological talents. In particular, the local government should provide strong support for higher education, talent introduction and the improvement of enterprise innovation ability, by means of financial resources, material resources, policies and regulations. In short, for regions of a medium degree of development, with the five dimensions producing a joint driving force for high-quality economic development, the indicators in all dimensions need to be improved compared to those in regions with a high degree of development.

4.6. Regression Analysis

This paper adopted the path analysis method to clarify the main driving factors of the high-quality economic development index. First, SPSS 22.0 was used to test the normal distribution of the space-–time series data within the high-quality economic development index. Due to the small number of samples, the results obtained by the Shapiro-Wilktest were Sig = 0.263 and Sig = 0.123, respectively, both greater than 0.05 and subject to normal distribution. Therefore, the path analysis method can be applied to study the space–time influencing factors of the national high-quality economic development index. The results are shown in Table 12 and Table 13.
By means of stepwise regression in linear regression, some insignificant independent variables were removed, and the spatial–temporal influencing factors of the national economic high-quality development index were determined as follows: Foreign trade dependence (X1), R&D investment intensity (X2), economic size (X3), urban–rural income ratio (X4), environmental pollution control investment ratio in GDP (X5), Internet penetration rate (X6), comprehensive utilization of industrial solid waste (X7), and proportion of secondary industry in GDP (X8). The analysis results of the influencing factors of the time-change of the national economic high-quality development index from 2004 to 2019 are shown in Table 14.
It can be seen from Table 3 that the influencing factors of the time-change of the national economic high-quality development index are X3, X7 and X8, and the absolute value of the direct path coefficient of each influencing factor is X3, X8 and X7 in descending order, indicating that the economic scale has the greatest influence on the high-quality economic development index, and the higher the economic scale, the greater the index. In terms of the indirect diameter coefficient of each influencing factor, the absolute value of the indirect diameter coefficient of X8’s influence on the national high-quality economic development index through X3 is the largest, while the absolute value of the indirect diameter coefficient of X3’s influence on the index through X8 is the largest. Meanwhile, the absolute value of the indirect path coefficient of X7’s influence on the index through X3 is the largest. In terms of the total influence coefficient of each influencing factor, the variables that have the greatest influence on the time-change of the national high-quality economic development index are X8, X3 and X7 in descending order.
As the spatial distribution pattern of the national high-quality economic development index was basically stable in different years, the index of dependent variables and the mean value of the independent variables from 2004 to 2019 were calculated to analyze the influencing factors of the spatial distribution of the index. The results are shown in Table 15.
Table 15 shows that the influencing factors of the spatial distribution of the national high-quality economic development index are X1, X2, X3, X4, X5, X6, and X7. Additionally, the absolute value of the direct path coefficient of each influencing factor is X3, X2, X4, X6, X5, X1, and X7 in order from large to small, suggesting that X3 has the greatest influence on the index. In addition to the urban–rural income ratio, the remaining influencing factors have a direct positive impact on the index, indicating that with the advancement of urbanization, the scale of migrant population continues to expand, resulting in the income of urban population being greater than that of the rural population, namely the urban–rural income ratio imbalance, with the index significantly reduced. In terms of the indirect diameter coefficient of each influencing factor, the absolute value of the indirect diameter coefficient of X1, X4, X5 and X6 affecting the index through X3 is the largest, and the absolute value of the indirect diameter coefficient of X2 affecting the index through X4 is the largest. X3 has the largest absolute value of the indirect path coefficient affecting the index through X6, while X7 has the largest absolute value of the indirect path coefficient affecting the index through X2. In terms of the total influence coefficient of each influencing factor, the variables that have greater influence on the spatial distribution of the index are X1, X6, X3, X4, X2, X7 and X5, in descending order. To sum up, the main reasons affecting the spatial-temporal changes of national high-quality economic development are as follows:
(1) Economic strength is the direct driving force of high-quality economic development. The level of regional high-quality development is directly related to the economic capabilities of the region. It can be seen from the above analysis that regions with strong economic force, superior geographical location, abundant resources and information, and convenient introduction of talents, capital and technology, often score relatively highly in the comprehensive level of high-quality development.
(2) Green development is the foundation for high-quality economic development. Green development is a key indicator of regional development. A region with a high level of green development can provide advantageous basic conditions for the regional high-quality economy, supporting management of environmental pollution and optimizing energy efficiency. In addition, the resource environmental bearing capacity of areas with a good green development foundation also tend to have a congenital advantage in terms of a relatively high degree of urban greening as well as fine weather, and low environmental pressures per unit of land area, which tend to exert an evident effect on raising the regional high-quality economic development level.
(3) Industrial structure is an important support for high-quality economic development. Reasonable industrial structure makes a difference in the sustained and healthy development of a regional economy. A smaller proportion of backward production capacity and a larger proportion of various new and high-technology industries, energy conservation and environmental protection industries, and new energy industries, can improve regional levels of high-quality economic development.
(4) Geographical location is an indirect cause of high-quality economic development. From the perspective of the above research, an economically active region with superior geographical position, has obvious advantages compared with other areas in the aspect of opening-up to the outside. Regions such as Guangdong, Zhejiang, and Shanghai along the coast have the advantage of ports, and together they constitute an important trade and logistics center. These regions where the high-quality economic development level is relatively higher have relatively abundant financial income and make heavier infrastructure investments in construction and environmental protection.

5. Conclusions and Policy Suggestions

5.1. Discussion

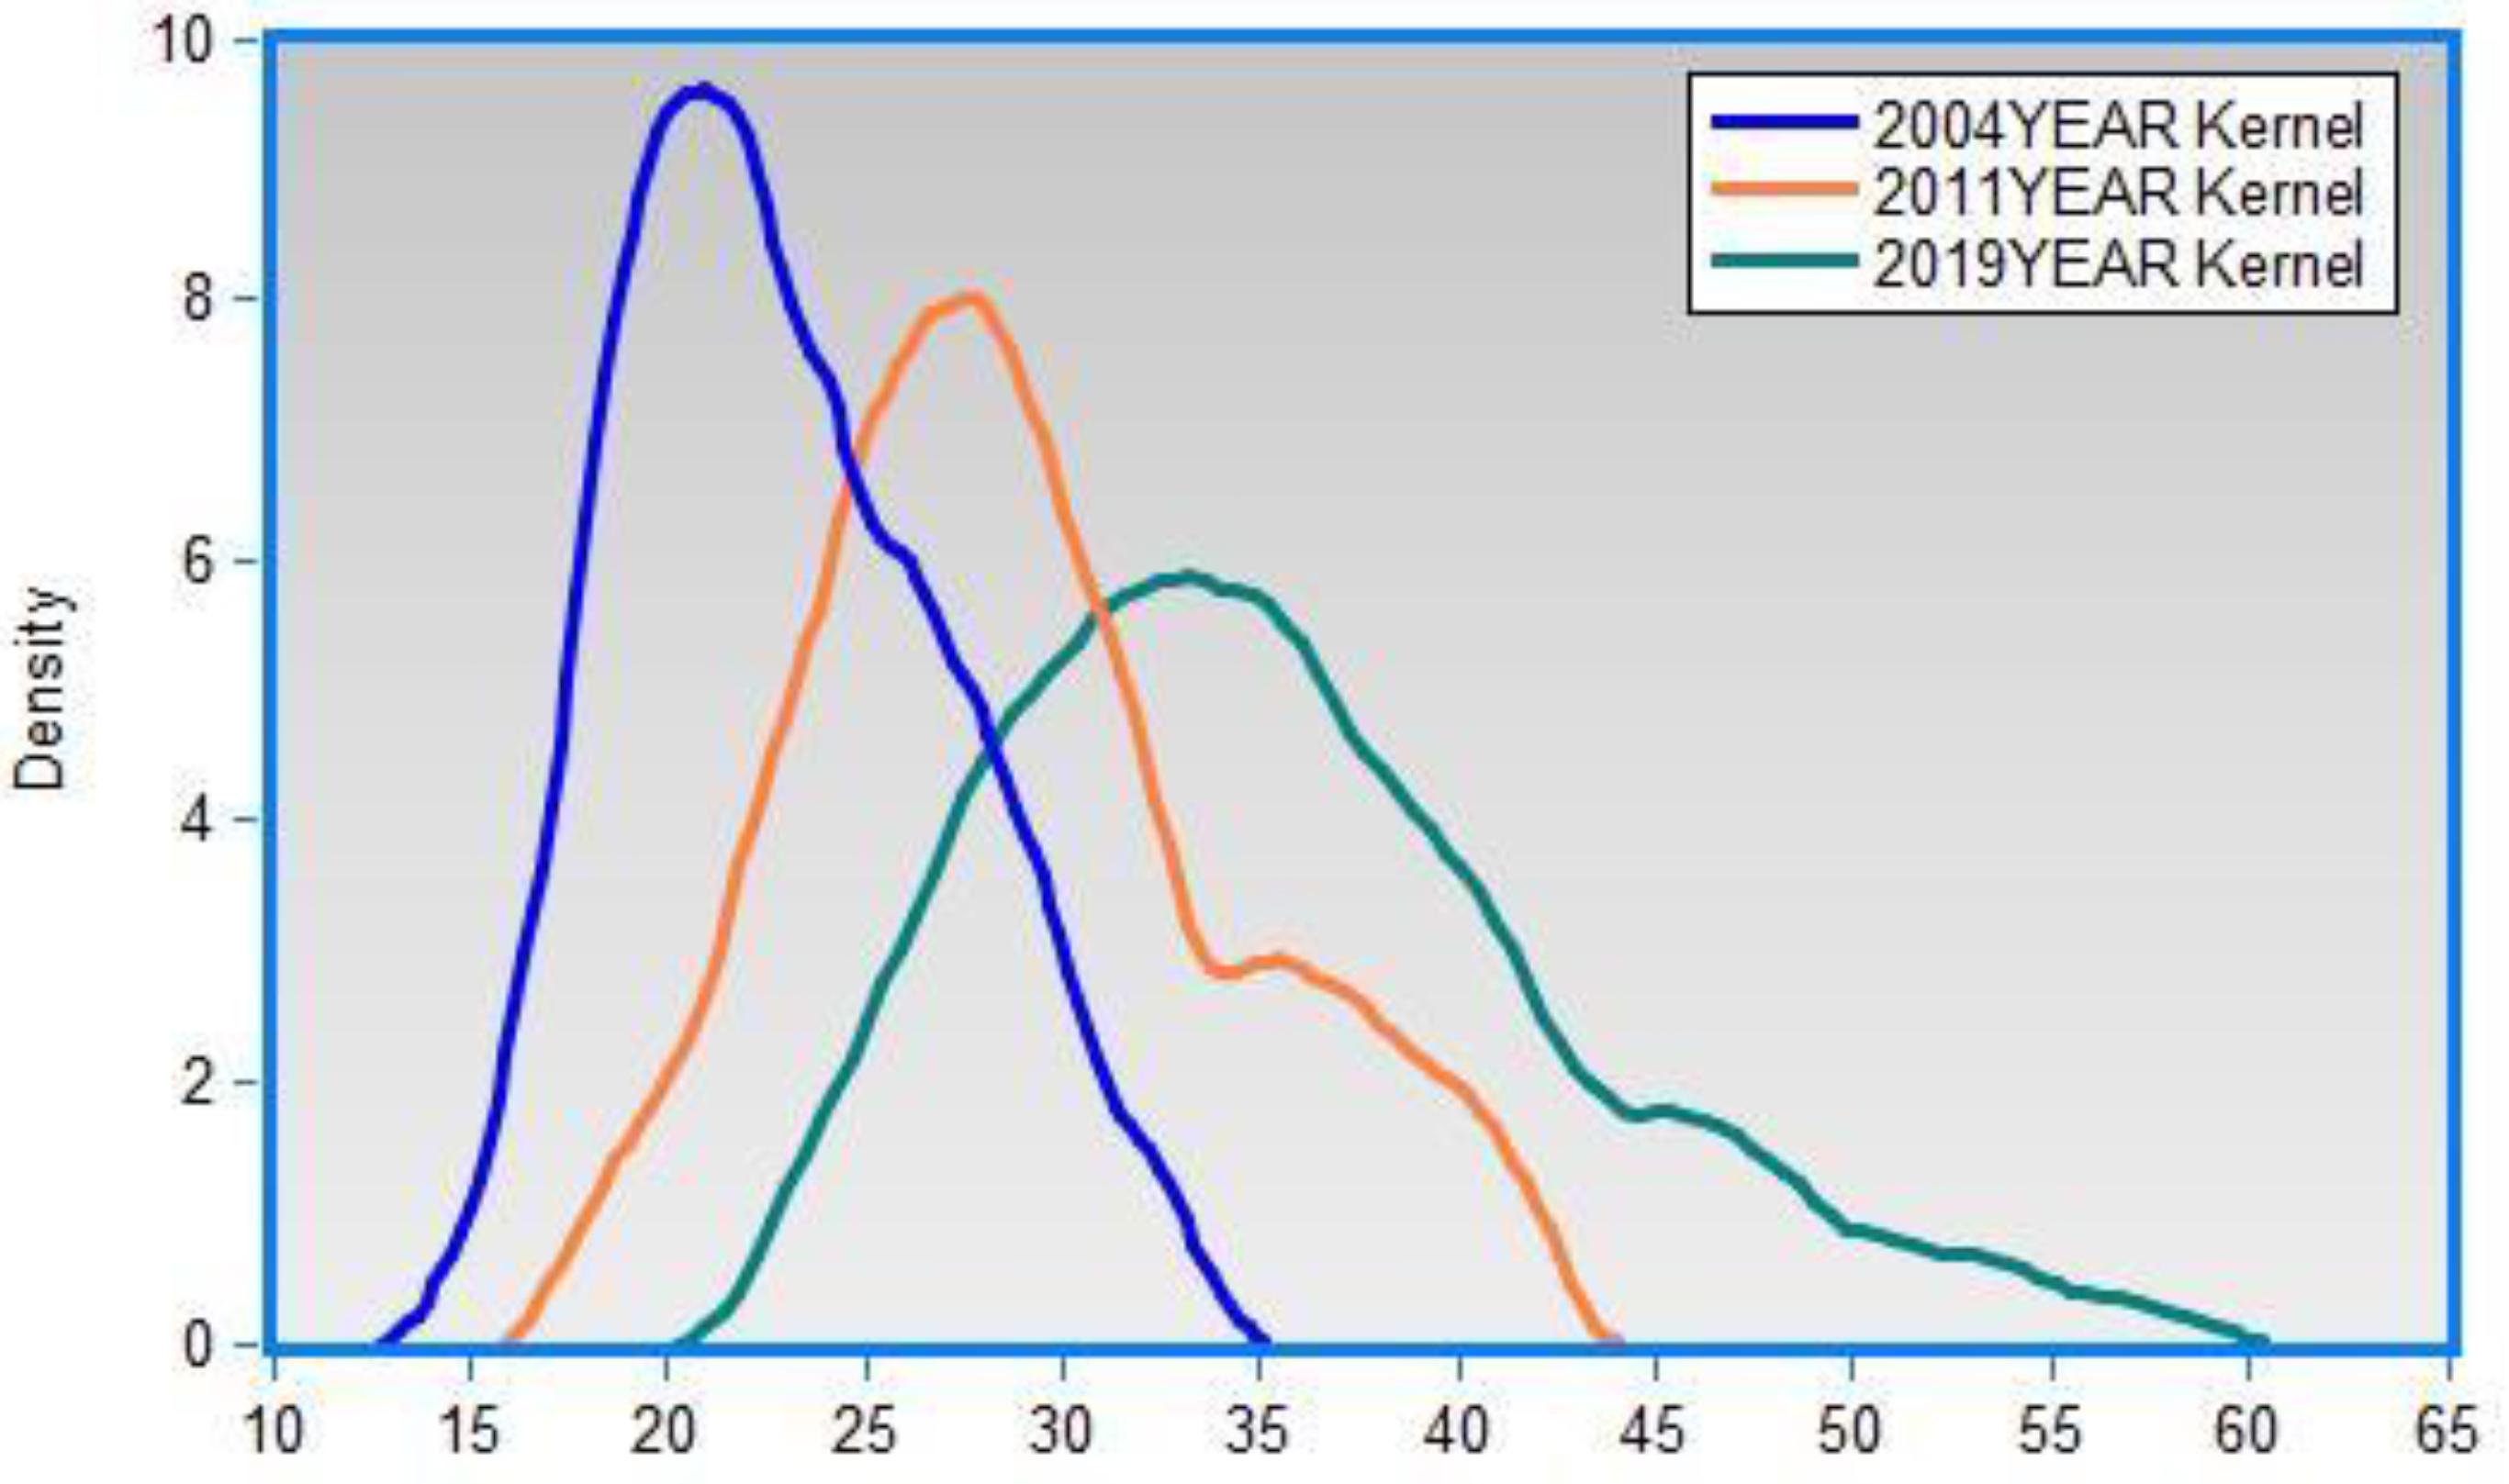
First, on the basis of previous studies, an evaluation index system of China’s high-quality economic development was constructed by adjusting certain indicators according to the actual economic situation of China’s provinces and regions. This study measured and calculated the development level of 30 provinces and regions in China from 2004 to 2019. The results showed scores between 0.167 and 0.540, and the overall level fluctuated year by year but presented a steady growth trend, indicative of a significant improvement in China’s high-quality economic development.
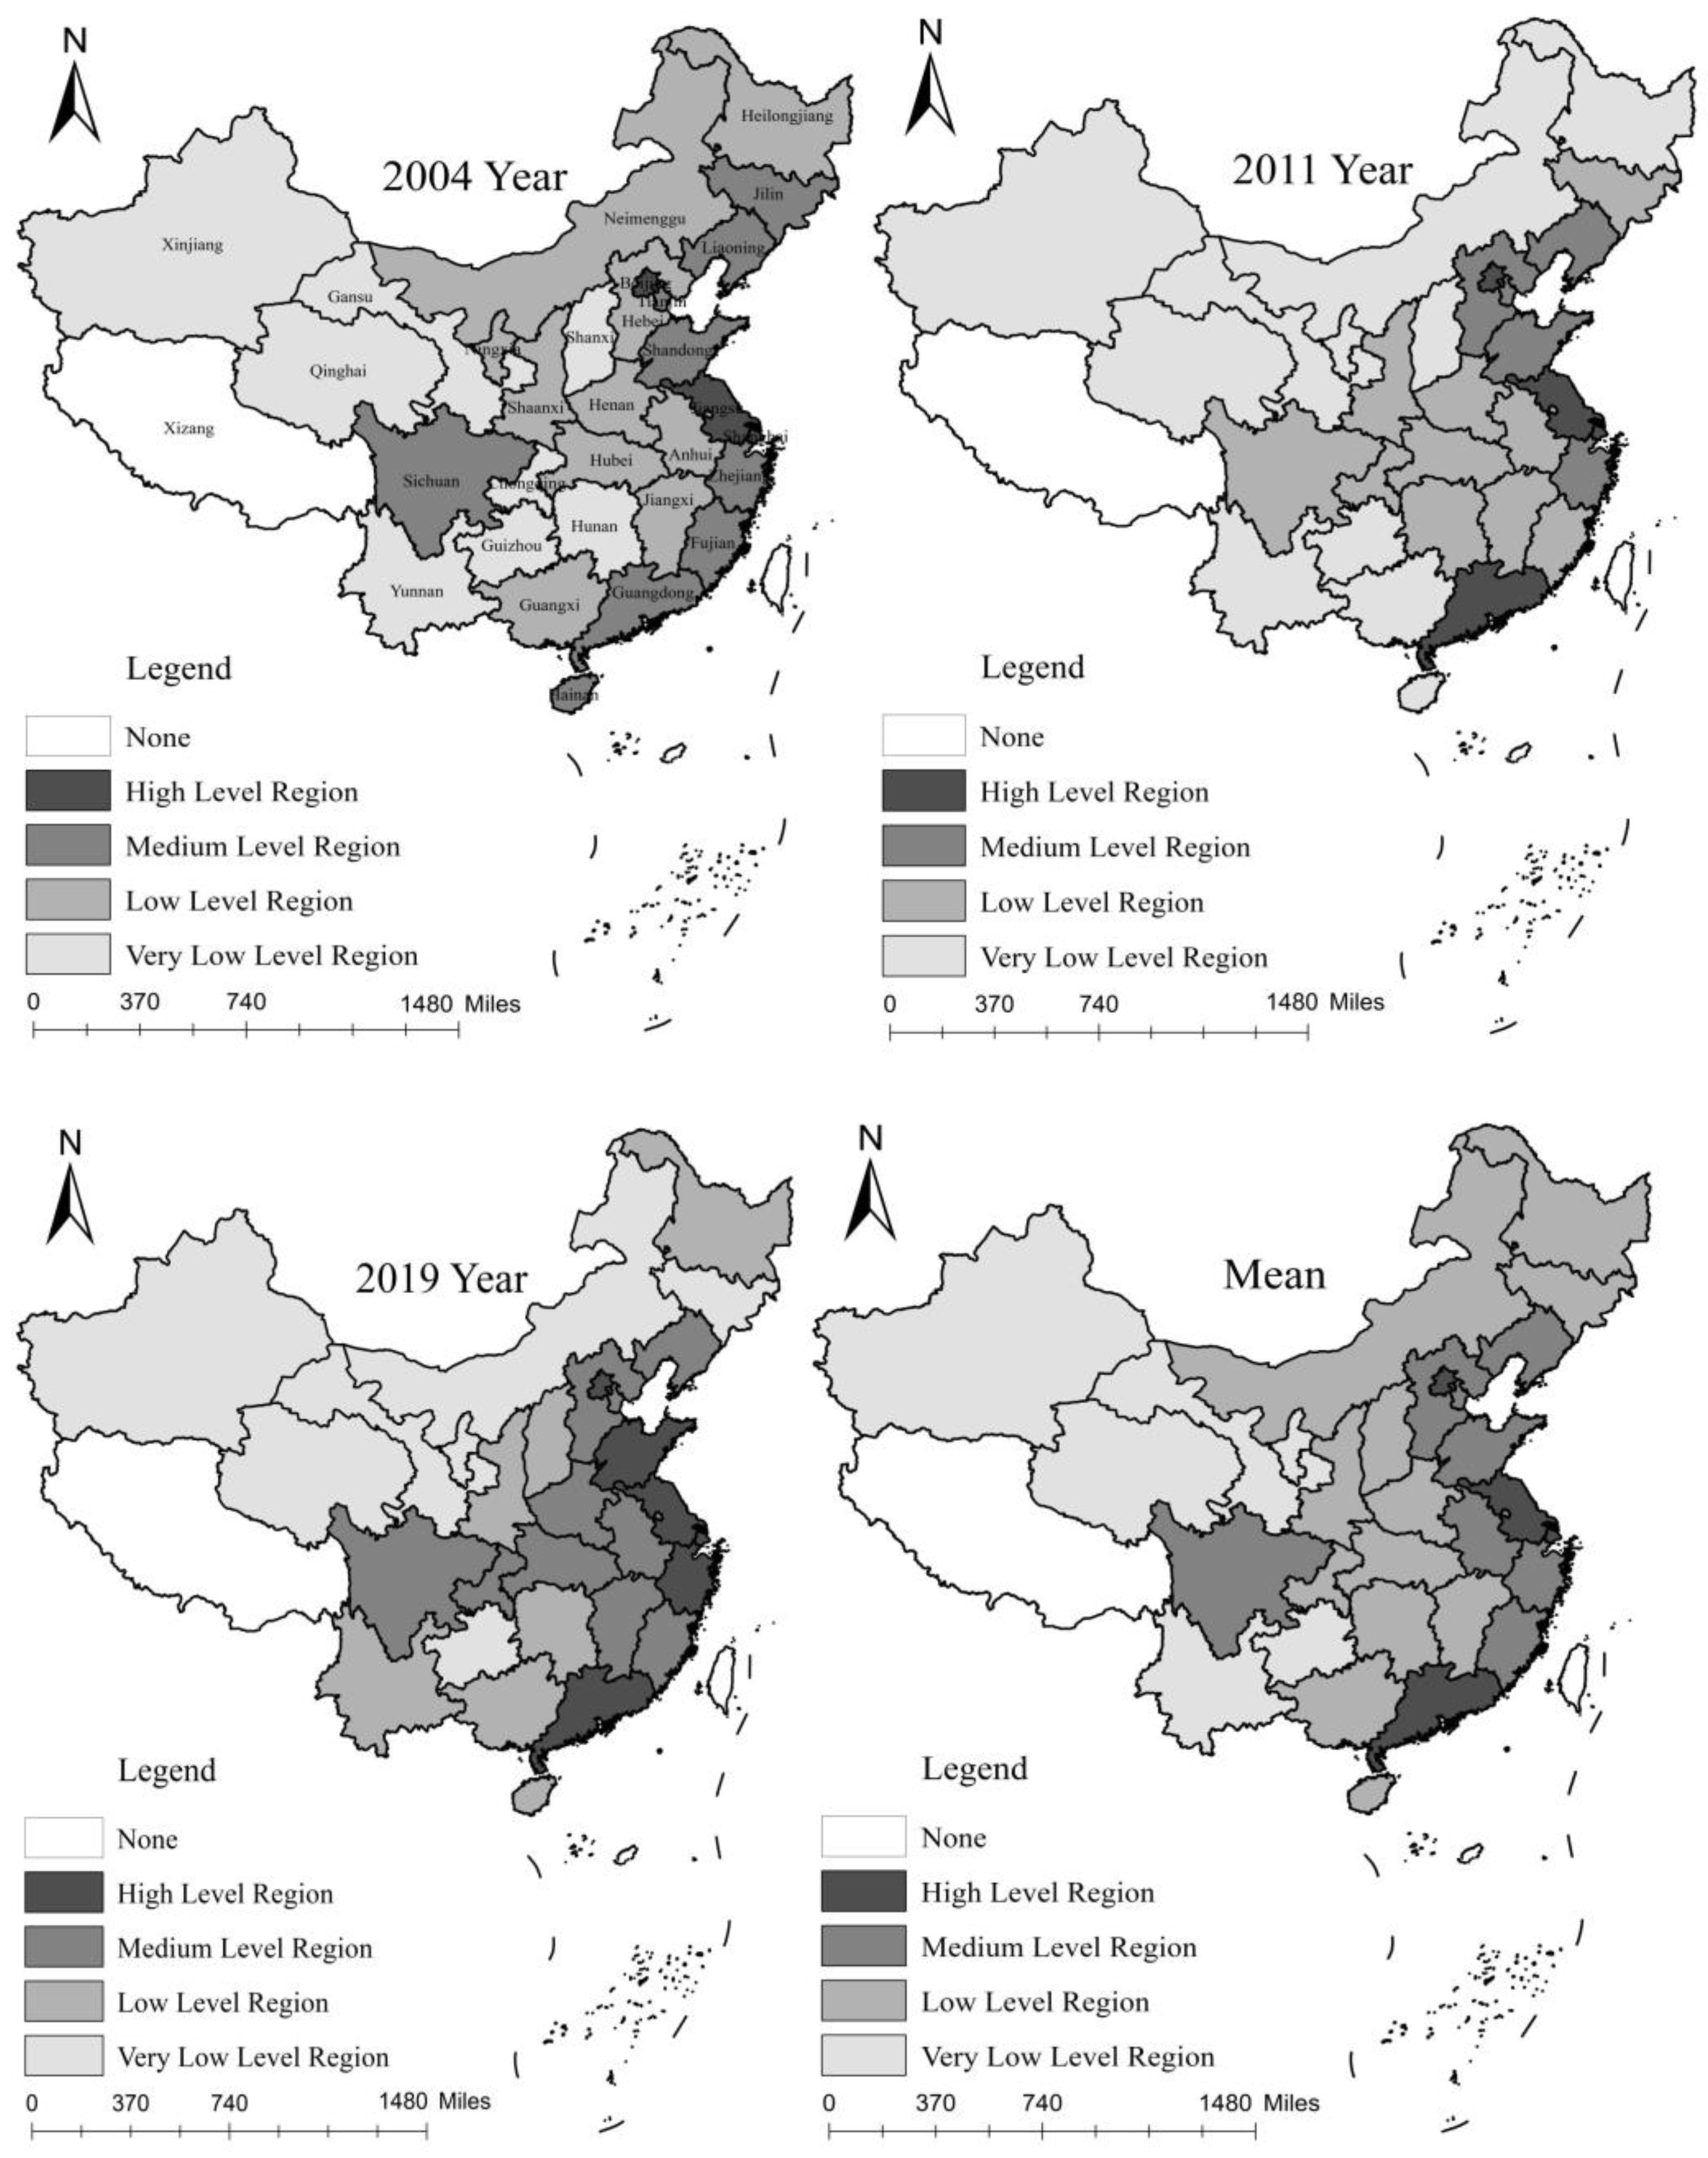
Second, the temporal evolution trend and spatial clustering analysis in this paper revealed that temporal evolution showed a trend of polarizing among provinces and regions. Although the polarization was alleviated with the passage of time, the development situation was very severe. The clustering analysis showed a spatial aggregation phenomenon in that the degree of high-quality economic development in eastern and eastern coastal regions was obviously better than that in other administrative regions, and the degree of development could be divided into four categories: strong, medium, weak and very weak. The evaluation index system and research method used in this paper focused on comparison of high-quality economic development in different regions, rather than the absolute value for each region, but they can reflect the general trend and pave the way for further evaluation of high-quality economic development in individual regions.
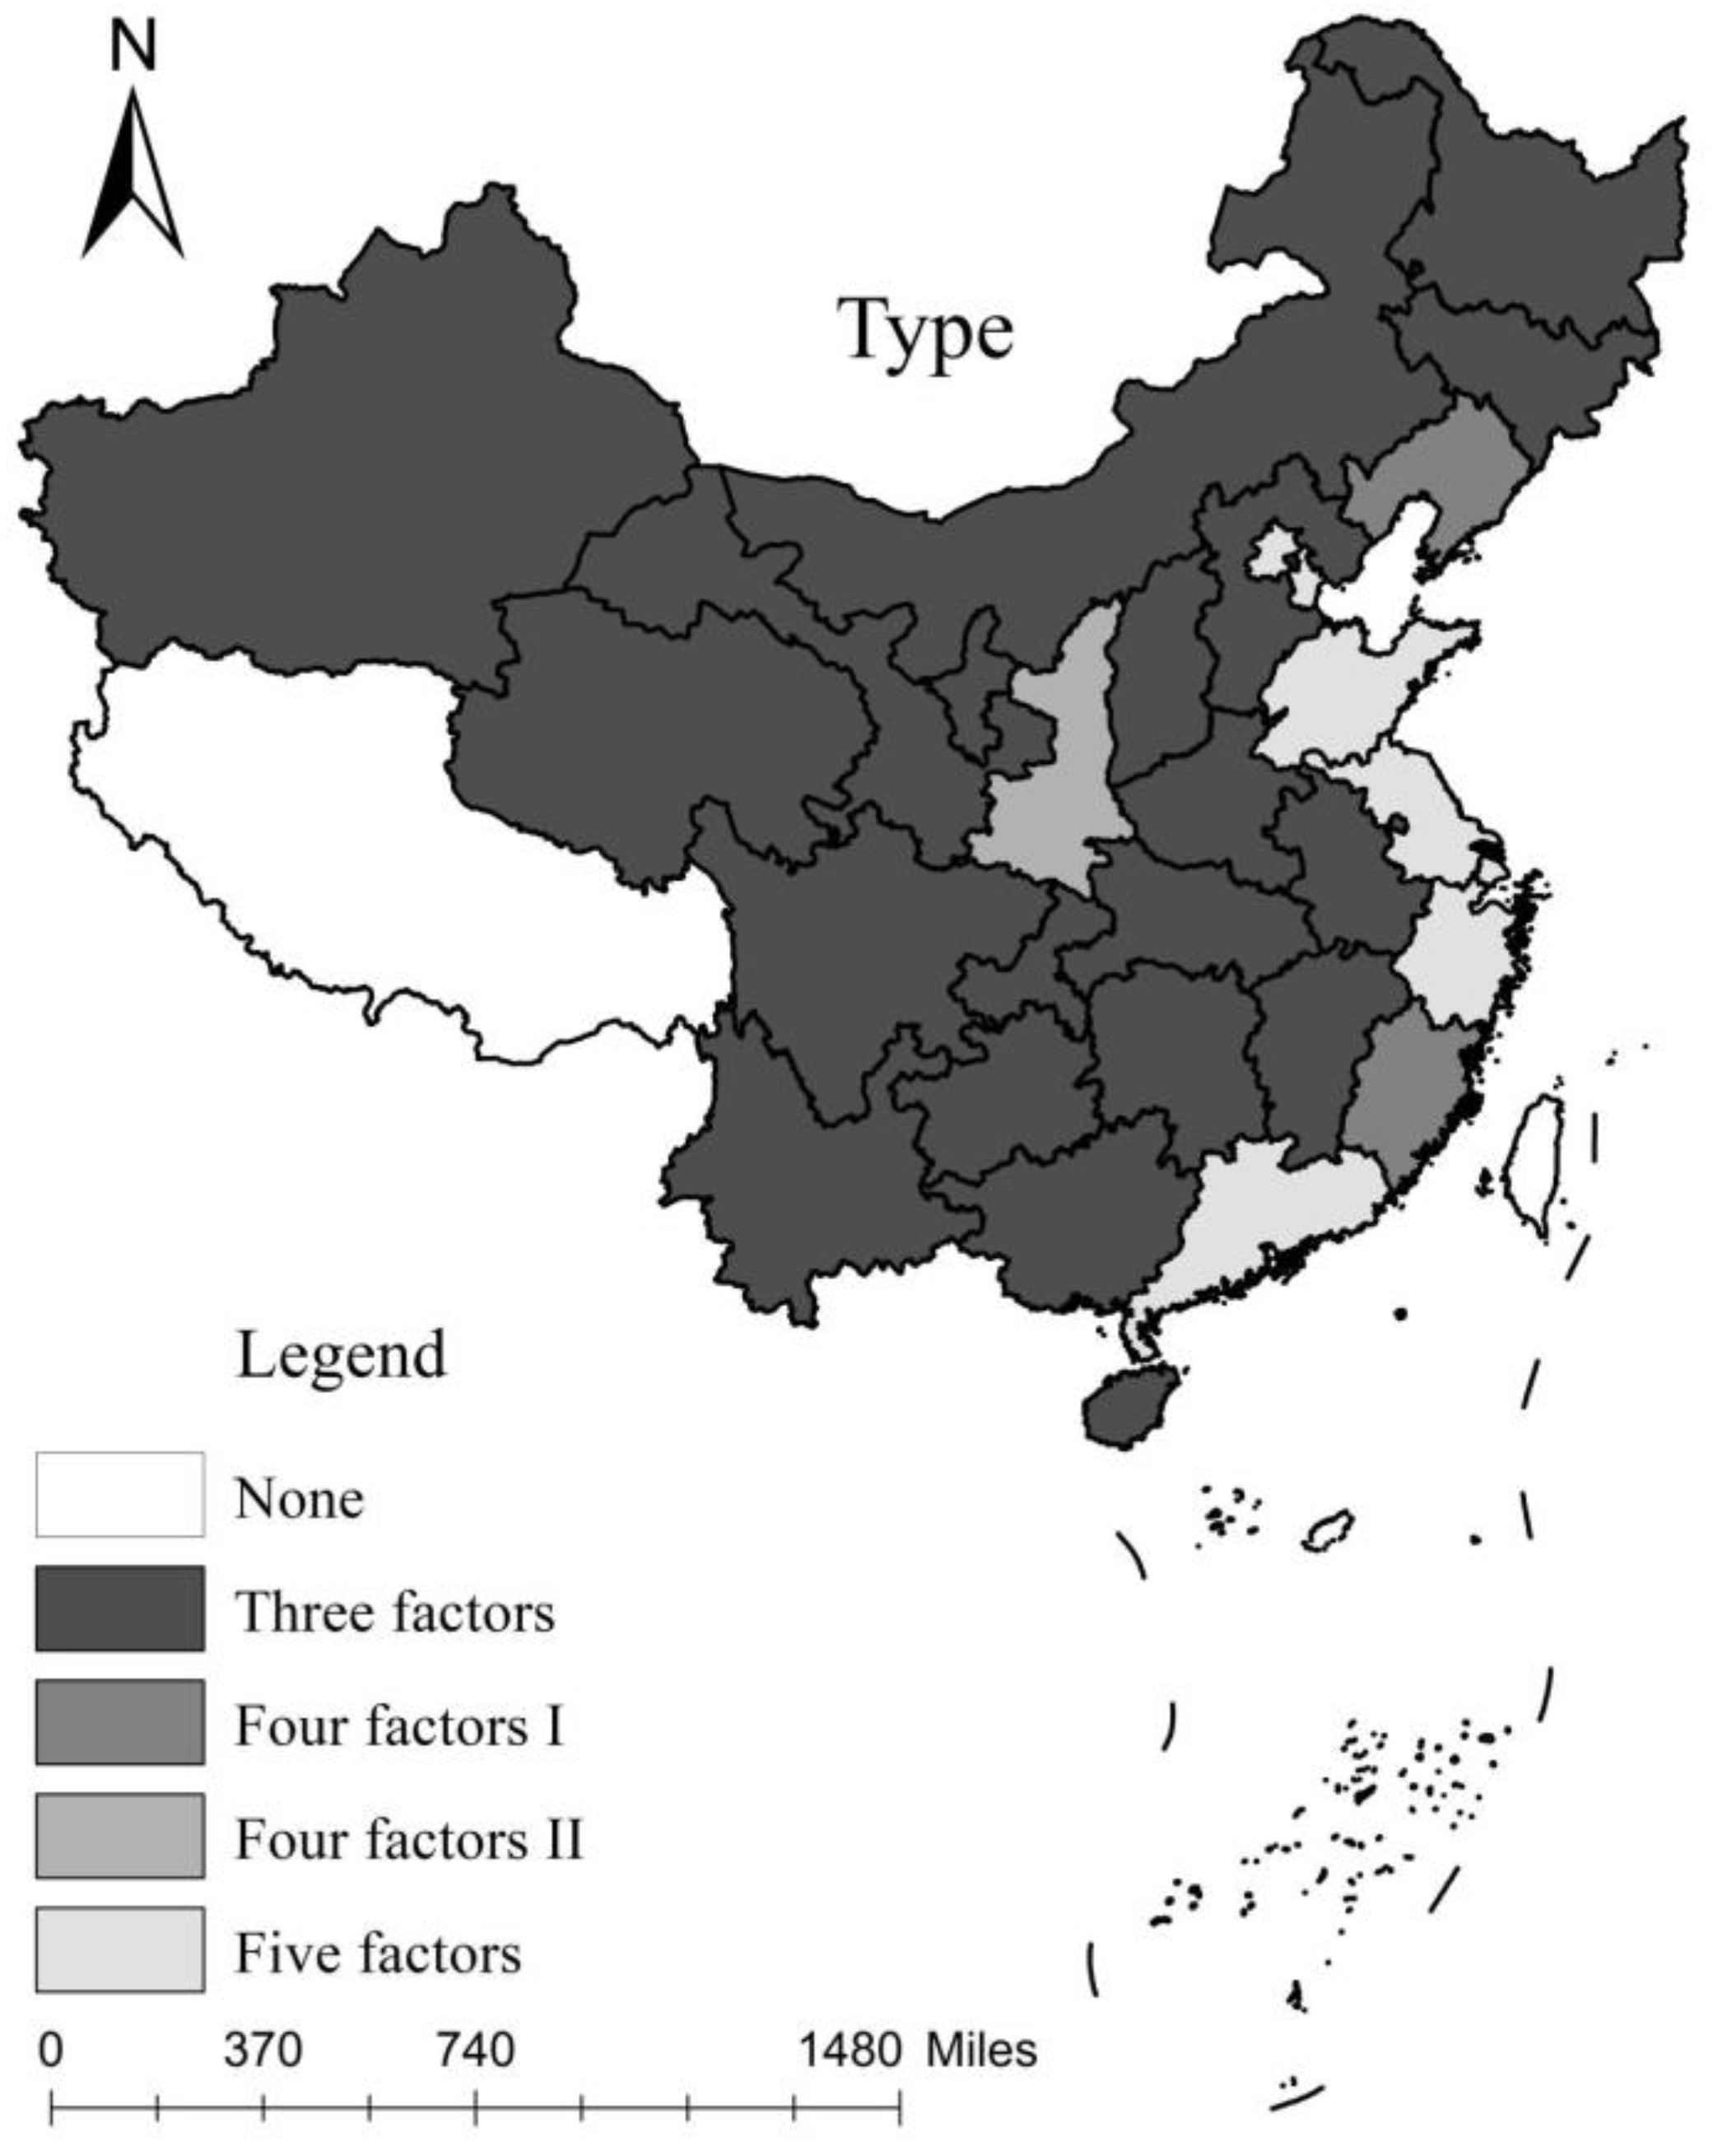
Third, the LSE method was adopted to calculate and analyze the contribution rate of five factors, namely innovation, coordination, greenness, sharing and opening-up, in the high-quality development of the provincial economy. The results are divided into four contribution types: three-factors type, four-factors type I, four-factors type II, and five factors type. The purpose of this was to reveal the contribution factors and spatial distribution laws of different contribution types, and to provide necessary theoretical reference for relevant departments to implement high-quality economic development in accordance with local conditions.

5.2. Policy Suggestions

Overall, with the existence of apparent regional discrepancy, the overall level of high-quality economic development was relatively low in the 30 provinces. Problems encountered in the central and western regions include an unreasonable industrial structure, a low level of social and economic development, inefficient management of high-quality economic development by governments, insufficient capital investment, and weak awareness of high-quality development among residents. In the future, the Chinese government should take the “five development concepts” as the basis to promote effectively the implementation of innovation-driven strategy, and release the dividend of technological innovation, so as to provide strong support for China’s long-term economic growth.
(1) Green development will continue to be pursued, to make the economy greener, promote green production methods, fuel the upgrading of green industries, and form new economic growth points. Governments should legislate to give priority to ecology and focus on commerce and trade circulation, e-commerce and other modern service industries, vigorously expanding the development space for green industry. Governments need to facilitate to the greatest possible degree the introduction of foreign capital and technology, to cultivate more brands of green products increasing their green value, to eliminate trade barriers, and to promote regional green trade.
(2) Provinces and regions with high levels of development should devote great efforts to optimizing their industrial structures, increasing investment in scientific and technological innovation and continuously raising awareness of high-quality economic development within government at all levels. It is of necessity to constantly increase financial support for environmental protection and investment in environmental pollution control, and to improve the mechanism for managing the coordinated development of the ecological environment and the economy. Moreover, there is an urgent need to transform and upgrade the traditional manufacturing industry by taking advantage of location, talent introduction and high-tech industry development. In the meantime, economically developed areas should play a distributive role in integrating superior resources and driving the development of less advanced areas.
(3) Moderately developed areas need to improve the ecological environment as well as the quality of life of their residents. They must rationally plan and use water, land and other natural resources, and enhance the level of agricultural and industrial modernization. Underdeveloped regions should improve the product structure of their primary and secondary industries and enhance the competitiveness of these sectors. Enterprises in the primary and secondary industries should actively implement the development mode of high production capacity and low consumption. The government should play a leading role, especially in the aspect of policy and funding support for expanding capital investment and infrastructure construction, increasing the all-resident per capita income and narrowing the proportional gap between urban and rural income.

6. Conclusions

In this paper, we conducted a preliminary study of the evaluation methods of high-quality economic development in 30 regions of China. There are several issues for further research. First, the conclusions of this paper are based on provincial panel data from 2004 to 2019. With panel data of urban or rural areas using a longer time-period, the internal differences and evolution trends of regional levels of high-quality economic development can be further and more comprehensively analyzed. Second, in the future, it will be necessary to use other indicators, evaluation criteria and methods to test the robustness and reliability of existing analytical methods. Finally, the LSE method is “data-driven” in nature, mainly due to the lack of a data statistics description in the theory of model interpretation. Considering the spatial impact, exploratory spatial data analysis (ESDA)-identifying spatial data analysis methods can further explain regional differences in levels of high-quality economic development.

Author Contributions

B.Z. provided various data and software needed for the manuscript, formal analysis, guided the overall idea of the paper and wrote this paper; N.W., R.X. and W.L. (Wenxin Liu), funding, analysis methods, related indicators, and article revision. Z.Z., W.L. (Weinan Lu) and L.L. investigation, software. and revision. All authors have read and agreed to the published version of the manuscript.

Funding

This research was funded by Social Science Major Project of Shaanxi Province: 2022ND0280, 2021ND0378; Social Science Foundation of Ministry of Education: 21YJC630086; Research Funds of Northwest A&F University (Z1090220194), Natural Science Basic Research Program of Shaanxi: 2020JQ-282.

Institutional Review Board Statement

This study mainly focused on models and data analysis and did not involve human factors considered dangerous. Therefore, ethical review and approval were waived for this study.

Informed Consent Statement

Not applicable.

Data Availability Statement

Data are available on request due to restrictions, e.g., privacy or ethical. The data presented in this study are available on request from others authors. The data are not publicly available due to the strict management of various data and technical resources within the research teams.

Conflicts of Interest

The authors declare no conflict of interest.

Appendix A

The important aspects of AHP weight of each index in this study include experienced judgment and expert consultation. In the evaluation of AHP, Table A1, Table A2, Table A3, Table A4 and Table A5 shows the comparison matrix of regions with similar weights of each index. Experts’ personal information is confidential.
Table A1. Pairwise comparison matrix of Innovation.
I1I2I3I4I5Weight
I1131/2210.239
I2 11120.177
I3 1220.291
I4 110.146
I5 10.146
Table A2. Pairwise comparison matrix of Coordination.
C1C2C3C4C5C6Weight
C11123230.279
C2 111220.194
C3 11220.172
C4 1230.172
C5 120.109
C6 10.075
Table A3. Pairwise comparison matrix of Greenness.
G1G2G3G4G5G6Weight
G112121/330.195
G2 1111/230.148
G3 111/210.155
G4 11/210.123
G5 120.295
G6 10.085
Table A4. Pairwise comparison matrix of Sharing.
S1S2S3S4S5S6Weight
S112231/240.253
S2 121/21/230.142
S3 11/21/230.113
S4 11/320.146
S5 120.283
S6 10.065
Table A5. Pairwise comparison matrix of Opening-up.
O1O2O3O4O5Weight
O1122220.318
O2 12320.261
O3 1320.198
O4 120.117
O5 10.105

References

  1. Ba, X.; Shi, P.; Liu, Y. Society: Realizing China’s urban dream. Nature 2014, 509, 158–160. [Google Scholar] [CrossRef] [PubMed] [Green Version]
  2. Wan, J.J.; Ma, C.C.; Tan, J.; Su, Y.; Zhang, L.; Song, X.; Sun, H.; Wang, Z.; Zhao, Y.; Zhang, K.; et al. Measurement of Coupling Coordination Degree and Spatio-Temporal Characteristics of the Social Economy and Ecological Environment in the Chengdu–Chongqing Urban Agglomeration under High-Quality Development. Int. J. Environ. Res. Public Health 2021, 18, 11629. [Google Scholar] [CrossRef] [PubMed]
  3. Ren, B.X. Research on the Measurement and Realization Path of High-Quality Development of Chinese Provincial Economy: From the Micro Perspective of Use Value. China Soft Sci. 2020, 10, 175–183. [Google Scholar]
  4. Wang, M.; Huang, Y. China’s Environmental Pollution and Economic Growth. China Econ. Q. 2015, 14, 557–578. [Google Scholar]
  5. Cui, Y.; Liu, W.X.; Cai, Y.; Zhu, J.; Zhao, M.J. Has the Efficiency of Rural Green Development Converged in China?—An Empirical Analysis from 1997 to 2017. J. Agrotech. Econ. 2021, 2, 72–87. [Google Scholar]
  6. Hao, C.X.; Shao, C.F.; Don, Z.F.; Zhao, Y.H. Analysis on 2020 Global Environmental Performance Index Report. Environ. Prot. 2020, 48, 68–72. [Google Scholar]
  7. Chen, C.; Zhao, Y.H.; Hao, C.X. Analysis on 2020 Global Environmental Performance Index Report and Suggestions. Environ. Prot. 2021, 49, 69–74. [Google Scholar]
  8. Li, K. Study on the Measurement of Economic High-Quality Development Level in China; Zhongnan University of Economics and Law: Wuhan, China, 2019. [Google Scholar]
  9. Zhou, X.; Cai, Z.M.; Tan, K.H.; Zhang, L.; Du, J.; Song, M. Technological innovation and structural change for economic development in China as an emerging market. Technol. Forecast. Soc. Chang. 2021, 167, 120671. [Google Scholar] [CrossRef]
  10. Hussain, M.; Mahmood, N.; Chen, F.; Khan, Z.; Usman, M. Comparative re-estimation of environmental degradation and population density in China: Evidence from the Maki’s regime shift approach. Rev. Econ. Mund. 2021, 58, 29–50. [Google Scholar] [CrossRef]
  11. Cao, X.; Feng, L. Research on the Development Strategy of China’s Financial Market after RMB Joins SDR. Econ. Probl. 2019, 3, 17–22. [Google Scholar]
  12. Feng, L.; Cao, X. To Break the Problem of the Ecological Civilization Construction to Promote the High-quality Economic Development. J. Jiangxi Norm. Univ. (Philos. Soc. Sci. Ed.) 2018, 51, 74–80. [Google Scholar]
  13. Wang, X.H. Research on the High-Quality Development of China’s Economy; Jilin University: Jilin, China, 2019. [Google Scholar]
  14. Feng, M.L. Research on China’s High Quality Development and Innovation System; Southwestern University of Finance and Economics: Chengdu, China, 2018. [Google Scholar]
  15. Guan, H.L.; Zhan, Y.R. Measurement and Evaluation of the Coupling Coordination of Environmental Regulation and High-Quality Economic Development. Ecol. Econ. 2022, 38, 169–176. [Google Scholar]
  16. Miao, J.W. Research on the Impact of Science and Technology Innovation on High Quality Economic Development; Beijing Jiaotong University: Beijing, China, 2021. [Google Scholar]
  17. Sun, J.W.; Jiang, Z. Paths of high-quality development in China’s coastal areas. Acta Geogr. Sin. 2021, 76, 277–294. [Google Scholar]
  18. Lu, D.D. Moderate-speed growth: Sustainable development of China’s economy. Sci. Geogr. Sin. 2015, 35, 1207–1219. [Google Scholar]
  19. Jin, B. Study on the "high-quality development" economics. China Ind. Econ. 2018, 4, 5–18. [Google Scholar]
  20. Jian, X.H.; Nie, C.F. Measurement of China’s High-quality Development: 1978–2018. Economist 2020, 6, 49–58. [Google Scholar]
  21. Zhang, J.K.; Hou, Y.Z.; Liu, P.L. High-quality development goals, requirements and strategic path. Manag. World 2019, 35, 1–7. [Google Scholar]
  22. Liu, S.M.; Zhang, S.J.; Zhu, H.D. Study on the measurement and high-quality economy development effect of nation al innovation driving force. J. Quant. Tech. Econ. 2019, 36, 3–23. [Google Scholar]
  23. Li, W. Six connotations of high-quality development. China Chief Financ. Off. 2018, 16, 9. [Google Scholar]
  24. Zhao, Y. Financial Development, Capital Allocation Efficiency and High-quality Economic Development: An Empirical Study Based on Urban Data in China. Financ. Theory Pract. 2019, 9, 17–25. [Google Scholar]
  25. Liu, W.J.; Wang, H.B. Analysis of the Impact of Local Debt on High Quality Development of Economy. J. Yunnan Univ. Financ. Econ. 2018, 34, 73–85. [Google Scholar]
  26. Magazzino, C.; Mele, M. On the relationship between transportation infrastructure and economic development in China. Res. Transp. Econ. 2020, 88, 100947. [Google Scholar] [CrossRef]
  27. Thomas, V. The Quality of Growth; China Financial & Economic Publishing House: Beijing, China, 2001. [Google Scholar]
  28. Khan, Z.; Hussain, M.; Shahbaz, M.; Yang, S.; Jiao, Z. Natural resource abundance, technological innovation, and human capital nexus with financial development: A case study of China. Resour. Policy 2020, 65, 101585. [Google Scholar] [CrossRef]
  29. Mlachila, M.; Tapsoba, R.; Tapsoba, S. A Quality of Growth Index for Developing Countries: A Proposal. Soc. Indic. Res. 2017, 134, 675–710. [Google Scholar] [CrossRef]
  30. Martinez, M.; Mlachila, M. The Quality of the Recent High-Growth Episode in Sub-Saharan Africa. IMF Work. Pap. 2013, 13, 53. [Google Scholar]
  31. Shi, F.; Fan, S.C. Measurement and Analysis of High-quality Development Potential of Chinese Provincial Economy. Southeast Acad. Res. 2020, 4, 169–179. [Google Scholar]
  32. Hu, C.H.; Li, Q. Industrial Upgrading, Spatial Spillover and Economic Growth Quality—Empirical Analysis Based on Space Dubin Model. J. Chongqing Technol. Bus. Univ. (Soc. Sci. Ed.) 2018, 35, 73–80. [Google Scholar]
  33. Song, M.S.; Zhang, X.; Yi, R.H.; Zhu, T.T. A Study on the Evaluation System of the Quality of Economic Development and Its Applications. Economist 2015, 2, 35–43. [Google Scholar]
  34. Zhan, X.Y.; Cui, P.P. Estimation and Evaluation of China’s Provincial Quality of Economic Growth—Empirical Analysis Based on “Five Development Concepts”. Public Financ. Res. 2016, 8, 40–53. [Google Scholar]
  35. Mei, L.H.; Chen, Z.H. The convergence analysis of regional growth differences in China: The perspective of the quality of economic growth. J. Serv. Sci. Manag. 2016, 9, 453–476. [Google Scholar] [CrossRef] [Green Version]
  36. Hu, C.P.; Lu, Z. Measurement of High-quality Economic Development and International Comparative Study-Empirical Analysis Based on 35 Countries. J. Subei 2020, 27, 91–100. [Google Scholar]
  37. Li, J.J.; Jing, Y.J. Research on Green Development Efficiency Evaluation and Spatial-Temporal Differentiation Based on SBM-GIS; Take the Central Plains Urban Agglomeration as an Example. Ecol. Econ. 2019, 35, 94–101. [Google Scholar]
  38. Zhou, B.Y.; Liu, W.X.; Lu, W.N.; Zhao, M.J.; Li, L.F. Application of OECD LSE Framework to Assess Spatial Differences in Rural Green Development in the Arid Shaanxi Province, China. Int. J. Environ. Res. Public Health 2020, 17, 286. [Google Scholar] [CrossRef] [PubMed] [Green Version]
  39. Zhang, Y.G. Application of minimum variance method in classification of agricultural type (or agricultural area)—A case study of structural type classification of grain crops in China. Econ. Geogr. 1986, 6, 49–55. [Google Scholar]
  40. Yu, T.Y.; Chen, Q. Estimation and Evaluation of China’s Provincial Marine Economic Growth Quality—Empirical Analysis Based on “Five Development Concepts”. Sci. Technol. Econ. 2020, 33, 91–95. [Google Scholar]
  41. Carchano, M.; Carrasco, I.; Castillo, S.; García-Cortijo, M.C. The Social Economy as a Factor of Economic Development and Resilience of Population in Rural Areas-A Study of Mediating Effects in Castilla-La Mancha (Spain). Sustainability 2021, 13, 5544. [Google Scholar] [CrossRef]
  42. Li, Q. Construction and measurement of economic high quality development evaluation index system. Stat. Decis. 2021, 37, 109–113. [Google Scholar]
  43. Liu, H.D.; Liu, T. Research on Coupling Coordination Degree between Innovation-driven and High-quality Economic Development. Sci. Technol. Prog. Policy 2020, 37, 64–71. [Google Scholar]
  44. Wei, M.; Li, S.H. Construction and Measurement of China’s Economic Growth Quality Evaluation System under the New Normal. Economist 2018, 4, 19–26. [Google Scholar]
  45. Zhao, R.Y.; Chang, Z.L. The spatial difference of high-quality economic development and the identification of influencing factors. Res. Financ. Econ. Issues 2020, 10, 22–29. [Google Scholar]
  46. Sun, P.L.; Guo, Z.H. Analysis of spatial difference and influencing factors of high-quality economic development. Stat. Decis. 2021, 37, 123–125. [Google Scholar]
  47. Tang, X.B.; Wang, Y.N.; Tang, X.W. A Research on the Evaluation of High-quality Development of Provincial Economy in China. Sci. Res. Manag. 2020, 41, 44–55. [Google Scholar]
  48. Duan, X.; Ren, Q.L.; Li, M.R. Research on the Influence of Social Capital on the High-Quality Development Level of Economy in the Yellow River Basin. Yellow River 2021, 43, 15–21. [Google Scholar]
  49. Zhou, Z.B.; Deng, L.; Xiao, H.L.; Wu, S.J.; Liu, W.B. The Impact of Foreign Direct Investment on China’s High-quality Economic Development——Index DEA and Panel Partition Regression Analysis. Chin. J. Manag. Sci. 2022, 13, 11911. [Google Scholar]
  50. Ma, R.; Luo, H.; Wang, H.W.; Wang, T.H. Study of evaluating high quality economic development in Chinese regions. China Soft Sci. 2019, 7, 60–67. [Google Scholar]
  51. Zhao, S.H.; Li, X.; Chen, T.T. Evaluation on the effect of IAHP-EVM on tourism poverty alleviation training. Stat. Decis. 2019, 18, 51–54. [Google Scholar]
  52. Kuang, B.; Lu, X.H.; Zhou, M.; Rao, Y.X. Analysis of Spatial-Temporal Evolution of Urban Land Economic Density Disparity in Prefecture-Level Cities of China. Sci. Geogr. Sin. 2017, 37, 1850–1858. [Google Scholar]
  53. Hu, B.X.; Li, J.; Kuang, B. Evolution Characteristics and Influencing Factors of Urban Land Use Efficiency Difference Under the Concept of Green Development. Econ. Geogr. 2018, 38, 183–189. [Google Scholar]
  54. Xue, D. Research on Spatial-Temporal Evolution of Urban Land Use Efficiency and its Influencing Factors in Northwest China; Lanzhou University: Gansu, China, 2021. [Google Scholar]
  55. Lucas, R. Why doesn’t Capital Flow from Rich to Poor Countries? Am. Econ. Rev. 1990, 80, 2–96. [Google Scholar]
  56. Alfaro, L.; Kalemli-Ozcan, S.; Volosovych, V. Why Doesn’t Capital Flow from Rich to Poor Countries? An Empirical Investigation. Rev. Econ. Stat. 2008, 90, 347–368. [Google Scholar] [CrossRef]
  57. Shi, D.; Li, P. Measurement and international comparison of High-quality development of Chinese economy. Southeast Acad. Res. 2019, 5, 169–180. [Google Scholar]
Figure 1. Kernel density evolution of high-quality economic development of 30 regions in China.
Sustainability 14 06348 g001
Figure 2. Degree of high-quality economic development 30 regions in China (years of 2004, 2011, 2019, and mean of 2004–2019).
Sustainability 14 06348 g002
Figure 3. Spatial distribution of driving types of high-quality economic development in the 30 regions in China.
Sustainability 14 06348 g003
Table 1. Details of the indicators of high-quality economic development in China. (Innovation).
DimensionsVariablesReferences
InnovationR&D investment intensity (+) (%)[34,43]
Full time equivalent of R&D personnel (+) (PMP)[43,44]
Income growth rate of high-tech industry (+) (%)[34,43,44]
Technology market turnover as a percentage of GDP (+) (%)[34,44]
Number of patents (+) (PCS)[43,44]
Table 2. Details of the indicators of high-quality economic development in China. (Coordination).
DimensionsVariablesReferences
CoordinationThe proportion of primary industry in GDP (+) (%)[43,45]
The proportion of tertiary industry in GDP (+) (%)[43,45]
Dual contrast coefficient (+) (%)[43,45]
Urban and rural income ratio (−) (%)[43,45,46]
The proportion of secondary industry in GDP (+) (%)[43,45,46]
Urban and rural consumption differences (−) (%)[43,45,46]
Table 3. Details of the indicators of high-quality economic development in China. (Greenness).
DimensionsVariablesReferences
GreennessRatio of investment environmental pollution in GDP (+) (%)[34]
Number of Days with good air quality (+) (Days)[46,47]
GDP per unit area (+) (%)[34,46,47]
Comprehensive utilization of industrial solid waste (+) (%)[34,46,47]
Clean energy usage (+) (Thousands of cubic meters)[46]
Harmless treatment of household garbage (+) (%)[46,47]
Table 4. Details of the indicators of high-quality economic development in China. (Sharing).
DimensionsVariablesReferences
SharingRatio of urban maintenance cost to public expenditure (+) (%)[44,48]
Ratio of medical expenditure to public expenditure (+) (%)[17,44]
Number of higher education institutions (+) (PCS)[17,44,48]
Number of people participating in the endowment insurance (+) (MP)[17,44]
Internet coverage (+) (%)[17,44,48]
Ratio of social employment expenditure to public expenditure (+) (%)[17,44,48]
Table 5. Details of the indicators of high-quality economic development in China. (Opening-up).
DimensionsVariablesReferences
Opening-upProportion of foreign investment in GDP (+) (%)[17,49]
Degree of external economic dependence (−) (%)[49,50]
Foreign exchange earnings (+) (Million USD)[17,49]
Foreign investment turnover of Chinese enterprises (+) (THOUS USD)[17,49]
Proportion of Chinese enterprises’ workforce working abroad (+) (%)[49,50]
Table 6. Index system weight score of high-quality economic development in China.
DimensionsVariablesAHPEVMIntegrated
Innovation (0.2)R&D investment intensity0.2400.2250.232
Full time equivalent of R&D personnel0.1770.2030.190
Technology market turnover as a percentage of GDP0.1460.1610.154
Number of patents0.1460.1640.155
Income growth rate of high-tech industry0.2910.2480.270
coordination (0.2)The proportion of primary industry in GDP0.1720.1610.167
The proportion of secondary industry in GDP0.1080.1680.138
The proportion of tertiary industry in GDP0.1930.1680.181
Urban and rural consumption differences0.0750.1700.122
Dual contrast coefficient0.2790.1640.222
Urban and rural income ratio0.1720.1680.170
Greenness (0.2)Comprehensive utilization of industrial solid waste0.1230.1710.147
GDP per unit area0.1550.1130.134
Ratio of investment in environmental pollution control in GDP0.1950.1830.189
Number of days with good air quality0.1480.1930.171
Harmless treatment of household garbage0.0850.1900.137
Clean energy usage0.2950.1490.222
Sharing (0.2)Ratio of urban maintenance cost to public expenditure0.2520.1680.210
Ratio of medical expenditure to public expenditure0.1420.1710.157
Number of higher education institutions0.1460.1690.158
Number of people participating in the endowment insurance0.0650.1530.109
Internet coverage0.2830.1620.222
Ratio of social employment expenditure to public expenditure0.1120.1760.144
Opening-up (0.2)Proportion of foreign investment in GDP0.3170.2050.261
Degree of external economic dependence0.2630.2090.236
Foreign exchange earnings0.1170.1850.151
Foreign investment turnover of Chinese enterprises0.1980.1900.194
Proportion Chinese enterprises’ workforce working abroad0.1050.2120.159
Table 7. Level score of high-quality economic development from 2004–2019 in China.
RegionsScore
2004 Year2009 Year2019 YearMean of 2004–2019
Beijing0.3120.3720.4580.411
Tianjin0.2740.3100.3550.344
Hebei0.2310.2770.3590.322
Shanxi0.1880.2380.3050.275
Inner Mongolia0.2080.2320.2800.268
Liaoning0.2700.3090.3640.340
Jilin0.2450.2540.2920.285
Heilongjiang0.2130.2430.3100.282
Shanghai0.2950.3790.4360.397
Jiangsu0.3040.3610.4940.421
Zhejiang0.2620.3140.4330.364
Anhui0.2130.2660.3830.318
Fujian0.2650.2960.3830.338
Jiangxi0.2330.2710.3650.308
Shandong0.2500.3180.4370.368
Henan0.2140.2570.3760.310
Hubei0.2190.2620.3640.308
Hunan0.1910.2650.3340.294
Guangdong0.2740.3410.5410.423
Guangxi0.2070.2360.3210.276
Hainan0.2510.2870.3250.296
Chongqing0.1990.2510.3470.290
Sichuan0.2400.2810.3780.318
Guizhou0.1680.1990.2770.229
Yunnan0.1930.2230.3080.261
Shaanxi0.2070.2450.3260.283
Gansu0.1760.1970.2670.227
Qinghai0.1840.2100.2670.238
Ningxia0.2100.2190.2790.246
Xinjiang0.1970.2260.2770.262
Table 8. Contribution factor and mean score of “Three-Factor Type” region in China.
Driving TypeRegionMean ScoreFactor
COGIS
Three-Factor TypeHebei0.6180.0640.4020.1110.415C-S-G
Shanxi0.4860.0410.3870.1150.345C-G-S
Inner Mongolia0.5270.0330.4140.0850.283C-G-S
Jilin0.5910.1430.2790.1020.311C-S-G
Heilongjiang0.6310.0580.2780.1110.331C-S-G
Anhui0.6050.0680.3650.1510.403C-S-G
Jiangxi0.6510.0660.3620.1130.348C-G-S
Henan0.5800.0650.350.1280.423C-S-G
Hubei0.5810.0810.310.1660.399C-S-G
Hunan0.5860.0540.310.1300.395C-S-G
Guangxi0.5490.0470.3650.0880.332C-G-S
Hainan0.7040.1200.3310.0630.260C-G-S
Chongqing0.5290.0580.3600.1360.368C-S-G
Sichuan0.5980.0720.3850.1570.379C-G-S
Guizhou0.4480.0180.3400.0890.253C-G-S
Yunnan0.4750.0590.3600.0920.320C-G-S
Gansu0.4650.0230.2520.1150.282C-S-G
Qinghai0.5070.0160.3380.0760.251C-G-S
Ningxia0.5040.0330.3680.0820.244C-G-S
Xinjiang0.5790.0560.3300.0860.260C-G-S
Table 9. Contribution factor and mean score of “Four-Factor Type I” region in China.
Driving TypeRegionMean ScoreFactor
COGIS
Four-Factor Type I Liaoning0.5790.1760.3710.1470.424C-S-G-O
Fujian0.6160.2030.3750.1350.358C-G-S-O
Table 10. Contribution factor and mean score of “Four-Factor Type II” region in China.
Driving TypeRegionMean ScoreFactor
COGIS
Four-Factor Type IIShaanxi0.4810.0600.3270.1890.356C-S-G-I
Table 11. Contribution factor and mean score of “Five-Factor Type” regions in China.
Driving TypeRegionMean ScoreFactor
COGIS
Five-Factor TypeBeijing0.4800.2140.4790.4730.411C-G-I-S-O
Tianjin0.5080.2630.3620.1940.392C-S-G-O-I
Shanghai0.4820.4600.4300.2520.362C-O-G-S-I
Jiangsu0.6020.3040.4570.2840.458C-S-G-O-I
Zhejiang0.6300.2030.3610.2390.387C-S-G-I-O
Shandong0.5580.1880.4550.1960.443C-G-S-I-O
Guangdong0.5270.4510.4040.2810.451C-O-S-G-I
Table 12. High-quality economic development time normality test.
Kolmogorov-Smirnov (K) aShapiro-Wilk
StatisticsdfSignificanceStatisticsdfSignificance
High-quality economic development index0.157160.200 *0.932160.263
* Lower limit of significance, a Lilliefors Significance correction.
Table 13. High-quality economic development spatial normality test.
Kolmogorov-Smirnov (K) aShapiro-Wilk
StatisticsdfSignificanceStatisticsdfSignificance
High-quality economic development index0.114300.200 *0.945300.123
* Lower limit of significance, a Lilliefors Significance correction.
Table 14. The results of influencing factors of time variation of China high-quality economic development index.
Influencing FactorsDirect Path CoefficientIndirect Path CoefficientsOverall Influence Coefficient
X8X3X7
X80.360 0.4550.1730.988
X30.4820.340 0.1510.973
X70.1850.3370.392 0.914
Table 15. The results of influencing factors of spatial variation of China high-quality economic development index.
Influencing FactorsDirect Path CoefficientIndirect Path CoefficientsOverall Influence Coefficient
X1X2X3X4X5X6X7
X10.180 0.1150.2040.1230.0210.171−0.0130.801
X20.3870.053 0.0560.065−0.0470.0230.0610.598
X30.3890.0940.056 0.104−0.0670.142−0.0180.700
X4−0.255−0.087−0.098−0.158 0.034−0.109−0.011−0.684
X50.1890.020−0.097−0.137−0.074 −0.010−0.039−0.148
X60.2040.1510.0450.2710.136−0.010 −0.0190.778
X70.104−0.0230.228−0.0660.0270.071−0.037 0.304
Publisher’s Note: MDPI stays neutral with regard to jurisdictional claims in published maps and institutional affiliations.

