Article

Risk Assessment of Crowd-Gathering in Urban Open Public Spaces Supported by Spatio-Temporal Big Data

1
School of Environmental and Geographical Sciences, Shanghai Normal University, Shanghai 200234, China
2
Key Innovation Group of Digital Humanities Resource and Research, Shanghai Normal University, Shanghai 200234, China
*
Author to whom correspondence should be addressed.
Sustainability 2022, 14(10), 6175; https://doi.org/10.3390/su14106175
Submission received: 13 April 2022 / Revised: 5 May 2022 / Accepted: 17 May 2022 / Published: 19 May 2022
(This article belongs to the Section Sustainable Urban and Rural Development)

Abstract

:
The urban open public spaces are the areas where people tend to gather together, which may lead to great crowd-gathering risk. This paper proposes a new method to assess the rank and spatial distribution of crowd-gathering risk in open public spaces in a large urban area. Firstly, a crowd density estimation method based on Tencent user density (TUD) data is built for different times in open public spaces. Then, a reasonable crowd density threshold is delimited to detect critical crowd situations in open public spaces and find out the key open public spaces that need to have intensive crowd-gathering prevention. For estimating the crowd-gathering risk in key open public spaces, the quantified risk assessment approach is conducted based on the classical risk theory that simultaneously considers the probability of an accident occurring, the severity of the accident consequence, and the risk aversion factor. A case study of the area within the Outer-ring Road of Shanghai was conducted to determine the feasibility of the new method. The thematic maps that describe the ranks and spatial distribution of crowd-gathering risk were generated. According to the risk maps, the government can determine the crowd control measures in different areas to reduce the crowd-gathering risk and prevent dangerous events.

1. Introduction

With worldwide urbanization, the proportion of urban population is projected to reach 66% by 2050 [1]. The remarkably growing population is making cities even more crowded and increases the crowd-gathering risks [2]. According to incomplete global statistics, thousands of people die in the emergencies occurring in crowd-gathering activities per year [3]. In open public spaces, which are open-boundary places, crowd accessing and leaving are unregulated, making them more likely to have large and risky crowd-gatherings compared to other places. Due to the high density of the crowd, once a crowd accident occurs, it will cause severe casualties [4,5,6]. For example, in the Love Parade accident of 2010 in Duisburg, Germany, 21 people died and more than 500 people were injured [7]; in the stampede that occurred in the Chenyi Square of Shanghai, 36 people died and 49 people were injured [8]. The rising number of these accidents has begun to arouse people’s attention to crowd safety in open public spaces. Study on the emergency management of public security in open public spaces with high crowds has gradually become a focus area in academia [9].
Urban open public spaces are the open spaces in cities that are open to all urban residents and without specific boundaries [10]. Open public spaces are usually located near the traffic facilities or commercial facilities in the center of a city, where crowd-gathering situations easily occur. Moreover, because of the open-boundary characteristic, the crowd flows in open public spaces have high uncertainty and crowd congestions easily occur at bottleneck places, which rises the risk of stampede accidents.
Existing studies on crowd safety in open public spaces mainly focus on the observation and measurement of crowd traffic, computer simulation of crowd movements, and performance-based design of buildings [11]. For instance, Helbing et al. [12] proposed the social force model (SFM) to simulate and analyze the pedestrian movement characteristics in both normal and evacuation situations. Liu and Kaneda [13] used an agent-based simulation model to test the efficiency of different spatial operations or management plans and improve crowd safety in high-density environments. Moreover, some scholars have conducted studies on risk assessment of crowd-gathering. Hu et al. [14] utilized two methods, node access frequency method (NAFM) and combined critical cluster model (CCCM), to identify key nodes with high crowd-gathering risk in an open public space in Beijing. Still et al. [15] proposed a crowd safety assessment model to estimate the crowd safety in the public spaces of assembly. According to the classical risk theory, Liu et al. [16] selected four evaluation factors to build a quantitative crowd-gathering risk assessment model for urban public spaces. Zhang et al. [17] proposed a method to evaluate crowd safety based on fuzzy inference that considered the number of pedestrians and the distribution uniformity as two kinds of attributes of a crowd. The crowd-gathering risk in open public spaces is different from that of other public spaces that have specific boundaries and fences. The risk is closely related to the internal and external environments of the open public spaces. For example, the serious casualties caused by the stampede in Shanghai in 2014 were not only because of the high crowd density in Chenyi Square. The high population density on the nearby roads and the high crowd density in the adjacent open public spaces, such as the Nanjing Road Pedestrian Street, made it very difficult to evacuate the internal crowd. This was also an important contributing factor to the stampede accident. However, previous studies mostly focused on a specific public space without simultaneously considering internal and external risk factors of crowd-gathering, and rarely focused on the crowd-gathering risk in a large region. Understanding the dynamic spatial distribution of crowd-gathering risk on a city scale is of great significance to improve urban planning and reduce the risk of crowd-gathering.
The prediction and early warning based on the status of crowd-gathering through measurable parameters of the crowd is the main technical method to reduce the crowd-gathering risk [11]. The crowd density, i.e., the number of people per unit area, has been identified as one of the most important factors to assess the risk of crowd-gathering in open public spaces [18,19,20]. However, the traditional crowd density estimation approaches have their limitations when applied to open public spaces. For instance, the field survey approach is time-consuming and laborious, and it is difficult to use for open public spaces in a large region. The sensor detection approach is another traditional crowd density estimation method. This approach requires the allocation of sensors to count the entering personnel, which is more suitable for public spaces with access control. However, in open public spaces, people can enter and leave at will. Therefore, it is difficult to use this approach to count the number of people at a specific time and estimate the crowd density. The third example of a traditional method is the video-based approach. It also has limitations in that the low-light conditions make it difficult to obtain an accurate estimation of the crowd density and the whole public space is unlikely to be covered [21,22]. In recent years, with the development of wireless network technology, mobile devices, such as smartphones, have been popularized. Spatio-temporal big data based on mobile devices have been increasingly considered for monitoring the crowd density [21,23]. Tencent user density (TUD) data are big data generated by the location of smartphone users who use Tencent applications [24]. TUD data have been widely utilized in research considering urban population distribution mapping [25,26,27], identification of urban functional areas [28], park use measurement [29,30], estimation of potential victims of burglary [31], measuring polycentric urban structures [32], urban land use classification [33], and in other studies [24,34,35]. TUD data can cover a wide range area with high temporal and spatial resolution. Hence, TUD data have the potential to estimate the crowd densities in urban open public spaces.
Considering the limitations of existing studies, a new method to assess the rank and spatial distribution of crowd-gathering risk in open public spaces is proposed in this study. This method first proposes a new approach to estimate the crowd density based on spatio-temporal big data in urban open public spaces. Then, the crowd density estimation approach is integrated in the spatio-temporal crowd-gathering risk assessment method as an important factor. The crowd-gathering risk assessment method integratively considers the occurrence probability of crowd-gathering events, the severity, and the risk aversion factor, which is on the basis of the classical risk theory. Thematic maps describing the ranks and spatial distribution of crowd-gathering risk can be generated. A case study of the area within the Outer-ring Road of Shanghai was conducted to determine the feasibility of the new method. The structure of this paper is organized as follows: the proposed methodology is introduced in Section 2. In Section 3, the case study is implemented to verify the applicability of the method. The results of risk assessment of crowd-gathering and discussion are presented in Section 4. The conclusions and an outlook to the future are given in Section 5.

2. Methodology

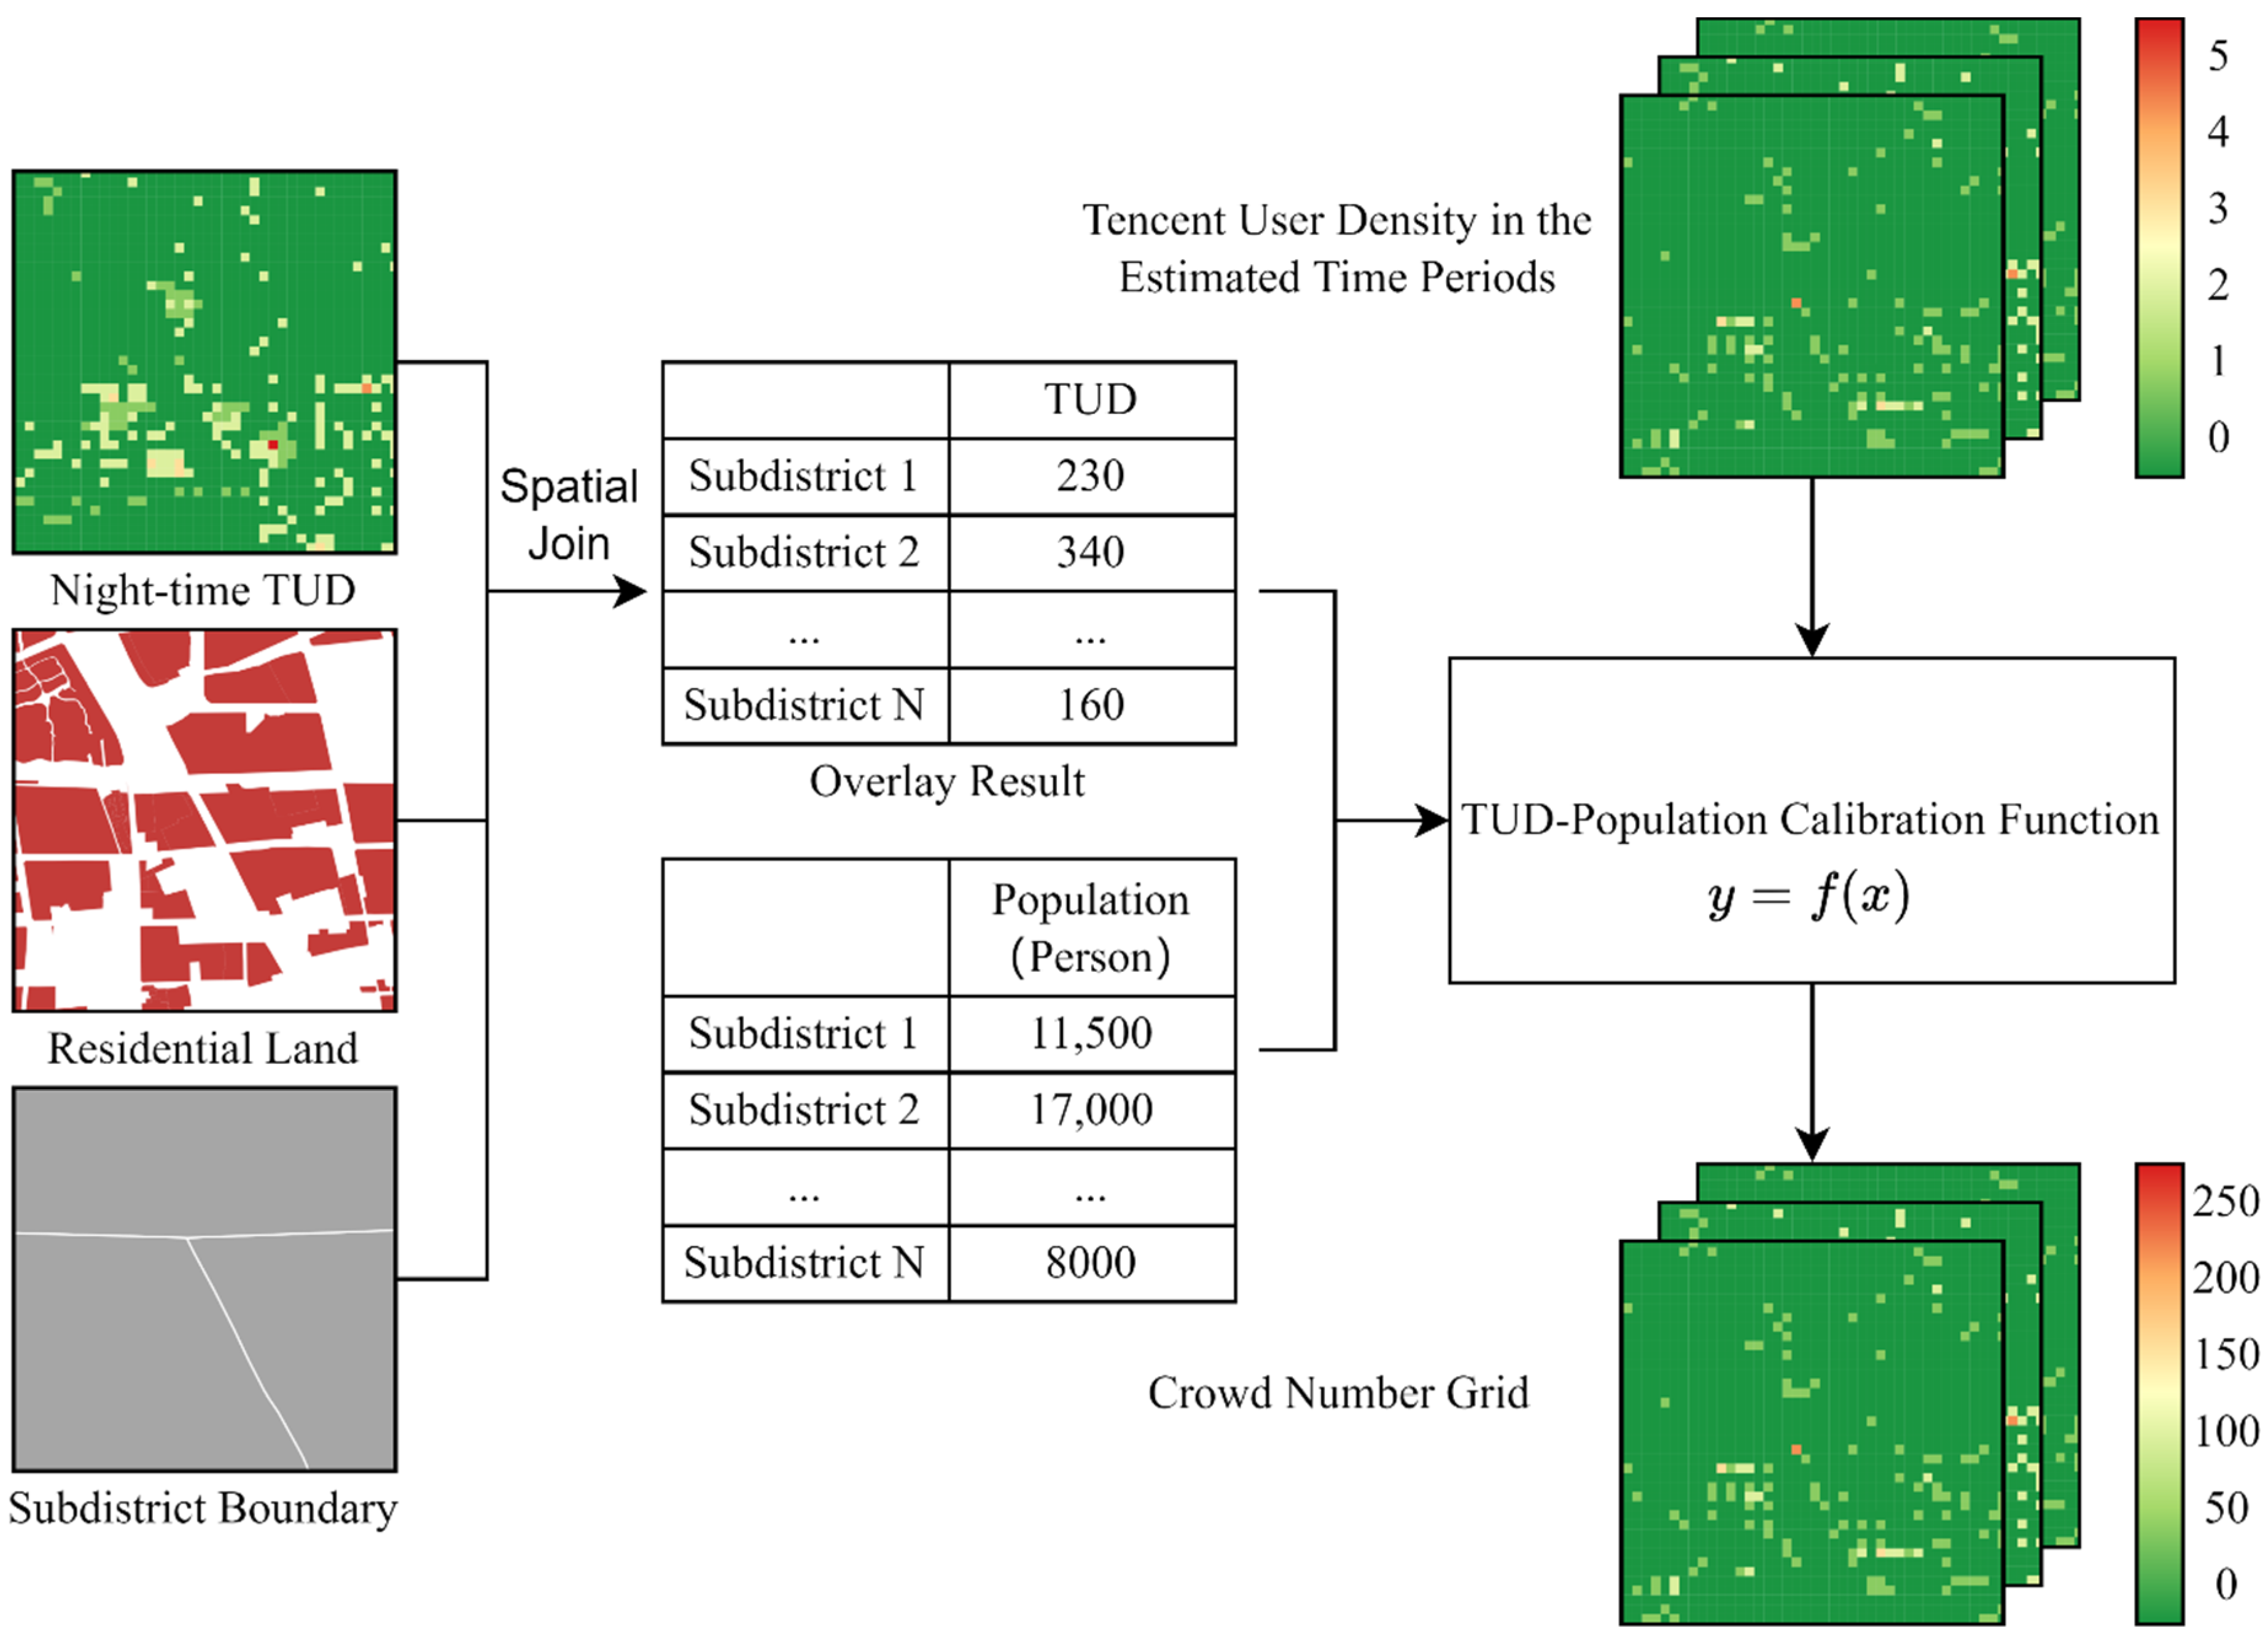
To develop the methodology of this study, a TUD-data-based crowd density estimation method for open public spaces was first built. Because it is difficult to assess the dynamic crowd density merely by the TUD data, a TUD–population calibration method was built to describe the relation between the TUD data and the population data in residential land parcels, and calibrate the TUD data by a linear regression function. Utilizing the method, the dynamic crowd density in the urban open public spaces can be effectively estimated. After the crowd density estimation, a reasonable crowd density threshold can be delimited to detect critical crowd situations in open public spaces and determine the key open public spaces that need to have intensive crowd-gathering prevention. Secondly, the quantified risk assessment method of crowd-gathering for urban open public spaces was built on the basis of classical risk theory. Thematic maps that describe rank and spatial distribution of crowd-gathering risks can be generated. The risk levels and spatial distribution characteristics provided in the maps can help the government and relevant departments determine the crowd control measures in different open public spaces and regions to reduce the crowd-gathering risk.
Figure 1 shows the workflow of the method. The workflow mainly consists of two major parts (Figure 1): (1) crowd density estimation for open public spaces; (2) risk assessment of crowd-gathering in open public spaces.

2.1. Crowd Density Estimation for Open Public Spaces

2.1.1. TUD–Population Calibration Method

The Tencent user density (TUD) data, provided by Tencent Company in China (https://www.qq.com, accessed on 31 August 2019), is a kind of spatio-temporal big data with fine spatial and temporal resolution. The data can reflect the density of smart phone users using Tencent applications. According to the recent reports from Tencent, which is one of the largest Internet companies in the world, the proportion of Tencent users in the total population in China is over 70% and this proportion is more than 90% in Chinese first-tier cities. In the Tencent data, the geographic space is divided into many square grids. The locations of users can be recorded, and the number of users in each grid can be converted into a density weight, which can provide a dynamic user density distribution in the urban area. The TUD data have been proven to have high correlation with urban population distribution.
However, due to the encryption of the TUD data, the TUD values do not represent the real user numbers. Meanwhile, although the TUD data have high correlation with the population distribution, the TUD value of a grid cannot be directly utilized as the population or crowd number of that grid. According to a field investigation from another paper [29], about 20–30% of the park users are not included in the TUD data, such as children and others without mobile devices and those who do not use Tencent Apps. Hence, the TUD data do not include everyone’s location information. Hence, a TUD–population calibration method is indispensable to estimate the crowd density of the open public spaces. The calibration method can provide the description of the relation between the TUD data and the real spatial population distribution. Two assumptions were made as follows:
(1) At nighttime (21:00–22:00 in this study), the urban residents are all distributed on residential land parcels: It is of high probability that people are in residential buildings during this period at nighttime. The floating population on residential land parcels is not considered in this study because of its random distribution and relatively smaller population size compared to the permanent population.
(2) For the estimated period in daytime and nighttime in this study, the relation between the TUD data and the real spatial population distribution is stable.
Based on these assumptions, the TUD–population calibration method, which builds a linear regression function between the census population data and nighttime TUD data, is represented by Equation (1) as follows:
P S D ( i ) = b 0 + b 1 T U D S D ( i ) + e
where the dependent variable P S D ( i ) is the population of the i-th subdistrict; independent variable T U D S D ( i ) is the total TUD values count on the residential land parcels of the i-th subdistrict; b 0 is the constant value; b 1 is the coefficient for the total TUD values count of the i-th subdistrict. The reason why the nighttime TUD data are used here is that the urban residents are mostly in residential areas in the nighttime. In other words, the nighttime TUD data have the highest correlation with the urban residential population.
The regression analysis can be executed to estimate the mathematic relation between the TUD data and the urban population. After testing and verifying the method, Equation (2) can be used to distribute the population in each time. When calculating the population in each grid, the estimated grid population will be biased if the constant value b 0 of the given subdistrict is averagely assigned to each grid [27]. To avoid this problem, the constant value b 0 of the grids within the given subdistrict can be distributed according to the numerical value of the TUD grid, i.e., the grids with larger TUD values contribute more to the constant, while the grids with smaller TUD values contribute less. The mathematical equation is as follows:
y ^ ( i , j ) = b 0 × ( T U D ( i , j ) / T U D S D ( i ) ) + b 1 T U D ( i , j )
where y ^ ( i , j ) is the population of the j-th grid in the i-th subdistrict; T U D ( i , j ) is the TUD value of the j-th grid in the i-th subdistrict.
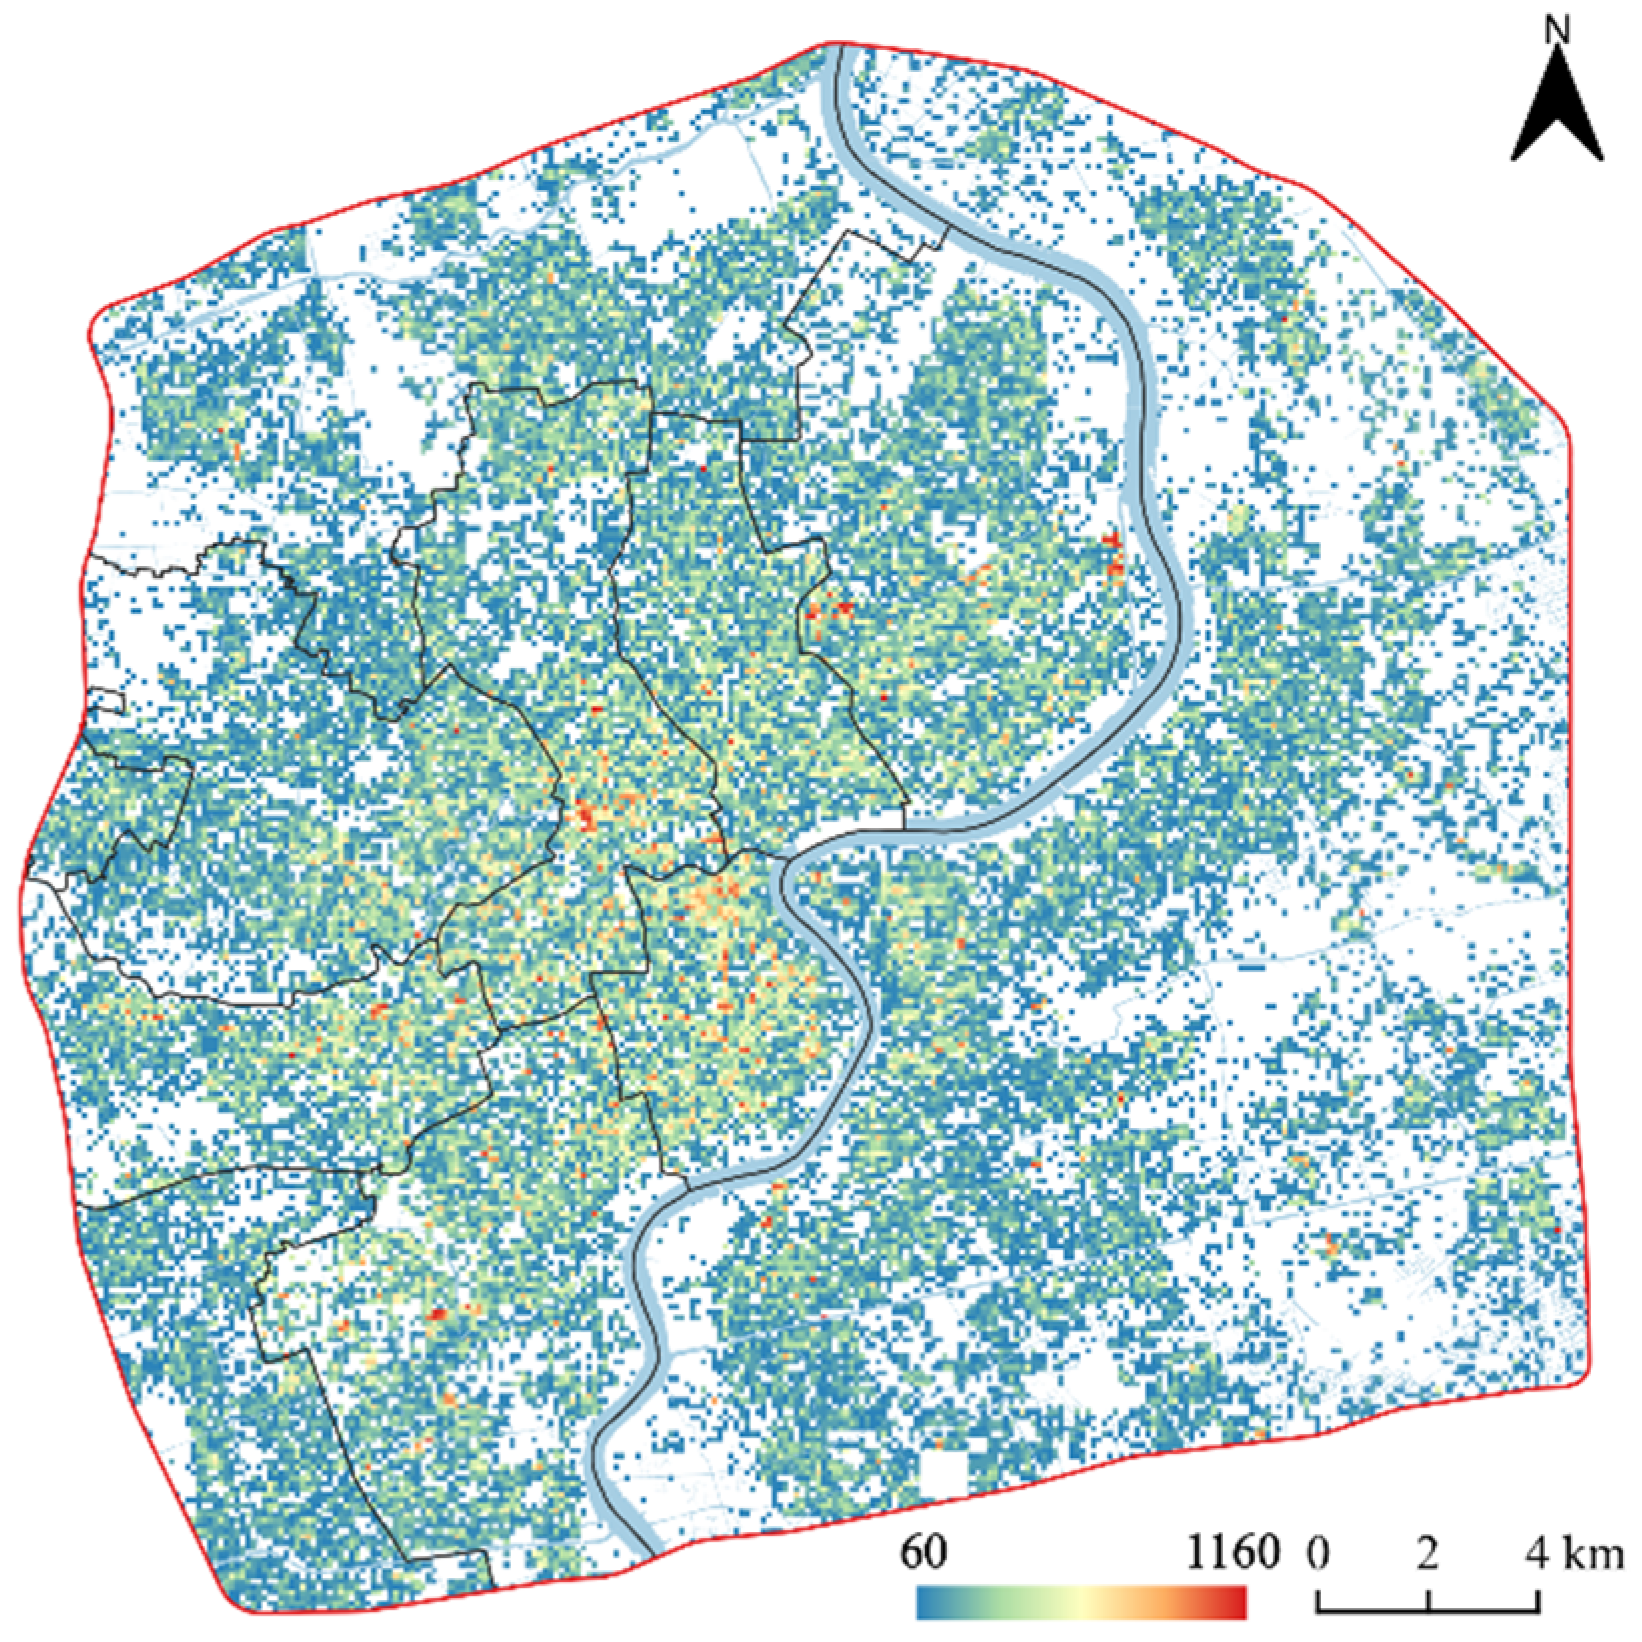
Figure 2 describes the application process of the TUD–population calibration method. First, an overlay analysis on three kinds of spatial data (nighttime TUD data, residential land parcels, and subdistrict boundary) is conducted to obtain the total TUD values on residential land parcels of each subdistrict. Because the population of each subdistrict can be acquired from census data, a linear regression function can be built to describe the mathematic relation between the population census data and the nighttime TUD data. Utilizing the function, the TUD data in the estimated time periods can be calibrated by the method to assess the crowd number data for each grid in the study area.

2.1.2. Crowd Density Estimation

Based on the TUD–population calibration method, the real population in each grid can be estimated, and then the total number of people in each open public space can be obtained through spatial overlay analysis between the population assessment result and the spatial data of the open public spaces. The crowd density in the k -th open public space at time t can be obtained by Equation (3) as follows:
C D ^ ( t , k ) = j N y ^ ( j ,   k ) A r e a k
where C D ^ ( t , k ) is the estimated crowd density of the k -th open public space at time t ; y ^ ( j ,   k ) is the population of the j -th grid in the k -th open public space; A r e a k is the area of the k -th open public space.
The correlation coefficient (CC) and mean absolute error (MAE), which are well-known accuracy assessment indexes of population mapping, were selected to comprehensively assess the accuracy of the crowd density estimation result. The CC and MAE are calculated by comparing the estimated crowd density and the crowd density samples generated by the official released real-time passenger flow data or by field surveys. The equations for these indexes are as follows:
CC = i = 1 N ( C D i C D m e a n ) ( C D ^ i C D ^ m e a n ) i = 1 N ( C D i C D m e a n ) 2 i = 1 N ( C D ^ i C D ^ m e a n ) 2
MAE = i N | C D i C D ^ i | N
where C D i is the actual crowd density of the i-th sample, C D m e a n is the mean value of the actual crowd density of all samples, C D ^ i is the estimated crowd density of the i-th sample, C D ^ m e a n is the mean value of the estimated crowd densities of all samples, and N is the number of samples for accuracy assessment.

2.2. Risk Assessment of Crowd-Gathering in Open Public Space

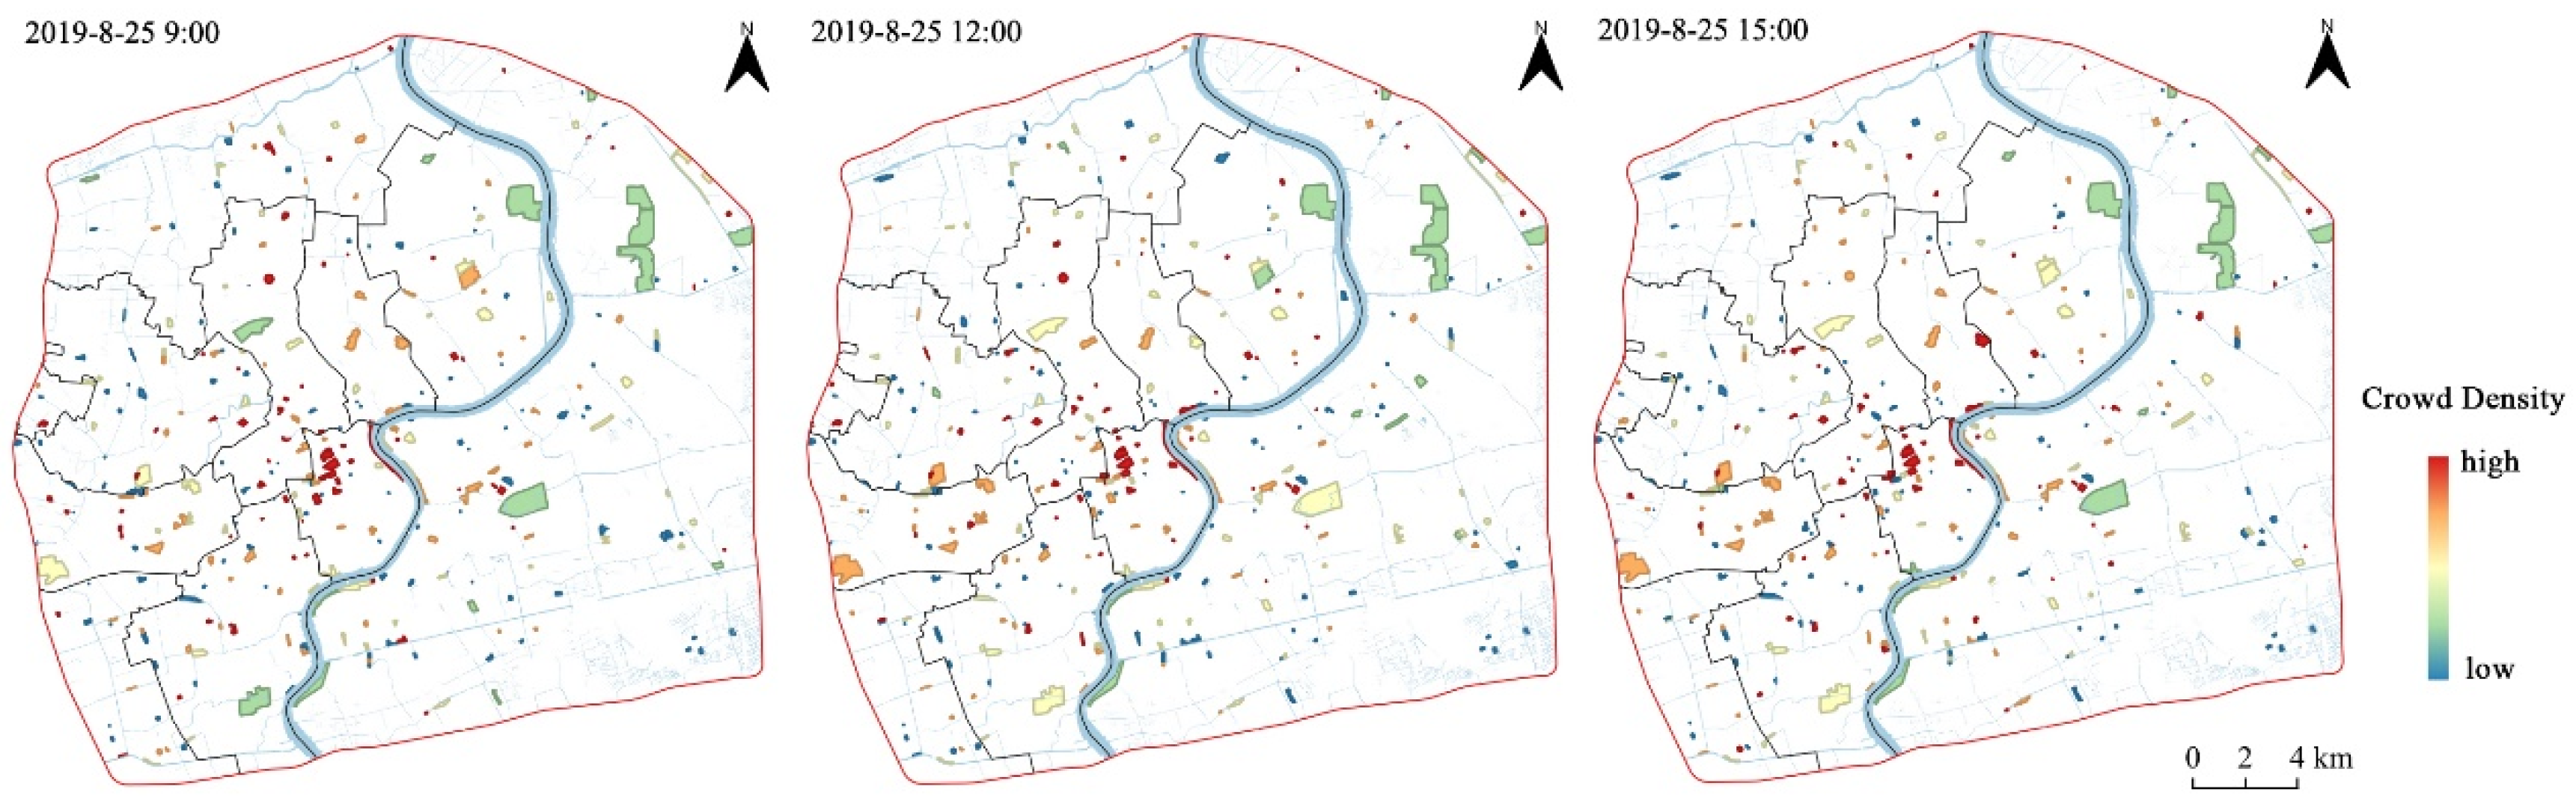
As mentioned in the introduction section, the risk assessments of crowd-gathering in previous studies mostly focused on a single public space from the microcosmic perspective. To our knowledge, no previous studies measured the spatial distribution of crowd-gathering risk microcosmically and spatio-temporally in large regions because of the lack of effective models and data. However, for the government and relevant departments, it will be of great help if the key urban open public spaces that need to have intensive crowd-gathering prevention can be identified and the risk rank of crowd-gathering can be provided for public safety management. Therefore, we developed a new method to assess the risk of crowd-gathering in a large area supported by multisource geospatial big data. This method takes into account various characteristics of public spaces and crowds. Firstly, the key open public spaces that need to have intensive crowd-gathering prevention can be determined based on the crowd density threshold. Then, the crowd-gathering risks of the key open public spaces of different times can be quantitatively assessed by the crowd-gathering risk assessment method. A risk map which describes the crowd-gathering risk rank of various open public spaces can be produced.

2.2.1. Identification of Key Open Public Spaces

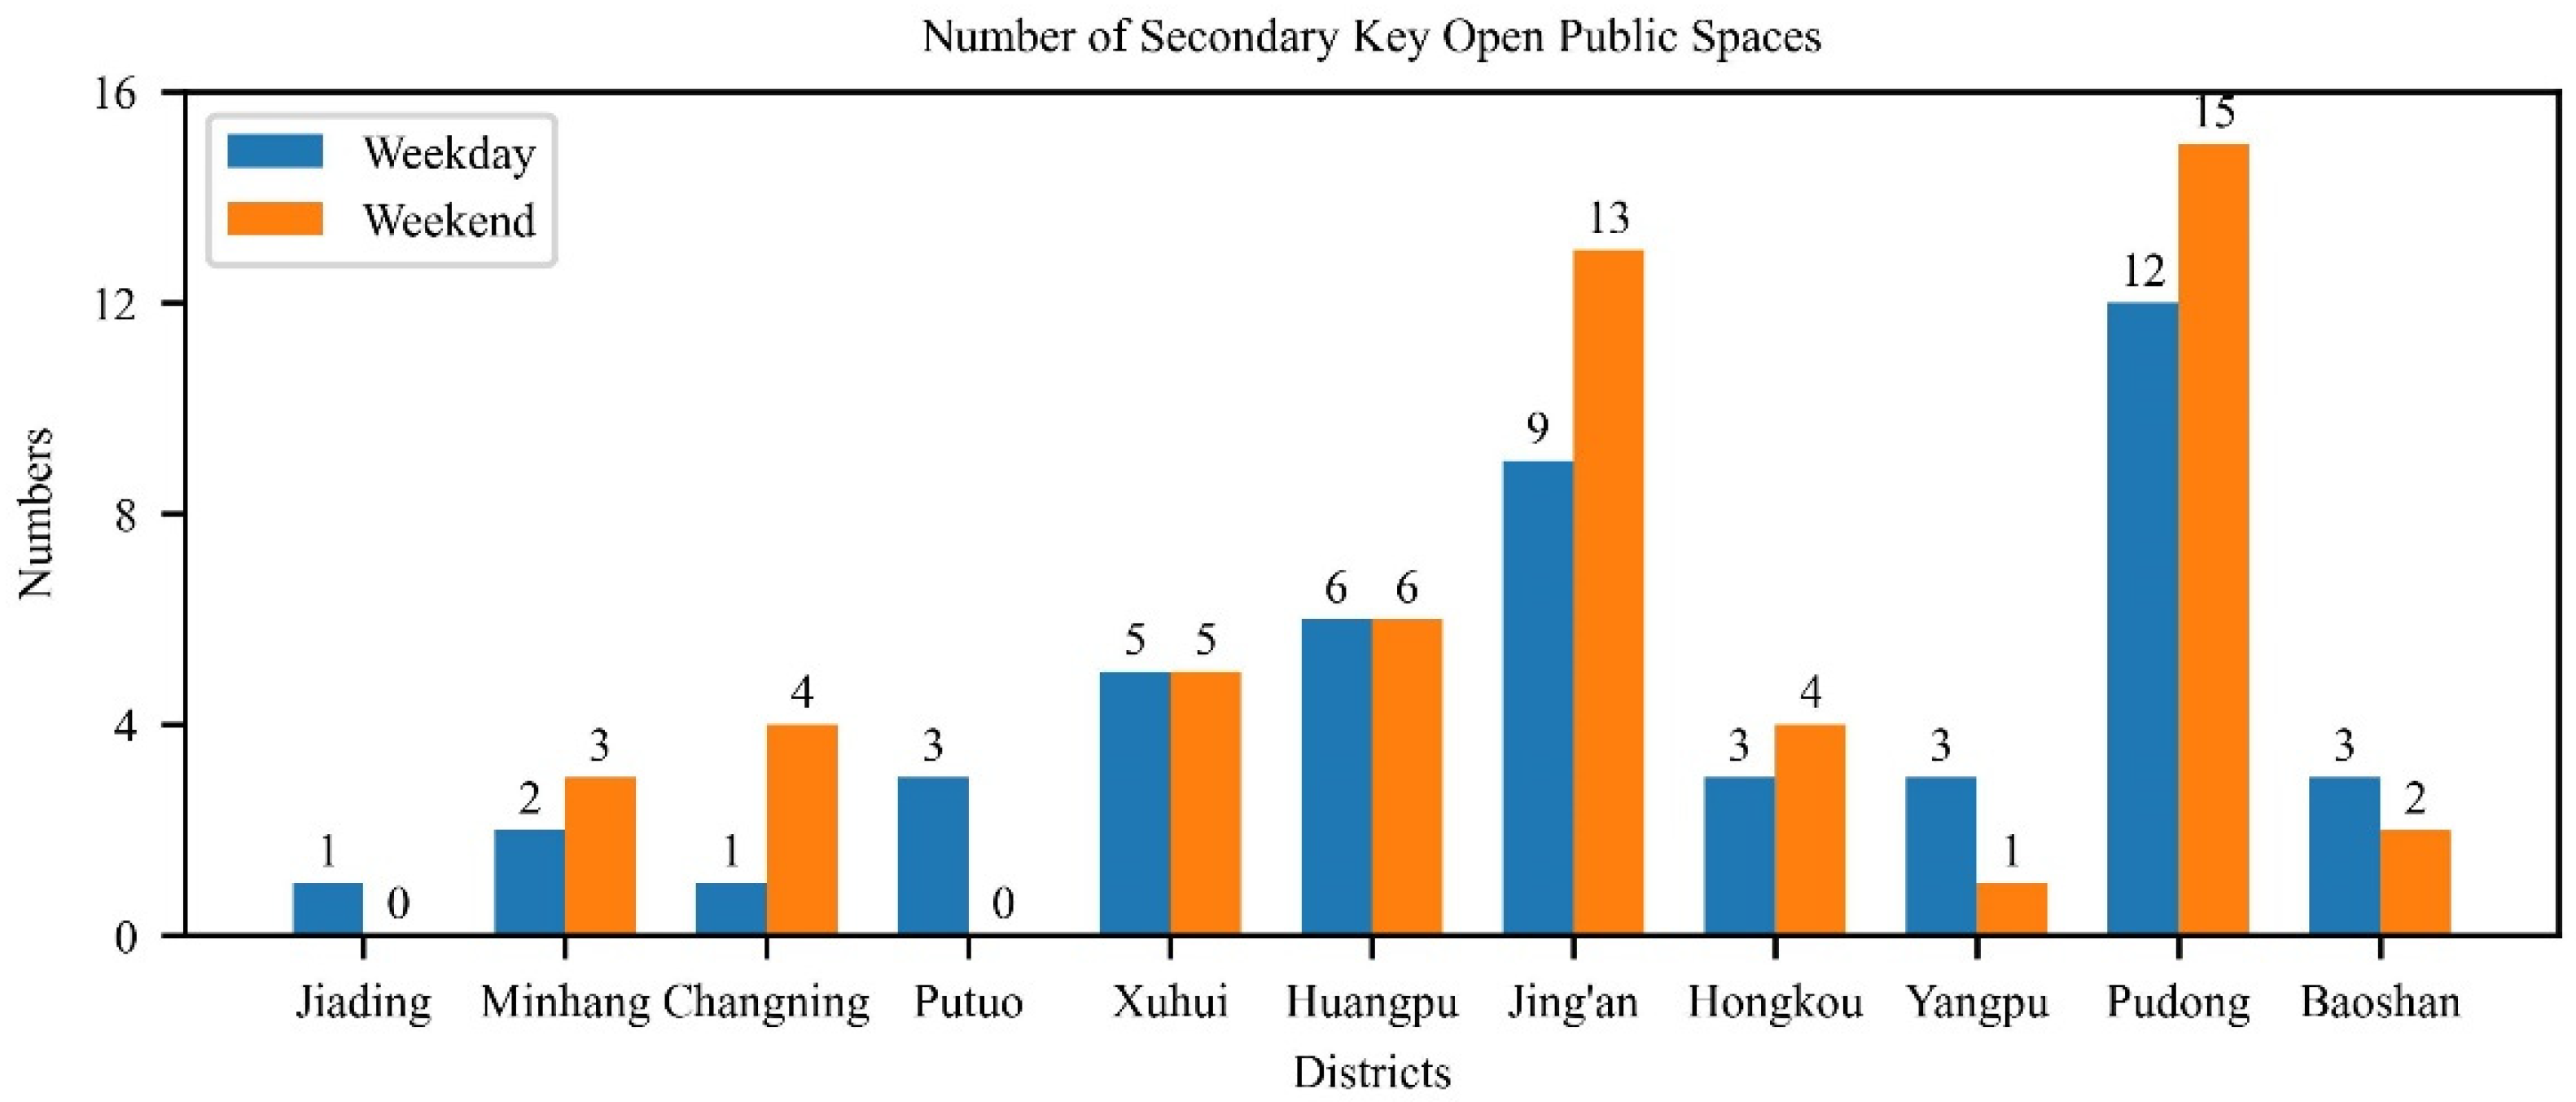
When an emergency occurs, individuals in a crowded open public space may have psychological panic and abnormal behaviors such as screaming, shoving, and falling, which may cause the whole crowd to fall into chaos [36]. Therefore, it is necessary to identify these open public spaces with high crowd densities. According to the literature on the crowd density studies of open public spaces, when the crowd density exceeds 40–300 people/ha, the personnel in open public space no longer feel safe and comfortable. When the crowd density exceeds 1000–5000 people/ha, the crowd will be in a crowded state [37]. In this paper, the crowd density threshold of 1000 and 300 people/ha was taken as for identifying key open public spaces and secondary key open public spaces, respectively. The specific identification method is shown in Equations (6) and (7) as follows.
C D m a x = max t ( C D ( t ) )
K e y ( P S ) = { n o n e i f   C D m a x < 300 s e c o n d a y   k e y   o p e n   p u b l i c   s p a c e i f   300 C D m a x < 1000 k e y   o p e n   p u b l i c   s p a c e i f   C D m a x > 1000
where C D ( t ) is the average population density of the open public space P S at time t; C D m a x is the maximum crowd density of the open public space P S in the whole period of time; K e y ( P S ) is a function to judge whether P S is a key public space or a secondary key open public space.

2.2.2. Crowd-Gathering Risk Assessment

In previous studies, the crowd-gathering risk was usually assessed based on factors such as place characteristics, management measures, and crowd characteristics [16], since these factors directly relate to the probability and consequences of the accidents. However, most of these studies ignored the impact of external spaces on crowds-gathering risk. The importance of considering the factors of external environments has been explained in the Introduction section.
In general, risk is usually described as a combination of the consequences derived from the range of possible accidents and the likelihood of these accidents [38,39]. In the field of crowd-gathering risk, scholars usually describe the crowd-gathering risk by the possibility of the crowd accident occurring and the consequences of accidents caused by crowd [11,16,40]. For example, Liu et al. expressed the crowd-gathering risk in urban public spaces by the quantified equation “ R = P × S ”, where P is the occurring possibility and S is the consequences of crowd accidents. Hence, based on risk theory and previous studies, the crowd-gathering risk of open public spaces in this study is expressed as follows [16]:
R = P × S × A
where R is the crowd-gathering risk of an open public space; P represents the probability of an accident occurring in an open public space under the crowd-gathering condition; S represents the severity of the accident consequence of an open public space; A is the risk aversion factor.

Probability of the Crowd Accident Occurrence

The probability of an accident occurring in an open public space can be represented by the cumulative weighted values of four factors: the crowd density, gathering tendency, place dangerousness, and the traffic situation of the external environments. The weight of each factor is determined by the analytic hierarchy process (AHP) method. The specific equation is as follows:
P = α 1 C D + α 2 G T + α 3 P D + α 4 T S
where P is the probability of the crowd accident occurring; C D , A T , P D , and T S represent the crowd density, gathering tendency, place dangerousness, and traffic situation, respectively; α 1 , α 2 , α 3 , and α 4 are the weights of the four factors. For the integration of the various factors, normalization is used to distribute values of these factors between 0 and 1.
(1)
Gathering Tendency
The gathering tendency of the crowd is built based on the change of crowd density in a public space at different times, which can be expressed by a function of the maximum crowd density and the change rate of crowd density in this period, shown in Equation (10) as follows:
G T T = max ( D ( t i ) , D ( t i 1 ) ) × ( D ( t i ) D ( t i 1 ) ) t i t i 1
where T is the time period from t i 1 to t i ; G T T is the gathering tendency of the time period T; D ( t i ) is the crowd density at the time t i .
(2)
Place Dangerousness
The place dangerousness is also an important factor in the risk assessment of crowd-gathering. Inspired by the studies of Liu et al. [16] and Ye et al. [41], the place dangerousness factor integratively considers the criteria of the following four categories (Table 1): (1) number of obstacles, (2) affected degree of steps, (3) affected degree of slopes, and (4) affected degree of ground pavements/materials. The value of the place dangerousness is calculated by the cumulative scores of the four criteria in Table 1. The above criteria of the four categories are collected and assessed from high-resolution remote sensing images, photos of open public spaces obtained from social media platforms and field surveys. Each criterion is assigned a value from the score 0–5. The value assignments are determined according to the specific situations of the open public spaces in the study area.
(3)
Traffic Situation of the External Environment
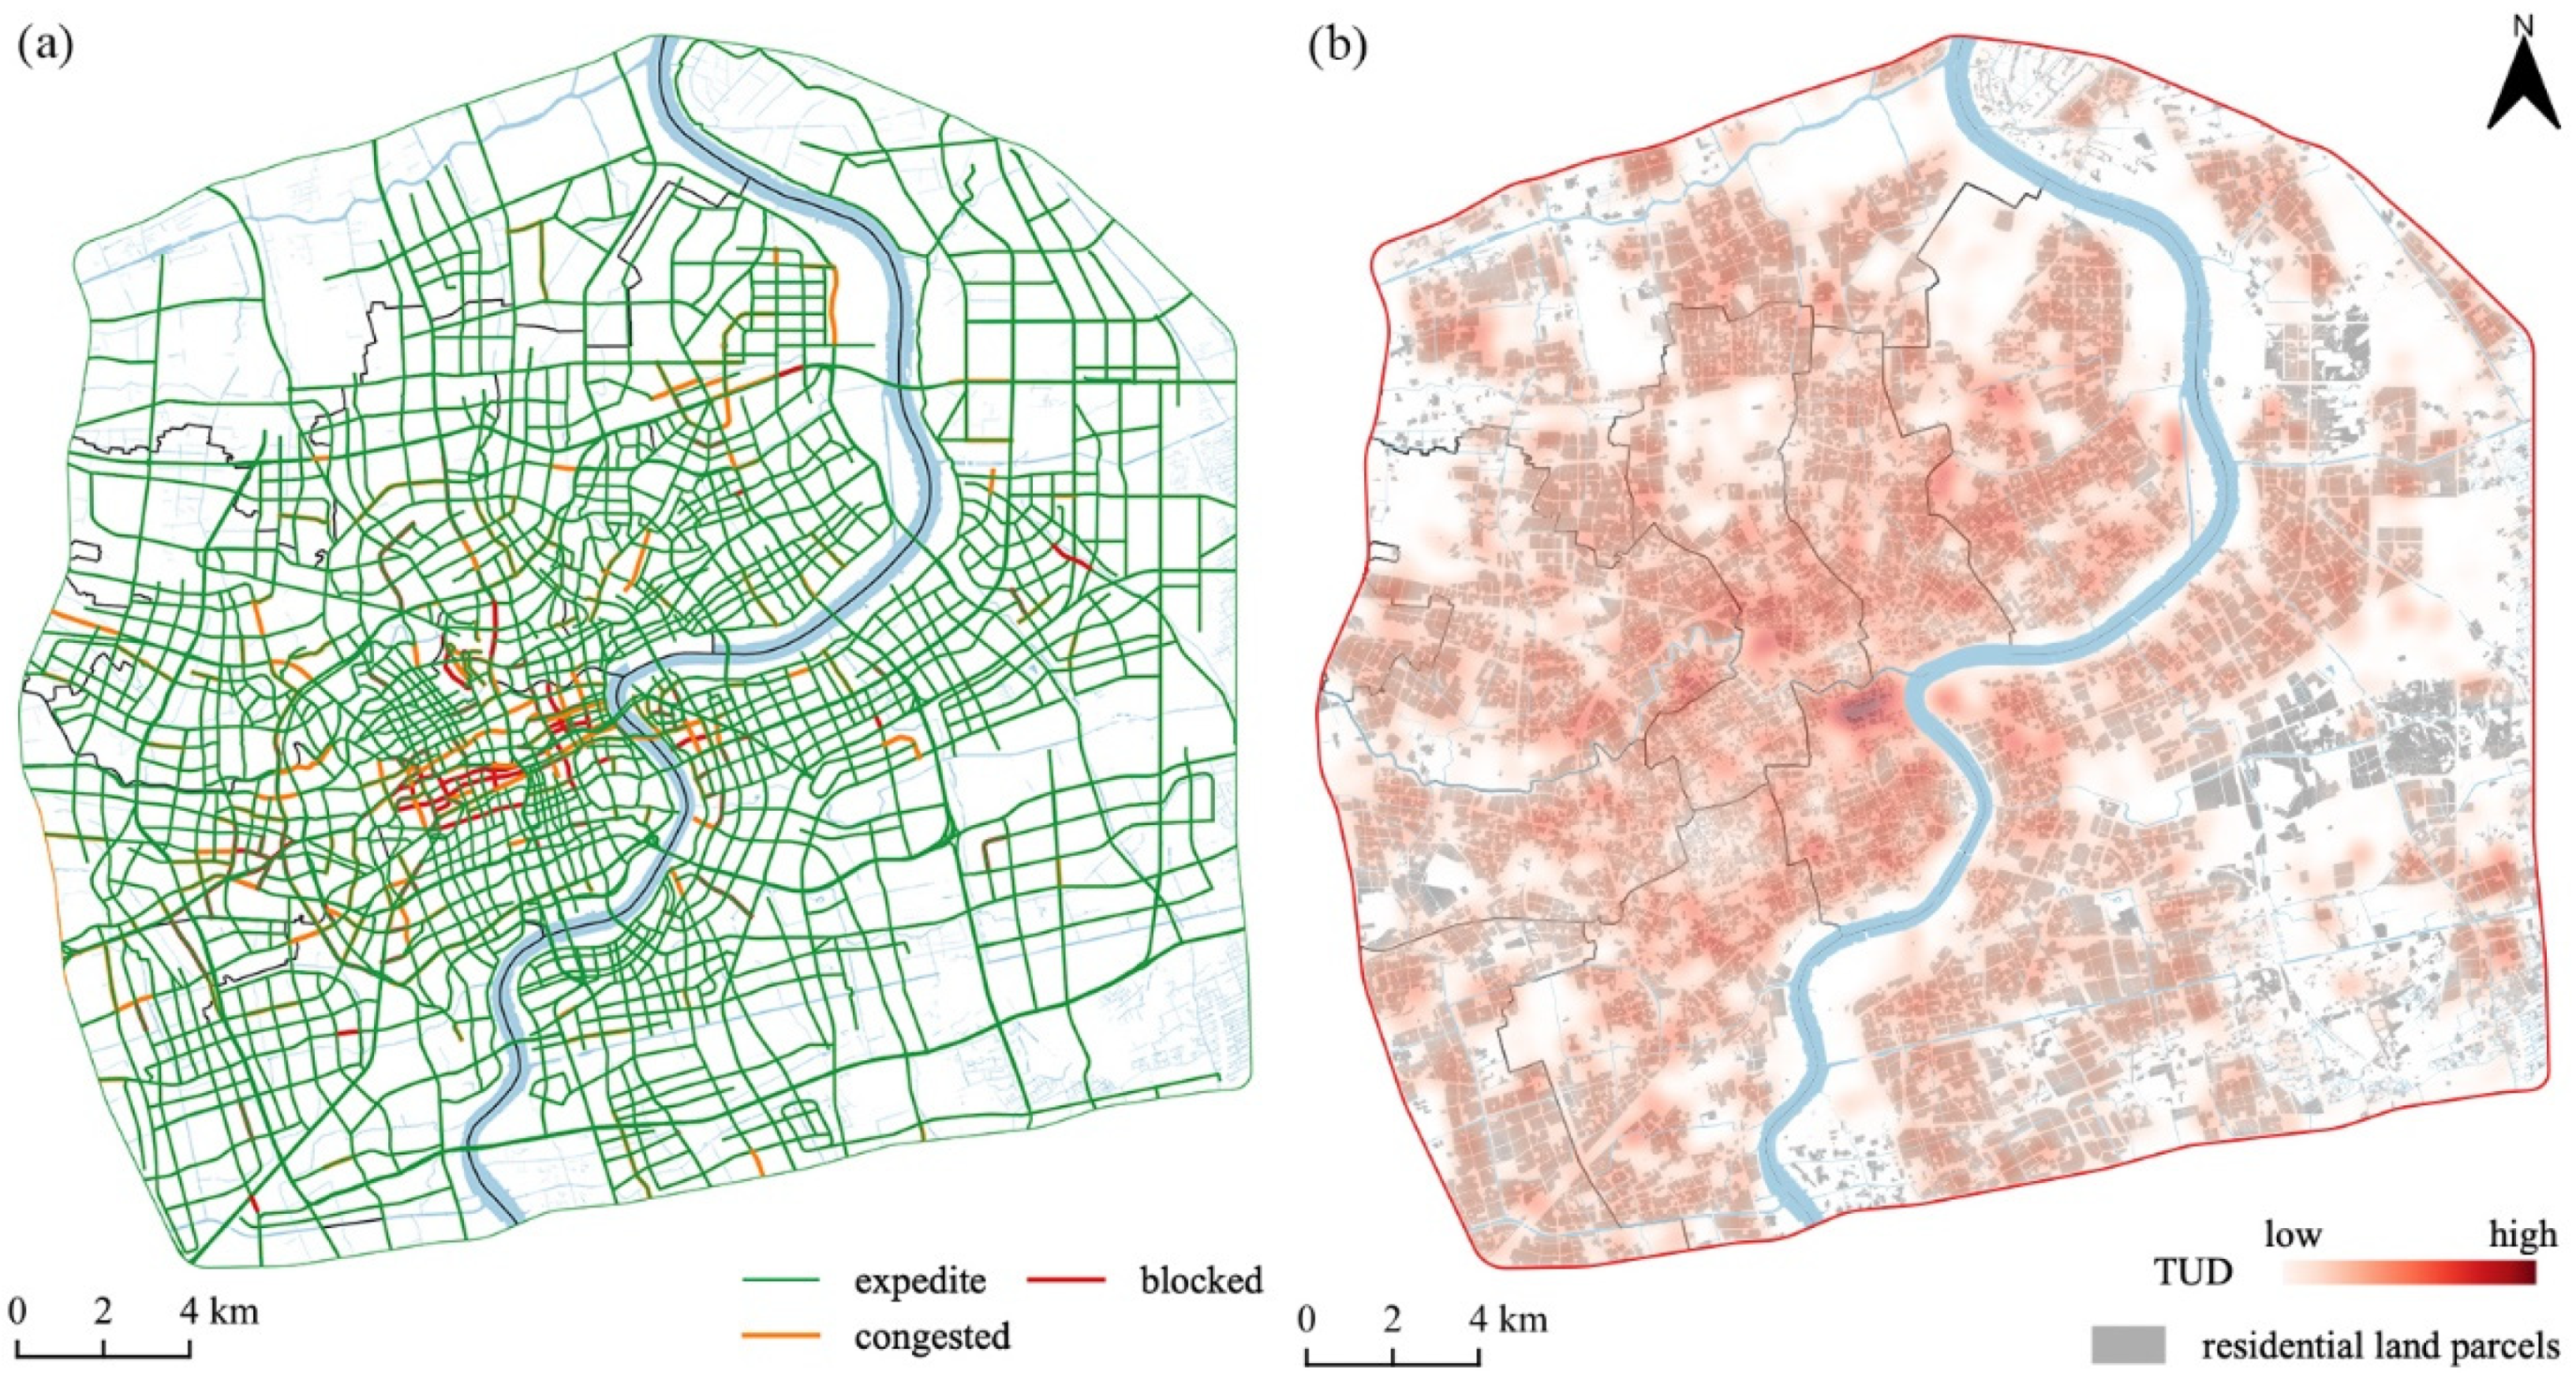
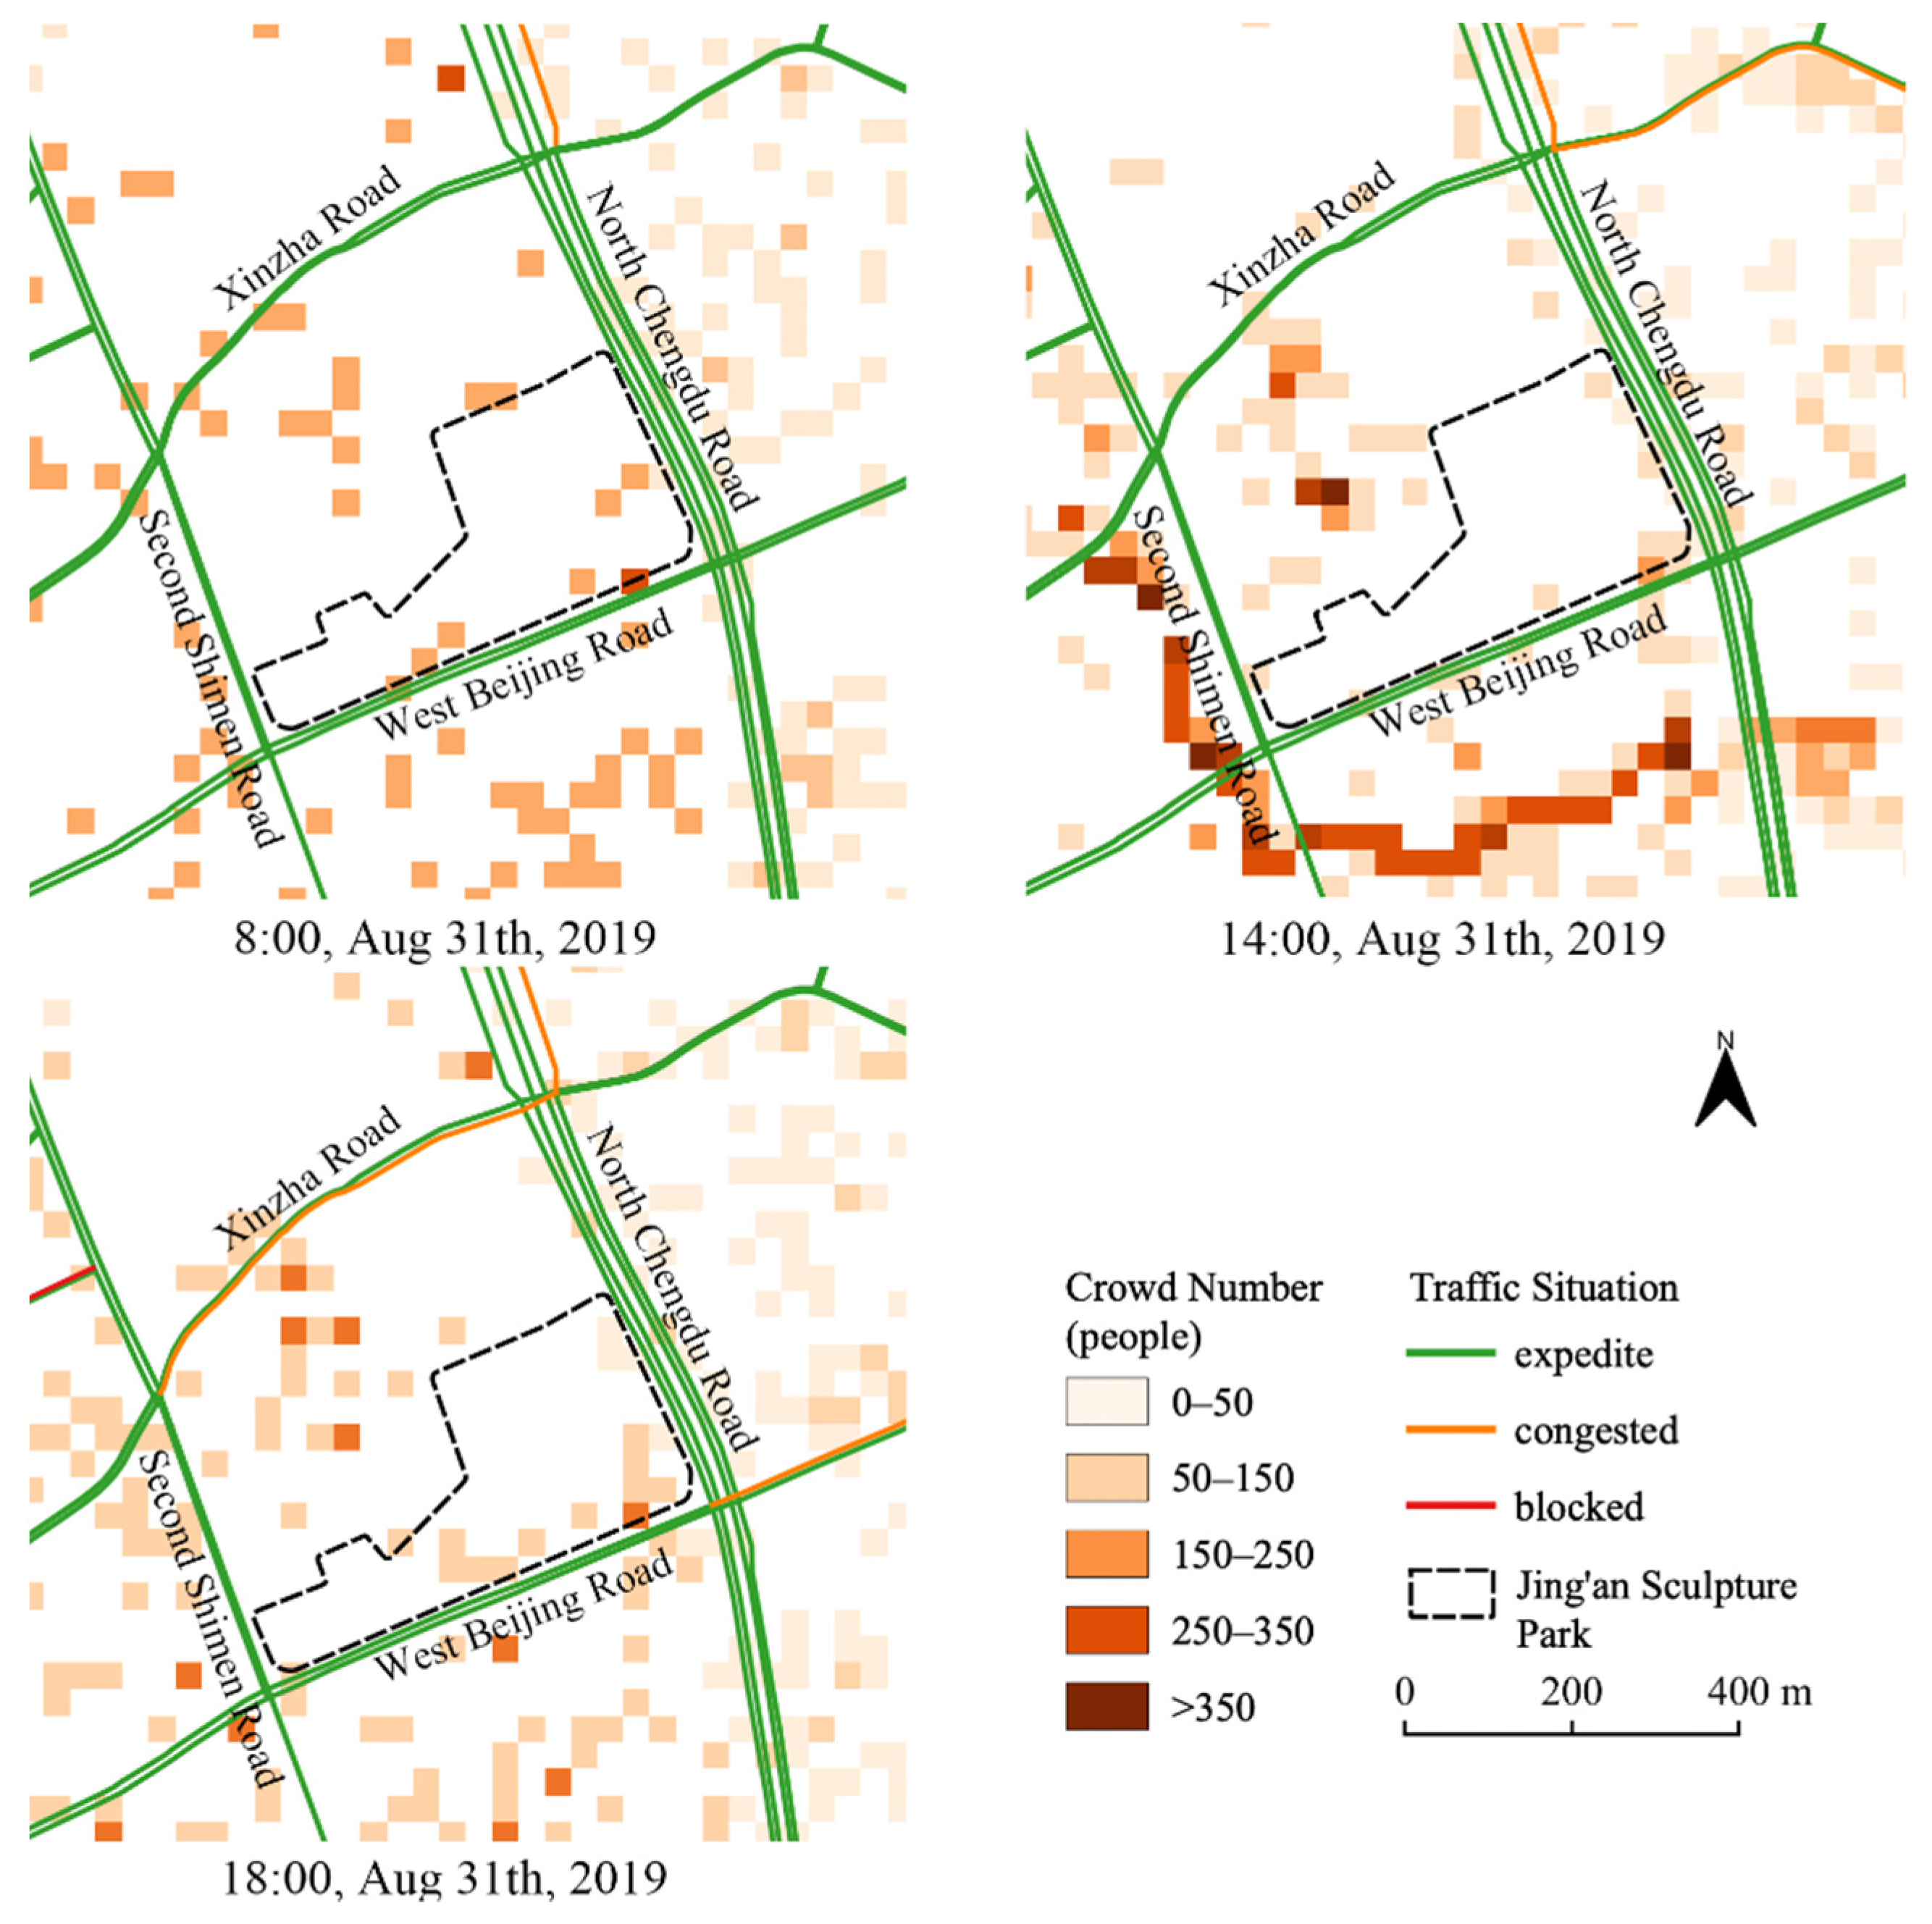
Urban open public spaces are quite different from other urban places, such as residential communities or schools. Most urban open public spaces are closely related to the external environment, such as the streets and roads in the surrounding areas. When an emergency occurs, the traffic situation of the external roads affects the situation of the internal crowd-gathering of the open public space. Congested traffic makes rescuing more difficult as the rescue vehicles cannot enter the crowd accident area. Therefore, in this study, the average traffic congestion degree of the surrounding roads of an open public space is taken as the traffic situation factor of the open public space. The traffic situation of the external environment for an open public space is calculated as follows:
T S = 1 N i = 1 N t s i
where N is the total number of adjacent roads of an open public space; t s i is the traffic situation of the i -th adjacent road. The traffic situation of each road is divided into four levels: 0—unknown, 1—expedite, 2—congested, and 3—blocked.

Severity Index

The severity of accidents in open public spaces is related to the crowd-gathering size exposed to the accident and the crowd structure (such as gender and age). The greater the crowd-gathering size exposed to the accident, the higher the proportion of vulnerable groups, and the accident casualties are likely to be more serious. However, it is difficult to obtain the data of crowd structure and the specific location of the accidents in open public spaces. Therefore, relevant studies have mostly used crowd-gathering size to indicate the severity of accidents [42]. In this study, the high crowd mobility inside and outside the open public space is also considered. People outside the public space may also be affected by the crowd-gathering accident. Therefore, the weighted sum of the number of people inside the public space and the number of people outside the public space is used to express the severity of the accident consequence as follows:
S = β 1 C i n + β 2 C o u t
where C i n and C o u t represent the number of people inside and outside the open public space, respectively; β 1 and β 2 are the weight coefficients of C i n and C o u t , respectively.

Risk Aversion Factor

The risk aversion factor is also an important factor in the risk assessment. Risk assessment should consider not only the extent of the direct damage (such as the number of fatalities or monetary costs), but also the indirect impact of the accident (such as the social and economic impact) [43]. Both direct and indirect effects should be included in the quantitative risk assessment, which can be quantitatively represented by the risk aversion factor in this study. The risk aversion factor depends on two factors as follows:
A = 1 + 0.1 × ( γ 1 F + γ 2 M )
In this equation, F represents the influence of the reputation of an open public space on the risk aversion factor. Crowd-gathering accidents occurring in a public space that has a high reputation or is near well-known places (such as a large conference site) will cause greater social impact compared to those occurring in the public spaces that are not well known. These accidents will have higher values of F . M represents the influence of public space type on the risk aversion factor. γ 1 and γ 2 are the weight coefficients of two factors.
The value evaluation standard of F for different open public spaces is shown in Table 2. The social media user comment data are used to evaluate the reputation of open public spaces. The spatial distance analysis is used to evaluate the proximity of open public spaces to well-known places.
The influence of public space type on the risk aversion factor ( M ) is evaluated according to the standard in Table 3.
The above equations, including Equations (8) to (13), are integrated to calculate the value of crowd-gathering risk in open public spaces quantitatively. After ranking the risk of different open public spaces, a risk map can be generated to describe the rank and spatial distribution of crowd-gathering risk. Based on the information provided in the map, the government and relative administrative departments can discriminate the key open public spaces that need to have intensive crowd-gathering prevention and determine the crowd control measures to reduce the crowd-gathering risk.

3. Case Study

3.1. Study Area

We conducted a case study in the area within the Outer-ring Road of Shanghai, China. Shanghai is the world-famous financial, shipping, and trading center in China. The total area of Shanghai is over 6300 km2. At the end of 2019, it had 16 districts and 215 subdistricts [44]. The area within the Outer-ring Road is the core area and the most densely populated region in Shanghai. It has nearly half of the population in about 10% of the total area of Shanghai. The proportion of Tencent users in the whole population in this area is high. Therefore, the TUD data in this area are of high quality. Taking the above-mentioned reasons in consideration, we selected the area within the Outer-ring Road of Shanghai as our study area (Figure 3).

3.2. Data Acquisition and Processing

To conduct the risk assessment of crowd-gathering in urban open public spaces in the study area, different data were acquired for the case study, including the residential land parcel data, the open public space data, the TUD data, the census data, and the real-time traffic situation data.
The residential land parcel data in this case study were interpreted based on 2013 aerial images with a spatial resolution of 0.25 m.
The open public space data were obtained by visual interpretation based on the points of interest (POIs) of open public spaces from Amap map data (https://ditu.amap.com, accessed on 10 October 2019). Amap is one of the biggest map service providers in China, whose map data have been widely used in urban studies [45]. Among all types of POIs, only “scenic spots”, “park square”, “park”, and “city square” were selected, which were confirmed to be public spaces. Then, the Amap map data were further utilized to distinguish the boundaries of these public spaces. Finally, after artificial proofreading, 307 open public areas (Figure 3) were confirmed and their areas were calculated.
The TUD data (Figure 4) in the study area were crawled from the ‘‘Easygo’’ website by a web crawler based on Python language. For this study, from 25 August to 31 August in 2019, we accessed the TUD data hourly from 5 a.m. to 10 p.m. (18 times a day totally). From 3 November to 9 November in 2019, we crawled the data from 9 a.m. to 5 p.m. (9 times a day totally). Among these 14 days, 25, 31 August and 3, 9 November were weekends, and the rest were workdays. The TUD data were converted to spatial raster data with a spatial resolution of 27 m [46], with each grid in the raster data having a value representing the number of users.
The census data at the subdistrict scale were acquired from the 6th National Population Census of Shanghai in 2010. Since the TUD data were in 2019, to obtain the population in 2019, population change was considered to extrapolate the population data from 2010 to 2019. The natural growth rate of each subdistrict was calculated based on the Shanghai Statistical Yearbook of 2019, and the residential population of each subdistrict was derived.
Moreover, when the TUD data were obtained, we fetched the real-time passenger flow data in scenic areas released by “Shanghai Municipal Administration of Culture and Tourism” from the “Shanghai Fabu” website (the authority information release platform of the Shanghai government) at the same time, which recorded the real-time numbers of people in different scenic areas. The real-time passenger flow data can be used to represent the actual real-time crowd number in open public spaces. There are 5 open public spaces that have both real-time passenger flow data obtained from “Shanghai Fabu” website and estimated crowd number data. Therefore, the passenger flow data in these 5 open public spaces were used to assess the accuracy of the estimated crowd density result.
Real-time traffic situation data (Figure 4) were also obtained from the Amap API, which includes road condition index and real-time vehicle speed information. Based on Python language, a crawler was designed to retrieve and process the data at the same time when crawling the TUD data. The traffic situation of each road was divided into four levels: 0—unknown, 1—expedite, 2—congested, and 3—blocked. For the road with unknown road condition, the road condition was assumed to be 1—expedite.
The evaluation of place dangerousness was based on high-resolution remote sensing images, photos of open public spaces obtained from social media platforms and field surveys of the open public spaces. The criterion “number of obstacles” was evaluated by counting the numbers of obstacles in each open public space. The numbers of obstacles per unit area in open public spaces in the study area were calculated, and they were divided into five levels corresponding to the scores 0–5 in Table 1. The criterion value of “number of obstacles” of an open public space was assigned according to its actual level of obstacle number per unit area. The criteria values of “affected degree of steps” and “affected degree of slopes” were also evaluated by the same method. The criterion “affected degree of ground pavements/materials” was evaluated by expert judgement on the basis of acquired ground pavement proportion and material data of the open public spaces. The reputations of open public spaces were collected based on the social media user comment data on the Dianping Website (https://www.dianping.com, accessed on 31 August 2019), which is a well-known social media platform in China. In this study, the numbers of user comments for different open public spaces were utilized to evaluate the reputations of these open public spaces. The greater the number of user comments, the higher the reputation of the open public space. Furthermore, if an urban open public space did not have a high reputation itself, the nearby well-known places that have high reputations were searched based on spatial distance analysis. The searching result determined the value of F of the open public space.

4. Results and Discussion

4.1. TUD–Population Calibration Result

At night, the distribution of urban population is more stable than that in the daytime. We calculated the average nighttime TUD data between 21:00–22:00. The TUD data were overlaid with the residential land data in each subdistrict in the study area. Then, the sum of the TUD values in each subdistrict was calculated and the total TUD value of each subdistrict was generated. The total TUD value of each subdistrict and the residential population of each subdistrict were imported in the TUD–population calibration method to estimate the crowd number at each grid in the study area. The experiment results showed that the coefficients b 0 and b 1 of the TUD–population calibration method (Equation (2)) were 27,654 and 55.4, respectively. The fitting results showed that the R-square of the regression equation was 0.76 (Figure 5). All the parameters used in the equation were significant at the 0.05 confidence level in the t-test, indicating that the fitting effect was good.
After examining the fitting effect, the fitting parameters were input into Equation (2) and applied to each grid in the study area to obtain the estimated population raster data of the study area (Figure 6).

4.2. Crowd Density Estimation Result in Urban Open Public Space

To generate the crowd number of the open public spaces, an overlay analysis was conducted between the open public spaces spatial data and the calibrated population raster data in the estimated time periods. Then, the crowd density in each open public space was calculated based on the area and the crowd number of each open public space. The passenger flow data in the five open public spaces located in the study area that monitored by “Shanghai Fabu” were employed to assess the accuracy of the estimated crowd density. The accuracy estimation results are shown in Figure 7 and Table 4.
The CCs of the three selected times (9:00, 12:00, and 15:00 from 25 August to 31 August in 2019) in Figure 7 are all over 0.5, respectively. The MAE is 27, 27, and 37 person/ha, respectively. The estimated crowd density is highly correlated with the passenger flow data, which demonstrates that the proposed method is feasible to estimate the crowd density of the urban public spaces.
To explore the difference in crowd density distribution in the open public spaces at different times, three times on a weekday and another three times on a weekend were selected for thematic mapping, respectively. The crowd densities in various open public spaces exhibit significant differences. From the urban center area to the urban fringe, the crowd density of open public space shows a downward trend.
The estimated spatial distribution of crowd density in the open public spaces at three different times on 27 August 2019 (Tuesday) is shown in Figure 8. At 9:00, the highest crowd density of an open public space was 3928 person/ha, and the lowest was 0 person/ha. The average crowd density of the open public spaces was 163 person/ha. At 12:00, the highest crowd density of an open public space was 8586 person/ha, and the lowest was 0 person/ha. The average crowd density of the open public spaces was 190 person/ha. At 15:00, the highest crowd density of an open public space was 2741 person/ha, and the lowest was 0 person/ha. The average crowd density of the open public spaces was 195 person/ha. The open public spaces that had high crowd densities were mostly near business districts and transportation facilities.
Figure 9 shows the estimated spatial distribution of crowd density in the open public spaces at three different times on 25 August 2019 (Sunday). At 9:00, the highest crowd density of an open public space was 9123 person/ha, and the lowest was 0 person/ha. The average crowd density of the open public spaces was 187 person/ha. At 12:00, the highest crowd density of an open public space was 2305 person/ha, and the lowest was 0 person/ha. The average crowd density of the open public spaces was 185 person/ha. At 15:00, the highest crowd density of an open public space was 2060 person/ha, and the lowest was 0 person/ha. The average crowd density of the open public spaces was 169 person/ha. Different from the weekdays, the open public spaces that had high crowd densities in the weekend were mostly parks, because of the residents’ recreation demands on rest days. The crowd densities in Shanghai Botanical Garden, Shanghai Zoo, Shanghai Century Park, and many other parks in the weekends were significantly higher than those in the weekdays.
Time distribution of population in the open public spaces varies between the weekdays and weekends (Figure 10). The peak hours on weekends appeared at 7:00 and 19:00. On workdays, the peak hours appeared at 7:00 and 18:00.

4.3. The Identification of the Key Open Public Spaces

Referring to the crowd density standards in relevant studies [37,47], the thresholds of 300 person/ha and 1000 person/ha were used in this case study. An open public space with a crowd density higher than 300 person/ha and lower than 1000 person/ha in any period of time is regarded as a secondary key open public space, which needs intensive crowd-gathering prevention, while an open public space with a crowd density higher than 1000 person/ha in any period of time is regarded as a key open public space.
The weekdays and weekends showed different numbers and spatial distributions for key open public places (Figure 11, Figure 12, Figure 13 and Figure 14). In the 307 open public spaces, the numbers of the secondary key open public spaces on weekdays and weekends were 46 and 53, the numbers of the key open public spaces on weekdays and rest days were 8 and 22, which is 16.3% and 24.4% of the total, respectively. The number of key open public places in Puxi (the west side of Huangpu River) was obviously more than that in Pudong (the east side of Huangpu River). The number of key open public spaces on the weekends showed a big increase compared with that on the weekdays, but the increase of the secondary key open public spaces is not significant.
As mentioned in Figure 11, Figure 12, Figure 13 and Figure 14, Pudong, Jing’an, and Huangpu Districts had the largest number of key and secondary key open public spaces on weekdays and weekends. Changning, Jing’an, and Pudong had the largest increment of key and secondary key open public spaces on weekends compared with weekdays. The prevention and control of these areas need to be strengthened.

4.4. Risk Assessment Results of Crowd-Gathering in Key Open Public Spaces

4.4.1. The Calculation Results of Probability, Severity, Risk Aversion Factor, and Crowd-Gathering Risk

Firstly, the analytic hierarchy process (AHP) method was used to generate the weight coefficients. The AHP [48] is a widely used multicriteria technique. This approach can determine criteria weights by assessing the relative importance of these criteria [49]. α 1 , α 2 , α 3 , α 4 were 0.31, 0.27, 0.21, 0.21. β 1 , β 2 were 0.84, 0.16. γ 1 , γ 2 were 0.58, 0.42. Then, according to the Equations (9), (12) and (13), the probability, severity and risk aversion factor of all the key open public spaces in different times were calculated. Figure 15 shows the calculation results for 7 a.m. to 8 a.m. on 26 August 2019. The morning peak on weekdays is not only the morning exercise time for the elderly, but also the peak commute time for office workers. People gather and disperse quickly in the public spaces connected with the residential lands and traffic facilities, which therefore have a high risk of crowd-gathering (Figure 15).
The open public spaces that have a high probability of crowd accident occurrence are widely distributed. The high-severity areas appear in the open public spaces with both interior and exterior crowding, which are mostly distributed in Huangpu, Hongkou, and Changning districts.
Calculations were then conducted according to Equation (8) to generate the crowd-gathering risk values for all the key open public spaces. The risk values were classified into four classes according to the quantile classification method: low, middle–low, middle–high, high. The open public spaces with high risk level are mostly distributed in Huangpu, Xuhui, Changning, Jing’an, and Hongkou districts.

4.4.2. Spatio-Temporal Distribution of Crowd-Gathering Risk in Open Public Spaces

As shown in Figure 16, the sum of crowd-gathering risk values of all the key and secondary key open public spaces in the study area was calculated for each time from 7:00 to 19:00. In the morning of the weekends, the risk exceeded or equaled that of the weekdays. In the afternoon of the weekends, the risk was far less than that of the weekdays. In the evening, the change of the risk values on the weekdays and weekends showed the opposite trends. The risk on the weekdays tends to grow in the evening, while the risk on the weekends tends to reduce. The time that had the highest risk value on the weekdays was 13:00, and the time on the weekends was 17:00.
The difference in crowd-gathering risk between the weekdays and weekends is significant at certain times. For example, at 17:00, the average crowd-gathering risk in Huangpu’s open public spaces on the weekends was 1.8 times higher than that on the weekdays. However, at 13:00, the average crowd-gathering risk in Huangpu’s open public spaces on weekdays was 1.7 times higher than that on the weekends. Therefore, different prevention and control strategies are necessary for weekends and weekdays. Through the crowd-gathering risk assessment results of this paper, it can be determined which districts need to take different preventive measures on weekends and weekdays.

4.5. Discussion

4.5.1. The Value of Crowd-Gathering Assessment Results in Urban Emergency Management and Decision-Making

The crowd-gathering assessment results can be further analyzed to support urban emergency management and decision-making. Taking the crowd-gathering assessment result at a time (7:00 a.m. on 26 August 2019) as an example, the global Moran’s I was used to explore the gathering trend of crowd-gathering risk in the open public spaces. The distances between open public spaces were used as the spatial weights matrix. The analysis result showed that the global Moran’s I in the study area was 0.17. When the global Moran’s I is greater than 0, it indicates that the data present a global spatial autocorrelation. On the one hand, it showed that the distribution of high-risk open public spaces in the study area had a cluster tendency, and on the other hand, it also showed that the crowd-gathering risks in open public spaces were similar in adjacent areas. In other words, similar external environmental factors will lead to high risks of crowd-gathering in adjacent open public spaces.
Through the overall analysis of the crowd-gathering risk in the open public spaces, this paper found that the areas at high risk of crowd-gathering were concentrated in several key areas of the study area. By the investigation of the main urban functions in these areas, it can be found that most of these areas have concentrated, abundant commercial and leisure facilities. In the past urban development and construction, the monocentric urban development pattern led to the excessive concentration of urban functions in some individual regions and a relative increase the crowd-gathering risk. Hence, on how to reduce the risk of crowd-gathering in open public spaces in the downtown area, this paper puts forward the following suggestions for the government: (1) Speed up the implementation of the polycentric urban development plan, ease the urban functions of the downtown area, accelerate the construction of subsidiary centers, and disperse the living and working population in the main center of the city. Such measures can reduce the crowd-gathering risk in some key open public spaces; (2) Optimize the road network structure to avoid traffic congestion and guarantee traffic flow safety adjacent to the open public spaces; (3) Optimize the spatial layout of emergency facilities and the allocation of the emergency rescue personnel to improve the rescue efficiency in emergencies for open public spaces.

4.5.2. The Application Value of the Crowd-Gathering Risk Assessment in the Risk Prevention for a Specific Open Public Space

The crowd-gathering risk assessment method in this paper can assess the crowd-gathering risk in the open public spaces and provide support for macroscopic decisions. Meanwhile, it can also provide valuable decision-making data for risk prevention and control of the specific open public spaces in the study area. Taking the Jing’an Sculpture Park (Figure 17) as an example, it was identified as a secondary key open public space. During the time period in this study (from 25 August to 31 August 2019), 89% of the time periods had high crowd-gathering risks. The quantitative risk value on weekends was significantly higher than that on weekdays. Therefore, three representative times (8:00, 14:00, and 18:00) on 31 August 2019 (a weekend day) were selected for further analysis. Figure 18 shows the external traffic situation, and the internal and external crowd-gathering situation of the park. The crowd-gathering risk of the park reached its lowest point of the day at 8:00. Only small amounts of people gathered inside the park. At 14:00, the crowd-gathering risk reached its highest point and the risk rank was the “high” level (Table 5). Although the crowd-gathering inside the park was not as obvious at the other two moments, large crowds gathered in the surrounding areas, such as at the Shanghai Natural History Museum. Another time at which the crowd-gathering risk reached the “high” level was at 18:00 (Table 5). Due to the fair weather on that day, a large number of people gathered in the park. The crowd gathered mainly at the southern entrance and the southeast of the park. Some surrounding roads also showed a congested traffic situation.
Through the analysis of the crowd-gathering risk in the Jing’an Sculpture Park, it can be concluded that (1) it is likely to cause crowd-gathering in some internal area, such as the entrance region of the park. At the same time, a large number of people are often distributed outside the park. When an emergency occurs, the evacuation efficiency of the crowd will be reduced and the time cost of evacuation will be increased. (2) The Jing’an Sculpture Park is located near several major roads. At some times, the road traffic situations easily falls into a congested state. In the event of an emergency, the dense traffic flow will block the rapidly evacuating crowd and impede the entry of rescue vehicles.
According to the crowd-gathering assessment results of this paper, the following suggestions are put forward according to the situation of the Jing’an Sculpture Park: (1) The risk assessment results can be used to establish the management plans for the park in different time periods. When the crowd-gathering risk is in the states of “medium high” and “high”, different numbers of personnel on duty can be arranged. When in a “high” risk state, patrols can be strengthened in the park where crowds are likely to gather, and the spatial distribution of personnel on duty can be reasonably allocated. It can be found that crowds in Jing’an Sculpture Park tend to gather at the south and southwest entrances, and it is suggested to strengthen the allocation of personnel on duty in these locations. (2) In terms of the design optimization of park facilities, except for considering the beauty of the garden landscape, attention also needs to be given to the impact of park facilities on crowd-gathering risk. Effective measures of layout optimization should be undertaken to disperse the crowd in the areas where people tend to gather. Other improvement measures can also be taken, such as widening the internal road segments where there are bottleneck points and removing the obstacles that hinder the crowd evacuation. (3) According to the influence of external factors, such as the surrounding road traffic conditions, reasonable evacuation routes and schemes should be pre-arranged with consideration of the difficulty and efficiency of evacuation. Crowd evacuation drills should be carried out regularly to improve the efficiency of crowd evacuation when emergencies occur. For example, at 18:00, the crowd mostly gathered at the south and southeast entrance of the park, and the roads in the north and east of the park were also in a congested state. Therefore, when emergencies occur, the crowd in the park can be guided to go out from the southwest entrance and be evacuated to the south and west safe regions along West Beijing Road and Second Shimen Road.

5. Conclusions

This study proposes a new approach supported by multisource geospatial big data to measure the crowd-gathering risk in urban open public spaces. Firstly, a new crowd density estimation method based on Tencent user density (TUD) data is proposed. In this method, TUD data can be calibrated by the residential population using a linear regression function. Then, the dynamic crowd density in the urban open public spaces can be accurately estimated. Secondly, a spatio-temporal crowd-gathering risk measurement method for urban public spaces is presented. Key open public spaces that need intensive crowd-gathering prevention can be determined based on reasonable crowd density thresholds. For these key open public spaces, the quantified crowd-gathering risk assessment can be conducted on the basis of risk theory, which considers the occurrence probability of crowd-gathering events, severity, and the risk aversion factor. Detailed risk ranks can be spatially described on thematic maps. The advantages of this study lie into two aspects: (1) In this study, fine-scale crowd density in urban open public spaces in large areas can be estimated by calibrating the spatio-temporal big data (TUD data), which overcomes the shortages of traditional estimation methods. (2) The proposed risk assessment method of crowd-gathering in urban open public spaces simultaneously considers the internal and external environments of the open public spaces. Different external risk factors, such as the traffic situation and the number of people outside the open public spaces, are taken into consideration, which makes the crowd-gathering risk assessment more rational and comprehensive.
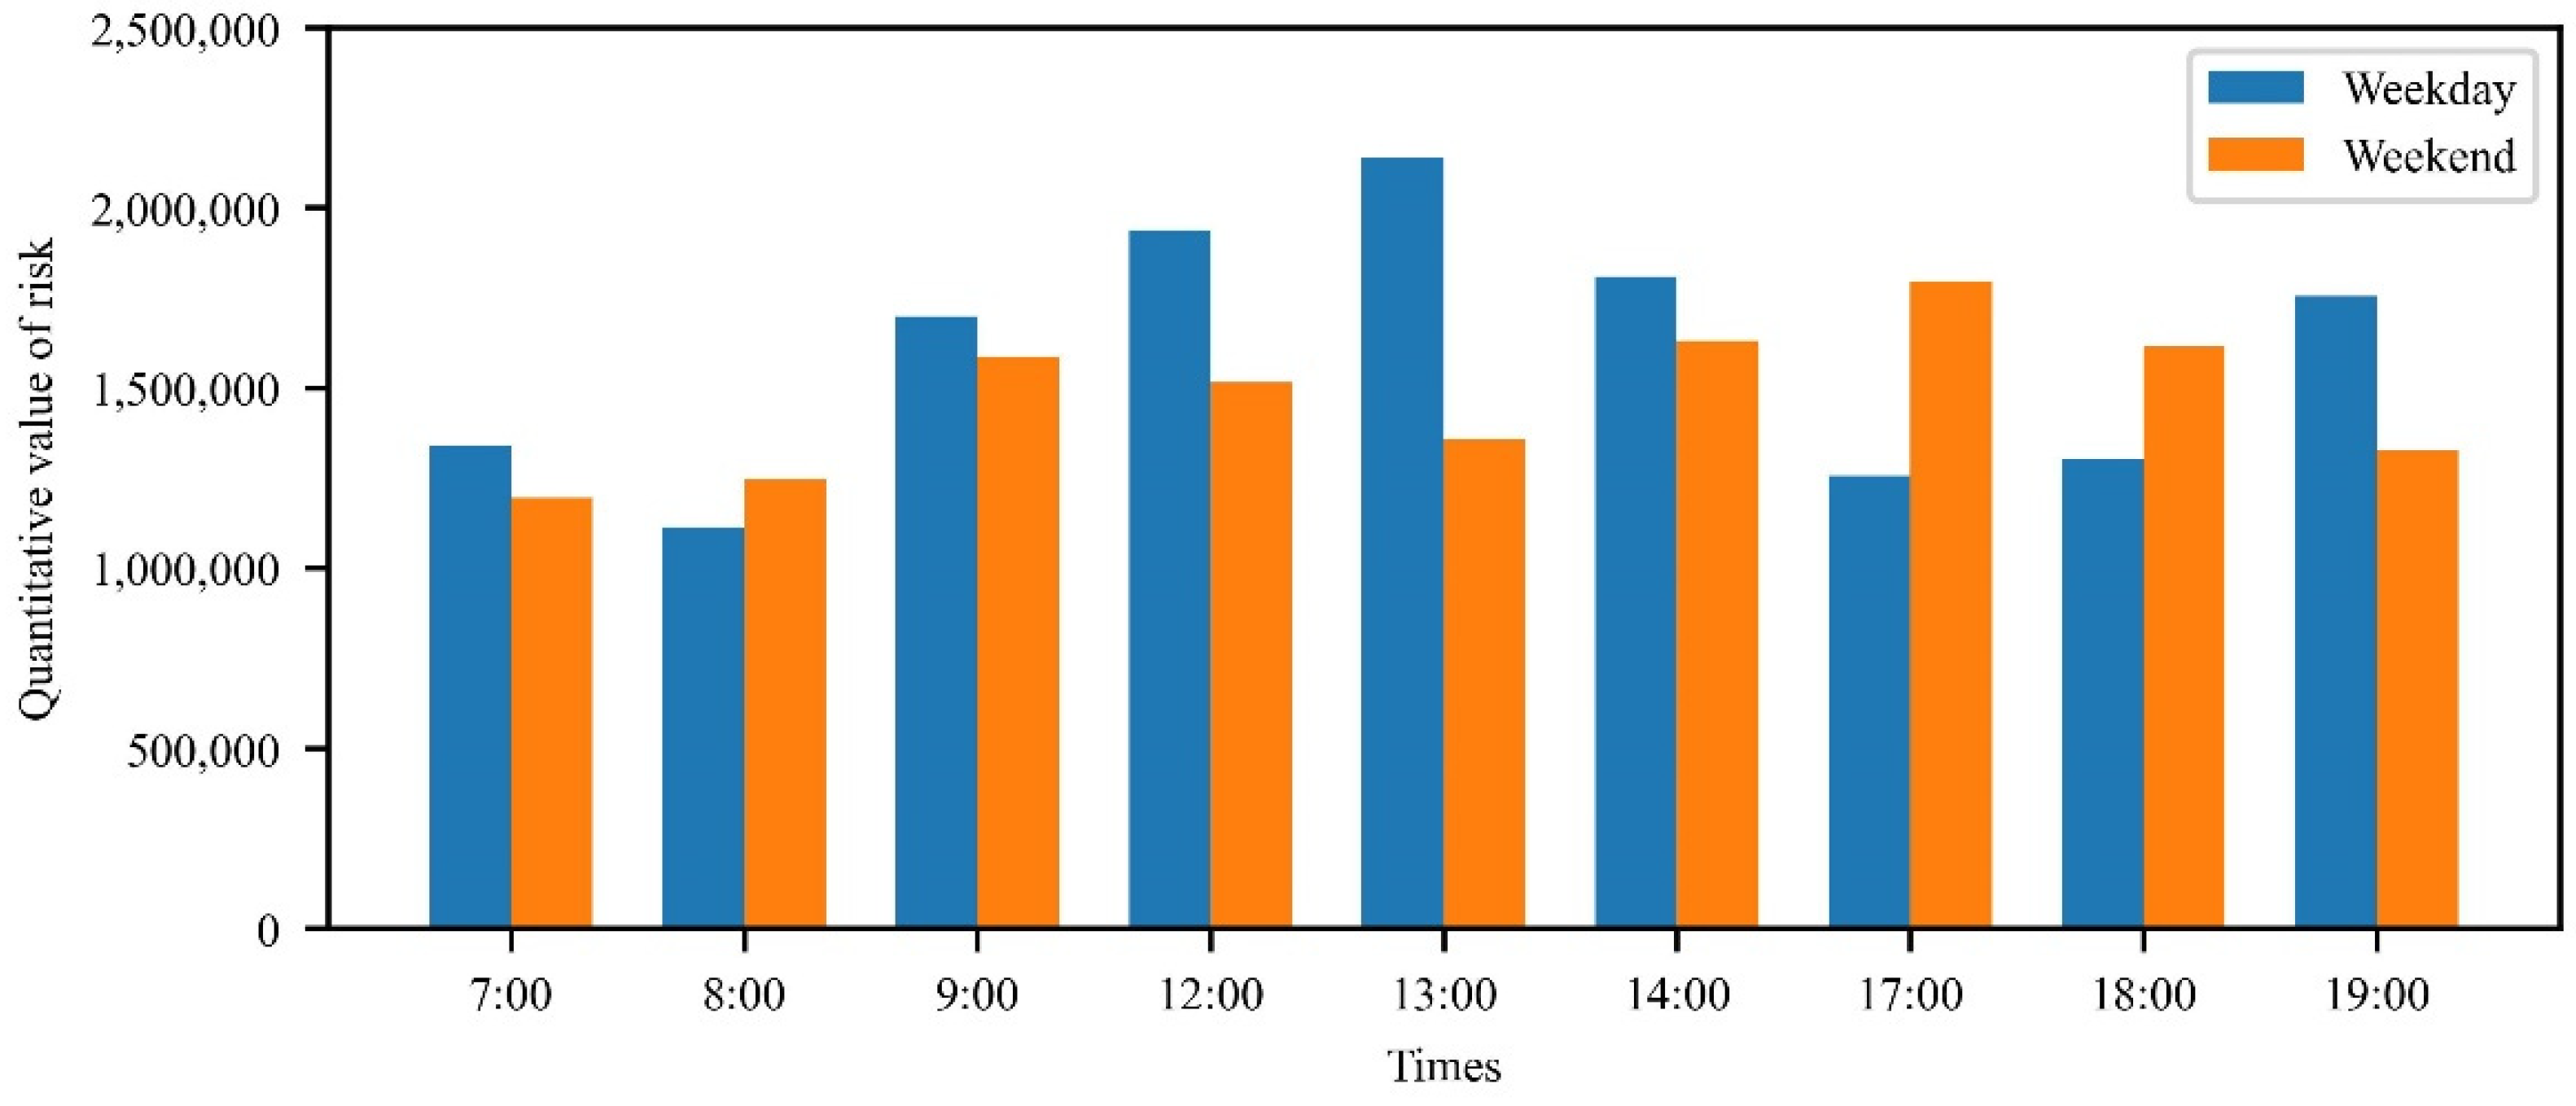
A case study in the area within the Outer-ring Road of Shanghai, China was conducted to demonstrate the feasibility of the proposed method. By utilizing the proposed TUD–population calibration method, the crowd densities at different times were calculated for each open public space in the study area. The crowd density in various open public spaces presented significant differences on the weekdays and weekends. From the center area to the urban fringe, the crowd densities of open public spaces showed a tendency to decrease. Key and secondary key open public spaces that need intensive crowd-gathering prevention were identified by the crowd density thresholds. Utilizing the proposed crowd-gathering risk assessment method, the spatial and temporal distribution of crowd gathering risk in urban open public spaces in the study area was described on thematic maps. The kernel density analysis showed a similar polycentric spatial distribution of crowd-gathering risk for weekdays and weekends. According to the risk rank and spatial distribution provided in the map, governments can determine the crowd control measures to be taken in different open public spaces, make reasonable arrangements of field staffs, and optimize the sign design to reduce the crowd-gathering risk and prevent the occurrence of dangerous events.
Limited by the availability of data, the proposed method in this paper has some inadequacies. (1) Considering the spatial resolution of the TUD data (the size of a pixel in the study area is 27 m × 27 m), the people in the nearby parcels, such as office buildings, may be counted in the crowd density estimation of open public spaces, which reduces the accuracy of the estimation. (2) This paper adopts an artificial method, instead of simulation methods, to score the place dangerousness factors of open public spaces, which may not fully represent the impact of obstacles on the crowd-gathering risk. (3) Moreover, this study uses the officially issued real-time passenger flow data to verify the precision of the crowd density estimation; however, only a small number of scenic areas have such officially issued data. In the future, the crowd densities obtained from video footage recorded by video cameras or field surveys in open public spaces can be used to verify the crowd density estimation.

Author Contributions

Conceptualization, Y.Y. and J.Y.; methodology, Y.Y. and J.Y.; software, Y.Y.; data curation, C.W.; writing—original draft preparation, Y.Y. and J.Y.; writing—review and editing, J.Y. and J.W. All authors have read and agreed to the published version of the manuscript.

Funding

This research was funded by Chinese National Natural Science Foundation, grant number [72074151], Shanghai Natural Science Foundation, grant number [20ZR1441500] and Chinese National Social Science Foundation, grant number [18ZDA105].

Conflicts of Interest

The authors declare no conflict of interest.

References

  1. UN. World Urbanization Prospects: The 2014 Revision-Highlights; United Nations: New York, NY, USA, 2014.
  2. Li, X.H.; Zhou, J.N.; Chen, F.; Zhang, Z. Cluster Risk of Walking Scenarios Based on Macroscopic Flow Model and Crowding Force analysis. Sustainability 2018, 10, 385. [Google Scholar] [CrossRef] [Green Version]
  3. Lee, R.S.C.; Hughes, R.L. Prediction of human crowd pressures. Accid. Anal. Prev. 2006, 38, 712–722. [Google Scholar] [CrossRef]
  4. Zhou, H.; Zheng, Z.; Cen, X.; Huang, Z.; Wang, P. A Data-Driven Urban Metro Management Approach for Crowd Density Control. J. Adv. Transp. 2021, 2021, 6675605. [Google Scholar] [CrossRef]
  5. Yin, J.; Bi, Y.; Zheng, X.M.; Tsaur, R.C. Safety Forecasting and Early Warning of Highly Aggregated Tourist Crowds in China. IEEE Access 2019, 7, 119026–119040. [Google Scholar] [CrossRef]
  6. Xu, Z.J.; Hou, L.Y.; Zhang, Y.Y.; Zhang, J.Q. Passenger Flow Prediction of Scenic Spot Using A GCN–RNN Model. Sustainability 2022, 14, 3295. [Google Scholar] [CrossRef]
  7. Helbing, D.; Mukerji, P. Crowd disasters as systemic failures: Analysis of the Love Parade disaster. EPJ Data Sci. 2012, 1, 1–40. [Google Scholar] [CrossRef] [Green Version]
  8. Shanghai Bund Chen Yi Square crowded stampede investigation Committee. Investigation Report on the Crowded and Stampede in Chen Yi Square on the Bund on 31 December 2015; Shanghai Bund Chen Yi Square crowded stampede investigation Committee: Shanghai, China, 2015. [Google Scholar]
  9. Kurdi, H.; Alzuhair, A.; Alotaibi, D.; Alsweed, H.; Almoqayyad, N.; Albaqami, R.; Althnian, A.; Alnabhan, N.; Islam, A.B.M.A.A. Crowd Evacuation in Hajj Stoning Area: Planning through Modeling and Simulation. Sustainability 2022, 14, 2278. [Google Scholar] [CrossRef]
  10. Wei, H.J.; Li, Z.G.; Chi, J.J.; Che, S.Q. Structure models and optimization strategies of public open spaces in Shanghai city proper. J. Shanghai Jiaotong Univ. Agric. Sci. 2016, 34, 91–98. [Google Scholar]
  11. Li, J.F.; Wang, L.; Tang, S.C.; Zhang, B.; Zhang, Y.B. Risk-based crowd massing early warning approach for public places: A case study in China. Saf. Sci. 2016, 89, 114–128. [Google Scholar] [CrossRef]
  12. Helbing, D.; Molnar, P. Social force model for pedestrian dynamics. Phys. Rev. E 1995, 51, 4282. [Google Scholar] [CrossRef] [Green Version]
  13. Liu, Y.Y.; Kaneda, T. Using agent-based simulation for public space design based on the Shanghai Bund waterfront crowd disaster. Ai Edam-Artif. Intell. Eng. Des. Anal. Manuf. 2020, 34, 176–190. [Google Scholar] [CrossRef] [Green Version]
  14. Hu, C.; Guo, J.T.; Li, Q.; Chen, J. Method for evaluating crowd risk and identifying critical nodes in open public places. China Saf. Sci. J. 2015, 25, 164–169. [Google Scholar] [CrossRef]
  15. Still, K.; Papalexi, M.; Fan, Y.; Bamford, D. Place crowd safety, crowd science? Case studies and application. J. Place Manag. Dev. 2020, 13, 385–407. [Google Scholar] [CrossRef]
  16. Liu, X.F.; Lin, T.; Zheng, Q.H.; Chen, Y.K.; Jia, Y.Q. Quantitative risk assessment of crowd safety in urban public space in street form. China Saf. Sci. J. 2016, 26, 134–139. [Google Scholar] [CrossRef]
  17. Zhang, X.; Yu, Q.; Wang, Y. Fuzzy Evaluation of Crowd Safety Based on Pedestrians’ Number and Distribution Entropy. Entropy 2020, 22, 832. [Google Scholar] [CrossRef]
  18. Zhang, M.H.; Yao, Y.; Xie, K.F. Prediction and Diversion Mechanisms for Crowd Management Based on Risk Rating. Engineering 2017, 9, 377–387. [Google Scholar] [CrossRef] [Green Version]
  19. Lee, R.S.; Hughes, R.L. Exploring Trampling and Crushing in a Crowd. J. Transp. Eng. 2005, 131, 575–582. [Google Scholar] [CrossRef]
  20. Federico, B.; Susannah, M.H.; Tobias, P. Quantifying crowd size with mobile phone and Twitter data. R. Soc. Open Sci. 2015, 2, 150162. [Google Scholar]
  21. Wirz, M.; Franke, T.; Roggen, D.; Mitleton-Kelly, E.; Lukowicz, P.; Tröster, G. Probing crowd density through smartphones in city-scale mass gatherings. EPJ Data Sci. 2013, 2, 1–24. [Google Scholar] [CrossRef] [Green Version]
  22. Zhang, J.J.; Shi, Z.G.; Li, J.C. Current researches and future perspectives of crowd counting and crowd density estimation technology. Comput. Eng. Sci. 2018, 40, 282–291. [Google Scholar]
  23. Hara, H.; Fujita, Y.; Tsuda, K. Population estimation by random forest analysis using Social Sensors. Procedia Comput. Sci. 2020, 176, 1893–1902. [Google Scholar] [CrossRef]
  24. Liu, S.; Lai, S.Q.; Liu, C.; Jiang, L. What influenced the vitality of the waterfront open space? A case study of Huangpu River in Shanghai, China. Cities 2021, 114, 103197. [Google Scholar]
  25. Yao, Y.; Liu, X.P.; Li, X.; Zhang, J.B.; Liang, Z.T.; Mai, K.; Zhang, Y.T. Mapping fine-scale population distributions at the building level by integrating multisource geospatial big data. Int. J. Geogr. Inf. Sci. 2017, 31, 1220–1244. [Google Scholar] [CrossRef]
  26. Zhang, X.D.; Yu, J.; Chen, Y.; Wen, J.H.; Chen, J.Y.; Yin, Z.E. Supply-demand analysis of urban emergency shelters based on spatiotemporal population estimation. Int. J. Disaster Risk Sci. 2020, 11, 519–537. [Google Scholar] [CrossRef]
  27. Wu, Z.Y.; Xu, H.W.; Hu, Z.M. Fine-Scale Population Spatialization Based on Tencent Location Big Data: A Case Study of Moling Subdistrict, Jiangning District, Nanjing. Geogr. Geo-Inf. Sci. 2019, 35, 61–65. [Google Scholar]
  28. Tao, Z.Y.; Quan, L.Q.; Wei, T.; Ke, M.; Yao, Y.; Yong, C.Y. Functional urban land use recognition integrating multi-source geospatial data and cross-correlations. Comput. Environ. Urban Syst. 2018, 78, 101374. [Google Scholar]
  29. Chen, Y.Y.; Liu, X.P.; Gao, W.X.; Wang, R.Y.; Li, Y.; Tu, W. Emerging social media data on measuring urban park use. Urban For. Urban Green. 2018, 31, 130–141. [Google Scholar] [CrossRef]
  30. Jiang, J.Y.; Su, C.; Hu, J.C.; Zhang, J.H. Inquiry into the Activity Time and Job-residence Location of Urban Park Visitors at a Block Scale with a Comparison of Spatial and Temporal Difference. J. Environ. Inf. Sci. 2020, 2019, 25–36. [Google Scholar] [CrossRef]
  31. Zhang, Z.F.; Liu, L.; Cheng, S.S. Measurement of Potential Victims of Burglary at the Mesoscale: Comparison of Census, Phone Users, and Social Media Data. ISPRS Int. J. Geo-Inf. 2021, 10, 280. [Google Scholar] [CrossRef]
  32. Duan, Y.M.; Liu, Y.; Liu, X.H.; He, D. Measuring polycentric urban structure using Easygo big data: A case study of Chongqing metropolitan area. Prog. Geogr. 2019, 38, 1957–1967. [Google Scholar] [CrossRef]
  33. Liu, X.P.; He, J.L.; Yao, Y.; Zhang, J.B.; Liang, H.L.; Wang, H.; Hong, Y. Classifying urban land use by integrating remote sensing and social media data. Int. J. Geogr. Inf. Sci. 2017, 31, 1675–1696. [Google Scholar] [CrossRef]
  34. He, J.; Li, X.; Liu, P.; Wu, X.; Zhang, J.; Zhang, D.; Liu, X.; Yao, Y. Accurate Estimation of the Proportion of Mixed Land Use at the Street-Block Level by Integrating High Spatial Resolution Images and Geospatial Big Data. IEEE Trans. Geosci. Remote Sens. 2021, 59, 6357–6370. [Google Scholar] [CrossRef]
  35. Gao, F.; Huang, G.P.; Li, S.Y.; Huang, Z.W.; Chai, L. Integrating the Eigendecomposition Approach and k-Means Clustering for Inferring Building Functions with Location-Based Social Media Data. ISPRS Int. J. Geo-Inf. 2021, 10, 834. [Google Scholar] [CrossRef]
  36. Chen, P.; Chen, J.G.; Hu, X.F. Analysis and Thoughts on Disaster Mechanism of Huge Crowds Stampede Incidents. J. UESTC Soc. Sci. Ed. 2016, 18, 25–29. [Google Scholar] [CrossRef]
  37. Baud-Bovy, M.; Lawson, F. Tourism and Recreation: Handbook of Planning and Design; Butterworth-Heinemann Ltd.: Oxford, UK, 1998. [Google Scholar]
  38. Aven, T. Risk assessment and risk management: Review of recent advances on their foundation. Eur. J. Oper. Res. 2016, 253, 1–13. [Google Scholar] [CrossRef] [Green Version]
  39. Li, J.F.; Zhang, B.; Tang, S.C.; Tong, R.P. A risk-based approach and its application on land-use planning in crowd massing public places. Georisk Assess. Manag. Risk Eng. Syst. Geohazards 2014, 8, 92–105. [Google Scholar] [CrossRef]
  40. Sun, Y.; Fang, D.P.; Wang, S.Q.; Dai, M.D.; Lv, X.Q. Safety Risk Identification and Assessment for Beijing Olympic Venues Construction. J. Manag. Eng. 2008, 24, 40–47. [Google Scholar] [CrossRef]
  41. Ye, R.K.; Chen, J.W.; Ni, W.M.; You, L.J. Risk assessment of public safety in urban crowd gathering areas. Urban. Probl. 2020, 97–103. [Google Scholar] [CrossRef]
  42. Zuo, L.Y. Study on Quantitative Assessment of Crowd Risk and Space Optimization Strategy in Urban Public Space—A Case Study of Chongqing Zoo. Master’s Thesis, Chongqing University, Chongqing, China, 2019. [Google Scholar]
  43. Plattner, T. An integrative model of natural hazard risk evaluation. Manag. Inf. Syst. 2004, 9, 649–658. [Google Scholar]
  44. Shanghai Local Records Office. Shanghai Yearbook 2020. Available online: http://www.shtong.gov.cn/dfz_web/DFZ/Info?idnode=262774&tableName=userobject1a&id=450560 (accessed on 12 April 2022).
  45. Cai, M.; Lan, Z.Q.; Zhang, Z.W.; Wang, H.B. Evaluation of road traffic noise exposure based on high-resolution population distribution and grid-level noise data. Build. Environ. 2019, 147, 211–220. [Google Scholar] [CrossRef]
  46. Rao, Y.X.; Li, X. Accurate Extraction of Spatial Distribution of Population Flow Based on Population Thermal Map and Land Use Classification. Geomat. Spat. Inf. Technol. 2019, 42, 36–39. [Google Scholar]
  47. Fang, J.; Wang, D.; Xie, D.C.; Wang, C.; Wang, H.Y.; Wu, M.; Ye, X.Y.; Duan, Z.Y. Research on dynamic change and early warning of large tourist flow based on mobile signal data analysis: A case study of Gucun Park Sakura Festival in Shanghai. City Plan. Rev. 2016, 40, 43–51. [Google Scholar]
  48. Saaty, T.L.; Vargas, L.G. Prediction, Projection and Forecasting: Applications of the Analytic Hierarchy Process in Economics, Finance, Politics, Games and Sports; Springer: Dordrecht, The Netherlands, 1991. [Google Scholar]
  49. Yu, J.; Chen, Y.; Wu, J.P.; Khan, S. Cellular automata-based spatial multi-criteria land suitability simulation for irrigated agriculture. Int. J. Geogr. Inf. Sci. 2011, 25, 131–148. [Google Scholar] [CrossRef]
Figure 1. The methodology framework in this study.
Sustainability 14 06175 g001
Figure 2. The application process of TUD–population calibration method.
Sustainability 14 06175 g002
Figure 3. The area within the Outer-ring Road of Shanghai, China.
Sustainability 14 06175 g003
Figure 4. (a) The traffic situation data (18:00 26 August 2019) and (b) the kernel density of TUD data (22:00 25 August 2019) in residential land parcels.
Sustainability 14 06175 g004
Figure 5. The linear regression fitting result of the TUD data and the residential population of each subdistrict in the area within the Outer-ring Road of Shanghai, China.
Sustainability 14 06175 g005
Figure 6. The calibrated population raster data in the study area at 9:00 on 25 August 2019 (resampled to 100 m resolution).
Sustainability 14 06175 g006
Figure 7. The accuracy estimation results of the crowd density at three times from 25 August to 31 August in 2019.
Sustainability 14 06175 g007
Figure 8. Spatial distribution of crowd density in urban public spaces in the area within the Outer-ring Road of Shanghai at 9:00, 12:00, and 15:00 on 27 August 2019.
Sustainability 14 06175 g008
Figure 9. Spatial distribution of crowd density in urban public spaces in the area within the Outer-ring Road of Shanghai at 9:00, 12:00, and 15:00 on 25 August 2019.
Sustainability 14 06175 g009
Figure 10. The crowd number variations in all open public spaces in the study area.
Sustainability 14 06175 g010
Figure 11. Key open public spaces on weekdays.
Sustainability 14 06175 g011
Figure 12. Key open public spaces on weekends.
Sustainability 14 06175 g012
Figure 13. The comparison of key open public spaces on weekdays and weekends in each district.
Sustainability 14 06175 g013
Figure 14. The comparison of secondary key open public spaces on weekdays and weekends in each district.
Sustainability 14 06175 g014
Figure 15. The calculation results of probability, severity, risk aversion factor, and crowd-gathering risk for urban open public spaces in the area within the Outer-ring Road of Shanghai.
Sustainability 14 06175 g015
Figure 16. Temporal distribution of total crowd-gathering risk in the open public spaces in the study area.
Sustainability 14 06175 g016
Figure 17. The location of the Jing’an Sculpture Park.
Sustainability 14 06175 g017
Figure 18. The crowd-gathering condition and the external road traffic situation of the Jing’an Sculpture Park at three times (8:00, 14:00, 18:00) on 31 August 2019.
Sustainability 14 06175 g018
Table 1. Criteria of place dangerousness for open public places.
CriteriaScore
Number of obstacles5: a great many; 4: many; 3: median; 2: a little; 1: little; 0: None
Affected degree of steps5: very high; 4: high; 3: median; 2: low; 1: very low; 0: None
Affected degree of slopes5: very high; 4: high; 3: median; 2: low; 1: very low; 0: None
Affected degree of ground pavements/materials5: very high; 4: high; 3: median; 2: low; 1: very low; 0: None
Table 2. The influence of the reputation of an open public space on the risk aversion factor ( F ) for different urban open public spaces.
Standard Value   of   F
A public space has a very high reputation itself5
A public space has a high reputation itself4
A public space located near a well-known place3
A public space located in the vicinity of a well-known place2
None of the above1
Table 3. The influence of public space type on the risk aversion factor ( M ) for different types of urban open public spaces.
Standard Value   of   M
Botanical garden, zoo, or scenic park3
Other Park2
Square1
Table 4. The accuracy estimation results of the crowd density at different times from 25 August to 31 August in 2019.
TimeCCMAE
90.8027.0
100.2140.0
110.4132.0
120.5327.0
130.6624.0
140.5729.0
150.5737.0
160.5052.0
170.6432.0
18−0.0875.0
Table 5. The risk ranks of the Jing’an Sculpture Park at three times (8:00, 14:00, 18:00) on 31 August 2019.
8:0014:0018:00
Crowd-gathering Riskmiddle–highhighhigh
Probabilityhighhighmiddle–high
Severityhighhighhigh
Publisher’s Note: MDPI stays neutral with regard to jurisdictional claims in published maps and institutional affiliations.

