Abstract
Understanding the spatio-temporal variations in the frost-free period (FFP) and the number of frost days (FD) is beneficial to reduce the harmful effects of climate change on agricultural production and enhancing agricultural adaptation. However, the spatio-temporal variations in FFP and FD and their response to climate change remain unclear across China. To investigate the impact of climate change on FFP and FD, the trends and variations in FFP and FD across China from 1950 to 2020 were quantified using ERA5-Land, a reanalysis dataset with high spatial and temporal resolution. The results showed that ERA5-Land has good applicability in quantifying the trends and variations in FFP and FD across China under climate change. The spatial distribution of multi-year average FFP and FD across China showed significant latitudinal zonality and altitude dependence, i.e., FFP decreased with increasing latitude and altitude, while FD increased with increasing latitude and altitude. As a result of climate warming across China, the FFP showed an increasing trend with an increase rate of 1.25 d/10a and the maximum increasing rate of FFP in the individual region was 6.2 d/10a, while the FD showed a decreasing trend with a decrease rate of 1.41 d/10a and the maximum decreasing rate of FD in the individual region was −6.7 d/10a. Among the five major climate zones in China, the subtropical monsoon climate zone (SUMZ) with the greatest increasing rate of 1.73 d/10a in FFP, while the temperate monsoon climate zone (TEMZ) with the greatest decreasing rate of −1.72 d/10a in FD. In addition, the coefficient of variation (Cv) of FFP showed greater variability at higher altitudes, while the Cv of FD showed greater variability at lower latitudes in southern China. Without considering the adaptation to temperature of crops, a general increase in FFP and a general decrease in FD were both beneficial to agricultural production in terms of FFP and FD promoting a longer growing period and reducing frost damage on crops. This study provides a comprehensive understanding of the trends and variations in FFP and FD under climate change, which is of great scientific significance for the adjustment of the agricultural production layout to adapt to climate change in China.
1. Introduction
The frost-free period (FFP) is the period of the year after the last frost day (LFD) and before the first frost day (FFD), during which no hoarfrost occurs [1,2,3]. The FFP is closely related to the growing period of crops, as a long FFP is associated with a long growing period of crops, and the length of the FFP is a very important heat index in agriculture [1,2]. The number of frost days (FD) is the total number of days in a year that frost occurs [4,5]. Frost is a relatively common extreme agro-meteorological disaster that occurs in winter and spring [6,7,8], primarily caused by the sharp drop in temperature below 0 °C in a short time due to the southward movement of the cold wave, or by strong radiation cooling at ground level on the night of the day when the weather changes from cloudy to clear sky condition after being affected by a cold wave [6,9,10,11,12].
Climate change has become a common concern for scientists and the public, with the global surface temperature rising by 1.09 °C from 2011 to 2020 compared to the industrial revolution [13]. The trend of surface temperature in China is basically the same as the global one in the last hundred years, but the warming in the last 50 years is more significant than the global average [14]. Under climate warming, the frequency of cold events and the dates of frost have changed significantly in many regions of the world [15,16,17]. Climate warming has resulted in an earlier LFD, a later FFD, an increase in FFP and a decrease in FD [7,18,19,20,21,22,23], and variations in FFP and FD have had a significant positive effect on agricultural production [16,17,24,25,26,27,28,29]. This not only affected seasonal agricultural planting planning, but also the growth and development of crops [2,18,30,31,32,33]. Consequently, determining the trends and variations in FFP and FD under climate change is important for the planning and management of agricultural production, such as agricultural zoning planning, agricultural production restructuring, optimization of agricultural production structures and regional layout [2,18,30,31,34].
Research on the trends and variations in FFP and FD are generally based on surface and air temperatures observed by ground-based meteorological stations [1,22,24,35]. Although the research on trends and variations in FFP and FD based on ground-based meteorological stations is relatively effective, there are certain disadvantages to the quantification of trends and variations in FFP and FD [22,29]. This is due to the uneven distribution of meteorological stations in China and the limited number of meteorological stations, especially in the vast regions of northwest China and the Qinghai–Tibet Plateau, where the meteorological stations are very sparse [36,37,38]. Even the above studies extrapolated the results to space using algorithms such as inverse distance interpolation based on station observed data, which creates large spatial uncertainties in regions with sparse station distribution and complex topography [39]. The uneven distribution, complex topography and limited number of meteorological stations results in the less accurate assessment of many climatic and meteorological conditions [38,40,41,42], including FFP and FD.
With the development of satellite remote sensing and data assimilation techniques as well as land surface and atmospheric models, the spatial and temporal resolution of reanalysis dataset has gradually increased and is widely used for the analysis of meteorological and hydrological processes applications [43,44,45,46,47,48]. Reanalysis dataset is the result of reprocessing and analysis of historical meteorological observations to reproduce past atmospheric conditions using well-established numerical prediction models and assimilation analysis [49,50]. Reanalysis dataset is generally gridded to improve the estimation of the meteorological elements with higher spatial and temporal resolution relative to meteorological stations, and is particularly useful in the study of meteorological and hydrological processes in regions where meteorological stations are sparse and unavailable [43,51,52].
Although many studies have investigated the FFP and FD in single or multiple provinces [9,18,22,29,35,53,54,55], the spatial and temporal variations in FFP and FD, as well as their response to climate change remain unclear across China. China covers a vast region and a variety of climate zones [56,57], and the geographical distribution of FFP and FD is zonal with evident spatial differences [6,10,22]. The layout of agricultural production is closely related to climatic conditions [58], and FFP and FD are also influenced by climatic conditions. Therefore, based on the quantification of FFP and FD at a national level, it is more beneficial to understand the relationship between FFP and FD and agricultural production by further quantifying the trends and variations in FFP and FD in different climate zones.
In the current study, the daily minimum skin temperature (Ts) and daily minimum 2 m temperature (Ta) from the ERA5-Land reanalysis dataset [50,59,60] were selected as data sources for quantifying the trends and variations in FFP and FD across China, and the data sources were validated using observed daily minimum ground surface temperature (GST) and daily minimum air temperature (TEM) from the Daily Meteorological Dataset of basic meteorological elements of China National Surface Weather Stations (DMDC) (V3.0) [61]. The main objectives of this study are (1) to analyze the spatial pattern of FFP and FD across China, (2) to quantify the trends and variations in FFP and FD across China during 1950~2020 and (3) to explore the effect of variations in FFP and FD on agricultural production in China.
2. Materials and Methods
2.1. Study Area
The vast size of China, the long distances between east and west, north and south, and the very different topographical and climatic characteristics of the various provinces and regions have resulted in a great difference in FFP and FD across China. In general, China can be divided into five main climate zones: the alpine climate zone (ALCZ), the temperate continental climate zone (TECZ), the temperate monsoon climate zone (TMCZ), the subtropical monsoon climate zone (SUMZ) and the tropical monsoon climate zone (TRMZ) [57] (Figure 1). There is consistency in the trends and changes in FFP and FD for each climate zone, while there is wide variability in the trends and variations in FFP and FD between climate zones. In addition, China contains 34 provinces, and the trends and variations in FFP and FD for each province are highly variable. Therefore, an integrated quantitative analysis of trends and variations in FFP and FD from a national perspective and in different climatic zones is of great scientific significance to adjust agricultural production to climate change. In this study, observed daily minimum surface and air temperatures from 822 national surface weather stations (including 620 national basic synoptic stations and 202 national reference climatological stations) (Figure 1) with longer time series were selected to evaluate the applicability of ERA5-Land reanalysis dataset.
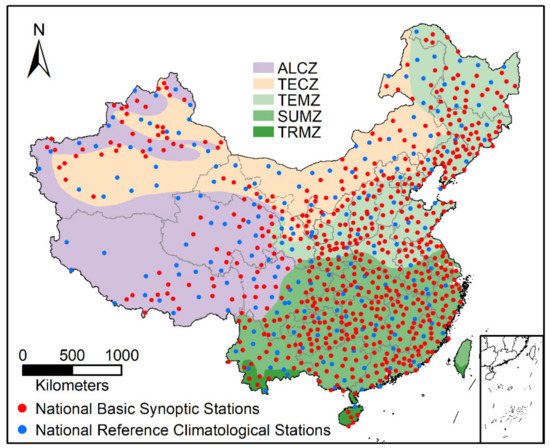
Figure 1.
China’s five main climate zones: the alpine climate zone (ALCZ), the temperate continental climate zone (TECZ), the temperate monsoon climate zone (TMCZ), the subtropical monsoon climate zone (SUMZ) and the tropical monsoon climate zone (TRMZ), and the distribution of 822 national surface weather stations in China.
2.2. Data Collection
2.2.1. Reanalysis Dataset of ERA5-Land
In this study, the daily minimum skin temperature (Ts) and daily minimum 2 m temperature (Ta) from the ERA5-Land reanalysis dataset were selected as the data source for quantifying the trends and variations of FFP and FD across China. ERA5-Land is a reanalysis dataset providing a consistent view of the evolution of land variables over several decades at an enhanced resolution, and ERA5-Land has been produced by replaying the land component of the ECMWF ERA5 climate reanalysis [50,59,60]. ERA5-Land has a high spatial resolution of 0.1 degree (approximately 10 km), a temporal resolution of one hour and a time of 1950 to the present. Because the temporal resolution of skin and air temperatures from ERA5-Land is one hour, the daily minimum Ts and daily minimum Ta selected in this study are the minimum values of 24 skin temperatures and 24 air temperatures in a day, respectively. Although the original dataset covers the 1950 to the present, we selected 1950 to 2020 as the study period. The high spatial and temporal resolution of ERA5-Land makes this dataset very useful for all kinds of land surface applications [50], such as FFP and FD quantification.
2.2.2. Dataset for ERA5-Land Evaluation
For the evaluation of daily minimum Ts and Ta from ERA5-Land, the observed daily minimum ground surface temperature (GST) and daily minimum air temperature (TEM) used to validate these land variables were collected from 822 national surface weather stations in China (Figure 1) during the 1951–2015 period and were provided by the China Meteorological Administration. Data from these observations are stored in the dataset of Daily Meteorological Dataset of basic meteorological elements of China National Surface Weather Stations (DMDC)(V3.0), which includes the daily minimum GST and daily minimum TEM [61]. Due to the early and late construction of each weather station, the time series of the observations is not consistent across weather stations. Only a few weather station observations had time series from 1951 to 2015, and most weather station observations had time series between 1951 and 2015. In particular, the time series of some weather station observations in the Qinghai–Tibet Plateau do not exceed 30 years. Therefore, the daily minimum Ts and Ta from ERA5-Land were validated by the corresponding daily minimum GST and TEM, respectively.
2.3. Methods
2.3.1. Quantitative Criteria
The FFP is the period between the LFD and the FFD, but there is no uniform definition of the LFD and FFD [22,53]. Generally, the last time the minimum surface temperature lower than 0 °C in the first half of the year is defined as the LFD, the first time the minimum surface temperature lower than 0 °C in the second half of the year is usually defined as the FFD and the period between the LFD and the FFD is defined as the FFP [53,62]. Therefore, the daily minimum Ts from ERA5-Land was used to calculate the LFD and FFD, and thus the FFP in this study.
The FD is different from the FFP, which is a period of continuity, whereas the FD is the total number of days in a year that hoarfrost occurs. The FD is one of the 27 core extreme climate change indices revisited by the joint CCl/CLIVAR/JCOMM Expert Team (ET) on Climate Change Detection and Indices (ETCCDI) [4,5], and the definition of FD is the annual count of days when the daily minimum temperature is lower than 0 °C. In view of the above definition, the daily minimum Ta from ERA5-Land was used to calculate the FD in this study.
2.3.2. Data Evaluation
Statistical indices were used for quantitative analysis of the performance of ERA5-Land in estimating the daily minimum Ts and daily minimum Ta, and four statistical indices were used in this study as follows:
where R2, NSE, MBE and RMSE are the coefficient of determination, Nash–Sutcliffe efficiency coefficient, mean bias error and root mean square error, respectively. Ri and Oi represent the estimated (reanalysis) and observed data at time i, respectively. n is the total number of time steps. cov(R,O) is the covariance of estimated (reanalysis) and observed data and σR and σO are the standard deviations of estimated (reanalysis) and observed data, respectively.
2.3.3. Trend Analysis
In this study, the non-parametric Mann–Kendall (MK) test [63,64,65,66] was used to analyze the trend and significance level of the Ts, Ta, FFP and FD.
where S is the statistic of the dataset, n is the length of the dataset, xi and xj are the sequential data values in time series i and j, m is the number of tied groups and tk denotes the number of ties of extent k and a tied group is a set of sample data having the same value. Zc is the standardized statistics of the dataset and the positive and negative values of Zc indicate increasing and decreasing trends, respectively. If |Zc| > Z1−α/2, the trend is statistically significant, otherwise, the trend is not statistically significant. Testing trends was carried out at a specific α significance level, and the significance level of α = 0.05 (95% confidence level) was applied in this study.
For the measurement of the trend in variation, the Sen’s slope method [65,66,67] was used to analyze the slope of the variation, and the slope is expressed as follows:
where β is the slope of the data variation, a positive β denotes an increasing trend, while a negative β means a decreasing trend.
3. Results
3.1. Performance of ERA5-Land
The daily minimum GST from DMDC (V3.0) was used to validate the daily minimum Ts from ERA5-Land, and the daily minimum TEM from DMDC (V3.0) was used to validate the daily minimum Ta from ERA5-Land. Figure 2 and Figure 3 show the statistical indices between the daily minimum Ts and Ta from ERA5-Land and the daily minimum GST and TEM from DMDC (V3.0) at 822 national surface weather stations in China, respectively.
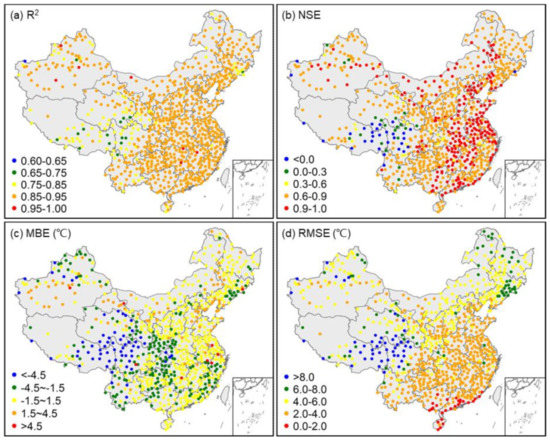
Figure 2.
Statistical indices of the daily minimum Ts from ERA5-Land against observed daily minimum GST from CMCD (V3.0) at 822 national surface weather stations in China. (a) R2, coefficient of determination; (b) NSE, Nash–Sutcliffe efficiency coefficient; (c) MBE, mean bias error; (d) RMSE, root mean square error.
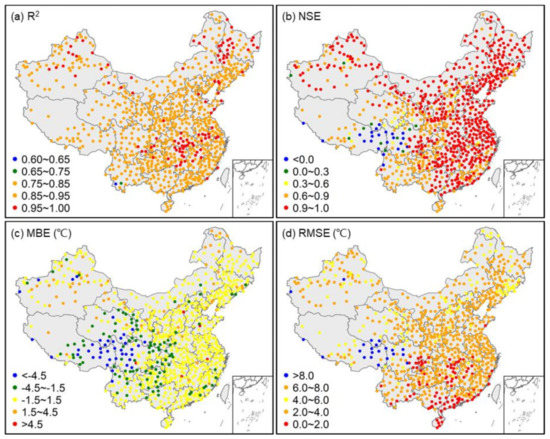
Figure 3.
Statistical indices of the daily minimum Ta from ERA5-Land against observed daily minimum TEM from CMCD (V3.0) at 822 national surface weather stations in China. (a) R2, coefficient of determination; (b) NSE, Nash–Sutcliffe efficiency coefficient; (c) MBE, mean bias error; (d) RMSE, root mean square error.
As can be seen from Figure 2a and Figure 3a, the correlation between ERA5-Land simulated and meteorological stations observed daily minimum surface temperature and air temperatures is pretty good, with an R2 greater than 0.6 at all 822 national surface weather stations across China. Overall, the performance of ERA5-Land for daily minimum Ts and Ta simulation is better in East China than in West China, and better in flat regions than in high-altitude regions, and the performance of ERA5-Land for daily minimum Ts simulations is better than that for daily minimum Ta simulations. Meanwhile, it can be seen from Figure 2 and Figure 3 that there is a significant underestimation of daily minimum Ts and Ta simulated by ERA5-Land, and this underestimation shows a regional pattern, with the underestimation of daily minimum Ts and Ta mainly concentrated in regions with high altitude and complex terrain, such as the southeastern Qinghai–Tibet Plateau. The regional underestimation of daily minimum Ts and Ta from ERA5-Land may have a negative impact on the quantification of local trends and variations in FFP and FD.
3.2. Spatial and Temporal Variation of Annual Mean Minimum Ts and Ta
3.2.1. Annual Mean Minimum Ts
To quantify the trends and variations in daily minimum Ts and Ta across China from 1950 to 2020, statistics and trend tests were conducted on the annual mean minimum Ts and Ta, as shown in Figure 4. From Figure 4a, the spatial distribution of the annual mean minimum Ts has significant latitudinal zonality and altitudinal dependence. The annual mean minimum Ts decreases with increasing altitude in high-altitude regions such as the Qinghai–Tibet Plateau, the Tianshan Mountains and the Altai Mountains, while the annual minimum Ts decreases with increasing latitude in East China and other regions.
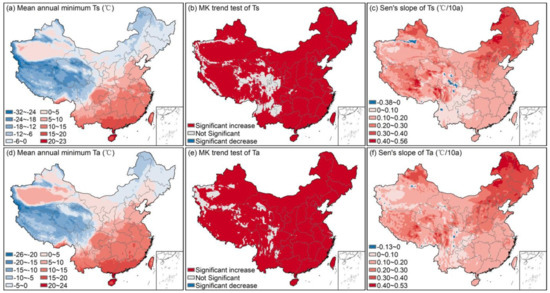
Figure 4.
Spatial distribution of annual mean minimum Ts and Ta. (a) Trends of annual mean minimum Ts based on the Mann–Kendall trend test (95% confidence level), (b) Sen’s slope of the annual mean minimum Ts, (c) annual mean minimum Ta, (d) trends of annual mean minimum Ta based on the Mann–Kendall trend test (95% confidence level), (e) Sen’s slope of the annual mean minimum Ta (f) across China during the 1950~2020.
Based on the MK trend test (Figure 4b), it shows that the annual mean minimum Ts generally shows a significant increasing trend in other regions of China, except for the borderlands in West China, the eastern Qinghai–Tibet Plateau and the Yunnan–Kweichow Plateau, where there is no significant increasing or decreasing trend of annual mean minimum Ts, but the degree of increase in annual mean minimum Ts varies greatly between regions. As can be seen from Figure 4c, Northeast China, northern Xinjiang, North China and the central and southeastern Qinghai–Tibet Plateau were the regions with the largest rates of increase in annual mean minimum Ts in China. In particular, the rate of increase in annual mean minimum Ts in Northeast China exceeded 0.2 °C/10a, with most regions experiencing increases of between 0.2 °C/10a and 0.53 °C/10a, indicating that Northeast China was the region with the most significant increase in annual mean minimum Ts in China. In addition, as can also be seen from Figure 4c, individual regions, such as the eastern and southern margins of the Tianshan Mountains, parts of the eastern Qinghai–Tibet Plateau and parts of northwest Yunnan Province showed decreasing trends in annual mean minimum Ts, but for the whole country, the annual mean minimum Ts was generally increasing rapidly.
3.2.2. Annual Mean Minimum Ta
Similar to the spatial distribution pattern of the multi-year average annual mean minimum Ts, the spatial distribution of the annual mean minimum Ta also has obvious latitudinal zonality and altitudinal dependence (Figure 4d). Except for high-altitude regions such as the Qinghai–Tibet Plateau, the Tianshan Mountains and the Altai Mountains, the annual mean minimum Ta in East China decreases with increasing latitude, and the Tarim Basin is the region with the highest annual mean minimum Ta in Northwest China due to its relatively closed geographical environment and geological conditions.
Except for the periphery of the Qinghai–Tibet Plateau and parts of the central Tarim Basin, where there is no significant trend in annual mean minimum Ta, the rest of China shows a significant increasing trend (Figure 4e). Most regions of China show a significant increasing trend in annual mean minimum Ta, but the degree of increase in annual mean minimum Ta varies considerably from place to place. As can be seen from Figure 4f, Northeast China, northern Xinjiang, North China and the eastern and central Qinghai–Tibet Plateau were the regions with the greatest rate of increase in annual mean minimum Ta across China, especially Northeast China, where the rate of increase in annual mean minimum Ta greater than 0.2 °C/10a, with most regions experiencing increases ranging from 0.2 °C/10a to 0.53 °C/10a, indicating that Northeast China was the region with the most significant increase in annual mean minimum Ta across China. Although very few regions in the Sichuan Province and Turpan Basins showed a decreasing trend in annual mean minimum Ta, nationally, the annual mean minimum Ta was generally increasing rapidly. In addition, as can be seen from Figure 4c,f, there was considerable spatial consistency in the variability of the annual mean minimum Ts and Ta across China.
3.3. Spatial and Temporal Variation of FFP
3.3.1. Spatial Distribution
Figure 5a shows the spatial distribution pattern of the multi-year average FFP across China from 1950 to 2020, from which the spatial distribution of FFP across China was characterized by obvious latitudinal zonality and altitude dependence. It is obvious that the high-altitude mountainous regions of the Qinghai–Tibet Plateau, the Qilian Mountains, the Tianshan Mountains and the Altai Mountains were the regions with the smallest FFP, especially in the northern Tibetan Plateau and the Kunlun Mountains in the northwestern part of the Qinghai–Tibet Plateau, where FFP was even less than 10 days and there was almost no FFP throughout the year. Despite the high altitude of the Tsaidam Basin in the northeastern Qinghai–Tibet Plateau, its relatively enclosed geography has resulted in a much higher FFP in the basin than in the rest of the Qinghai–Tibet Plateau, making it an extremely special region on the Qinghai–Tibet Plateau. Except for the high-altitude regions, FFP in East and Northwest China largely showed a trend of decreasing with increasing latitude. Provinces in the tropical monsoon climate zone, such as Yunnan, Guangxi, Guangdong, Taiwan and Hainan, have very high FFP, all greater than 350 days. The Sichuan Basin was also a region with very high FFP, with most regions exceeding 300 days. Overall, the spatial distribution of FFP was consistent with the spatial variation of multi-year average surface temperatures in China.
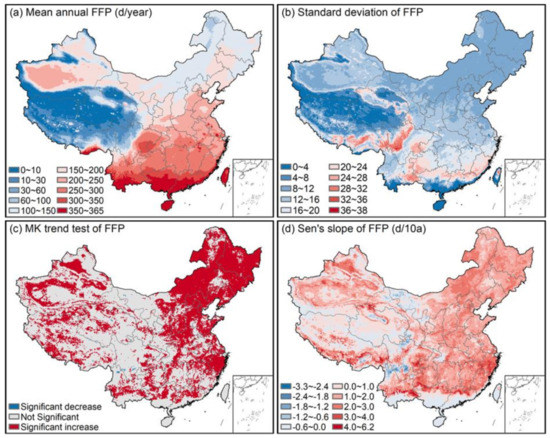
Figure 5.
Spatial distribution of multi-year average FFP, (a) standard deviation of FFP, (b) trends of FFP based on the Mann–Kendall trend test (c) and Sen’s slope of FFP (d) across China during the 1950~2020.
The standard deviation of FFP from 1950 to 2020 in Figure 5b shows that the spatial distribution of FFP varies significantly across China, with the eastern and southern parts of the Qinghai–Tibet Plateau, the regions around the Tsaidam Basin and the Sichuan Basin, as well as the southern edge of the subtropical monsoon climate zone, being regions of high interannual variability in FFP in China. Especially in the eastern and southern parts of the Qinghai–Tibet Plateau, where the standard deviation of FFP was greater than 20 days, indicating that the annual mean surface temperature in these regions was more variable indirectly. The standard deviation of FFP in other regions of China was not very variable and did not show a clear latitudinal zonality.
3.3.2. Temporal Variations
Interannual trends in FFP across China from 1950 to 2020 were quantified at the 95% confidence level based on the MK trend test and Sen’s slope method, as shown in Figure 5c,d. As can be seen from Figure 5c, there were significant regional differences in the interannual trends of FFP across China. Overall, North China, Northeast China and Zhejiang Province were the regions where the significant increase in FFP was more concentrated. The outer Tarim Basin, the Junggar Basin and the Turpan Basin were also regions with a relatively high concentration of significant increases in FFP. In addition, the FFP in some regions of the Qinghai–Tibet Plateau and South China also showed a significant increasing trend, but did not show a clear regional pattern. Only a very few regions showed a significant decreasing trend in FFP, such as parts of the southern Sichuan Province and parts of the northern Yunnan Province. A comparison of Figure 5c,b shows that the interannual trends in FFP and the annual mean minimum Ts across China were not entirely consistent.
From the decadal rates of variation in FFP in Figure 5d, there were large differences in the degree of interannual variability in FFP across China. Most regions of China showed increasing trends in FFP, with rates of variation in FFP ranging from 0 to 6.2 d/10a, except for parts of western Inner Mongolia, northern Gansu Province, the Kunlun Mountains, the central and eastern Qinghai–Tibet Plateau and northern Yunnan Province. Overall, the rapid increase in FFP was the main feature of the variations in FFP across China during 1950~2020.
3.4. Spatial and Temporal Variation of FD
3.4.1. Spatial Distribution
Similar to the spatial distribution of FFP, the spatial distribution of FD also showed a clear latitudinal zonality and altitudinal dependence (Figure 6a). Figure 6a shows the spatial pattern of the multi-year average FD across China from 1950 to 2020. The FD was greatest in the high-altitude mountainous regions of the Qinghai–Tibet Plateau, the Qilian Mountains, the Tianshan Mountains and the Altai Mountains, especially in the Kunlun Mountains in the northwestern part of the Qinghai–Tibet Plateau, where the FD even greater than 350 days. Despite its high altitude, the relatively enclosed geography of the Tsaidam Basin results in much lower FD in the basin than in other parts of the Tibetan Plateau, making the Tsaidam Basin a relatively special region on the Qinghai–Tibet Plateau. Apart from the high-altitude mountains, the FD in East China and Northwest China basically showed an increasing trend with increasing latitude. Provinces in the tropical monsoon climate zone, such as Yunnan, Guangxi, Guangdong, Taiwan and Hainan, have very low FD, all less than 10 days. The Sichuan Basin was also a region with very few FD, with most regions having less than 10 days. Overall, the spatial distribution of FD was consistent with the spatial variation of the annual mean minimum air temperature and was the opposite of the spatial distribution of FFP in China.
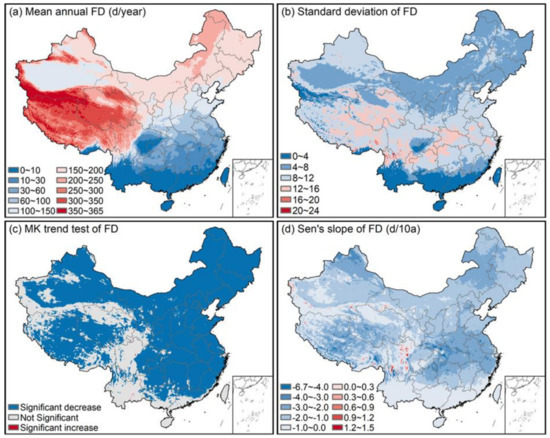
Figure 6.
Spatial distribution of multi-year average annual FD, (a) standard deviation of FD, (b) trends of FD based on the Mann–Kendall trend test (c) and Sen’s slope of the FD (d) across China during the 1950~2020.
The standard deviation of FD from 1950 to 2020 (Figure 6b) shows that there were significant differences in the spatial variation of FD across China, with the central Qinghai–Tibet Plateau, the region around the Tsaidam Basin and the region around the Sichuan Basin being regions with large interannual variability in FD in China, indicating greater variability in air temperature in these regions indirectly. The standard deviation of FD in the rest of China varied little and was similar to the spatial variation of FPP, showing no clear latitudinal zonality.
3.4.2. Temporal Variations
Interannual trends in FD across China from 1950 to 2020 were quantified at the 95% confidence level based on the MK trend test and Sen’s slope method, as shown in Figure 6c,d. As can be seen from Figure 6c, the trends of FD across China showed obvious regional differences. Overall, the FD in the peripheral alpine regions of the Qinghai–Tibet Plateau, Sichuan Basin, most of Yunnan Province, southern Guangxi Province, southern Guangdong Province, Taiwan Province and Hainan Province did not show a significant decreasing or increasing trend from 1950 to 2020. Except for the above-mentioned regions, all other regions in China showed a significant decreasing trend in FD, and only a very few regions showed a significant increasing trend in FD, indicating that the trends in FD across China were dominated by significant increasing trends, which was consistent with the trends in air temperature across China in the past decades.
Despite the clear regionalization of FD trends, the degree of increase or decrease in FD varied widely across China. Except for some alpine regions on the periphery of the Qinghai–Tibet Plateau, where an increasing trend in FD is seen, most regions in China showed a decreasing trend in FD, with rates of variation in FD ranging from 0 to −6.7/10a. The central and western parts of the Qinghai–Tibet Plateau, the middle and lower reaches of the Yangtze River, the Huaihe River Basin, northern Inner Mongolia and northern Xinjiang were the regions with the largest FD reduction rates.
3.5. Regional Interannual Trends and Variations in FFP and FD
The interannual trends and variations in FFP and FD for different climate zones were calculated by averaging the data for all gridded annual FFP and annual FD within each climate zone. Figure 7 shows the interannual trends and variations in FFP and FD across China and different climate zones from 1950 to 2020. As can be from Figure 7a, the annual FFP of China and different climate type zones showed a significant increasing trend, among which, the increase in FFP of SUMZ was the largest and the increase in FFP of TRMZ was the smallest. The national average rate of increase in FFP was 1.25 d/10a, and the rate of increase in FFP in SUMZ was 1.73 d/10a. The increase in annual FFP of China and different climate type zones was SUMZ > TEMZ > China > TECZ > ALCZ > TRMZ in order. Although the annual FFP showed an increasing trend across China and different climate zones, the process of increase was simultaneously phased. It was clear from Figure 7a that the FFP experienced a decreasing process for both China and the different climate zones from 1950 to the 1970s and 1980s, and then maintained a continuous fluctuating increasing trend from the 1970s and 1980s to the present. The phased variations in annual FFP across China were consistent with the phased variations in surface temperature across China, which was also consistent with the apparent warming of China from the 1970s and 1980s onwards [68,69].
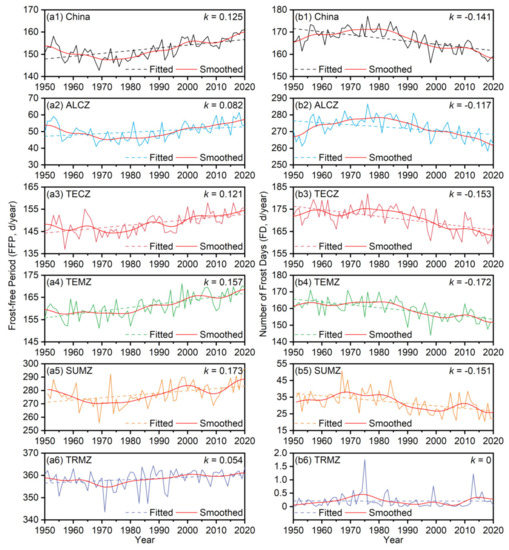
Figure 7.
Interannual trends and variations of FFP and FD for China and different climate type zones in China during the 1950~2020. k represents the degree of variation in annual FFP and FD, respectively, i.e., the slope of the data variation. (a1–a6) Annual FFP; (b1–b6) Annual FD.
Contrary to the trends and variations of annual FFP across China and different climate zones, except for the TRMZ, the annual FD showed a clear decreasing trend across China and other climate zones, where the TEMZ was the climate zone with the greatest decrease in FD. Despite the large interannual fluctuations in the FD of the TRMZ, the FD of the TRMZ from 1950 to 2020 did not show a significant decreasing trend. The national average rate of decrease in FD was −1.41 d/10a, and the rate of decrease in FD in SUMZ was −1.72 d/10a. The degree of decrease in annual FD across China and different climate zones was TEMZ > TECZ > SUMZ > China > ALCZ > TRMZ in order. Similarly, while there was a general decreasing trend in FD across China and in different climate zones, the decrease has been phased. It is clear from Figure 7b that the FD experienced an increasing process for both China and the different climate zones from 1950 to the 1970s and 1980s, and then maintained a continuous, fluctuating, decreasing trend from the 1970s and 1980s to the present. The phased variations in FD across China were consistent with the phased variations in air temperature across China, which was also consistent with the marked warming of China from the 1970s and 1980s onwards.
Among the different climate zones in China, the SUMZ was the zone with the most significant increase in FFP, while the TEMZ was the zone with the most significant decrease in FD, indicating that the increase in FFP and the decrease in FD was not consistent across China.
3.6. Regional Variation Differences in FFP and FD
In order to explore the degree of difference in the interannual variations of FFP and FD across China, the coefficient of variation (Cv) of FFP and FD across China was calculated. As can be seen from Figure 8, there were significant regional differences in the Cv of FFP and FD across China. It was obvious that, except for the Tarim Basin, high-altitude regions such as the Qinghai–Tibet Plateau, the Tianshan Mountains and the Altai Mountains were the regions with the largest Cv in FFP, with Cv ranging from 0.3 to 8.4. In particular, the Cv of FFP was even greater than 1 in the Kunlun Mountains in the northwestern part of the Qinghai–Tibet Plateau, while the Cv of FFP in the rest of China was not very variable, with Cv ranging from 0 to 0.3. Similarly, the Cv of FD across China also has obvious regional differences, with the Sichuan Basin, South China and southern Tibet being the regions with the largest Cv of FD, with a Cv of FD ranging from 0.3 to 8.4. In particular, the regions near the Tropic of Cancer were the regions with the largest Cv of FD, with Cv of FD greater than 1.
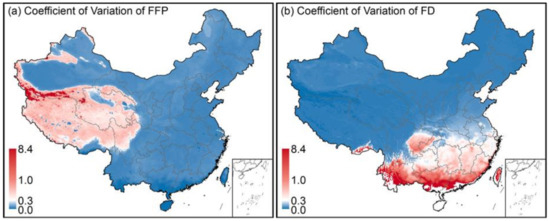
Figure 8.
Comparison of the coefficient of variation (Cv) of FFP and FD across China from 1950~2020. (a) Cv of FFP; (b) Cv of FD.
The obvious regional differences in the Cv of FFP and FD across China indicating that the higher the altitude and lower the temperature, the greater the interannual variability of FFP, while the higher the temperature, the greater the interannual variability of FD. In addition, since there was little FD in the tropical monsoon climate zone in China, the Cv of FD in this region can be ignored.
Although the large regional variability exhibited by FFP and FD is related to regional climatic characteristics, the variability in FFP and FD differs from the latitudinal zonality and altitudinal dependence of climate. In particular, the spatial characteristics of FD variability are hardly latitudinally zoned, and the large regional variability of FFP and FD may have important implications for regional agricultural production, e.g., in the subtropical monsoon region of southern China, an increase in FD may cause damage to spring crops, which in turn may lead to reduced crop yields. Therefore, the large regional variability of FFP and FD may indicate the instability of regional climatic characteristics and regions where agrometeorological disasters occur more frequently to a certain extent.
4. Discussion
4.1. Uncertainty of ERA5-Land on the Quantification of FFP and FD
As can be seen from Figure 2a and Figure 3a, the daily minimum Ts and Ta from ERA5-Land correlate reasonably well with the daily minimum GST and TEM from DMDC (V3.0). However, as can also be seen from Figure 2b–d and Figure 3b–d, there is a clear regional underestimation of the daily minimum Ts and Ta from ERA5-Land. Based on the four evaluation indices, including the R2, NSE, MBE and RMSE, ERA5-Land is generally more applicable to surface and air temperatures simulation in East China than in West China and the Qinghai–Tibet Plateau, more applicable in flatter regions than in regions with high altitude and complex terrain, and more applicable in regions with dense weather stations than in regions with sparse weather stations. In particular, the southeast Qinghai–Tibet Plateau is the region where the ERA5-Land underestimates daily minimum Ts and Ta most significantly (Figure 2 and Figure 3).
Studies have shown that the applicability of reanalysis dataset is poor in regions with sparse meteorological stations and complex terrain, such as Northwest China and the Qinghai–Tibet Plateau [43,70,71,72,73]. Reanalysis dataset is an important product of numerical modelling, obtained by assimilating quality-controlled observations (including ground, sounding, satellite, radar, buoy, aircraft, ships and other observations) into global or regional numerical model calculations [74,75]. Therefore, the accuracy of the reanalysis dataset for the simulation of land variables is reduced when ground-based or airborne observations are scarce. In addition, considering the complex terrain of the southeastern Qinghai–Tibet Plateau, the terrain height of the reanalysis dataset may differ from the actual altitude, leading to a deviation in the surface and air temperatures between the reanalysis and the in situ observed data [43]. In regions with complex terrain, the meteorological stations are generally constructed at lower elevations in flatter river valleys [36], and the terrain around the stations is highly undulating, with average elevations much higher than the elevations of the meteorological stations, making the average surface and air temperatures over a larger region much lower than those at lower elevations due to the temperature lapse rate [43].
The underestimation of daily minimum surface and air temperatures in a reanalysis dataset such as ERA5-Land is inevitable due to the scarcity of meteorological stations at high altitudes on the southeastern Qinghai–Tibet Plateau. Consequently, it is inevitable that the lack of ground-based meteorological stations on the southeastern Qinghai–Tibet Plateau leads to a reduction in the simulation accuracy of the ERA5-Land reanalysis dataset, which in turn leads to a reduction in the quantification accuracy of FFP and FD in this region. In fact, high-altitude mountainous regions such as the southeastern Qinghai–Tibet Plateau are not major crop production regions in China, so the uncertainty in the trends and variations in FFP and FD in this region based on the ERA5-Land does not affect the accuracy of quantifying the trends and variations in FFP and FD in China as a whole.
4.2. Effect of Variations in FFP and FD on Agriculture Production
As an important characteristic quantity of agro-climatic heat conditions, the FFP plays a crucial role in agricultural production, especially in North China [31]. Generally, the longer the FFP, the longer the growth period of crops, and the more conducive to the development of agricultural production [30,31]. Under climate warming, the increase in FFP leads to an increase in heat resources, and the increase in heat resources can prolong the growth period of crops or increase agricultural biological yields per unit region [22,31,32,76]. Frost is a meteorological disaster that can cause serious damage to crop growth [34,77]. The decrease in FD reduces the risk of frost damage to crops and is extremely beneficial to agricultural production [34,55]. The decrease in FD in North China has also led to a further expansion of wheat cultivation northwards [78,79]. In summary, the increase in FFP and the decrease in FD have had three main effects on agricultural production: firstly, the increase in FFP has contributed to a longer crop growing period; secondly, the decrease in FD has reduced the risk of extreme frost damage to crops; and thirdly, the increase in FFP and the decrease in FD have contributed to an adjustment in the layout of agricultural production to adapt to climate change.
However, the increase in FFP and the decrease in FD across China are the result of climate warming [16] which is not entirely positive for agricultural production. Generally, crops are divided into thermophilic crops such as rice and maize and chimonophilous crops such as wheat and barley [80,81,82], where climate warming is beneficial to the growth of thermophilic crops but detrimental to the growth of chimonophilous crops [81,82,83,84]. Studies have shown that climate warming leads to a reduction in the yields of chimonophilous crops such as barley on the Qinghai–Tibet Plateau, as it leads to a greater difference in saturated water vapor pressure, which in turn reduces the stomatal conductivity of plant leaves, reduces photosynthesis and ultimately leads to lower crop yields [85]. Climate warming has led to a longer growing season for thermophilic crops, but also to a shorter growing season for chimonophilous crops [81,82]. Therefore, when planning the layout of agricultural production, it is necessary to expand the cultivation of thermophilic crops in accordance with the increase in FFP and the decrease in FD, while shifting the cultivation of chimonophilous crops to regions with lower temperatures, thus adjusting the layout of agricultural production more scientifically in order to better adapt to climate change.
5. Conclusions
To investigate the trends and variations in FFP and FD across China under climate change, this study conducted a quantitative statistics and trend test of the FFP and FD across China from 1950 to 2020 based on the ERA5-Land reanalysis dataset. Although the ERA5-Land simulations of daily minimum Ts and Ta are significantly underestimated regionally in regions such as the southeastern Qinghai–Tibet Plateau with high altitude and complex terrain, from a national perspective, the ERA5-Land has good applicability for quantifying the trends and variations in FFP and FD.
The study revealed that both the annual mean minimum Ts and Ta showed a significant increasing trend from 1950 to 2020, with particularly pronounced warming in Northeast China, North China and northern Xinjiang, which has a lasting impact on the variations in FFP and FD. Quantitative statistics and trend test of FFP and FD across China from 1950 to 2020 found that both FFP and FD showed significant latitudinal zonality and altitude dependence, i.e., FFP decreased with increasing latitude and altitude, while FD increased with increasing latitude and altitude; at the 95% confidence level, FFP generally showed an increasing trend, while FD generally showed a decreasing trend across China, but there were large spatial differences in the increase in FFP and decrease in FD between regions, suggesting that the increase in FFP and decrease in FD was not entirely consistent in space.
For China as a whole, FFP showed a significant increasing trend with average increasing rate of 1.25 d/10a, the maximum increasing rate of FFP in individual regions was 6.2 d/10a, while FD showed a significant decreasing trend with an average decreasing rate of −1.41 d/10a, the maximum decreasing rate of FD in individual regions was −6.7 d/10a. Among the five major climate zones in China, the SUMZ was the region with the largest increase in FFP, with a rate of 1.73/10a, while the TEMZ was the region with the largest decrease in FD, with a rate of −1.72 d/10a. The variations in FFP and FD across China and in different climate zones were phased, which was consistent with the phased variations of surface and air temperatures across China over the past 70 years.
There is no denying that the variations in FFP and FD across China have a positive impact on agricultural production, but the adaptability of different crop species to climate change should also be considered when adjusting the layout of agricultural production to make it better and more scientifically adapted to climate change.
Author Contributions
Conceptualization, H.L. and C.H.; methodology, H.L. and Y.Y.; software, H.L. and G.L.; investigation, H.L., G.L. and C.H.; data curation, C.H. and R.C.; writing—original draft preparation, H.L.; writing—review and editing, G.L., C.H., Y.Y. and R.C.; funding acquisition, C.H., R.C. and Y.Y. All authors have read and agreed to the published version of the manuscript.
Funding
This research was funded by the National Natural Sciences Foundation of China (41971041), the Joint Research Project of Three-River Headwaters National Park, Chinese Academy of Sciences and the People’s Government of Qinghai Province (LHZX-2020-11), the Sciences and Technology Plan Project of Gansu Province (21JR7RA056) and the Open Research Fund of the National Cryosphere Desert Data Center (2021kf09).
Institutional Review Board Statement
Not applicable.
Informed Consent Statement
Not applicable.
Data Availability Statement
The ERA5-Land reanalysis dataset from the ECMWF used in this study can be accessed online (https://cds.climate.copernicus.eu/cdsapp#!/dataset/reanalysis-era5-land?tab = overview/ (accessed on 1 March 2022)). The Daily Meteorological Dataset of basic meteorological elements of China National Surface Weather Stations provided by the China Meteorological Administration can be accessed online (http://data.cma.cn/ (accessed on 1 March 2022)).
Acknowledgments
The authors would like to thank the European Centre for Medium-Range Weather Forecasts (ECMWF) (https://cds.climate.copernicus.eu/ (accessed on 1 March 2022)) for providing the ERA5-Land data, and the authors would also like to thank all team members in Qilian Alpine Ecology and Hydrology Research Station, Northwest Institute of Eco-Environment and Resources, Chinese Academy of Sciences.
Conflicts of Interest
The authors declare no conflict of interest.
References
- Fan, X.; Wang, Q.; Wang, M. Variations in frost-free period in Shanxi province, China: 1959–2008. Ecol. Environ. Sci. 2010, 19, 2393–2397. [Google Scholar]
- Yu, W.; Yang, Q. Change Laws of Frost-free Period and Its Impact on Agriculture in Linjiang. J. Anhui Agric. Sci. 2012, 40, 8248–8249. [Google Scholar]
- Gao, M.; Jia, H.; Pei, Z.; Yang, X.; Wang, H. The Changing Trends of the First and Last Frost Dates, Frost-free Periods in Recent 58 Years in Linfen City. Chin. Agric. Sci. Bull. 2014, 30, 272–275. [Google Scholar]
- Karl, T.R.; Ghazi, N.A. Clivar/GCOS/WMO Workshop on Indices and Indicators for Climate Extremes Workshop Summary. In Weather and Climate Extremes; Springer: Dordrecht, The Netherlands, 1999. [Google Scholar]
- Peterson, T.; Folland, C.; Gruza, G.; Hogg, W.; Mokssit, A.; Plummer, N. Report on the Activities of the Working Group on Climate Change Detection and Related Rapporteurs 1998–2001; World Meteorological Organization: Geneva, Switzerland, 2001. [Google Scholar]
- Ma, Z. Variation of Frost Days and Its Relationship to Regional Warming in Northern China. Acta Geogr. Sin. 2003, 58, 31–37. [Google Scholar]
- Kong, X.; Feng, C.; Cao, D.; Liu, Y.; Han, X. Analysis on the Changes of the First and Last Frost Date and the Frost-free Period in Linqing City in Recent 30 Years. J. Hebei Agric. Sci. 2014, 18, 97–99, 103. [Google Scholar]
- Erlata, E.; Türke, M. Analysis of observed variability and trends in numbers of frost days in Turkey for the period 1950–2010. Int. J. Climatol. 2012, 32, 1889–1898. [Google Scholar] [CrossRef]
- Gao, H.; Cai, G.; Lu, Y.; Zhang, X. Spatial and temporal variations of frost days in Guizhou province from 1960 to 2013. J. Agric. Sci. 2017, 38, 16–19, 42. [Google Scholar]
- Wang, G.; Xu, Y.; Zhu, Y.; Zhang, H.; Liao, J. The Spatial and Temporal Characteristics and Trend of Frost Days over China for the Past 50 Years. Meteorol. Mon. 2009, 35, 61–67. [Google Scholar]
- Wypych, A.; Ustrnul, Z.; Sulikowska, A.; Chmielewski, F.-M.; Bochenek, B. Spatial and temporal variability of the frost-free season in Central Europe and its circulation background. Int. J. Climatol. 2016, 37, 3340–3352. [Google Scholar] [CrossRef]
- Chervenkov, H.; Slavov, K. Inter-annual variability and trends of the frost-free season characteristics over Central and Southeast Europe in 1950–2019. J. Cent. Eur. Agric. 2022, 23, 154–164. [Google Scholar] [CrossRef]
- IPCC. Climate Change 2021: The Physical Science Basis; IPCC: Geneva, Switzerland, 2021. [Google Scholar]
- Chao, Q.; Yan, Z.; Sun, Y.; Jiang, Z.; Liao, H.; Jia, S.; Cai, R. A recent scientific understanding of climate change in China. China Popul. Resour. Environ. 2020, 30, 1–9. [Google Scholar]
- Li, Y.; Xie, L. Current situation and cause analysis of global climate change. In Proceedings of the 2010 Annual academic Meeting of Chinese Crop Society, Shenyang, China, 13–14 September 2010. [Google Scholar]
- Popov, T.; Gnjato, S.; Trbic, G. Trends in frost days in Bosnia and Herzegovina. Glas. Srp. Geogr. Drus. 2017, 97, 35–55. [Google Scholar] [CrossRef]
- Easterling, D. Recent Changes in Frost Days and the Frost-Free Season in the United States. Bull. Am. Meteorol. Soc. 2002, 83, 1327–1332. [Google Scholar] [CrossRef]
- Xu, F.; Zhang, S.; Wang, Q.; Chang, C.; Qin, Y. First, Last Frost Dates and Frost-free Period During 1961–2015 in Shouguang:Variation Characteristics and Its Effect on Agriculture. Chin. Agric. Sci. Bull. 2019, 35, 112–117. [Google Scholar]
- Zhou, X.; Zhao, C.; Cui, Y.; Liu, M.; Ao, X.; Yi, X.; Hou, Y.; Zhang, X. Variation Characteristics of the Date of First Frost and Last Frost and the Frost-free Period in the Northeast China during 1961–2013. J. Nat. Resour. 2017, 32, 494–506. [Google Scholar]
- Yang, X.; Hu, J.; Zhang, Y. Change Characteristics of First and Last Frost Date and Frost-Free Period in Eastern Hexi Corridor. Chin. Agric. Ence Bull. 2016, 32, 149–155. [Google Scholar]
- Bao, Y. Analysis on Variations of First Frost Date, Latest Frost Date and Frost-free Period in Ewenki Autonomous Banner of Inner Mongolia. Anim. Husb. Feed Sci. 2016, 37, 54–56. [Google Scholar]
- Ning, X.; Liu, G.; Zhang, L.; Qin, X.; Zhou, S.; Qin, Y. The spatio-temporal variations of frost-free period in China from 1951 to 2012. J. Geogr. Sci. 2017, 27, 23–42. [Google Scholar] [CrossRef][Green Version]
- Rahimi, M. Trends in frost days, late and early frost dates and the frost-free season over Iran during 1951–2005. In Proceedings of the WCRP OSC Climate Research in Service to Society, Denver, CO, USA, 24–28 October 2011. [Google Scholar]
- Li, Z.; You, Q.; Liu, H.; Yin, Z.; Duan, L. Analysis of Climate Change and Circulation Features of Frost Days in Hunan Province, China in Recent 67 Years. J. Geosci. Environ. Prot. 2019, 7, 124–137. [Google Scholar] [CrossRef][Green Version]
- Malinovic-Milicevic, S.; Stanojevic, G.; Radovanovic, M. Recent changes in first and last frost dates and frost-free period in Serbia. Geogr. Ann. Ser. A Phys. Geogr. 2018, 100, 44–58. [Google Scholar] [CrossRef]
- McCabe, G.; Betancourt, J.; Feng, S. Variability in the Length of Frost-Free Periods in the Conterminous US during the Past Century. Int. J. Climatol. 2015, 35, 4673–4680. [Google Scholar] [CrossRef]
- Longley, R.W. The frost-free period in alberta. Can. J. Plant Sci. 1967, 47, 239–249. [Google Scholar] [CrossRef]
- Meehl, G.A.; Tebaldi, C.; Nychka, D. Changes in frost days in simulations of twentyfirst century climate. Clim. Dyn. 2004, 23, 495–511. [Google Scholar] [CrossRef]
- Liu, B.; Henderson, M.; Xu, M. Spatiotemporal change in China’s frost days and frost-free season, 1955–2000. J. Geophys. Res. Atmos. 2008, 113, D12104. [Google Scholar] [CrossRef]
- Li, L.; Li, X.; Xu, X.; Wang, X.; Yang, S. Climatic characteristics of frost-free period in Datong and its impact on agricultural production. Agric. Technol. 2020, 40, 114–115. [Google Scholar]
- Pan, Z.; Guan, X.; Chen, X. Analysis of frost free-period and its impact on agricultural production. Sci. Tech. Inf. Gansu 2018, 47, 22–26. [Google Scholar]
- Yu, W.; Cao, D.; Gao, S. Effects of Frost-free Date Change on the Agricultural Production in Xinmin City from 1960 to 2009. J. Anhui Agric. Sci. 2010, 38, 11929–11930, 11932. [Google Scholar]
- Xu, B.; Zhang, L. Research on the characteristics of castor growth in an area with short frost-free periods. Chin. J. Oil Crop Sci. 1988, 9, 47–49. [Google Scholar]
- Du, J.; Shi, L.; Yuan, L. Responses of Climatic Change on the Frost Days in Main Agricultural Area of Tibet from 1961 to 2010. Chin. J. Agrometeorol. 2013, 34, 264–271. [Google Scholar]
- Du, L.; Chen, X.; Yang, D.; Shang, K.; Wang, S. Variation Characteristics of the Large-scale Frost in East Region of the Yellow River of Gansu in Recent 40 Years. Meteorol. Environ. Res. 2011, 2, 42–45, 59. [Google Scholar]
- Zou, H.; Zhu, J. Applicability of reanalysis data in the study of surface temperature in Qinghai–Tibet Plateau. In Proceedings of the 28th Annual Meeting of China Meteorological Society, Xiamen, China, 1–3 November 2011. [Google Scholar]
- Zhang, X. Dynamics Changes of Typical Inland Lakes on Tibetan Plateau Using Multi-Sensor Remote Sensing Data; Northwest A&F University: Xi’an, China, 2015. [Google Scholar]
- Liao, R.; Cao, L.; Zhang, D.; Li, Y. Validation of Gridded Precipitation and Temperature Data over China. Meteorol. Sci. Technol. 2017, 45, 364–374. [Google Scholar]
- Bai, L.; Zhang, F.; Wen, Y.; Shi, C.; Wu, J.; Shang, M.; Zhu, Z.; Meng, J. Evolution of the Frost Hazards Based on Gridded Meteorological Data across China in 1961−2018. Chin. J. Agrometeorol. 2021, 42, 761–774. [Google Scholar]
- Liu, T.; Kun, Y.; Jun, Q.; Fuqiang, T. Construction and applications of time series of monthly precipitation at weather stations in the central and eastern Qinghai-Tibetan Plateau. Plateau Meteorol. 2018, 37, 1449–1457. [Google Scholar]
- Liang, Z.; Shang, Y.; Wang, X.; Fang, Y.; Zhang, T.; Ren, Y.; Yang, X. Analysis on applicability of meteorological rainfall data in hydrological simulation of ungaged watershed. Water Resour. Hydropower Eng. 2021, 52, 1–12. [Google Scholar]
- Li, H. DEM Dividing Regions Optimization of China Land’s Accumulated Temperature Spatial Interpolation and Precision Analysis; Northwest Normal University: Lanzhou, China, 2007. [Google Scholar]
- Yang, J.; Huang, M.; Zhai, P. Performance of the CRA-40/Land, CMFD, and ERA-Interim Datasets in Reflecting Changes in Surface Air Temperature over the Tibetan Plateau. J. Meteorol. Res. 2021, 35, 663–672. [Google Scholar] [CrossRef]
- Yue, S.; Yan, Y.; Zhang, S.; Yang, J.; Wang, W. Spatiotemporal variations of soil freeze-thaw state in Northeast China based on the ERA5-LAND dataset. Acta Geogr. Sin. 2021, 76, 2765–2779. [Google Scholar]
- Chen, X.; Su, B.; Ma, Y.; Trigo, I.F.; Gentine, P. Remote Sensing of Global Daily Evapotranspiration based on a Surface Energy Balance Method and Reanalysis Data. J. Geophys. Res. Atmos. 2021, 126, e2020JD032873. [Google Scholar] [CrossRef]
- Chen, H.; Gao, H.; Wang, T.; Zhang, W.; Chen, X.; Nie, N.; Liu, H. Combining sparse observations and reanalysis data for refining spatiotemporal variability in near-surface air temperature lapse rates over China. Int. J. Climatol. 2021, 41, 6768–6784. [Google Scholar] [CrossRef]
- Gao, Z.; Huang, B.; Ma, Z.; Chen, X.; Qiu, J.; Liu, D. Comprehensive Comparisons of State-of-the-Art Gridded Precipitation Estimates for Hydrological Applications over Southern China. Remote Sens. 2020, 12, 3997. [Google Scholar] [CrossRef]
- Xiang, Y.; Chen, J.; Li, L.; Peng, T.; Yin, Z. Evaluation of Eight Global Precipitation Datasets in Hydrological Modeling. Remote Sens. 2021, 13, 2831. [Google Scholar] [CrossRef]
- Wang, M.; Yao, S.; Jiang, L.; Liu, Z.; Shi, C.; Hu, K.; Zhang, T.; Zhang, Z.; Liu, J. Collection and Pre-Processing of Satellite RemoteSensing Data in CRA-40 (CMA’s Global Atmospheric ReAnalysis). Adv. Meteorol. Sci. Technol. 2018, 8, 158–163. [Google Scholar]
- Muñoz-Sabater, J.; Dutra, E.; Agustí-Panareda, A.; Albergel, C.; Arduini, G.; Balsamo, G.; Boussetta, S.; Choulga, M.; Harrigan, S.; Hersbach, H.; et al. ERA5-Land: A state-of-the-art global reanalysis dataset for land applications. Earth Syst. Sci. Data 2021, 13, 4349–4383. [Google Scholar] [CrossRef]
- Zhang, J.; Zhao, T.; Li, Z.; Li, C.; Li, Z.; Ying, K.; Shi, C.; Jiang, L.; Zhang, W. Evaluation of Surface Relative Humidity in China from the CRA-40 and Current Reanalyses. Adv. Atmos. Sci. 2021, 38, 1958–1976. [Google Scholar] [CrossRef]
- Ye, M.; Yao, X.; Zhang, T.; Xu, X.; Wang, S. Intercomparison of CRA-Interim Precipitation Products with ERA5 and JRA-55. J. Trop. Meteorol. 2020, 26, 136–147. [Google Scholar]
- Han, R.; Li, W.; Ai, W.; Song, Y.; Ye, D.; Hou, W. The Climatic Variability and Influence of First Frost Dates in Northern China. Acta Geogr. Sin. 2010, 65, 525–532. [Google Scholar]
- Zhang, L.; Yang, Y.; Zhang, X.; Yuan, H.; Jin, F.; Du, H. Characteristics and Change Trend of Frost Days in Ning Xia in Recent 50 Years. Chin. Agric. Sci. Bull. 2015, 31, 214–219. [Google Scholar]
- Labaciren; Suolangjiacuo; Baima. Spatial and temporal distribution of frost days over Tibet from 1981 to 2010. Acta Geogr. Sin. 2014, 69, 690–696. [Google Scholar]
- Yang, Y.; Chen, R.; Liu, G.; Liu, Z.; Wang, X. Trends and variability in snowmelt in China under climate change. Hydrol. Earth Syst. Sci. 2022, 26, 305–329. [Google Scholar] [CrossRef]
- Yang, Y.; Chen, R.; Han, C.; Liu, Z. Evaluation of 18 models for calculating potential evapotranspiration in different climatic zones of China. Agric. Water Manag. 2021, 244, 106545. [Google Scholar] [CrossRef]
- Tang, J.; Li, W.; Zhao, S. Progress and directions in studying the impact of climate change on agriculture and grain production in China. Chin. J. Agric. Resour. Reg. Plan. 2013, 34, 1–7. [Google Scholar]
- Muñoz-Sabater, J. ERA5-Land hourly data from 1950 to 1980. Copernicus Climate Change Service (C3S) Climate Data Store (CDS). 2021. Available online: https://cds.climate.copernicus.eu/cdsapp#!/dataset/reanalysis-era5-land?tab=overview/ (accessed on 10 March 2022).
- Muñoz-Sabater, J. ERA5-Land Hourly Data from 1981 to Present. Copernicus Climate Change Service (C3S) Climate Data Store (CDS). 2019. Available online: https://cds.climate.copernicus.eu/cdsapp#!/dataset/reanalysis-era5-land?tab=overview/ (accessed on 10 March 2022).
- Center, N.M.I. Daily Meteorological Dataset of Basic Meteorological Elements of China National Surface Weather Station (V3.0) (1951–2010). National Tibetan Plateau Data Center. 2019. Available online: https://data.tpdc.ac.cn/en/ (accessed on 10 March 2022).
- Liu, Z.; Tao, L. Discussion on Statistical Methods of Frost-free Period in Strict Meaning. Mod. Agric. Sci. Technol. 2019, 47, 160–163. [Google Scholar]
- Mann, H. Non-Parametric Test Against Trend. Econometrica 1945, 13, 245–259. [Google Scholar] [CrossRef]
- Kendall, M.G. Rank Correlation Methods, 4th ed.; Charles Griffin: London, UK, 1975. [Google Scholar]
- Agarwal, S.; Suchithra, A.S.; Singh, S.P. Analysis and Interpretation of Rainfall Trend using Mann-Kendall’s and Sen’s Slope Method. Indian J. Ecol. 2021, 48, 453–457. [Google Scholar]
- Jagadeesh, P.; Agrawal, S. Investigation of trends and its magnitude by non-parameteric Mann-Kendall and Sen’s slope methods. Int. J. Hydrol. Sci. Technol. 2015, 5, 83–94. [Google Scholar] [CrossRef]
- Sen, P.K. Estimates of the Regression Coefficient Based on Kendall’s Tau. J. Am. Stat. Assoc. 1968, 63, 1379–1389. [Google Scholar] [CrossRef]
- Zhang, H.; Wang, E.; Zhou, D.; Luo, Z.; Zhang, Z. Rising soil temperature in China and its potential ecological impact. Sci. Rep. 2016, 6, 35530. [Google Scholar] [CrossRef]
- Liu, B.; Xu, M.; Henderson, M.; Qi, Y.; Li, Y. Taking China’s Temperature: Daily Range, Warming Trends, and Regional Variations, 1955–2000. J. Clim. 2004, 17, 4453–4462. [Google Scholar] [CrossRef]
- Li, S.; Wu, W.; Huang, X. Wind Speed Evaluation of CLDAS and ERA5-Land in Sichuan. Plateau Mt. Meteorol. Res. 2020, 40, 70–76. [Google Scholar]
- Namaiti, H.; Rusuli, Y.; Dilixiati, M.; Aikemu, R. Adaptability Analysis of ERA-Interim and GHCN-CAM Reanalyzed Data Temperature Values in Tianshan Mountains Area, China. Mt. Res. 2019, 37, 613–621. [Google Scholar]
- Zhao, J.; Guo, Z.; He, X.; Xu, T.; Liu, S.; Xu, Z. Uncertainty Assessment of Temperature and PrecipitationReanalysis Data in Heihe River Basin. J. Arid Meteorol. 2019, 37, 529–539. [Google Scholar]
- Gao, R.; Mu, Z.; Peng, L.; Zhou, Y.; Yi, Z.; Tang, R. Application of CFSR and ERA-Interim Reanalysis Data in Runoff Simulation in High Cold Alpine Areas. Water Resour. Power 2017, 35, 8–12. [Google Scholar]
- Deng, M.; Meng, X.; Ma, Y.; An, Y. Analysis on Soil Moisture Characteristics of Tibetan Plateau Based on GLDAS. J. Arid Meteorol. 2018, 36, 595–602. [Google Scholar]
- Qing, S.; Sun, X.; Li, Y. Evaluation of ERA5 reanalysis soil moisture over inner mongolia. Sci. Technol. Eng. 2020, 20, 2161–2168. [Google Scholar]
- Zheng, Y.; Bai, C.; Hu, X. Variation of frost-free period and its impact on agricultural production. Liaoning Meteorol. Q. 2004, 20, 23–24. [Google Scholar]
- Shen, H.; Sun, X.; Lin, X. Study on Risk Assessment of Winter Wheat Frost Damage in Huanghuai Wheat Production Zone. J. Inst. Disaster Prev. 2011, 13, 71–77. [Google Scholar]
- Zhang, H. Characteristics of Climatic Resources and Extreme Climate Events in Gansu Province and Their Effects on Winter Wheat Productivity; Nanjing University of Information Science and Technology: Nanjing, China, 2018. [Google Scholar]
- Wang, L.; Liu, C.; Li, Q.; Wu, D.; Wang, Q.; Cheng, W. The Northern Boundary Variation of Winter Wheat in Beijing-Tianjin-Hebei under Climate Warming. Crops 2017, 32, 61–67. [Google Scholar]
- Deng, Z.; Zhang, Q.; Wang, Q.; Qing, J.; Huang, L.; Liu, W.; Xu, J. Impact of climate warming and drying on food crops in northern China and the countermeasures. Acta Ecol. Sin. 2010, 30, 6278–6288. [Google Scholar]
- Si, W.; Zhang, M.; Liu, P. Spatial and temporal response differences to global warming hiatus of the ther⁃ mophilic crops climate growth period in oases of China. Arid Land Geogr. 2020, 43, 899–908. [Google Scholar]
- Zhang, W.; Zhang, M.; Liu, P.; Wang, T. Spatiotemporal responses of the growth period of chimonophilous crop to global warming hiatus—Take the example of Chinese oases. China Environ. Sci. 2020, 40, 2254–2261. [Google Scholar]
- Wang, L.; Xie, X.; Su, W.; Guo, X. Changes of maximum and minimum temperature and thier impacts in northern China over second half of the 20th century. J. Nat. Resour. 2004, 19, 337–343. [Google Scholar]
- Liu, Z.; Yang, X.; Wang, W. Changes of China agricultural climate resources under the background of climate change. IV. Spatiotemporal change characteristics of agricultural climate resources in sub-humid warm-temperate irrigated wheat-maize agricultural area of Huang-Huai-Hai Plain. Chin. J. Appl. Ecol. 2011, 22, 905–912. [Google Scholar]
- Dorji, T.; Piao, S.; Wang, X.; Zhao, C.; Liu, B.; Chen, A.; Wang, S.; Wang, T. Emerging Negative Warming Impacts on Tibetan Crop Yield. Engineering, 2021; in press. [Google Scholar] [CrossRef]


Publisher’s Note: MDPI stays neutral with regard to jurisdictional claims in published maps and institutional affiliations. |
© 2022 by the authors. Licensee MDPI, Basel, Switzerland. This article is an open access article distributed under the terms and conditions of the Creative Commons Attribution (CC BY) license (https://creativecommons.org/licenses/by/4.0/).