
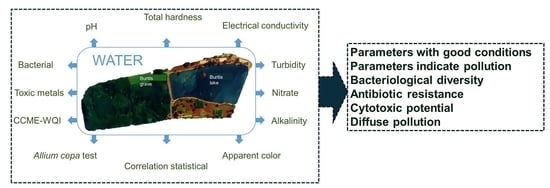
Evaluation of Water Quality of Buritis Lake

 ,
,  ,
,  , and
, and
Abstract
:
1. Introduction
2. Materials and Methods
2.1. Study Location
2.2. Physical and Chemical Parameters
2.3. Microbiological Analysis
2.4. Metals Analysis
2.5. CCME_WQI Calculation
2.6. Allium Cepa Test
2.7. Statistical Analysis
3. Results
3.1. Physico–Chemical Characterization of Different Water
3.2. Microbiological
3.2.1. Multiple Tube Results
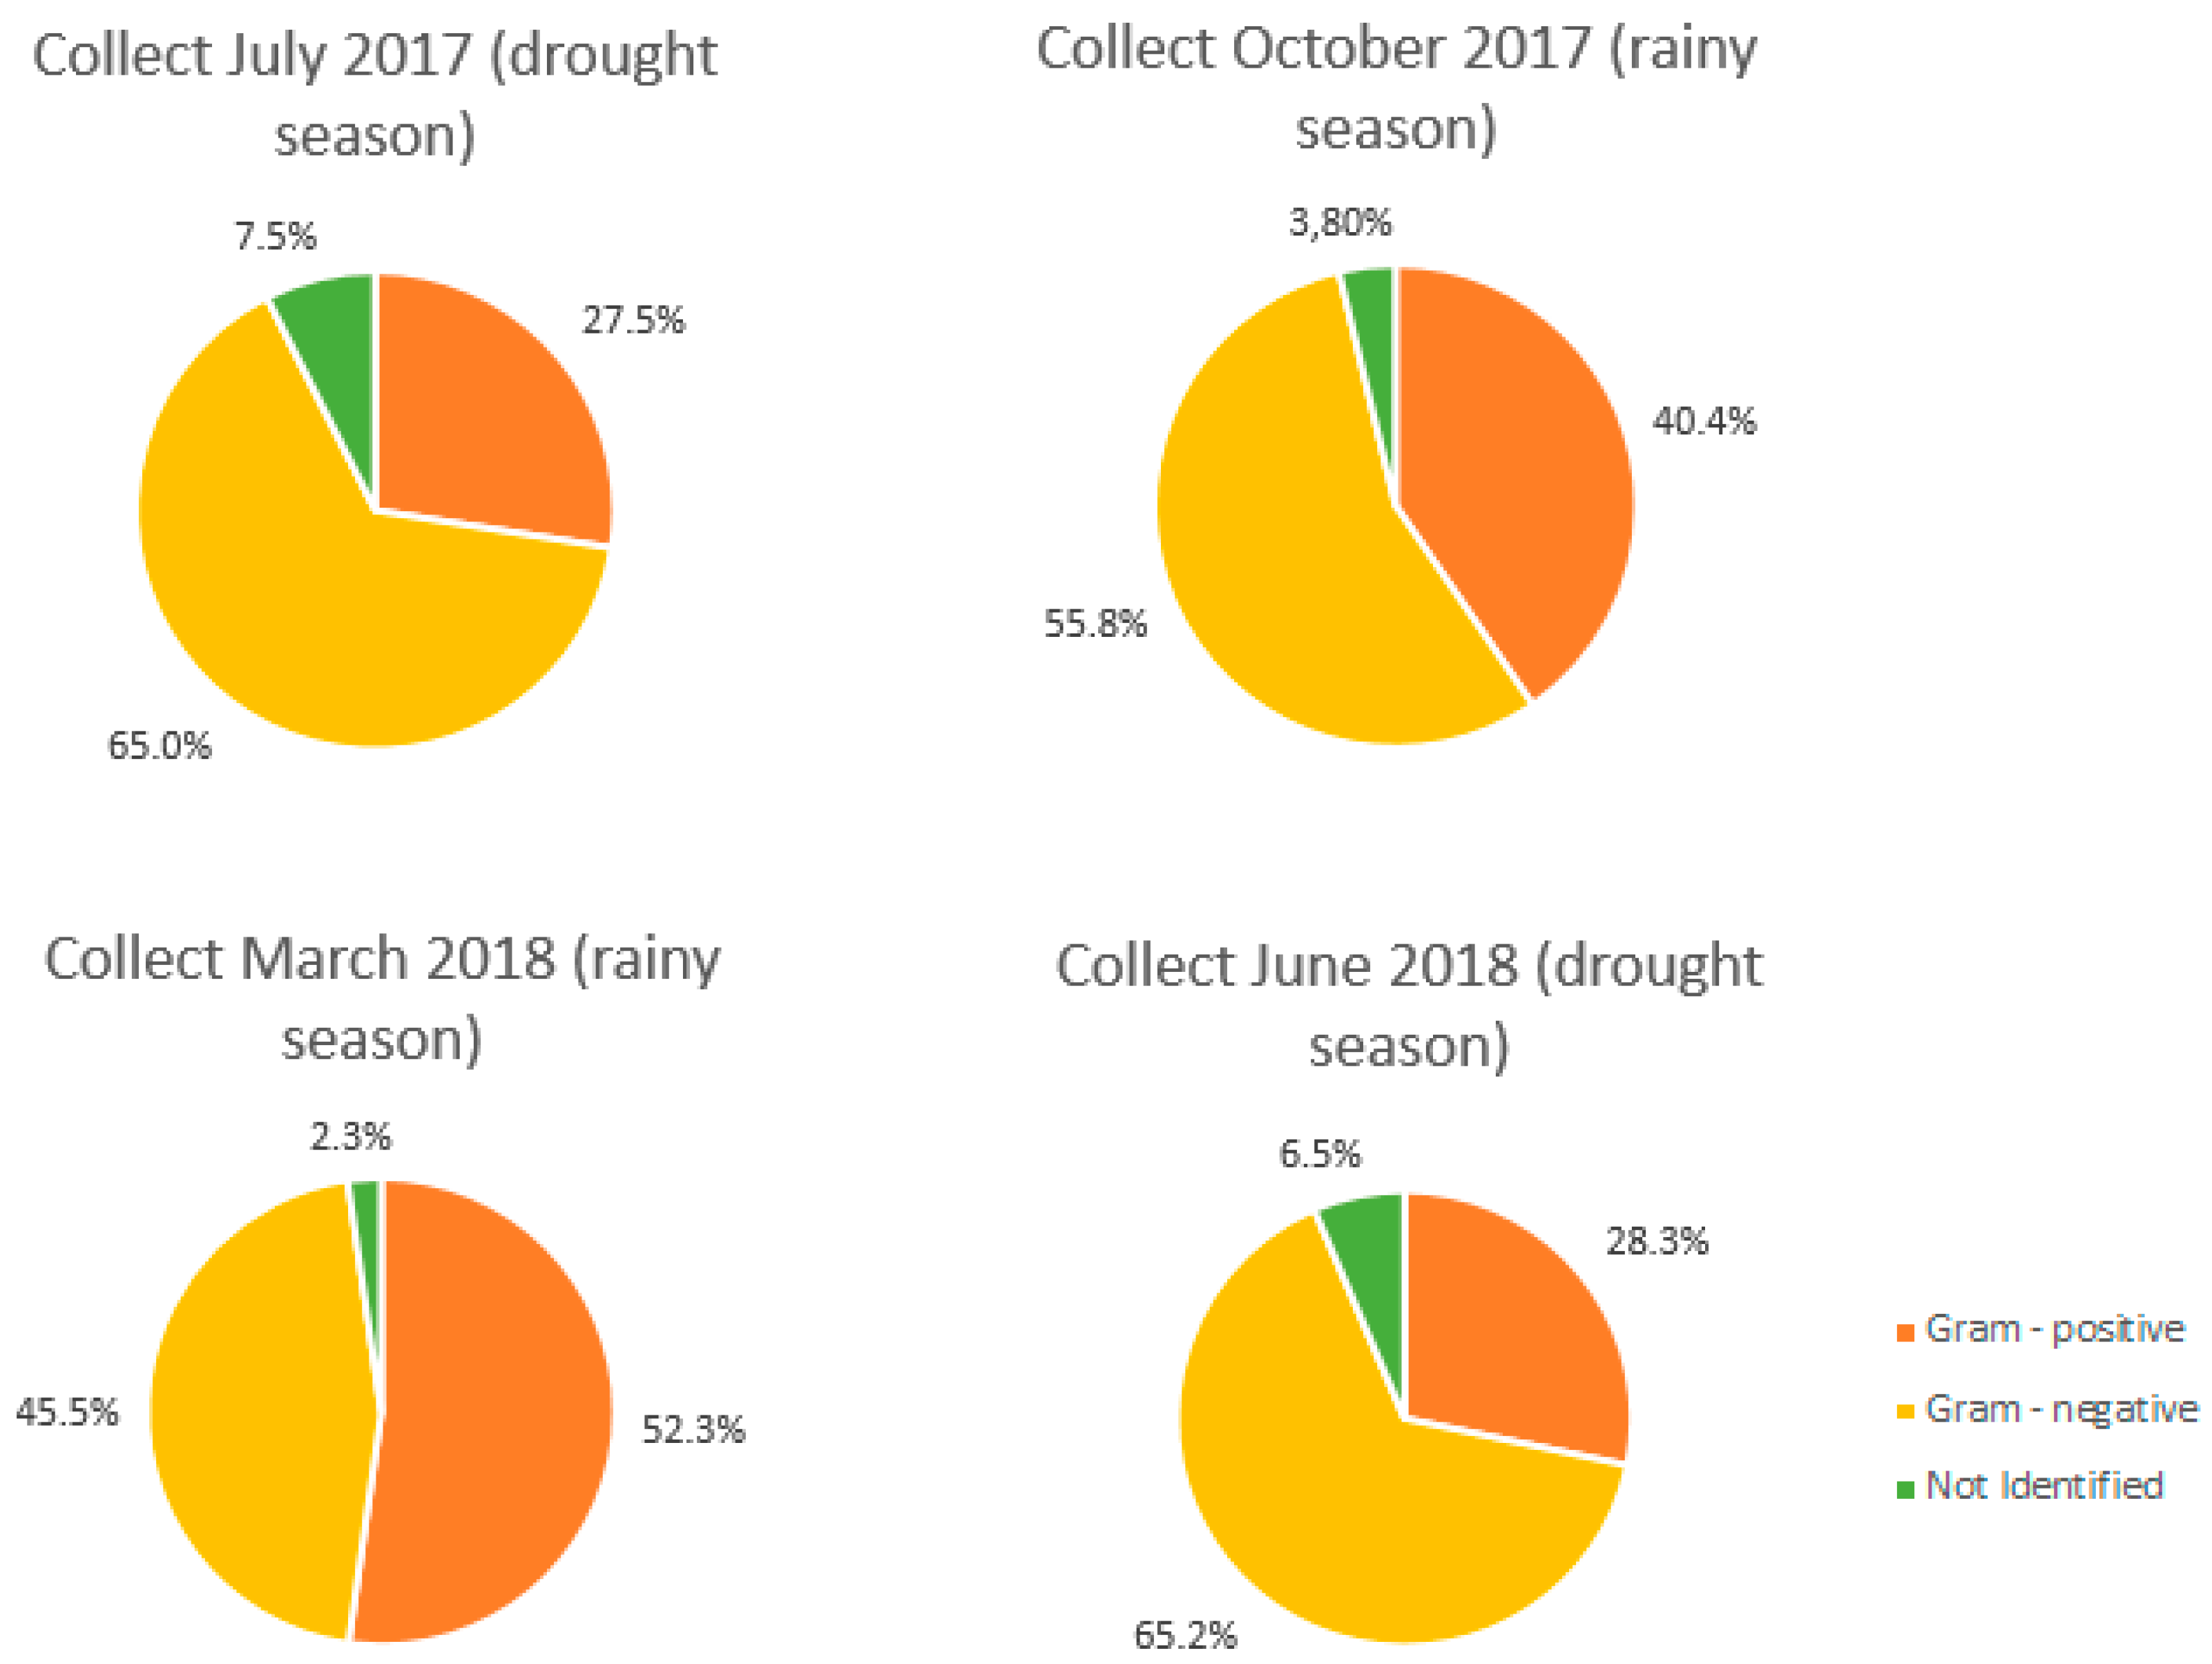
3.2.2. Phenotypic Identification
3.2.3. Antimicrobial Resistance Test
3.3. Metals
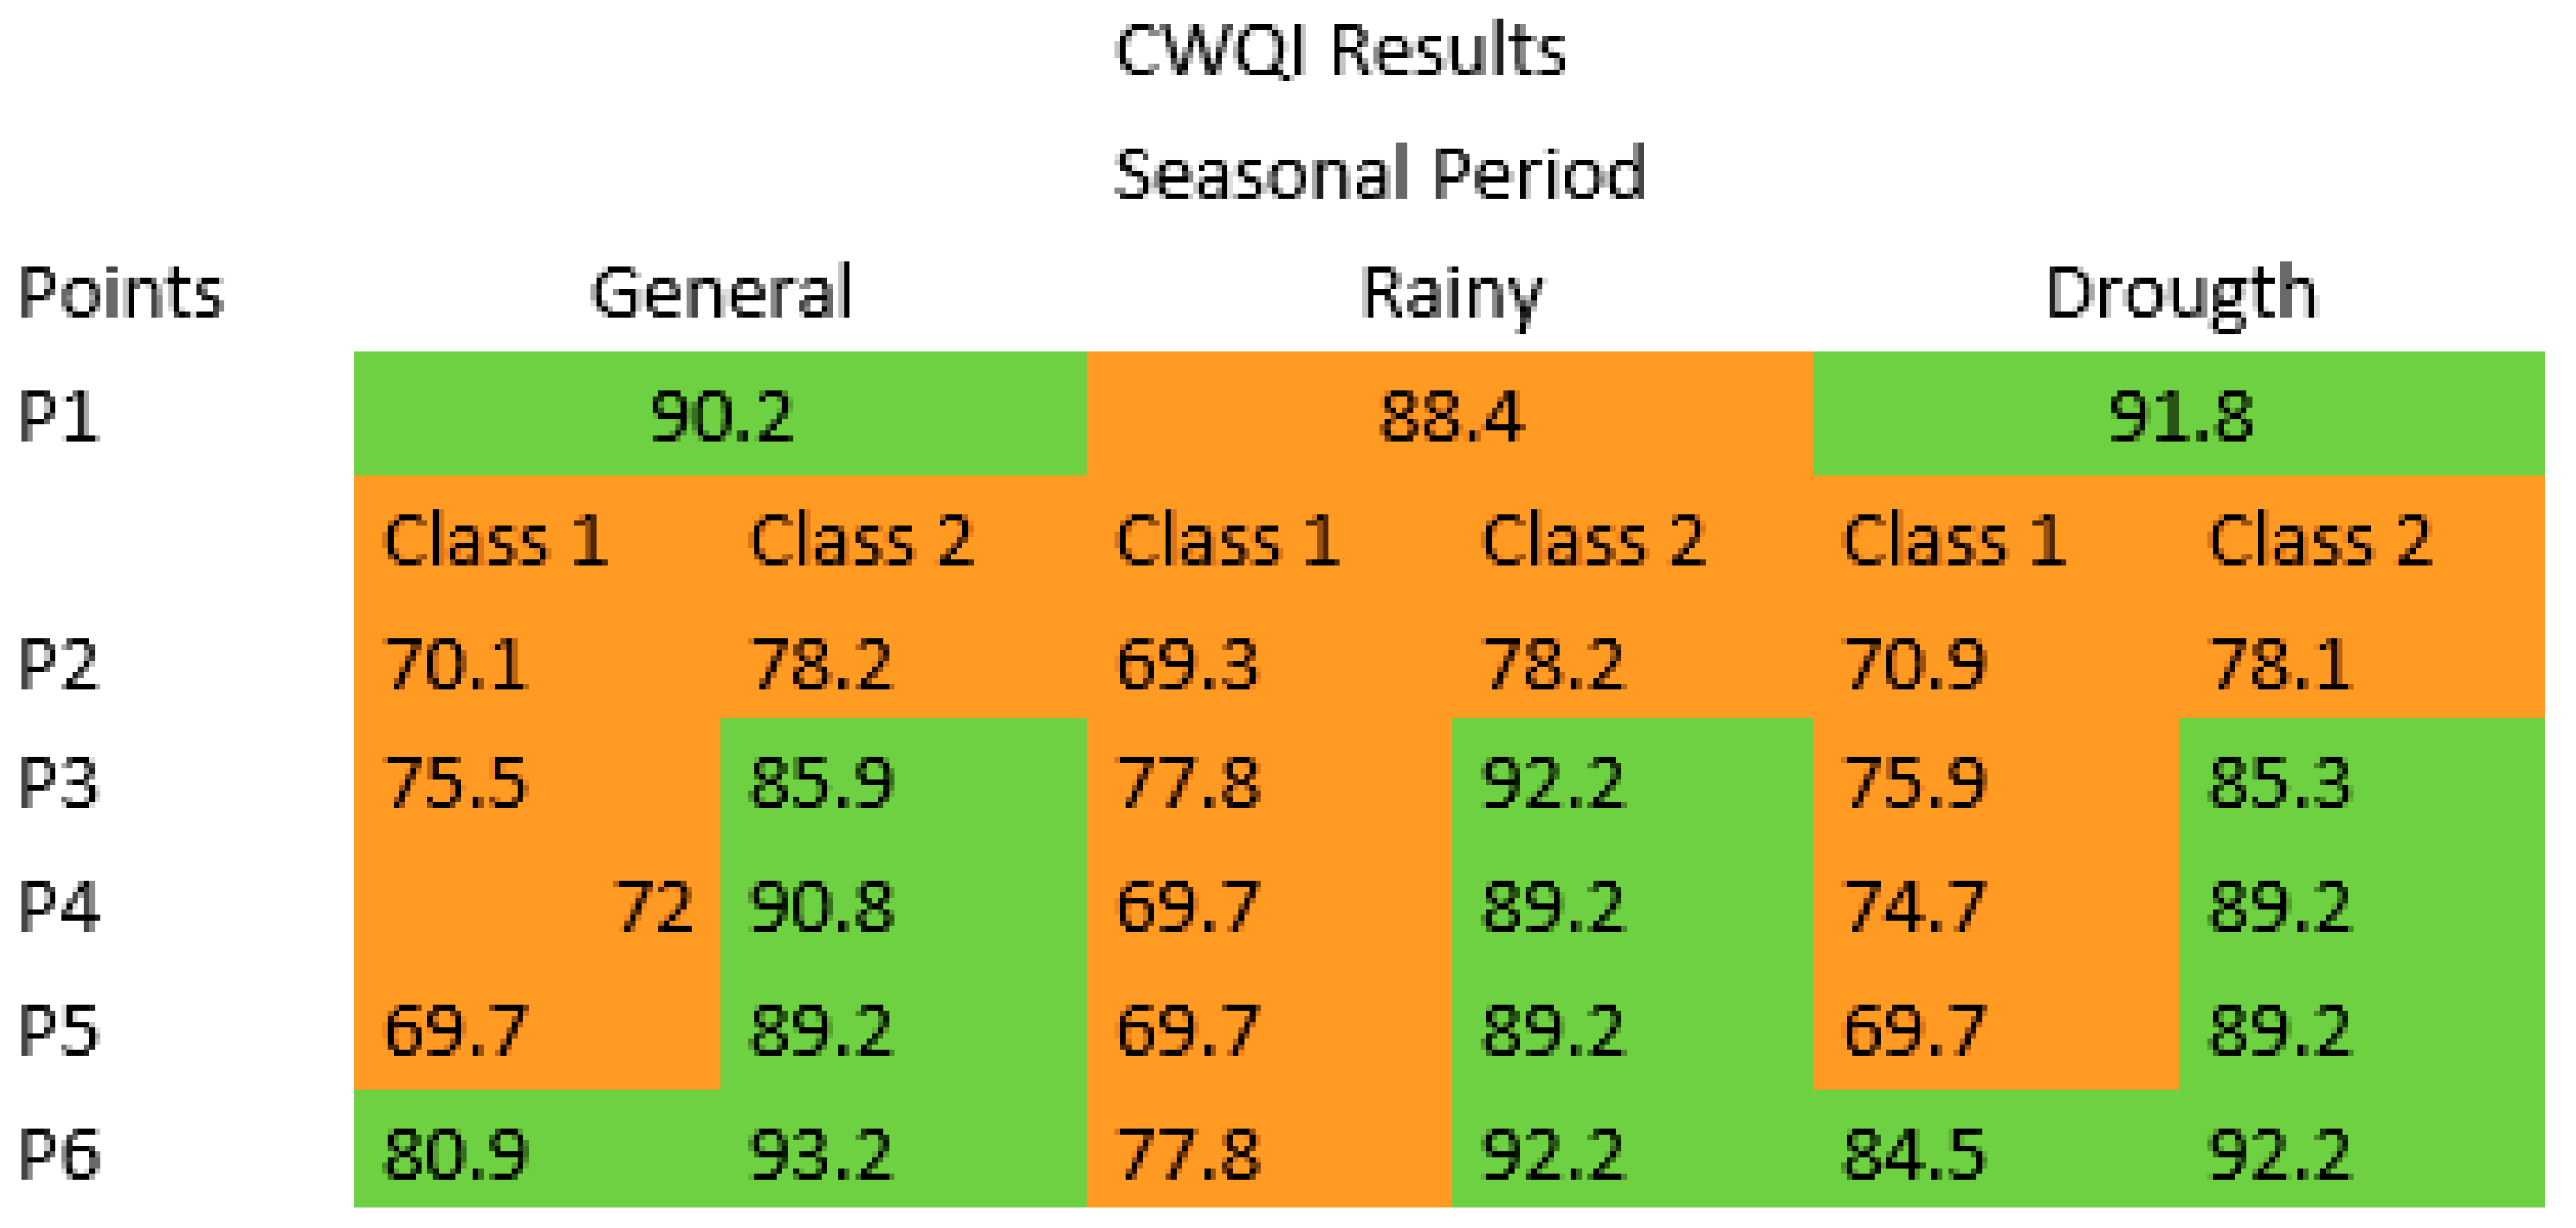
3.4. CWQI Results
3.5. Allium cepa Test Results
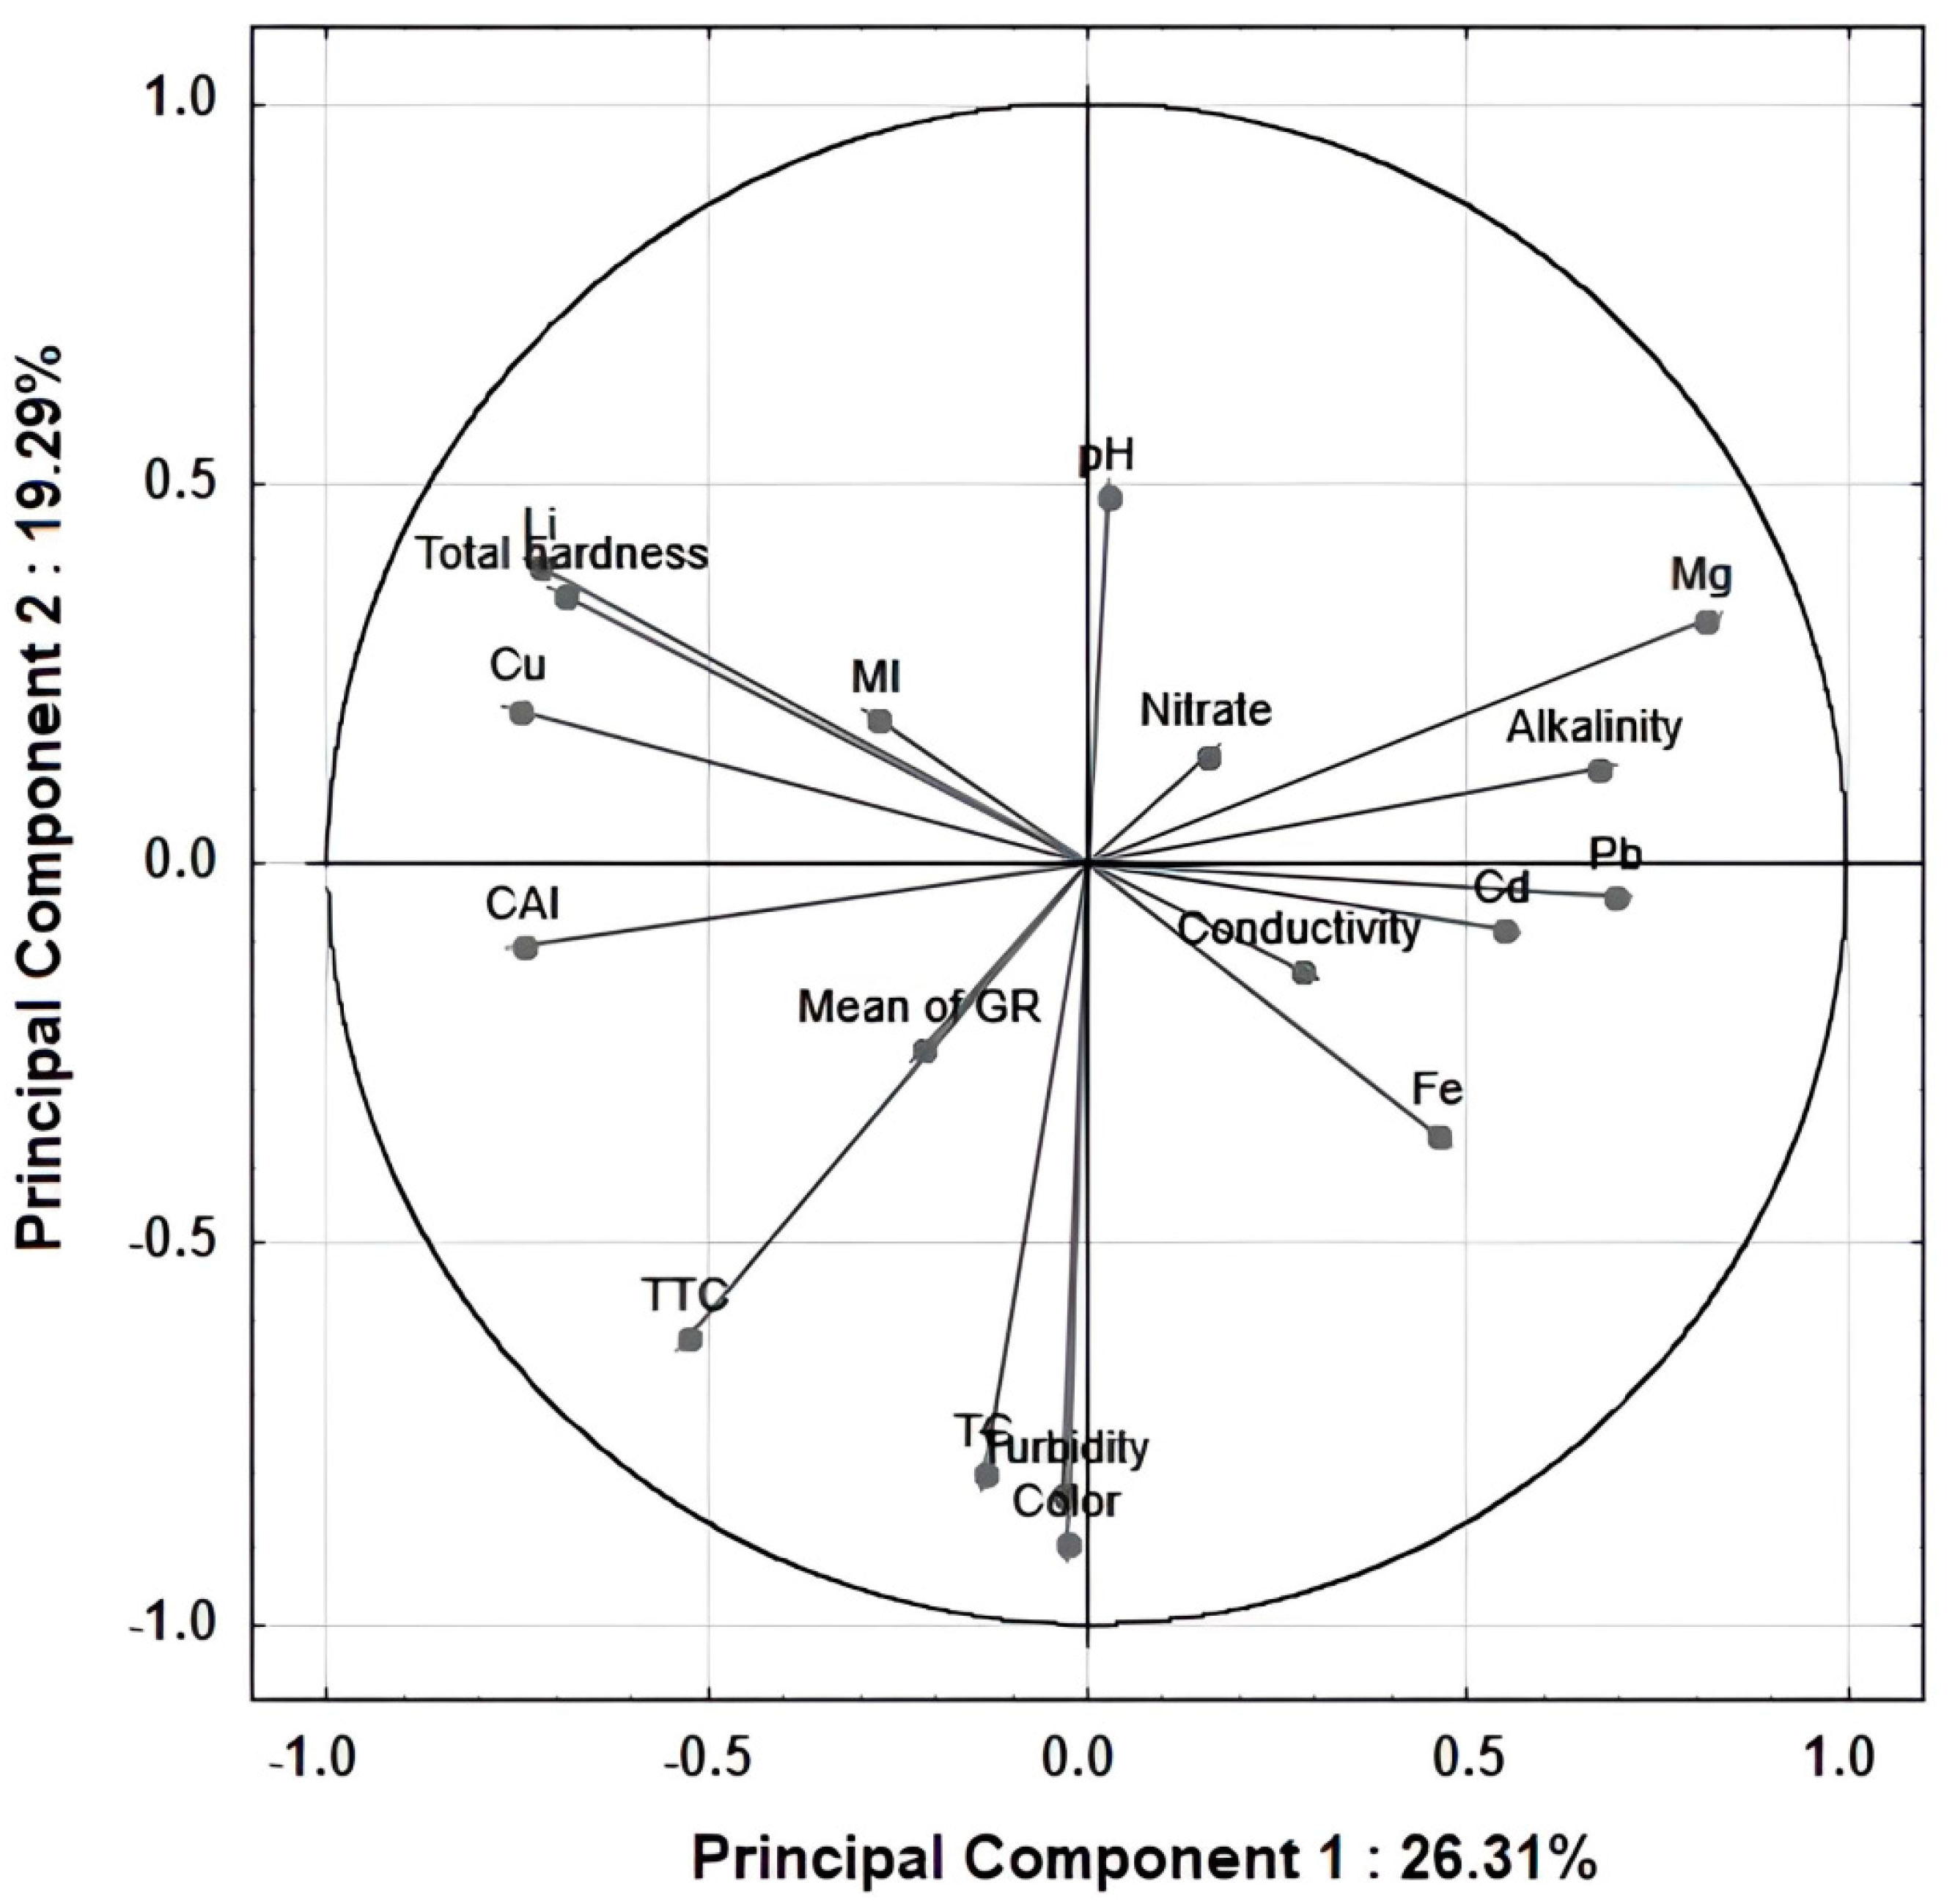
3.6. Correlation of Parameters
4. Discussion
5. Conclusions
Supplementary Materials
Author Contributions
Funding
Institutional Review Board Statement
Informed Consent Statement
Data Availability Statement
Conflicts of Interest
References
- Mccormackk, G.R.; Rock, M.; Toohey, A.M.; Hignell, D. Characteristics of urban parks associated with park use and physical activity: A review of qualitative research. Health Place 2010, 16, 712–726. [Google Scholar] [CrossRef] [PubMed]
- Malagi, I.; Sampaio, S.C.; Pinto, F.G.S.; Rosa, D.M.; Dos Reis, R.R. Physicochemical quality of and Escherichia coli resistance profiles in urban surface waters. Braz. J. Biol. 2019, 80, 661–668. [Google Scholar] [CrossRef] [PubMed] [Green Version]
- Nogueira, E.N.; Eliana, F.G.C.D.; Alício, A.P.; Ricardo, S.S.A.; Maria, L.R.; Carolina, L. Currently used pesticides in water matrices in Central-Western Brazil. J. Braz. Chem. Soc. 2012, 23, 1476–1487. [Google Scholar] [CrossRef] [Green Version]
- Ahn, M.K.; Chilakala, R.; Han, C.; Thenepalli, T. Removal of hardness from water samples by a carbonation process with a closed pressure reactor. Water 2018, 10, 54. [Google Scholar] [CrossRef] [Green Version]
- Manago, B.L.; Vidal, C.M.S.; Souza, J.B.; Neves, L.C.; Martins, K.G. Dissolved Air Flotation for Fiber Removal from Clear Water. Floresta Ambiente 2018, 25, e20160124. [Google Scholar] [CrossRef] [Green Version]
- Pereira, P.; Pablo, H.; Pacheco, M.; Vale, C. Vale The relevance of temporal and organ specific factors on metals accumulation and biochemical effects in feral fish (Liza aurata) under a moderate contamination scenario. Ecotoxicol. Environ. Saf. 2010, 73, 805–816. [Google Scholar] [CrossRef]
- Silveira, G.A.; Saran, L.M.; Melo, W.J.; Alves, L.M.C. Farming and soil urban occupation in the water quality of Jaboticabal and Cerradinho streams. Ciência Agrotecnologia 2016, 40, 633–646. [Google Scholar] [CrossRef]
- Feng, G.; Chen, M.; Bi, S.; Goodwin, Z.A.H.; Postnikov, E.B.; Brilliantov, N.; Urbakh, M.; Kornyshev, A.A. Free and Bound States of Ions in Ionic Liquids, Conductivity, and Underscreening Paradox. Phys. Rev. X 2019, 9, 21024. [Google Scholar] [CrossRef] [Green Version]
- Zotou, I.; Tsihrintzis, V.A.; Gikas, G.D. Performance of Seven Water Quality Indices (WQIs) in a Mediterranean River. Environ. Monit. Assess. 2019, 191, 8. [Google Scholar] [CrossRef]
- Hansda, S.K.; Swain, K.K.; Vaidya, S.P.; Jagtap, R.S. Assessment of water quality trends of khadakwasla reservoir using CCME-WQI. In Environmental Pollution; Springer: Singapore, 2018; pp. 381–401. [Google Scholar]
- MdGalal, U.; Nash, S.; Olbert, A.I. A review of water quality index models and their use for assessing surface water quality. Ecol. Indic. 2021, 122, 107218. [Google Scholar]
- Abbasi, T.; Abbasi, S.A. Water Quality Indices; Elsevier: Amsterdam, The Netherlands, 2012. [Google Scholar]
- Rodrigues, C.; Cunha, M.A. Assessment of the microbiological quality of recreational waters: Indicators and methods. Euro-Mediterr. J. Environ. Integr. 2017, 2, 25. [Google Scholar] [CrossRef] [Green Version]
- Prüss-Ustün, A.; Bartram, J.; Clasen, T.; Colford, J.M.; Cumming, O.; Curtis, V.; Bonjour, S.; Dangour, A.D.; De France, J.; Fewtrell, L. Burden of disease from inadequate water, sanitation and hygiene in low and middle income settings: A retrospective analysis of data from 145 countries. Trop. Med. Int. Health 2014, 19, 894–905. [Google Scholar] [CrossRef] [PubMed] [Green Version]
- Oliveira, M.; Freirea, D.; Pedroso, N.M. Escherichia coli is not a suitable fecal indicator to assess water fecal contamination by otters. Braz. J. Biol. 2018, 78, 55–159. [Google Scholar] [CrossRef] [PubMed]
- Ministério Da Saúde. Portaria De Consolidação n 5, De 28 De Septembro De 2017. Available online: http://bvsms.saude.gov.br/bvs/saudelegis/gm/2017/prc0005_03_10_2017.html (accessed on 15 March 2020).
- Silva, Y.J.A.B. Heavy metal concentrations and ecological risk assessment of the suspended sediments of a multi-contaminated Brazilian watershed. Acta Sci. Agron. 2019, 41, 1–11. [Google Scholar] [CrossRef] [Green Version]
- Jesus, L.D.F.; Moreira, M.F.; Azevedo, S.V.A.; Borges, R.M.; Almeida, G.R.A.A.; Bergamini, F.P.B.; Teixeira, L.R. Lead and mercury levels in an environmentally exposed population in the Central Brazil. Cad. Saúde Públ. 2018, 34, e00034417. [Google Scholar]
- Palacio, S.M.; Espinoza-Quiñones, F.R.; Galante, R.M.; Zenatti, D.C.; Seolatto, A.A.; Lorenz, E.K.; Zacarkim, C.E.; Rossi, N.; Rizzutto, M.A.; Tabacniks, M.H. Correlation between heavy metal ions (copper, zinc, lead) concentrations and root length of Allium cepa L. in polluted river water. Braz. Arch. Biol. Technol. 2021, 48, 191–196. [Google Scholar] [CrossRef]
- Hansen, B.A.; Bruserud, Ø. Hypomagnesemia in critically ill patients. J. Intensive Care 2018, 6, 21. [Google Scholar] [CrossRef] [Green Version]
- Andresen, E.; Peiter, E.; Küpper, H. Trace metal metabolism in plants. J. Exp. Bot. 1957, 69, 909–954. [Google Scholar] [CrossRef]
- Santos, C.Z.A.; Bezerra, T.S.C.; Pedrotti, A.; MeloJúnior, A.V.; Gomes, L.J. Multi-criteria analysis for selection of priority management programs for the Japaratuba River Basin, SE, Brazil1 1 Research developed at Japaratuba River Basin in the State of Sergipe, Brazil. Rev. Eng. E Ambient. 2021, 25, 10. [Google Scholar]
- Delorenzo, M.E.; Evans, B.N.; Chung, K.W.; Key, P.B.; Fulton, M.H. Effects of salinity on oil dispersant toxicity in the eastern mud snail, Ilyanassaobsoleta. Environ. Sci. Pollut. Res. 2017, 24, 21476–21483. [Google Scholar] [CrossRef]
- Pilchova, I.; Klacanova, K.; Tatarkova, Z.; Kaplan, P.; Racay, P. The Involvement of Mg2+ in Regulation of Cellular and Mitochondrial Functions. Oxid. Med. Cell. Longev. 2017, 2017, 6797460. [Google Scholar] [CrossRef] [PubMed] [Green Version]
- Conselho Nacional Do Meio Ambiente (CONAMA). Resolução Nº 357, De 17 De Março De 2005; Conselho Nacional Do Meio Ambiente: Brasilia, Brazil, 2005.
- American Public Health Association (APHA). Standard Methods for the Examination of Water and Wastewater, 21st ed.; APHA: Washington, DC, USA, 2005. [Google Scholar]
- Agência Nacional de Vigilância Sanitária (ANVISA). Resolução Da Diretoria Colegiada—RDC Nº 18, DE 03 DE ABRIL DE 2013. In Diário Oficial da União; Agência Nacional de Vigilância Sanitária: Brasilia, Brazil, 2013. [Google Scholar]
- CLSI. Performance Standards for Antimicrobial Susceptibility Testing, 27th ed.; CLSI Supplement M100; Clinical and Laboratory Standards Institute: Wayne, PA, USA, 2017. [Google Scholar]
- Companhia Ambiental Do Estado De São Paulo (CETESB). Apêndice, A. Significado Ambiental E Sanitário Das Variáveis De Qualidade Das Aguas E Dos Sedimentos E Metodologia Sanalíticas E De Amostragem; CETESB: São Paulo, Brazil, 2008.
- CCME. Canadian water quality guidelines for the protection of aquatic life: CCME Water Quality Index 1.0, User’s Manual. In Canadian Environmental Quality Guidelines, 1999; Canadian Council of Ministers of the Environment: Winnipeg, MB, Canada, 2001. [Google Scholar]
- Fiskesjo, G. The Allium test as a standard in environmental monitoring. Hereditas 1985, 102, 99–112. [Google Scholar] [CrossRef] [PubMed]
- Zimmermann, P.R.G.; Dalzochio, T.; Gehlen, G. Allium cepa L. bioassay and physicochemical and microbiological analysis to evaluate the water quality of the Ilha River, RS, Brazil. Actatoxicology 2016, 24, 97–104. [Google Scholar]
- Chaves, L.C.C.; Navoni, J.A.; de Morais Ferreira, D.; de Medeiros, S.B.; da Costa, T.F.; Petta, R.A.; do Amaral, V.S. Water mutagenic potential assessment on a semiarid aquatic ecosystem under influence of heavy metals and natural radioactivity using micronuclei test. Environ. Sci. Res. 2016, 238, 7572–7581. [Google Scholar] [CrossRef]
- Sikder, M.T.; Kihara, Y.; Yasuda, M.; Mihara, Y.; Tanaka, S.; Odgerel, D.; Kurasaki, M. River water pollution in developed and developing countries: Judge and assessment of physicochemical characteristics and selected dissolved metal concentration. CLEAN–Soil Air Water 2013, 41, 60–68. [Google Scholar] [CrossRef]
- Fazlzadeh, M.; Sadeghi, H.; Bagheri, P.; Poureshg, Y.; Rostami, R. Microbial quality and physical–chemical characteristics of thermal springs. Environ. Geochem. Health 2016, 382, 413–422. [Google Scholar] [CrossRef]
- Oliveira, T.R.; Cunha, J.P.V.S. Global output feedback sliding mode control of nonlinear systems with multiple time delays. In Proceedings of the 19th IFAC World Congress, Cape Town, South Africa, 24–29 August 2014; Volume 19, pp. 4619–4624. [Google Scholar]
- Santos, R.S.; Mohrt, T. Saúde e Qualidade da água: AnálisesMicrobiológicas e Físico-QuímicasemÁguasSubterrâneas. Rev. Context Saúdeijuí. 2013, 13, 46–53. [Google Scholar]
- Lobaccaro, G.; Acero, J.A. Comparative analysis of green actions to improve outdoor thermal comfort inside typical urban street canyons. Urban Clim. 2015, 14, 251–267. [Google Scholar] [CrossRef]
- Brasil Agência Nacional de Vigilância Sanitária Microbiologia Clínica Para O Controle De Infecção Relacionada a Assistência a Saúde. Módulo 6: Detecção E Identificação De Bactérias De Importância Médica/Agência Nacional De Vigilância Sanitária; Anvisa: Brasilia, Brazil, 2013. Available online: https://spdbcfmusp.files.wordpress.com/2014/09/iras_modulodeteccaobacterias.pdf (accessed on 11 February 2016).
- Agrizzi, D.V.; Cecílio, R.A.; Zanetti, S.S.; Garcia, G.O.; Amaral, A.A.; Firmino, E.F.A.; Mendes, N.G.S. Qualidade da água de nascentes do Assentamento Paraíso. Eng. Sanit. Ambient. 2018, 23, 557–568. [Google Scholar] [CrossRef] [Green Version]
- Nascimento, V.F.S.; Araújo, M.F.F. Ocorrênciad Bactérias Patogênicas oportunistas em um Reservatório do Semiárido do Rio Grande do Norte, Brasil. Revista De Ciências Ambientais 2013, 7, 91–94. [Google Scholar]
- Brasil. Ministério da Saúde. Manual de Controle da Qualidade da água para Técnicos que Trabalham em ETAS. 2014. Available online: www.funasa.gov.br/documents/20182/38937/Manual+de+controle+da+qualidade+da+%C3%A1gua+para+t%C3%A9cnicos+que+trabalham+em+ETAS+2014.pdf/85bbdcbc-8cd2-4157-940b-90b5c5bcfc87 (accessed on 15 March 2021).
- Alós, J.L. Resistencia bacteriana a losantibióticos: Una crisis global Antibioticresistanc. Infecc. Microbiol. Clin. 2015, 33, 692–699. [Google Scholar] [CrossRef] [PubMed]
- Dantas, G.; Sommer, M.O.; Oluwasegun, R.D.; Church, G.M. Bacteria subsisting on antibiotics. Science 2008, 320, 100–103. [Google Scholar] [CrossRef] [PubMed] [Green Version]
- Bortoloti, K.d.C.S.; Melloni, R.; Marques, P.S.; Fernandes de Carvalho, B.M.; Chaves Andrade, M. Qualidade microbiológica de águas naturais quanto ao perfil de resistência de bactérias heterotróficas a antimicrobianos. Eng. Sanit. Ambient. 2018, 23, 717–725. [Google Scholar] [CrossRef]
- Toombs-Ruane, L.J.; Benschop, J.; Burgess, S.; Priest, P.; Murdoch, D.R.; French, N.P. Multidrug resistant Enterobacteriaceae in New Zealand: A current perspective. N. Z. Vet. J. 2017, 65, 62–70. [Google Scholar] [CrossRef]
- Vaz-Moreira, I.; Nunes, O.C.; Manaia, C.M. Diversity and antibiotic resistance in Pseudomonas spp. from drinking water. Sci. Total. 2012, 426, 366–374. [Google Scholar] [CrossRef]
- Narciso-da-Rocha, C.; Manaia, C.M. Multidrug resistance phenotypes are widespread over different bacterial taxonomic groups thriving in surface water. Sci. Total Environ. 2016, 563, 1–9. [Google Scholar] [CrossRef]
- Freitas, D.G.; Silva, R.D.R.; Bataus, L.A.M.; Barbosa, M.S.; Braga, C.A.S.B.; Carneiro, L.C. Bacteriological water quality in school’s drinking fountains and detection antibiotic resistance genes. Clin. Microbiol. Antimicrob. 2017, 16, 1–5. [Google Scholar] [CrossRef] [Green Version]
- Fu, Y.; Li, G.; Wang, R.; Zhang, F.; Qin, M. Effect of the molecular structure of acylating agents on the regioselectivity of cellulosic hydroxyl groups in ionic liquid. BioResources 2016, 12, 992–1006. [Google Scholar] [CrossRef] [Green Version]
- Agência Nacional de Vigilância Sanitária (ANVISA). Gerência-Geral de Tecnologia em Serviços e Saúde Gerência de Investigação e Prevenção das Infecções e dos Eventos Adversos; ANVISA: Brasília, Brasil, 2000.
- Sanchez, L.O.; Gustot, T. Multidrug-Resistant Bacterial Infection in Patients with Cirrhosis. A Review. Curr. Hepatol. Rep. 2019, 70, 1–8. [Google Scholar] [CrossRef]
- Ouyang, J.Q.; Davies, S.; Dominoni, D. Hormonally mediated effects of artificial light at night on behavior and fitness: Linking endocrine mechanisms with function. J. Exp. Biol. 2018, 221, jeb156893. [Google Scholar] [CrossRef] [Green Version]
- Wang, G.H.; Brucker, R.M. Genome Sequence of Providenciarettgeri NVIT03, Isolated from Nasonia vitripennis. Microbiol. Resour. Announc. 2019, 8, e01157-18. [Google Scholar] [CrossRef] [PubMed] [Green Version]
- Butorina, A.K.; Kalaev, V.N. Analysis of sensitivity of different criteria in cytogenetic monitoring. Russ. J. Ecol. 2000, 31, 186–189. [Google Scholar] [CrossRef]
- Park, B.; Youngwook, S.; Matthew, E.; Seung-Chul, Y.; Hinton, A., Jr.; Kurt, L.; Gary, G. Classification of Salmonella Serotypes with Hyperspectral Microscope Imagery. Ann. Clin. Pathol. 2017, 5, 1108. [Google Scholar]
- Yilmaz, M.; Yilmaz, E.; Babur, M.; Ozdemir, R.L.; Gieseking, Y.; Dede, U.; Tamer, G.C.; Schatz, A.; Facchetti, H.; Usta, G. Demirel. Nanostructured organic semiconductor films for molecular detection with surface-enhanced Raman spectroscopy. Nat. Mater. 2017, 16, 918–924. [Google Scholar] [CrossRef]
- Muniz, D.H.F.; Moraes, A.S.; Freire, I.S.; Cruz, C.J.D.C.; Lima, J.E.F.W.; Oliveira-Filho, E.C. Evaluation of water quality parameters for monitoring natural, urban, and agricultural areas in the Brazilian Cerrado. Acta Limnol. 2011, 23, 3. [Google Scholar] [CrossRef] [Green Version]
- International Fertilizer Industry Association. In Proceedings of the IFA Technical Conference, Marrakech, Morocco, 28 September–1 October 1998; p. 18.
- Ward, N.C.; Watts, G.F.; Eckel, R.H. Statin Toxicity Mechanistic Insights and Clinical Implications. Circ. Res. 2019, 124, 328–350. [Google Scholar] [CrossRef]
- Padrilah, S.N.; Sabullah, M.K.; Shukor, M.Y.A.; Yasid, N.A.; Shamaan, N.A.; Ahmad, A.S. Toxicity effects of fish histopathology on copper accumulation. Pertanika J. Trop. Agric. Sci. 2018, 41, 519–540. [Google Scholar]
- Zarse, K.; Terao, T.; Tian, J.; Iwata, N.; Ishii, N.; Ristow, M. Low-dose lithium uptake promotes longevity in humans and metazoans. Eur. J. Nutr. 2011, 50, 387–389. [Google Scholar] [CrossRef] [Green Version]
- Silva, C.A.; Yamanaka, E.H.U.; Monteiro, C.S. Monitoramento microbiológico da água de bica sem parques públicos de Curitiba (PR). Eng. Sanit. Ambient. Reg. ABES 2017, 22, 158283. [Google Scholar]
- Bertan, A.S.; Baumbach, F.P.; Pokrywiecki, T.S.; Düsman, E. Assessment of phytoremediation potencial of Allium cepa L. in raw sewage treatment. Braz. J. Biol. 2019, 80, 431–436. [Google Scholar] [CrossRef] [Green Version]
- Dourado, P.L.R.; da Rocha, M.P.; Roveda, L.M.; Raposo, J.L.; Cândido, L.S.; Cardoso, C.A.L.; Morales, M.A.M.; Oliveira, K.M.P.; Grisolia, A.B. Genotoxic and mutagenic effects of polluted surface water in the midwestern region of Brazil using animal and plant bioassays. Genet. Mol. Biol. 2017, 40, 123–133. [Google Scholar] [CrossRef] [PubMed] [Green Version]
- Datta, S.; Singh, J.; Singh, J.; Singh, S.; Singh, S. Assessment of genotoxic effects of pesticide and vermin compost treated soil with Allium cepa test. Sustain. Environ. Res. 2018, 28, 171–178. [Google Scholar] [CrossRef]
- Bhat, R.; Dayamani, K.J.; Hathwar, S.; Hegde, R.; Kush, A. Exploration on Production of Rhamnolipid Biosurfactants Using Native Pseudomonas aeruginosa Strains. J. BioSci. Biotechnol. 2015, 4, 157–166. [Google Scholar]
- Singh, P.K.; Banerjee, S.; Srivastava, A.; Sharma, Y.C. Kinetic and equilibrium modeling for removal of nitrate from aqueous solutions and drinking water by a potential adsorbent, hydrous bismuth oxide. R. Soc. Chem. 2015, 5, 35365–35376. [Google Scholar] [CrossRef]
- Maynard, I.F.N.; Cruz, M.A.S.; Gomes, L.J. Aplicação de um índice de sustentabilidad en a bacia hidrográfica do rio Japaratubaem Sergipe. Ambiente Soc. 2017, 20, 207–226. [Google Scholar]
- Ramos, L.P.N.; Leite, D.M.; Macedo, W.D.A.; Farias, C.B.M.; Oliveira, A.S.D.; Dahmer, N. Evaluation of the cytotoxic and genotoxic effect of Allium cepa L. (Amaryllidaceae) root cells after exposure in water samples of five lakes of Alta Floresta, State of MatoGrosso. Rev. Água 2020, 15, e2463. [Google Scholar] [CrossRef] [Green Version]
- Migid, H.M.A.; Azab, Y.A.; Ibrahim, W.M. Use of plant genotoxicity bioassay for the evaluation of efficiency of algal biofilters in bioremediation of toxic industrial effluent. Ecotoxicol. Environ. Saf. 2007, 6, 57–64. [Google Scholar] [CrossRef]
- Fontana, M.; Turino, L.R.; Tonial, B.I.; Pokrywiecki, S.T.; Düsman, E. Efficiency of effluent treatment of meatpacking and textile plants, in physical, chemical and toxicological terms. Rev. Int. Contam. Ambient. 2020, 36, 399–411. [Google Scholar] [CrossRef]
- Mercado, S.A.S.; Caleño, J.D.Q. Cytotoxic evaluation of glyphosate, using Allium cepa L. as bioindicator. Sci. Total Environ. 2019, 700, 134452. [Google Scholar] [CrossRef]
- Montalvão, M.F.; Sampaio, L.L.G.; Gomes, H.H.F.; Malafaia, G. An insight into the cytotoxicity, genotoxicity, and mutagenicity of smoked cigarette butt leachate by using Allium cepa as test system. Environ. Sci. Pollut. Res. 2019, 262, 2013–2021. [Google Scholar] [CrossRef]
- Ciappina, A.; Ferreira, F.; Pereira, I.; Sousa, T.; Matos, F.; Melo-Reis, P.; Gonçalves, P.; Bailão, E.; Almeida, L. Oxicity of Jatropha Curcas L. Latex in Allium cepa TEST. Biosci. J. 2017, 33, 1295–1304. [Google Scholar]
- Rahman, M.M.; Rahman, M.F.; Nasirujjaman, K. Um estudo sobre genotoxicidade de efluentes da indústria de tingimento de tecidos de Rajshahi, Bangladesh, pelo teste de Allium cepa. Chem. Ecol. 2017, 33, 434–446. [Google Scholar] [CrossRef]
- Silveira, M.A.D.; Ribeiro, D.L.; Vieira, G.M.; Demarco, N.R.; d’Arce, L.P.G. Direct and indirect anthropogenic contamination in water sources: Evaluation of chromosomal stability and cytotoxicity using the Allium cepa test. Bull. Environ. Contam. Toxicol. 2018, 100, 216–220. [Google Scholar] [CrossRef] [PubMed]
- Hayek, A.; Tabaja, N.; Andaloussi, S.A.; Toufaily, J.; Garnie-Zarli, E.; El Toufaili, A.; Hamieh, T. Evaluation of the Physico-Chemical Properties of the Waters on the Litani River Station Quaraoun. Am. J. Anal. Chem. 2020, 11, 90. [Google Scholar] [CrossRef] [Green Version]
- Atique, U.; Iqbal, S.; Khan, N.; Qazi, B.; Javeed, A.; Anjum, K.M.; Sherzada, S. Avaliação multivariada da química da água e metaisem um rio impactado pela indústria de curtimento. Fresenius Environ. Bull. 2020, 29, 3013–3025. [Google Scholar]
- Kasvi, E.; Salmela, J.; Lotsari, E.; Kumpula, T.; Lane, S.N. Comparação de abordagens baseada sem sensoriamento remoto para mapear a batimetria de rios de águasrasas e claras. Geomorphology 2019, 333, 180–197. [Google Scholar] [CrossRef]


| Collection | Points | pH | Total Hardness (mg/L) | Electrical Conductivity (µs/cm) | Turbidity (NTU) | Alkalinity (mg/L) | Apparent Color (uH) ** | Nitrate (mg/L) |
|---|---|---|---|---|---|---|---|---|
| July 2017 (drought season) | P1 | 7.82 | 4.30 | 114.10 | 0.50 | 18.50 | 1.80 | 3.90 |
| P2 | 6.51 | 2.90 | 133.70 | 2.74 | 8.50 | 9.20 | 7.70 | |
| P3 | 5.66 | 2.60 | 112.70 | 0.86 | 4.00 | 2.50 | 8.50 | |
| P4 | 6.81 | 2.65 | 100.50 | 10.6 | 12.00 | 33.30 | 3.50 | |
| P5 | 7.03 | 2.75 | 102.20 | 5.75 | 12.25 | 29.80 | 3.20 | |
| P6 | 7.15 | 2.80 | 99.92 | 6.41 | 12.50 | 31.40 | 2.80 | |
| October 2017 (rainy season) | P1 | 7.73 | 2.50 | 122.10 | 0.25 | 20.00 | 1.20 | 3.60 |
| P2 | 6.68 | 2.00 | 146.90 | 3.65 | 16.25 | 31.00 | 4.60 | |
| P3 | 6.44 | 2.25 | 151.20 | 8.68 | 18.00 | 48.70 | 4.60 | |
| P4 | 6.92 | 1.85 | 125.60 | 19.60 | 18.50 | 69.20 | 1.20 | |
| P5 | 6.97 | 1.70 | 125.60 | 20.90 | 19.00 | 66.80 | 1.10 | |
| P6 | 6.98 | 1.65 | 122.70 | 27.70 | 19.25 | 78.70 | 1.10 | |
| March 2018 (rainy season) | P1 | 7.42 | 0.6 | 123.70 | 0.29 | 20.00 | 0.10 | 4.10 |
| P2 | 5.91 | 0.00 | 196.50 | 1.96 | 9.50 | 11.10 | 12.40 | |
| P3 | 6.50 | 0.00 | 149.70 | 5.85 | 15.50 | 39.70 | 6.10 | |
| P4 | 7.10 | 0.00 | 106.30 | 3.24 | 17.00 | 24.20 | 2.90 | |
| P5 | 6.78 | 0.00 | 94.52 | 4.54 | 16.00 | 23.50 | 2.80 | |
| P6 | 6.99 | 0.00 | 76.95 | 3.78 | 16.00 | 18.20 | 1.30 | |
| June 2018 (drought season) | P1 | 7.71 | 2.00 | 123.50 | 0.22 | 36.00 | 5.10 | 4.30 |
| P2 | 5.71 | 0.70 | 191.40 | 5.12 | 16.00 | 25.50 | 12.20 | |
| P3 | 6.46 | 0.85 | 138.40 | 7.46 | 19.50 | 39.80 | 6.30 | |
| P4 | 6.38 | 0.75 | 107.30 | 18.50 | 19.00 | 46.40 | 4.60 | |
| P5 | 6.67 | 0.75 | 123.70 | 15.00 | 23.50 | 37.90 | 4.90 | |
| P6 | 7.03 | 0.95 | 108.00 | 3.59 | 24.00 | 17.10 | 2.70 | |
| Means | 6.81 | 1.52 | 124.88 | 7.38 | 17.11 | 28.84 | 4.60 | |
| ± Standard deviation | 0.57 | 1.19 | 27.80 | 7.55 | 6.14 | 22.07 | 3.05 | |
| MAV * Attachment XX of Consolidation Ordinance Nº 5 of the Ministry of Health (2017) | - | 6.0 to 9.5 (1) | ≤500 | NR *** | ≤5 | NR *** | ≤15 | ≤10 |
| MAV * 357 Resolution. CONAMA (2005)—river class 1 | - | 6.0 to 9.0 | NR *** | NR *** | ≤40 | NR *** | natural color level of the water body (2) | ≤10 |
| MAV * 357 Resolution, CONAMA (2005)—river class 2 | - | 6.0 to 9.0 | NR *** | NR *** | ≤100 | NR *** | ≤75 (2) | ≤10 |
| Collect | Samples | MPN TC */100 mL | MPN TTC **/100 mL |
|---|---|---|---|
| July 2017 (drought season) | P1 | ND *** | ND *** |
| P2 | ≥1600 | ≥1600 | |
| P3 | ≥1600 | ≥1600 | |
| P4 | ≥1600 | 900 | |
| P5 | ≥1600 | ≥1600 | |
| P6 | ≥900 | 900 | |
| October 2017 (rainy season) | P1 | ND *** | ND *** |
| P2 | ≥1600 | ≥1600 | |
| P3 | ≥1600 | ≥1600 | |
| P4 | ≥1600 | ≥1600 | |
| P5 | ≥1600 | ≥1600 | |
| P6 | ≥1600 | ≥1600 | |
| March 2018 (rainy season) | P1 | 7 | 4 |
| P2 | ≥1600 | 280 | |
| P3 | ≥1600 | 350 | |
| P4 | ≥1600 | ≥1600 | |
| P5 | ≥1600 | ≥1600 | |
| P6 | ≥1600 | 350 | |
| June 2018 (drought season) | P1 | 2 | ≤ 2 |
| P2 | ≥1600 | 17 | |
| P3 | ≥1600 | 34 | |
| P4 | ≥1600 | ≥1600 | |
| P5 | ≥1600 | ≥1600 | |
| P6 | ≥1600 | 500 | |
| MAV Attachment XX of Consolidation Ordinance Nº 5 of the Ministry of Health (2017) | - | ND *** | ND *** |
| MAV 357 Resolution, CONAMA (2005)—river class 1 | - | 200 | NR **** |
| MAV 357 Resolution, CONAMA (2005)—river class 2 | - | 1000 | NR **** |
| Antimicrobials | Amoxicillin | Ampicillin | Cefepime | Cefoxitin | Ceftazidime | Ceftriaxone | Aztreonam | Ciprofloxacino | Amikacin | Tetracycline | Sulfazotrim | Gentamycin | Ampicillin + Sulbactam | Piperacyclin | Amoxicillin + Clavulanate | Chlorphenphenol | Penicillin | Rifampicin | Clindamycin | Erythromycin | Linezolid | Novobiocin |
|---|---|---|---|---|---|---|---|---|---|---|---|---|---|---|---|---|---|---|---|---|---|---|
| I (%) | 0.0 | 3.9 | 3.1 | 0.0 | 3.1 | 4.1 | 1.75 | 2.9 | 0.0 | 1.1 | 3.3 | 4.1 | 0.0 | 0.0 | 9.1 | 0.0 | 0.0 | 0.0 | 5.3 | 2.6 | 0.0 | 0.0 |
| R (%) | 47.1 | 50.1 | 12.3 | 6.2 | 10.8 | 10.2 | 1.7 | 4.8 | 6.2 | 9.5 | 10.9 | 14.3 | 50.0 | 100.0 | 59.1 | 5.9 | 71.8 | 56.4 | 63.2 | 48.7 | 56.4 | 70.0 |
| S (%) | 52.9 | 45.1 | 84.6 | 93.7 | 86.1 | 85.7 | 96.5 | 92.2 | 93.7 | 89.4 | 85.9 | 81.6 | 50.0 | 0.0 | 31.8 | 94.1 | 28.2 | 43.6 | 31.6 | 48.7 | 43.6 | 30.0 |
| TN | 17.0 | 51.0 | 65.0 | 16.0 | 65.0 | 49.0 | 57.0 | 103.0 | 64.0 | 94.0 | 92.0 | 98.0 | 6.0 | 43.0 | 22.0 | 17.0 | 39.0 | 39.0 | 38.0 | 39.0 | 39.0 | 40.0 |
| Collection | Samples | Pb (µg/L) | Fe (µg/L) | Mg (µg/L) | Cd (µg/L) | Li (µg/L) | Cu (µg/L) |
|---|---|---|---|---|---|---|---|
| July 2017 (drought season) | P1 | <LOQ” | 0.10 | 0.20 | <LOQ” | 0.55 | 1.00 |
| P2 | <LOQ” | 6.10 | 12.20 | <LOQ” | 0.49 | 2.30 | |
| P3 | <LOQ” | 6.70 | 13.40 | <LOQ” | 0.65 | 1.40 | |
| P4 | <LOQ” | 19.40 | 38.80 | <LOQ” | 0.55 | 1.10 | |
| P5 | <LOQ” | 24.90 | 49.80 | <LOQ” | 0.55 | 1.50 | |
| P6 | <LOQ” | 14.60 | 29.20 | <LOQ” | 0.49 | 1.10 | |
| <LOQ” | |||||||
| October 2017 (rainy season) | P1 | 0.10 | 1.12 | 0.31 | <LOQ” | 0.09 | 0.20 |
| P2 | 0.07 | 5.13 | 0.04 | <LOQ” | 0.09 | 0.10 | |
| P3 | 0.08 | 3.00 | 0.67 | <LOQ” | 0.01 | 0.40 | |
| P4 | 0.13 | 3.29 | 0.64 | <LOQ” | 0.07 | 0.30 | |
| P5 | 0.14 | 1.95 | 0.73 | <LOQ” | 0.07 | 0.40 | |
| P6 | 0.12 | 31.01 | 0.59 | <LOQ” | 0.08 | 0.40 | |
| <LOQ” | |||||||
| March 2018 (rainy season) | P1 | <LOQ” | 3.00 | 360.00 | <LOQ” | 0.03 | 0.10 |
| P2 | <LOQ” | 2.00 | 160.00 | <LOQ” | 0.02 | 0.10 | |
| P3 | <LOQ” | 97.00 | 170.00 | <LOQ” | 0.02 | 0.20 | |
| P4 | <LOQ” | 3.00 | 130.00 | <LOQ” | 0.02 | 0.60 | |
| P5 | <LOQ” | 1.00 | 140.00 | <LOQ” | 0.02 | 0.20 | |
| P6 | <LOQ” | 23.00 | 140.00 | <LOQ” | 0.00 | 0.30 | |
| June 2018 (drought season) | P1 | 0.14 | 3.20 | 353.00 | 0.03 | 0.09 | 0.23 |
| P2 | 0.10 | 58.60 | 208.00 | 0.00 | 0.05 | 0.05 | |
| P3 | 0.12 | 90.90 | 166.00 | 0.03 | 0.02 | 0.25 | |
| P4 | 0.13 | 50.20 | 155.00 | 0.05 | 0.01 | 0.50 | |
| P5 | 0.07 | 60.90 | 158.00 | 0.06 | 0.02 | 0.31 | |
| P6 | 0.11 | 12.70 | 153.00 | 0.08 | 0.01 | 0.31 | |
| Means | 0.05 | 21.78 | 101.65 | 0.01 | 0.18 | 0.56 | |
| ± Standard deviation | 0.05 | 28.72 | 107.38 | 0.02 | 0.23 | 0.56 | |
| MAV Consolidation Attachment XX of Consolidation Ordinance Nº 5 of the Ministry of Health (2017) | - | 0.01 | 300.0 | NR ** | 5.0 | NR ** | 20,000 |
| * MAV 357 Resolution, CONAMA (2005)—river class 1 | - | 0.01 | 300.0 | NR ** | 1.0 | 25,000 | 9.0 |
| * MAV 357 Resolution, CONAMA (2005)—river class 2 | - | 0.01 | 300.0 | NR ** | 0.1 | 2000 | 9.0 |
| Collection | Samples | Mean of GR (cm) | MI (% Means ± SD) | CAI (% Means ± SD) |
|---|---|---|---|---|
| July 2017 (drought season) | P1 | 4.93 | 55.1 ± 4.24 | 0.23 ± 0.13 |
| P2 | 4.22 | 58.24 ± 1.87 | 0.5 ± 0.20 | |
| P3 | 3.9 | 59.44 ± 5.88 | 1.51 ± 0.07 | |
| P4 | 4.27 | 50.36 ± 3.65 | 0.96 ± 0.08 | |
| P5 | 3.52 | 51.07 ± 3.46 | 0.94 ± 0.14 | |
| P6 | 3.5 | 32.34 ± 7.70 | 0.32 ± 0.23 | |
| NC | 4.53 | 51.03 ± 4.58 | 0.52 ± 0.14 | |
| October 2017 (rainy season) | P1 | 6.52 | 52.98 ± 17.16 | 0.83 ± 0.19 |
| P2 | 5.6 | 56.93 ± 7.42 | 0.93 ± 0.49 | |
| P3 | 6.08 | 55.07 ± 10.77 | 0.73 ± 0.10 | |
| P4 | 5.32 | 48.17 ± 7.18 | 0.86 ± 0.12 | |
| P5 | 4.67 | 51.45 ± 8.09 | 0.47 ± 0.21 | |
| P6 | 7.01 | 30.61 ± 4.47 | 0.67 ± 0.21 | |
| NC | 4.48 | 53.96 ± 1.51 | 0.51 ± 0.16 | |
| March 2018 (rainy season) | P1 | 3.73 | 49.65 ± 13.98 | 0.27 ± 0.13 |
| P2 | 4.04 | 30.61 ± 4.47 | 0.35 ± 0.08 | |
| P3 | 3.98 | 42.89 ± 15.19 | 0.19 ± 0.11 | |
| P4 | 5.53 | 48.17 ± 7.18 | 0.24 ± 0.02 | |
| P5 | 3.27 | 46.69 ± 4.77 | 0.25 ± 0.09 | |
| P6 | 5.20 | 53.19 ± 5.75 | 0.21 ± 0.03 | |
| NC | 3.88 | 55.89 ± 1.82 | 0.41 ± 0.17 | |
| June 2018 (drought season) | P1 | 4.11 | 44.65 ± 11.77 | 0.27 ± 0.08 |
| P2 | 3.87 | 52.11 ± 8.05 | 0.18 ± 0.06 | |
| P3 | 3.74 | 51.00 ± 2.23 | 0.27 ± 0.17 | |
| P4 | 3.64 | 49.73 ± 7.55 | 0.25 ± 0.02 | |
| P5 | 4.45 | 55.67 ± 2.17 | 0.28 ± 0.09 | |
| P6 | 4.11 | 44.51 ± 9.22 | 0.28 ± 0.06 | |
| NC | 4.04 | 55.18 ± 3.03 | 0.23 ± 0.04 |
| pH | Total Hardness | Conductivity | Turbidity | Alkalinity | Color | Nitrate | Pb | Fe | Mg | Cd | Li | Cu | TC | TTC | Mean GR | MI | CAI | |
|---|---|---|---|---|---|---|---|---|---|---|---|---|---|---|---|---|---|---|
| pH | 1.00 | |||||||||||||||||
| Total Hardness | 0.32 | 1.00 | ||||||||||||||||
| Conductivity | −0.52 | −0.17 | 1.00 | |||||||||||||||
| Turbidity | −0.10 | −0.06 | −0.07 | 1.00 | ||||||||||||||
| Alkalinity | 0.57 | −0.14 | −0.08 | 0.12 | 1.00 | |||||||||||||
| Color | −0.16 | −0.11 | 0.03 | 0.92 | 0.08 | 1.00 | ||||||||||||
| Nitrate | −0.70 | −0.14 | 0.77 | −0.40 | −0.37 | −0.39 | 1.00 | |||||||||||
| Pb | −0.09 | −0.22 | 0.12 | 0.11 | 0.62 | 0.04 | 0.16 | 1.00 | ||||||||||
| Fe | −0.37 | −0.38 | 0.22 | 0.23 | 0.06 | 0.30 | 0.25 | 0.43 | 1.00 | |||||||||
| Mg | 0.05 | −0.59 | 0.13 | −0.31 | 0.50 | −0.35 | 0.24 | 0.52 | 0.27 | 1.00 | ||||||||
| Cd | 0.02 | −0.22 | −0.13 | 0.13 | 0.52 | 0.01 | −0.06 | 0.78 | 0.31 | 0.35 | 1.00 | |||||||
| Li | −0.01 | 0.74 | −0.29 | −0.25 | −0.53 | −0.32 | 0.10 | −0.31 | −0.20 | −0.39 | −0.25 | 1.00 | ||||||
| Cu | −0.05 | 0.63 | −0.31 | −0.12 | −0.55 | −0.19 | 0.04 | −0.31 | −0.20 | −0.45 | −0.19 | 0.86 | 1.00 | |||||
| TC | −0.72 | −0.37 | 0.11 | 0.43 | −0.44 | 0.55 | 0.12 | −0.02 | 0.33 | −0.29 | 0.08 | −0.10 | 0.09 | 1.00 | ||||
| TTC | −0.26 | 0.09 | −0.25 | 0.52 | −0.31 | 0.53 | −0.29 | −0.26 | −0.19 | −0.53 | −0.05 | 0.11 | 0.35 | 0.60 | 1.00 | |||
| Mean GR | 0.29 | 0.18 | 0.03 | 0.30 | 0.17 | 0.31 | −0.36 | −0.28 | −0.26 | −0.48 | −0.24 | −0.30 | −0.20 | −0.07 | 0.16 | 1.00 | ||
| MI | −0.07 | 0.27 | −0.14 | −0.24 | −0.08 | −0.25 | 0.04 | 0.02 | −0.04 | −0.16 | 0.02 | 0.21 | 0.26 | 0.00 | 0.16 | 0.02 | 1.00 | |
| CAI | −0.19 | 0.52 | −0.09 | 0.07 | −0.45 | 0.07 | −0.03 | −0.38 | −0.32 | −0.60 | −0.32 | 0.46 | 0.38 | 0.16 | 0.44 | 0.27 | 0.30 | 1.00 |
Publisher’s Note: MDPI stays neutral with regard to jurisdictional claims in published maps and institutional affiliations. |
© 2022 by the authors. Licensee MDPI, Basel, Switzerland. This article is an open access article distributed under the terms and conditions of the Creative Commons Attribution (CC BY) license (https://creativecommons.org/licenses/by/4.0/).
Share and Cite
Kikuda, R.; Pereira Gomes, R.; Rodrigues Gama, A.; De Paula Silva, J.A.; Pereira Dos Santos, A.; Rodrigues Alves, K.; Nascimento Arruda, P.; Scalize, P.S.; Gonçalves Vieira, J.D.; Carneiro, L.C.; et al. Evaluation of Water Quality of Buritis Lake. Water 2022, 14, 1414. https://doi.org/10.3390/w14091414
Kikuda R, Pereira Gomes R, Rodrigues Gama A, De Paula Silva JA, Pereira Dos Santos A, Rodrigues Alves K, Nascimento Arruda P, Scalize PS, Gonçalves Vieira JD, Carneiro LC, et al. Evaluation of Water Quality of Buritis Lake. Water. 2022; 14(9):1414. https://doi.org/10.3390/w14091414
Chicago/Turabian StyleKikuda, Renata, Raylane Pereira Gomes, Aline Rodrigues Gama, Junilsom Augusto De Paula Silva, Adailton Pereira Dos Santos, Keliane Rodrigues Alves, Poliana Nascimento Arruda, Paulo Sérgio Scalize, José Daniel Gonçalves Vieira, Lilian Carla Carneiro, and et al. 2022. "Evaluation of Water Quality of Buritis Lake" Water 14, no. 9: 1414. https://doi.org/10.3390/w14091414
APA StyleKikuda, R., Pereira Gomes, R., Rodrigues Gama, A., De Paula Silva, J. A., Pereira Dos Santos, A., Rodrigues Alves, K., Nascimento Arruda, P., Scalize, P. S., Gonçalves Vieira, J. D., Carneiro, L. C., & De Jesus Pires, D. (2022). Evaluation of Water Quality of Buritis Lake. Water, 14(9), 1414. https://doi.org/10.3390/w14091414