Article

Decarbonizing Vehicle Transportation with Hydrogen from Biomass Gasification: An Assessment in the Nigerian Urban Environment

by
Donald Ukpanyang
* and
Julio Terrados-Cepeda
Centre for Advanced Studies in Energy and Environment, Universidad de Jaen, 23071 Jaén, Spain
*
Author to whom correspondence should be addressed.
Energies 2022, 15(9), 3200; https://doi.org/10.3390/en15093200
Submission received: 21 March 2022 / Revised: 16 April 2022 / Accepted: 19 April 2022 / Published: 27 April 2022

Abstract

:
Tailpipe emissions from vehicles consist of CO2 and other greenhouse gases, which contribute immensely to the rise in global temperatures. Green hydrogen produced from the gasification of biomass can reduce the amount of CO2 emissions to zero. This study aims to provide a modelling framework to optimize the production of hydrogen from biomass waste obtained from different cities, for use in the road transport sector in Nigeria. A gasification model with post-treatment shift conversion and CO2 removal by adsorption is proposed. In this study, six cities are simulated based on technical and environmental considerations, using the Aspen Plus software package. The results revealed that Kaduna has the highest hydrogen generation potential of 0.148 million metric tons per year, which could reduce CO2 emissions to 1.60 and 1.524 million metric tons by the displacement of an equivalent volume of gasoline and diesel. This amounts to cost savings of NGN 116 and 161.8 billion for gasoline and diesel, respectively. In addition, the results of the sensitivity analysis revealed that the steam-to-biomass ratio and the temperature of gasification are positively correlated with the amount of avoided CO2 emissions, while the equivalence ratio shows a negative correlation.

Graphical Abstract

1. Introduction

The global energy demand in 2020 was estimated to be 557 exajoules (EJ), of which 31.2% and 27.2% are met by oil and coal resources, respectively, representing the largest contributions [1]. CO2 emissions are primarily driven by economic growth, which requires the consumption of fossil fuels. To achieve a more than 60% chance of limiting global average temperatures to 1.50 °C by 2050, there must be a drastic reduction in the amount of CO2 gas released into the atmosphere, from current levels to zero [2,3].
According to the International Energy Agency (IEA), global CO2 emissions increased from 20.5 billion tonnes to 31.5 billion tonnes during the years 1991 to 2020. The amount of CO2 emitted globally was estimated to be 33 billion tonnes in 2021, and the power industry remains the largest contributor to these emissions by sector. The transportation and industrial sectors also contribute significant amounts. The transportation sector represents 28.9% of the total final energy consumption across the world and 21.9% (7.245 Gt CO2) of the global CO2 emissions [4,5].
Road transportation represents the largest share of the energy consumed in the transportation sector, accounting for 75% of the total CO2 emitted. This is attributed to the combustion of fossil fuels in internal combustion engines (ICE), with gasoline and diesel dominating the fuel mix. Gasoline is used mainly in light-duty vehicles for the movement of people, while diesel is used predominantly in heavy-duty trucks for the movement of goods. With regard to the fuel mix in the United States (USA), gasoline accounts for 62% of the total transportation energy, while diesel and jet fuel contribute 24% and 10%, respectively [6].
In the European Union (EU), road transportation contributes 21% of the total CO2 emissions, with the incremental sale of diesel fuels peaking at 74% in 2016 [7]. The continuing dominance of fossil fuels in the transportation industry, coupled with incremental sales of internal combustion engines, has prompted the top energy consumers such as the United Kingdom (UK), China, the US and the EU member states to derive strict environmental standards for CO2 emissions [8,9]. The EU vehicle emission standards are generally adopted as the yardstick for measuring emissions in many countries in the OECD (Organisation for Economic Co-operation and Development) and other developed countries across the globe [10]. The EU vehicle emission standards are classified as part of a group of EU directives that include strict measures at different stages (Euro I, II, III, IV, V and VI) [11,12,13,14]. Tailpipe emissions from vehicles include carbonaceous particulate matter (PM 2.5), nitrogen oxides (NOx), Carbon monoxide (CO), CO2, hydrocarbons (THC) and some volatile compounds. The EU directive 2019/631 establishes EU-fleet CO2 emission standards for four-wheeled passenger cars and light commercial vans and vehicles (LCVs), thereby replacing previous regulations (EC) No 443/2009 and (EU) No 510/2011 [12,14,15]. In this directive, four-wheeled passenger vehicles and LCVs are restricted to 95 g CO2/km and 147 g CO2/km, respectively. The directive establishes 2021 as the baseline for achieving a 15% reduction by 2025 and 37.5% by 2030 for cars, while target reductions of 15% and 31% for the years 2025 and 2030 are also included [13].
Other countries such as China and Australia have harmonized their countries’ regulations to accommodate the EU vehicle emission standards [16]. After the Brexit transition period, the UK made slight changes to include an independent regime for CO2 pooling arrangements. This arrangement was made under the draft statutory instrument Road Vehicle Emission Performance Standards (EU Exit) Regulations 2020, while most of the EU directive 2019/631 remains applicable in the country [15].
The UK and several countries around the globe have made commitments to halt the sale of ICE vehicles between 2025 and 2040 and have resolved to build infrastructures and improve the share of hydrogen fuel cell vehicles (FCEVs), hybrid electric vehicles (HCVs) and electric vehicles (ECVs) in the transport sector [17].
The development of electromobility is measured by the level of proliferation of electric vehicles in the road transportation sector, and there are economic, social and technical factors that influence the growth rate of electric vehicles across the globe. The cost of investment, cost of electricity, infrastructure facilities for charging, local policies and the presence of an effective supply chain remain some of the major factors to consider. According to the IEA [18], the growth of electric vehicles across the globe peaked at 10 million in 2020, which represents a 43% increase over the number registered in 2019. China accounted for the largest share of the market, which is estimated to generate USD 358 billion by 2027 [19]. Europe and North America accounted for 40% of the market share in 2019, while Europe experienced the largest yearly increase of 3.2 million registered electric vehicles. Over the years, the regions of Asia-Pacific, North America and Europe have witnessed an increase in the proliferation of electric vehicles, which is related to their economic growth [20]. On the other hand, little progress has been made in the uptake of electric vehicles in developing countries due to the inability to overcome the financial, technical and political barriers [21,22].
The proliferation of FCEV technology is dependent on the technological advancement of the hydrogen gas market [23]. Hydrogen gas is an energy carrier with a high energy content, and when input into a fuel cell it generates the electricity that is required to power an FCEV. Alternatively, it can undergo combustion in hydrogen internal combustion engines (HICE), either as a single product or mixed with fossil fuels [24]. Hydrogen is advantageous because its general application contributes to the achievement of zero emissions in the transport industry. However some nitrogen oxides are emitted when it is combusted in ICE vehicles, though the NOx (nitrogen oxide) compounds can be removed through the application of selective catalytic reduction (SCR), changing the stoichiometric ratios for fuel combustion and making engine modifications [25]. On the production side, a major issue is that hydrogen does not occur naturally in nature, so its production is dependent on the utilization of fossil sources, water and biomass [26]. The hydrogen produced from fossil fuels contributes about 900 million tonnes (Mt) of CO2 emissions per year and represents about 80% of the global hydrogen production using steam reformation technology [27]. The electrolysis pathway currently produces 30 kT per year, supplying 0.03% of the total global hydrogen demand, which remained at 90 Mt in the year 2020. The electrolytic process is expensive, with the cost of production at USD 3–5.5 per kg of H2 [28]. The hydrogen obtained from the electrolysis of water using a photoelectrochemical pathway has the potential to generate zero emissions when major sustainable energy sources (e.g., wind and solar) are utilized. However, the variability and the unpredictable nature of renewable energy sources pose a major challenge for this production pathway [29]. Hydrogen obtained from biomass is recently gaining momentum as a plausible solution that balances the requirements of variability and zero emissions, which are lacking in the available sources already highlighted.

1.1. Literature Connected to This Study

Modelling of the process that involves the gasification of biomass to produce hydrogen can be carried out with the use of simulation software such as Aspen Plus, MATLAB and CHEMCAD, which save time by making it easier to perform sensitivity analyses on different parameters than in real-life or experimental studies. The major advantage of Aspen Plus is its ability to simulate different processes and conditions, using techno-economic analysis. In the gasification process, there are operating conditions and factors such as the steam-to-biomass ratio (STBR), equivalence ratio, feedstock blend and gasification temperature which are important in the optimization of the system [30].
The literature on syngas production from the gasification of biomass includes simulation and experimental studies [31,32], which examine the effect of different operating conditions on the product yield.
The effects of operating parameters on the updraft gasification of biomass were determined in this study, revealing that the best results were obtained within the range of 0.23–0.27 for the value of the equivalence ratio [32]. The effect of the gasification temperature on the biomass gasification process was also investigated in this study, revealing that increasing the gasification temperature from 700 °C to 900 °C led to an incremental increase in synthesis gas yield and a lower heating value (LHV), tar content and cold gas efficiency (CGE) [33]. Fremaux et al. [34] conducted a gasification process by including steam as the agent and revealed that the addition of steam improved the content of H2 in the syngas when the steam-to-biomass ratio was increased from 0.5 to 1.0. However, changing the steam-to-biomass ratio from 0.8 to 1 resulted in a decrease in the steam reformation reaction process, thereby affecting the yield of hydrogen. This was also evident in the study carried out on an updraft gasifier [32]. This further demonstrates that excess steam lowers the gasification temperature, thereby reducing the gas quality. In this study, the optimum steam-to-biomass ratio was selected as 0.8. Some studies have used Aspen Plus software to create a kinetic equilibrium model in a Gibbs reactor to predict the effect of the operating parameters on syngas composition [33,35,36,37,38]. Other studies focused on the modelling of tar production according to the kinetic and thermodynamic equilibrium [39,40].
Generally, the gasification process is split into four stages, including one exothermic reaction (oxidation) and three endothermic reactions (drying, pyrolysis and reduction) [41]. Syngas is the primary product obtained from the gasification process, and the overall efficiency of the system can be improved by converting the syngas to multiple products such as heat, power and biofuels [42,43,44,45,46,47]. Improving the efficiency of the system maximizes the production of syngas. Recently, some studies have used technical, environmental and economic factors to evaluate the performances of polygeneration and cogeneration systems used to optimize the production of hydrogen. Hamrang et al. [47] performed energy, exergy and economic analyses on an integrated biomass gasification system to evaluate the system performance with regard to electricity and fresh water production. Kowsari et al. [48] investigated the selection of optimal stations for the production of hydrogen, by analyzing the energy and eco-exergy attributes of the system. The results revealed that the stations which have inlet-gas mass flow rates within the range of 8–9 kg/s were preferentially selected. Hekmatshoar et al. [49] performed a thermo-economic analysis to obtain an optimal geothermal system for the production of hydrogen, where a multi-criteria decision method (TOPSIS) was used to rank the available options. The system also produced power and fresh water. Alnouss et al. [50] conducted a techno-economic and environmental analysis on different blends of waste to optimize the production of hydrogen. Technical evaluations of three gasification systems for producing power, heat and syngas were conducted in this study [45].
This study conducted a techno-environmental evaluation of sites to select the optimal sites for maximizing the production of hydrogen through the process of gasification.

1.2. Motivation for This Study

In developing countries, it is expected that the rate of waste generation will more than triple by 2050, and at this rate, the risks to the environment and the health of inhabitants are enormous, given that current waste management practices are not guided by legislation on proper use and disposal [51,52]. Therefore, this paper proposes the conversion of waste to energy, as a solution to this problem. In this paper, the thermal gasification process is detailed, and the hydrogen gas produced is optimized through the use of a post-treatment water–gas shift reaction, a CO2 absorption process and the consideration of operating parameters.

1.3. Novelty of This Work

To the best of the authors’ knowledge, this study is the first study in Nigeria that performs an analysis of different sites for the optimal production of hydrogen. In this study, hydrogen production from six sites is simulated with the use of the Aspen Plus software, and a comparative analysis of their performance under technical, environmental and economic considerations is conducted with the objective of obtaining the optimum site that can be recommended to policymakers and decision-makers. The main objectives of this work are:
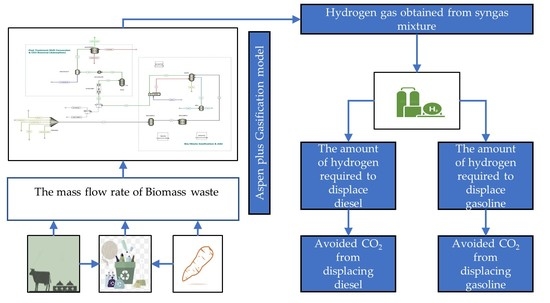
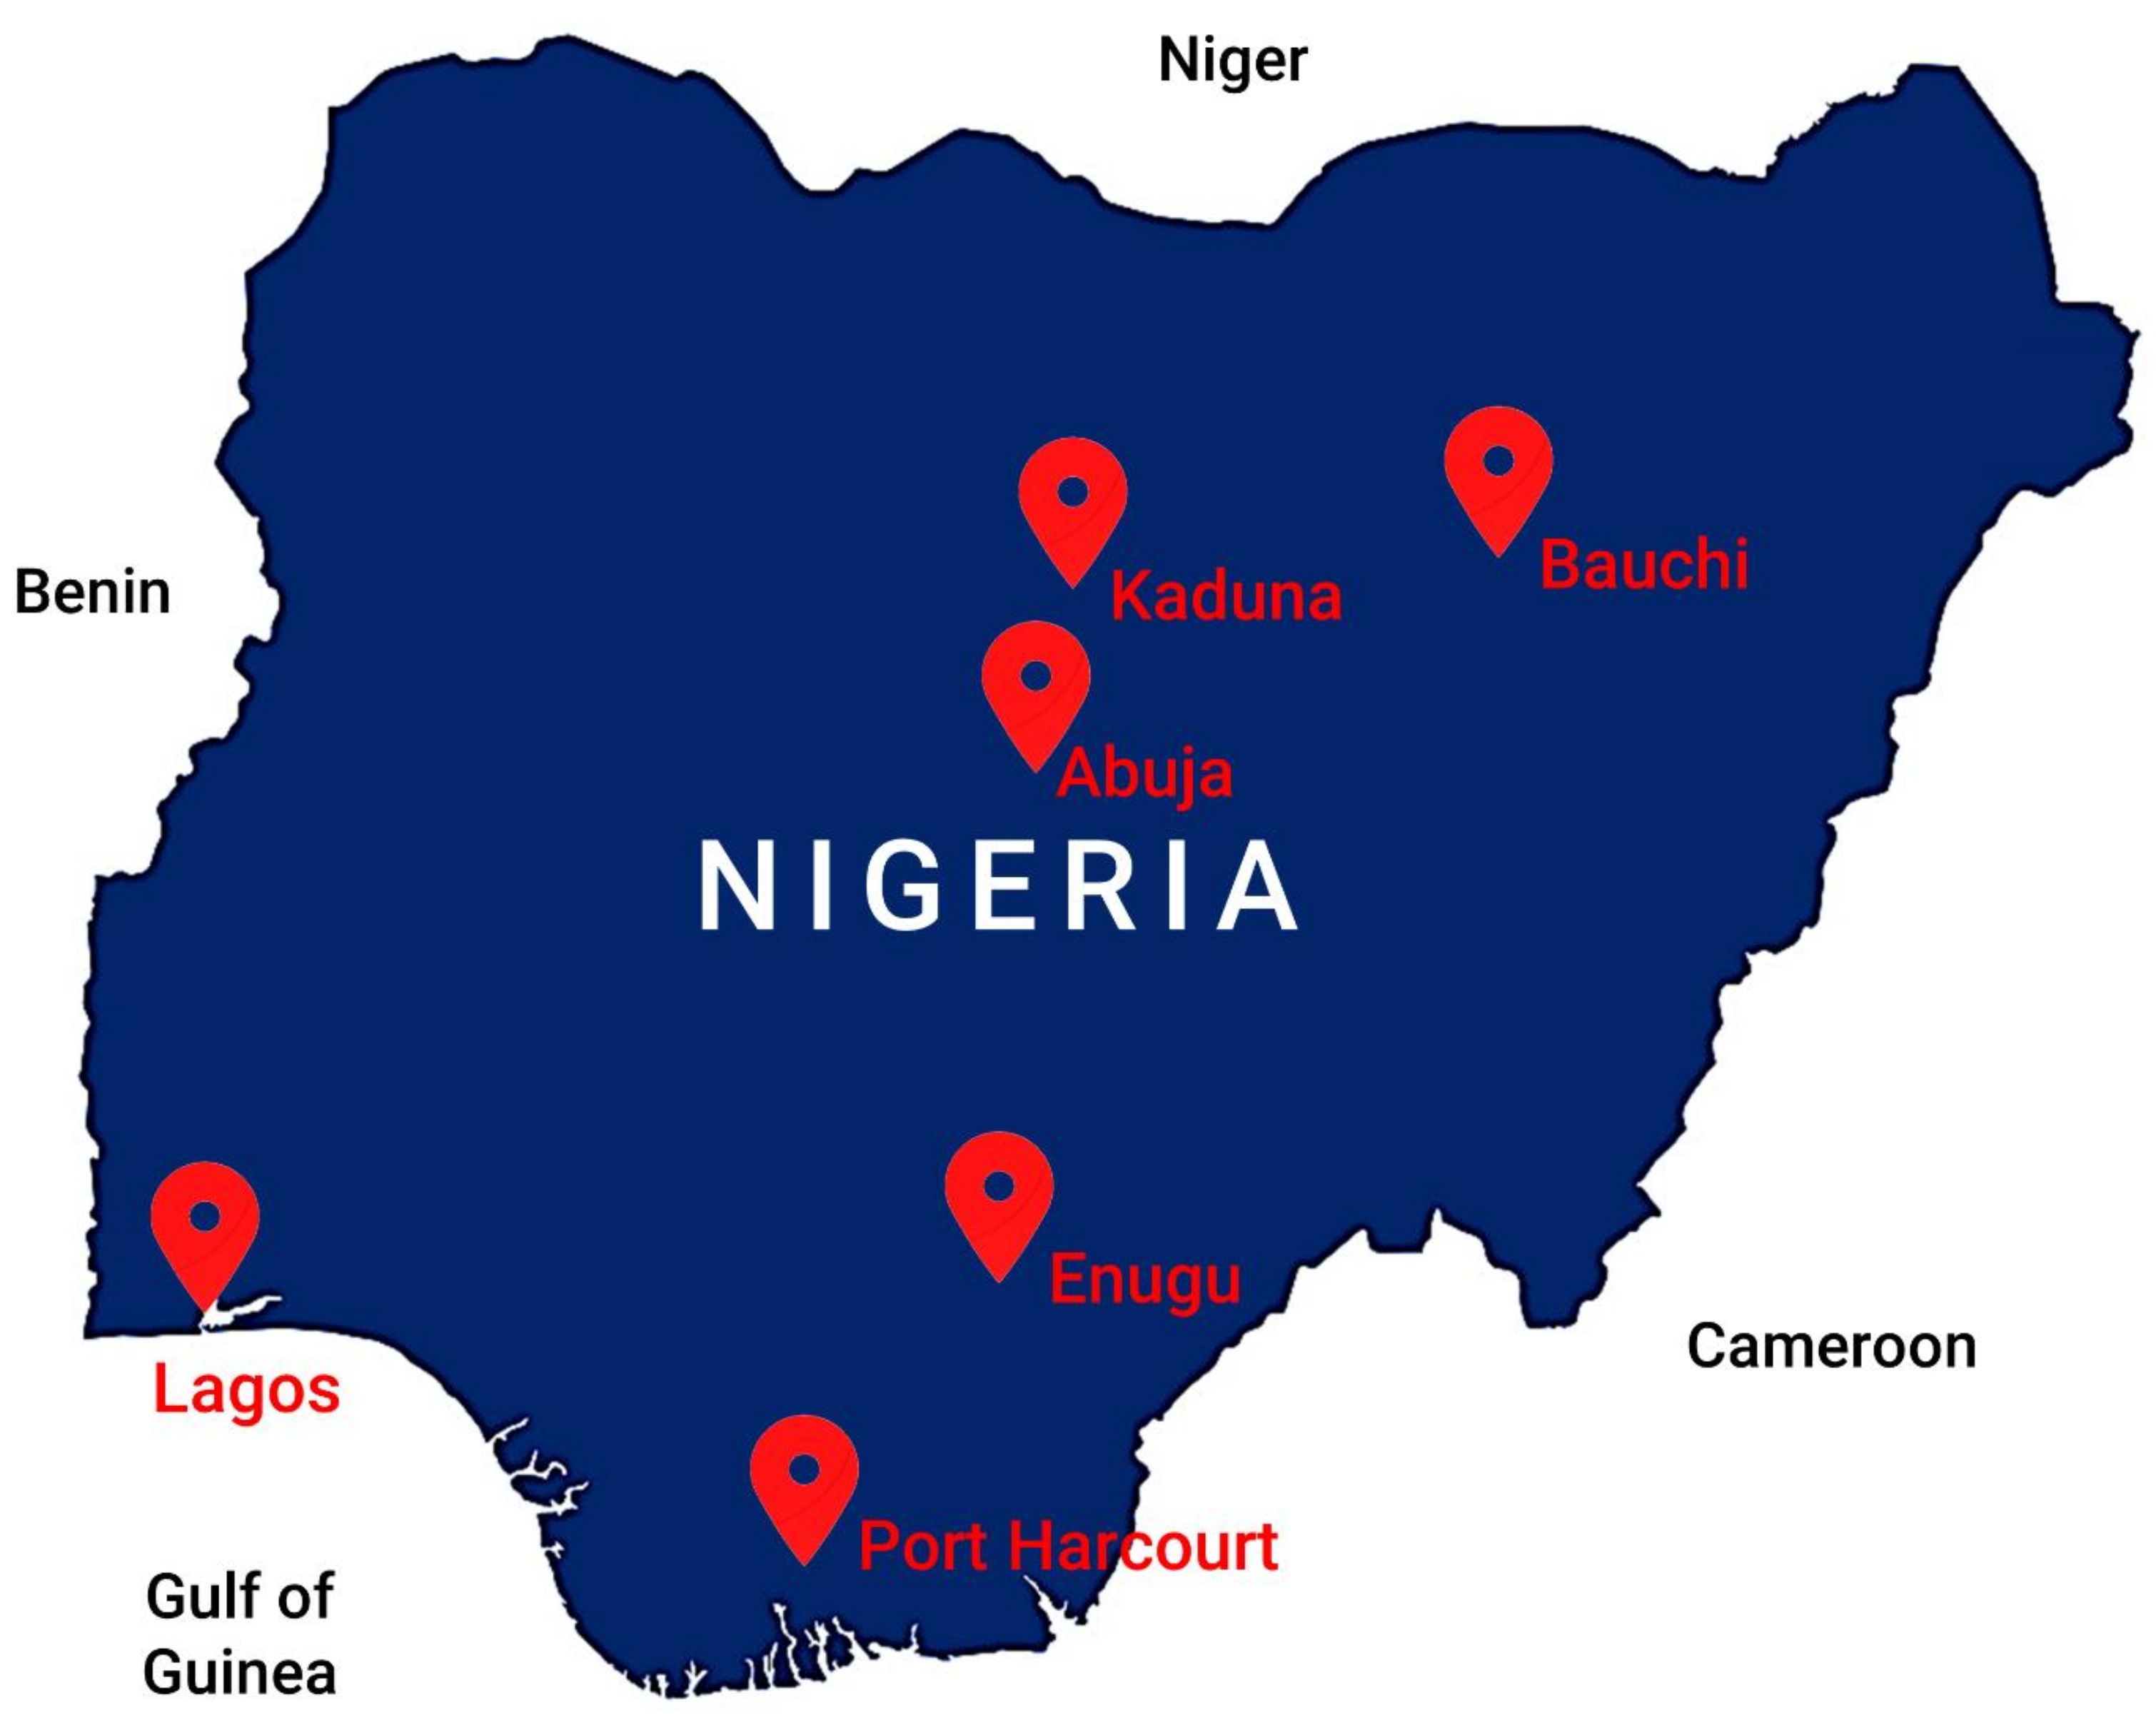
  • Simulating the biomass waste in six sites with various mass flow rates in Aspen Plus, to produce hydrogen.
  • Analysis and comparison of the different sites using technical and environmental factors.
  • Determining the effect of the optimum operating conditions on the amount of CO2 emissions from the road transport sector from the gasification process.
This study contributes to the body of knowledge on the effective utilization of waste resources to provide energy. Biomass gasification technology provides a sustainable alternative to the current practice of open burning in Nigeria. The importance of this study lies in countrywide analysis of the road transport sector, offering more insight into implementing CO2 reduction strategies in the country.
The rest of this paper is structured as follows. Section 2 presents the biomass resources in Nigeria and the study area, including a description of the vehicle fleet composition and the energy demand in the road transport sector. Section 3 describes the methodology in detail. The results are detailed and discussed in Section 4. We finally conclude in Section 5.

2. Biomass Waste to Energy for Transportation in Nigeria

Biofuel is a suitable substitute for fossil fuel consumption in the Nigerian road transport sector. When biomass feedstocks are synthesized, they can be used to produce bioethanol, biodiesel and biogas.
The biomass resource in Nigeria is estimated to be 200 million tonnes per year [53]. Biomass feedstock in Nigeria is generally obtained from agricultural resources, municipal waste, industrial waste and forest waste sources.
According to the Food and Agricultural Organization (FAO) [54], Nigeria is the world’s largest producer of cassava, producing about 60 million tonnes in 2019 [55,56]. Cassava peels are non-edible and have a high energy content of 10.61 MJ/kg, with a 50% moisture content [57]. Cassava peels contain lignocellulose, which produces ethanol when subjected to a fermentation process [58]. Nigeria produces 14 million tonnes of cassava-peel waste [59].
The majority of the biogas available as a transport fuel in Nigeria is obtained from municipal waste in landfills and anaerobically digested industrial wastewater, with the former being the most popular source for biogas production. Nigeria generates 25–45 million tonnes of solid waste in a year [60].
Biodiesel in Nigeria is mainly obtained from palm oil, which accounts for 10% of biodiesel production in the world. Nigeria is notable for being the fifth-largest producer of palm oil in the world, producing 930,000 metric tons, representing 1.5% of the global production [61,62]. Palm fatty acid is subjected to an esterification process with the addition of ethanol/methanol to produce fatty acid methyl ester, which meets the standard requirements for biodiesel.
Nigeria generates 83.01 million tons of animal waste per year, and the majority of this is obtained from cow dung and poultry litter [55].
Wood chips from sawmills contain cellulose. The Fischer–Tropsch process converts wood biomass into synthesis gas (syngas), which is used to produce synthetic crude oil via the catalytic polymerization and hydrogenation of carbon monoxide. The synthetic crude is further refined to produce various fuels used in the road transport sector. Nigeria has 2631 million metric tons of forest biomass [55]; however, considering issues of deforestation and concern for wildlife, this biomass feedstock is not a popular option.
Nigeria is Africa’s largest producer of crude oil, producing about 1,365,000 barrels daily, 75 per cent of which is consumed in the transport sector. Diesel and petrol are the major contributors to the energy demand by fuel source in the road transport sector. The Nigeria National Petroleum Corporation (NNPC) estimated the daily consumption of gasoline and diesel in the country in December 2020 to be 75.1 million L and 380 thousand L, respectively [63,64,65]. Biofuel production in the world reached about 151 billion L in 2021, though biofuels such as ethanol and biodiesel are not popular for use in vehicle transportation in Nigeria, as a result of inadequate production infrastructures and weak government policies [62].
In the year 2018, the number of vehicles in Nigeria was estimated to be 11,760,871, from the fourth-quarter report (Q4) by the National Bureau of Statistics (NBS) [66]. The fourth-quarter report estimated the vehicle-to-population ratio as (0.06), i.e., 6 vehicles per 100 persons. The vehicle composition in Nigeria is shown in Figure 1.
The cities are distributed across the geopolitical zones of the country. The locations of the selected cities are shown in Figure 2, and details are provided in Table 1. In Nigeria, there are three geopolitical zones in the northern region (the northeast, north central and northwest zones) and three geopolitical zones in the southern region (the south-south, southeast and southwest zones). The cities were selected based on their internally generated revenues (IGRs), which were validated by the NBS [66]. It is assumed in this study that vehicle ownership increases with an increase in the value of the internally generated revenues of the cities. Internally generated revenue has a positive relationship with the real gross domestic product [68].

3. Methodology

This section provides the formulas and equations used to estimate the amount of hydrogen gas produced from the different biomass feedstocks and the total CO2 vehicular emissions for each of the selected cities.

3.1. Estimating the Feedstock for Simulating the Biomass Gasification Model in Aspen Plus

Food waste, cow dung and cassava peel were chosen because of their degradability and availability in the selected cities. The feed-blend ratio was 33.3%. The food flow rate value used in the Aspen Plus software was obtained as a percentage fraction of the urban solid waste available in each of the selected cities. The amount of cow dung was estimated from the data provided by the FAO [55].

3.1.1. Calculating the Input Value of Food Waste for the Aspen Plus Model

The mathematical expression used to estimate the amount of food waste is presented below:
Food   waste ( t ) = F frac   ×   MSW ( t )   ×   F comp
where t is the production duration (from 2022 to 2037), M S W t is the quantity of urban solid waste produced in the different locations and F c o m p is the percentage of organic waste present in the urban solid waste [26].The estimation of the value is guided by parameters that include the population growth rate and by the waste generation model proposed in previous studies. F f r a c is the collection rate of urban solid waste, which was 0.74, obtained from previous studies [28,76,77]. M S W t is given by Equation (2)
MSW ( t ) = P ( t )   × W ( t ) × 365     1000   ( metric   tons / year )
where P t and W t represent the rates of population growth and the waste generation per capita at a selected reference time t, respectively, and are calculated using Equations (3) and (4)
P ( t ) = P o ( 1   +   r o ) t
W ( t ) = W o ( 1   +   r GDP ) t
where P o and W o are the initial rates for population growth and the waste generation per capita and r o and r G D P represent the population and the economic growth factor per capita for waste generation, respectively. The value of r o for Nigeria is taken as 3.2%. The value for the economic growth factor used to measure the per capita waste generated was 3.3% [26,66,78].
The cities were selected based on their internally generated revenue, which is positively linked to the real gross domestic product. The ownership of vehicles is dependent on the income variable of the residents of each city [68]. The value of F c o m p is obtained by taking the average percentage of food in municipal waste from a previous study, which was 35.82% [75,76].

3.1.2. Estimating the Amount of Cow Dung

The amount of animal waste in Nigeria is taken from previous studies as 83.01 million tons per year. There are 18.4 million head of cattle, which represents 5.78% of the total national herd of 317.8 million livestock animals. It is estimated that the northern region contains 90% of the cattle in Nigeria, and the southern region contains the remaining 10% [55].

3.1.3. Estimating the Amount of Cassava-Peel Waste

From a previous study, it is estimated that 14 million tonnes of cassava peel is produced on a yearly basis in the country [59]. In the absence of regional data on cassava-peel waste for each of the cities in this study, it was assumed that the amount of cassava-peel waste produced from each city was approximately 11.905% of the total amount generated in the country every year. There are a total of 36 municipalities/states in Nigeria, with an average of six states in each of the geopolitical regions.

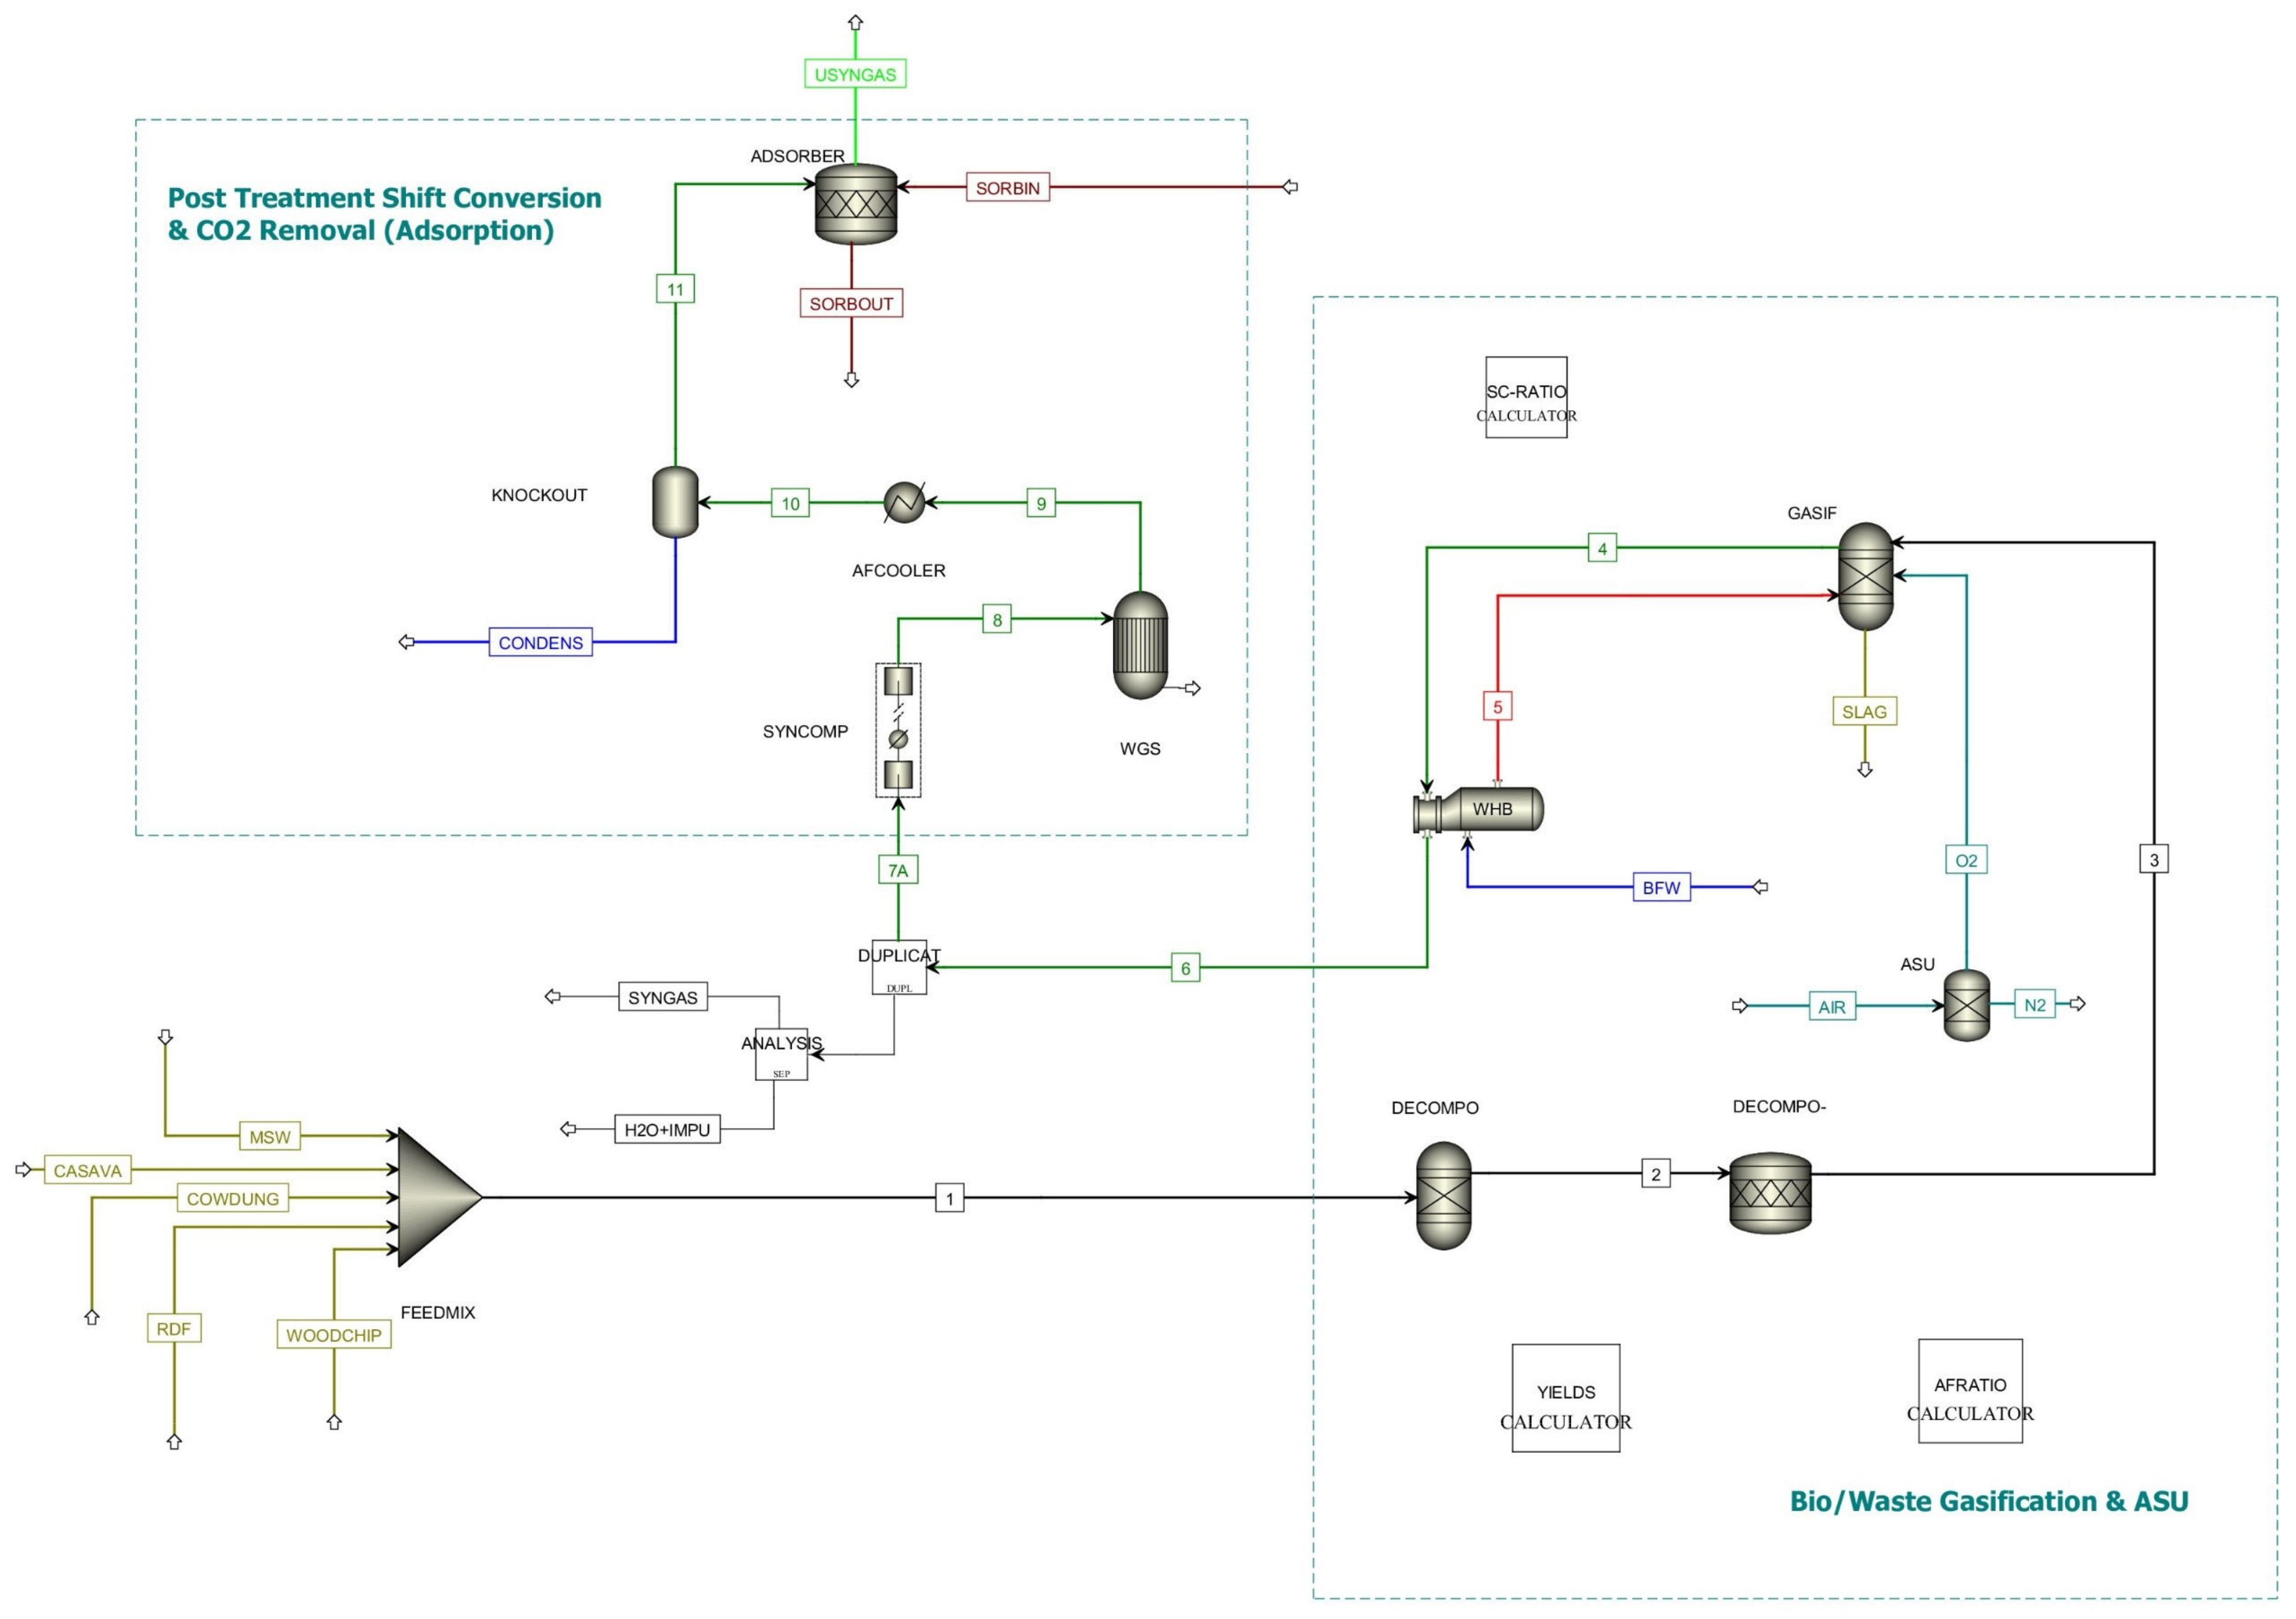
3.2. Aspen Plus Simulation and Modelling

The simulation process for hydrogen production from food waste, cow dung and cassava peel mixed feedstock is modelled in three stages: the gasification process, the water–gas shift reaction (WGS) and the CO2 removal stage. Figure 3 shows an overview of the simulation process using the Aspen Plus software. The basic Aspen Plus model was adopted from [45], with a circulating fluidized-bed gasifier (CFBG) as the gasifier type, while the simulation methodology was adopted from [50]. Other process details for hydrogen production plants were taken from [77]. This simulation adds a WGS section to upgrade the syngas formed and maximize the production of H2. The minimum recommended temperature (230 °C) was selected for the WGS to maximize the production of H2, since it is an exothermic reaction. The use of fixed-bed sorbents for CO2 removal is explained in [79]. The global property package for this model was PR-BM [80]. For the optimum case, the steam-to-biomass ratio (STBR) was selected as 0.8 [34,81], while the equivalence ratio was selected as 0.1 [45]. The input specifications and the functions of the equipment (or block) are summarized in Table 2. The proximate and ultimate analyses (see Table 3) were performed with thermodynamic conditions of 1 bar and 25 °C, and the respective mass flow rates were input to the streams for cassava peel, cow dung and MSW.

3.3. Estimating the Vehicle Stock

The COPERT (computer program to calculate emissions from road transport) methodology is the EU standard vehicle emissions calculator, which is consistent with the 2006 IPCC guidelines for the calculation of greenhouse gases [13]. Tailpipe emissions from different vehicle categories, including four-wheeled passenger vehicles, light commercial vans and pickups and heavy-duty trucks, are measured using a standardized method. CO2 and other pollutants in the tailpipes of vehicles (CO, NOx, CH4, NMVOCs and N2O) are measured using certain parameters. Parameters such as the stock of vehicles, the vehicle type, the vehicular mileage or activity rate (in km), the emissions factor (kg/amount of activity) and the fuel economy in L/100 km (km/L) are generally used to estimate tailpipe emissions from fossil fuel consumption.
In the absence of statistical data for the stock of vehicles in Nigeria, it is assumed that the stock of vehicles is the total number of vehicles registered in the road transport sector [85], for the year 2018. The number of vehicles was estimated to be 11,760,871, and with a population of 198,000,000 people, that implies 6 vehicles per 100 persons (a vehicle per person ratio of 0.06) [66].

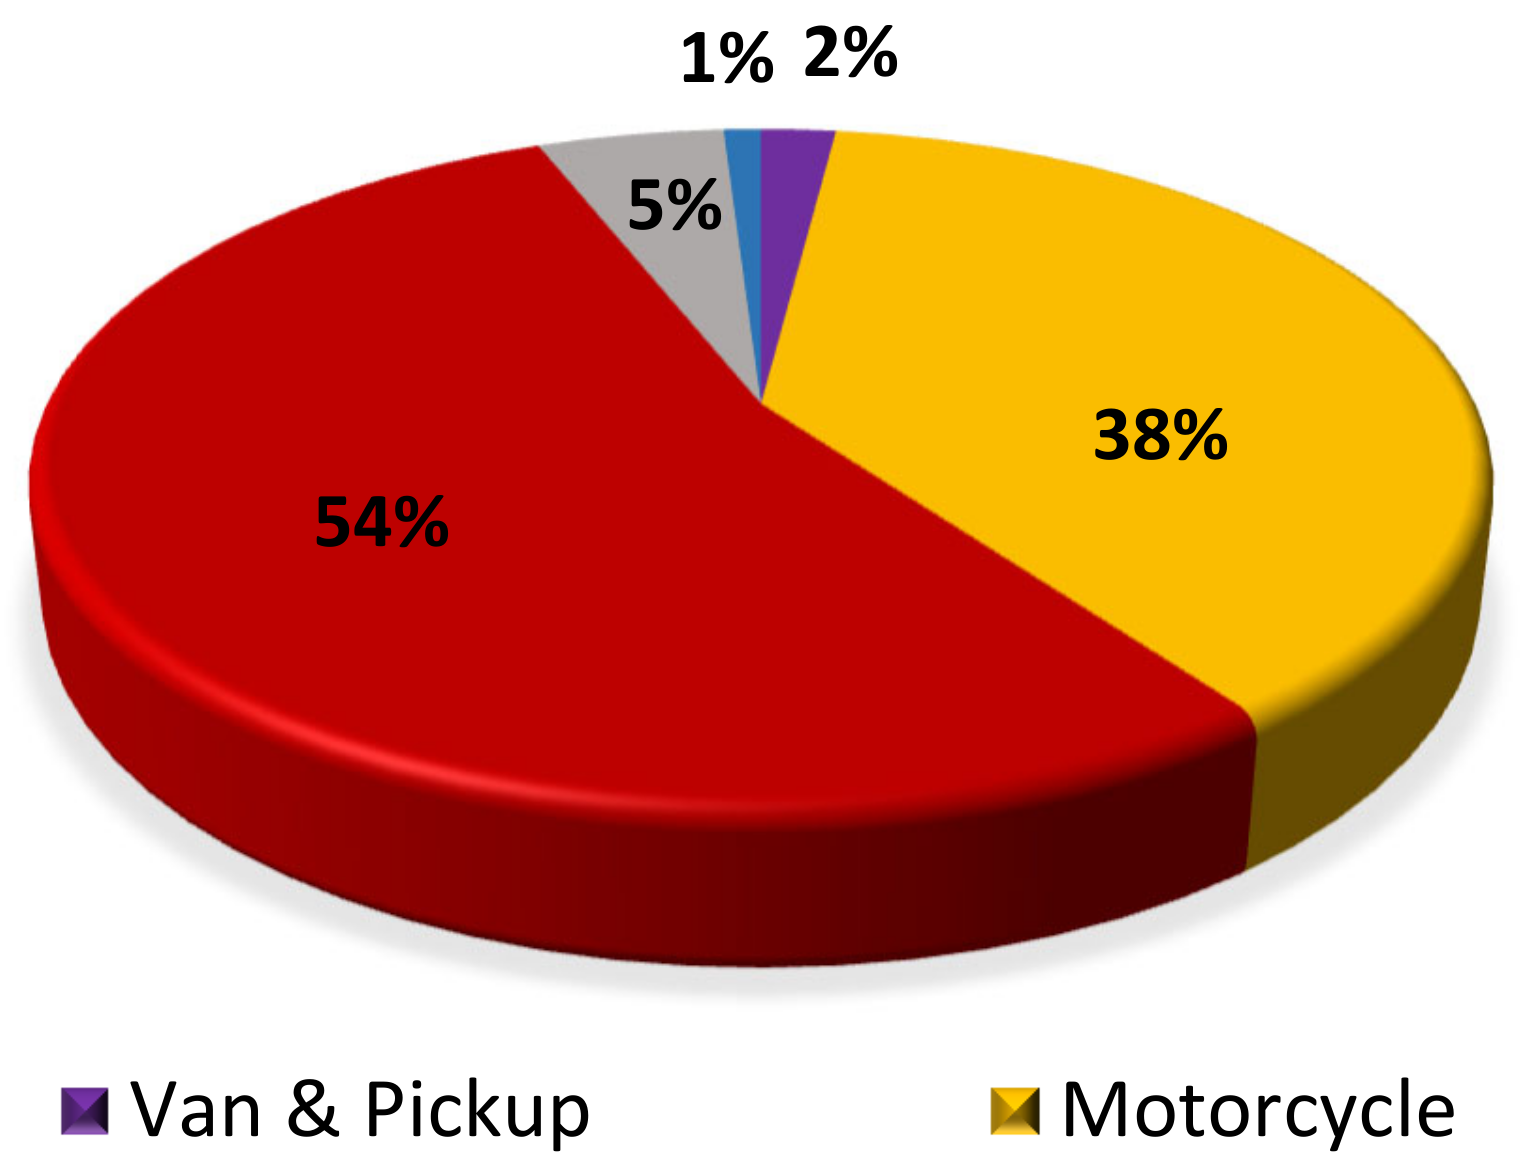
3.4. Vehicle Fleet Composition

The vehicle composition was taken from the World Bank report on the analysis of four sectors of the Nigerian economy [67]. The report estimated the vehicle fleet composition in Nigeria using the COPERT methodology. The disaggregated vehicle fleet in Figure 1 was used to derive the vehicle composition and fuel consumed in the road transport sector, as shown in Table 4.

3.5. Estimating the Amount of Gasoline Consumed

In the absence of historical data on fuel consumption by vehicles in the Nigerian road transport sector, the amount of gasoline consumed for the six cities in this study was estimated using Equation (7). The vehicle “stock” for each of the selected cities is represented as the number of vehicle owners (v), which is obtained from Table 1. The vehicle per population ratio of 6 cars per 100 persons was used to estimate the number of vehicle owners in the selected cities. Using the COPERT methodology, the fuel consumption was obtained from the estimates of the activity level and vehicle fleet composition. From Table 4, 99% of cars, 85% of buses and 100% of motorcycles consumed gasoline. The NNPC estimated the daily consumption of gasoline in the country to be 75.1 million L in December 2020, which amounts to 27.3 billion L per year [63,64,65].
Fuel   consumption = stock   ×   annual   mileage   ×   fuel   economy

3.6. Estimating the Amount of Diesel Consumed

Table 4 shows that 100% of heavy-duty trucks, 25% of vans and 50% of cars were the major contributors to diesel consumption. Similarly, by applying Equation (7), the amount of diesel consumed annually was obtained. According to the end of year report from the Nigeria National Petroleum Corporation, the daily consumption of diesel was 380 thousand L in December 2020, which amounts to 137 million L per year [63,64].

3.7. Calculating the CO2 Emissions

CO2 emissions regulations in Nigeria are applied under Euro 2 and Euro 3 emissions standards [67]. Euro 2 standards came into effect with the national policy on emissions in 2011; however, Euro 3 standards are yet to be implemented [85]. Nigeria imports most of its vehicles from western countries such as the United States and Europe [67]. The implication is that the estimation of the CO2 emissions from vehicles in Nigeria is carried out based on a harmonized methodology with emissions estimates from vehicles in the United States and Europe, utilized as stipulated under the IPCC guidelines. In the absence of a national methodology approach for estimating emissions in the road transport sector, the tailpipe CO2 emissions are estimated from the total amount of fuel consumed. The emission factors for diesel and petrol are estimated from the methodology applied by USEPA (United States Environmental Protection Agency) [86]. CO2 emissions factors (VEF) for gasoline and diesel consumption were 8887 g CO2/gallon and 10,180 g CO2/gallon, respectively. Applying Equation (8), the CO2 emissions per km are obtained by dividing the estimated emissions factor by the fuel economy of the different vehicle types, as provided in Table 4.
D = VEF Fuel   economy   ×   Stock   of   vehicles
where D is the CO2 emissions per km, VEF is the vehicle emissions factor for diesel and gasoline and the stock of vehicles is the number of registered vehicles in the year 2018 in Nigeria [85].

3.8. Estimating the Amount of Hydrogen Gas That Can Serve as a Substitute for an Equivalent Amount of Gasoline and Diesel Consumption in the Road Transport Sector

In the transport system, hydrogen can be used directly in HICE vehicles as an energy carrier and for the provision of electricity in FCEVs. The energy conversion pathway involves the transfer of heat energy to mechanical energy in internal combustion engines. Generally, the density of liquid hydrogen at normal boiling point and 1 atm is 70.8 kg/m3 [87]. At this density, hydrogen can provide almost three times the amount of energy as 1 L of gasoline. The lower heating values for hydrogen and gasoline are 120 MJ/kg and 44 MJ/kg, respectively. This also equates to 1 kg of hydrogen giving an amount of energy equivalent to 1 US gallon of gasoline (2.84 kg) [88]. However, when hydrogen is combusted in internal combustion engines or used as an energy carrier in fuel cell vehicles, it must be compressed and stored at about 700 bar, to increase its energy and storage density [89]. At 700 bar, it has a density of 42 kg/m3 and is capable of replacing an equivalent amount of gasoline and diesel. This study adopts the density of compressed hydrogen when carrying out the analysis for fuel substitution. The amount of hydrogen available to serve as a substitute for diesel fuel and gasoline is determined from the lower heating value of diesel and gasoline with respect to hydrogen gas and is represented in the following equations:
V diesel = V H 2   ×   LHV H 2   ×   ƞ hce   ×   ρ H 2   LHV diesel   ×   ƞ de × ρ diesel
V gasoline = V H 2   ×   LHV H 2   ×   ƞ hce   ×   ρ H 2 LHV gasoline   ×   ƞ ge × ρ gasoline
where ƞ h c e is the efficiency of hydrogen in an internal combustion engine [90] and ƞ d e , ƞ g e are the efficiencies of diesel and gasoline in combustion engines, which are 40%, 35% and 30%, respectively [26,89,90,91]. The lower heating values and densities of hydrogen, diesel and gasoline, L H V H 2 ,   L H V d i e s e l , L H V g a s o l i n e ρ H 2 , ρ d i e s e l and ρ g a s o l i n e are taken as 120 MJ per kg, 42.5 MJ per kg, 44.5 MJ per kg, 0.042 kg per L, 0.83 kg per L and 0.75 kg per L, respectively [92,93].

3.9. Calculating the Amount of Avoided CO2 Emissions

When utilized, hydrogen releases no harmful emissions; therefore, the amount of CO2 emissions per year that could be avoided by using hydrogen in combustion engines rather than diesel or gasoline fuels is given in Equation (9).
CO 2 avoided = V f   ×   VEF
where Vf is the volume of gasoline or diesel and value of the vehicular emission factor (VEF) is taken as 8887 g CO2/gallon and 10,180 g CO2/gallon for gasoline and diesel, respectively [13].

4. Results and Discussion

The results of the road sector analysis, the process of biomass gasification and the environmental analysis of CO2 emissions are discussed in this section.

4.1. The Estimated Flow Rates Used in the Aspen Plus Model

With a feed ratio of 33.3%, the estimated flow rates for the mixed blend of cassava peel, cow dung and food waste from MSW are shown in Table 5.

4.2. Validating the Results of the Aspen Plus Model

Previous studies [45,50,80] did not include the upgrading of syngas by the water-gas shift reaction in their results. Hence, the model was validated for the syngas content before the shift conversion. The feedstocks used were refuse-derived fuel (RDF) and wood chips, as in the previous studies. A summary is given in Table 6. The heating values for syngas were calculated from the composition and gas component heating values available online [93].

4.3. Sensitivity Analysis

The effect of the operating parameters on the amount of hydrogen produced in the gasification process is examined in this section. The three main parameters were the gasifier temperature, the steam to biomass ratio and the equivalence ratio. The influence of the selected variables on the amount of CO2 reduction in the road transport sector was also determined. A change in these parameters resulted in the production of different volumes of hydrogen, which consequently affects the amount of CO2 released from the displacement of an equivalent amount of diesel and gasoline. In this study, a sensitivity analysis was carried out on the results for the location with the highest amount of hydrogen production, to examine the effect of the operating parameters. Kaduna had the highest amount of hydrogen production, and it represents the results that can be obtained from the other locations. Figure 4, shows the production potential of the six different locations. The positive correlation between the volume of hydrogen produced and the volume of diesel and gasoline displaced is shown in Figure 5, for a gasification temperature range of 750 °C to 900 °C.

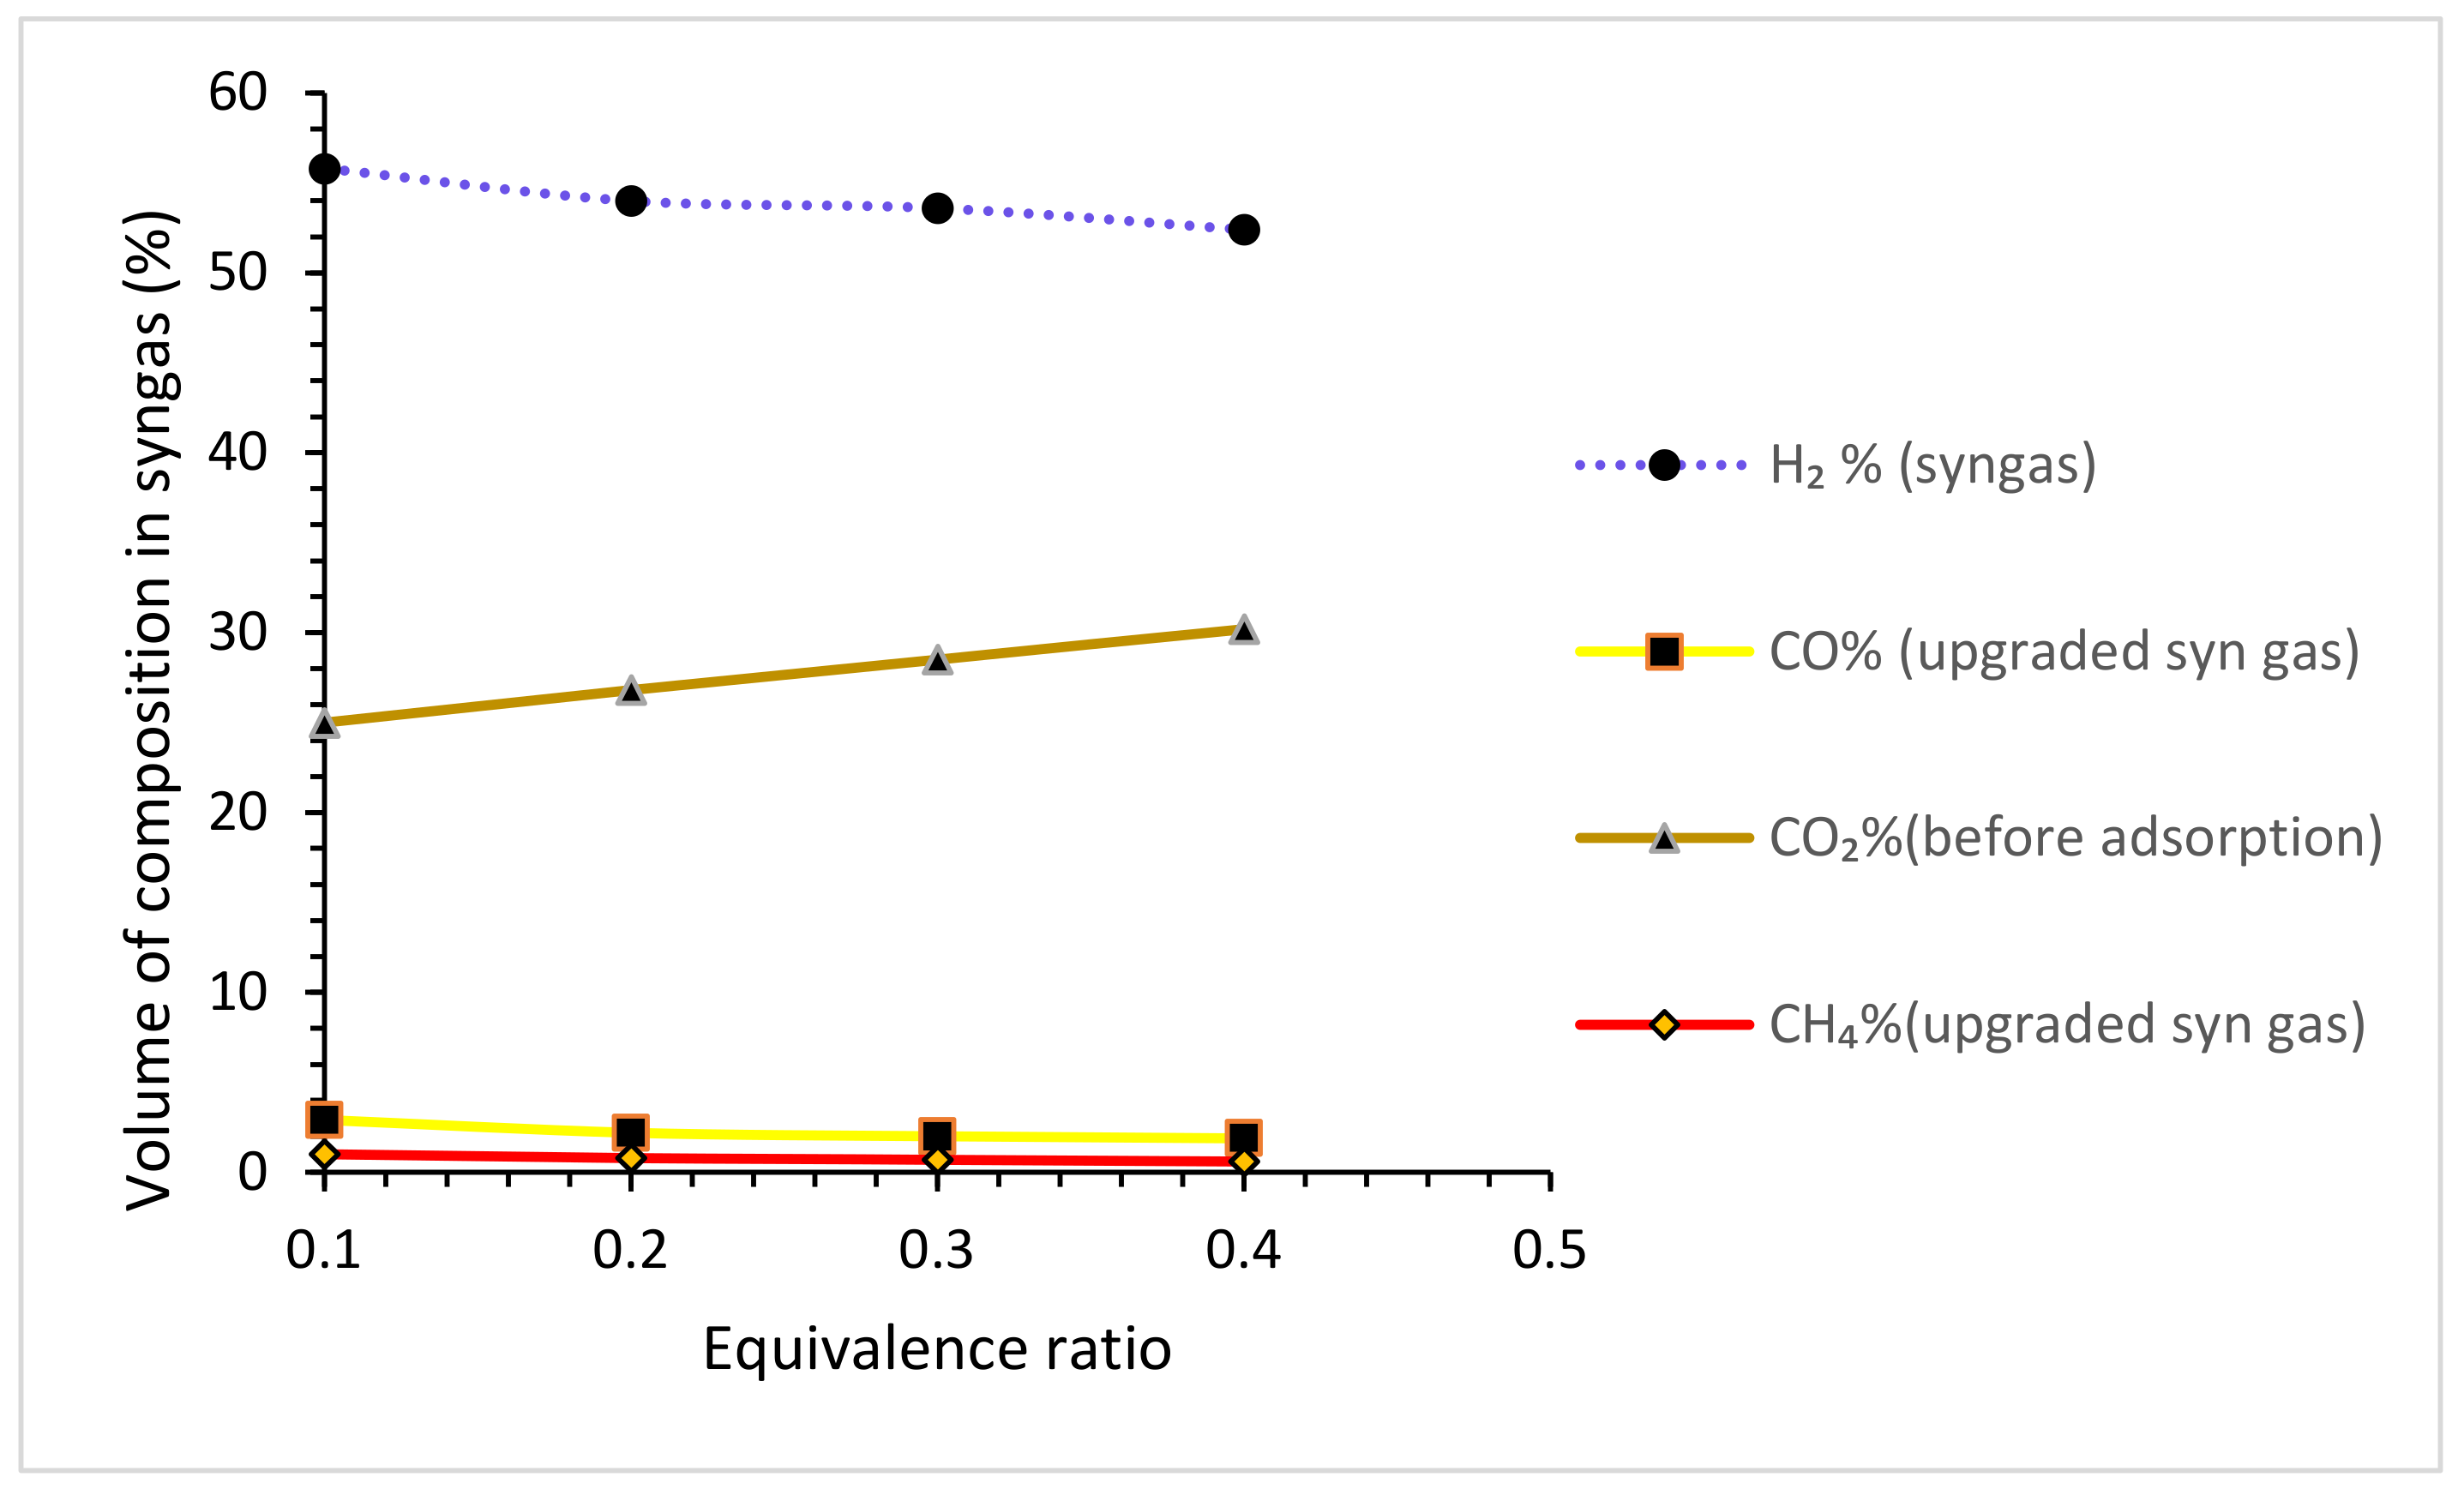
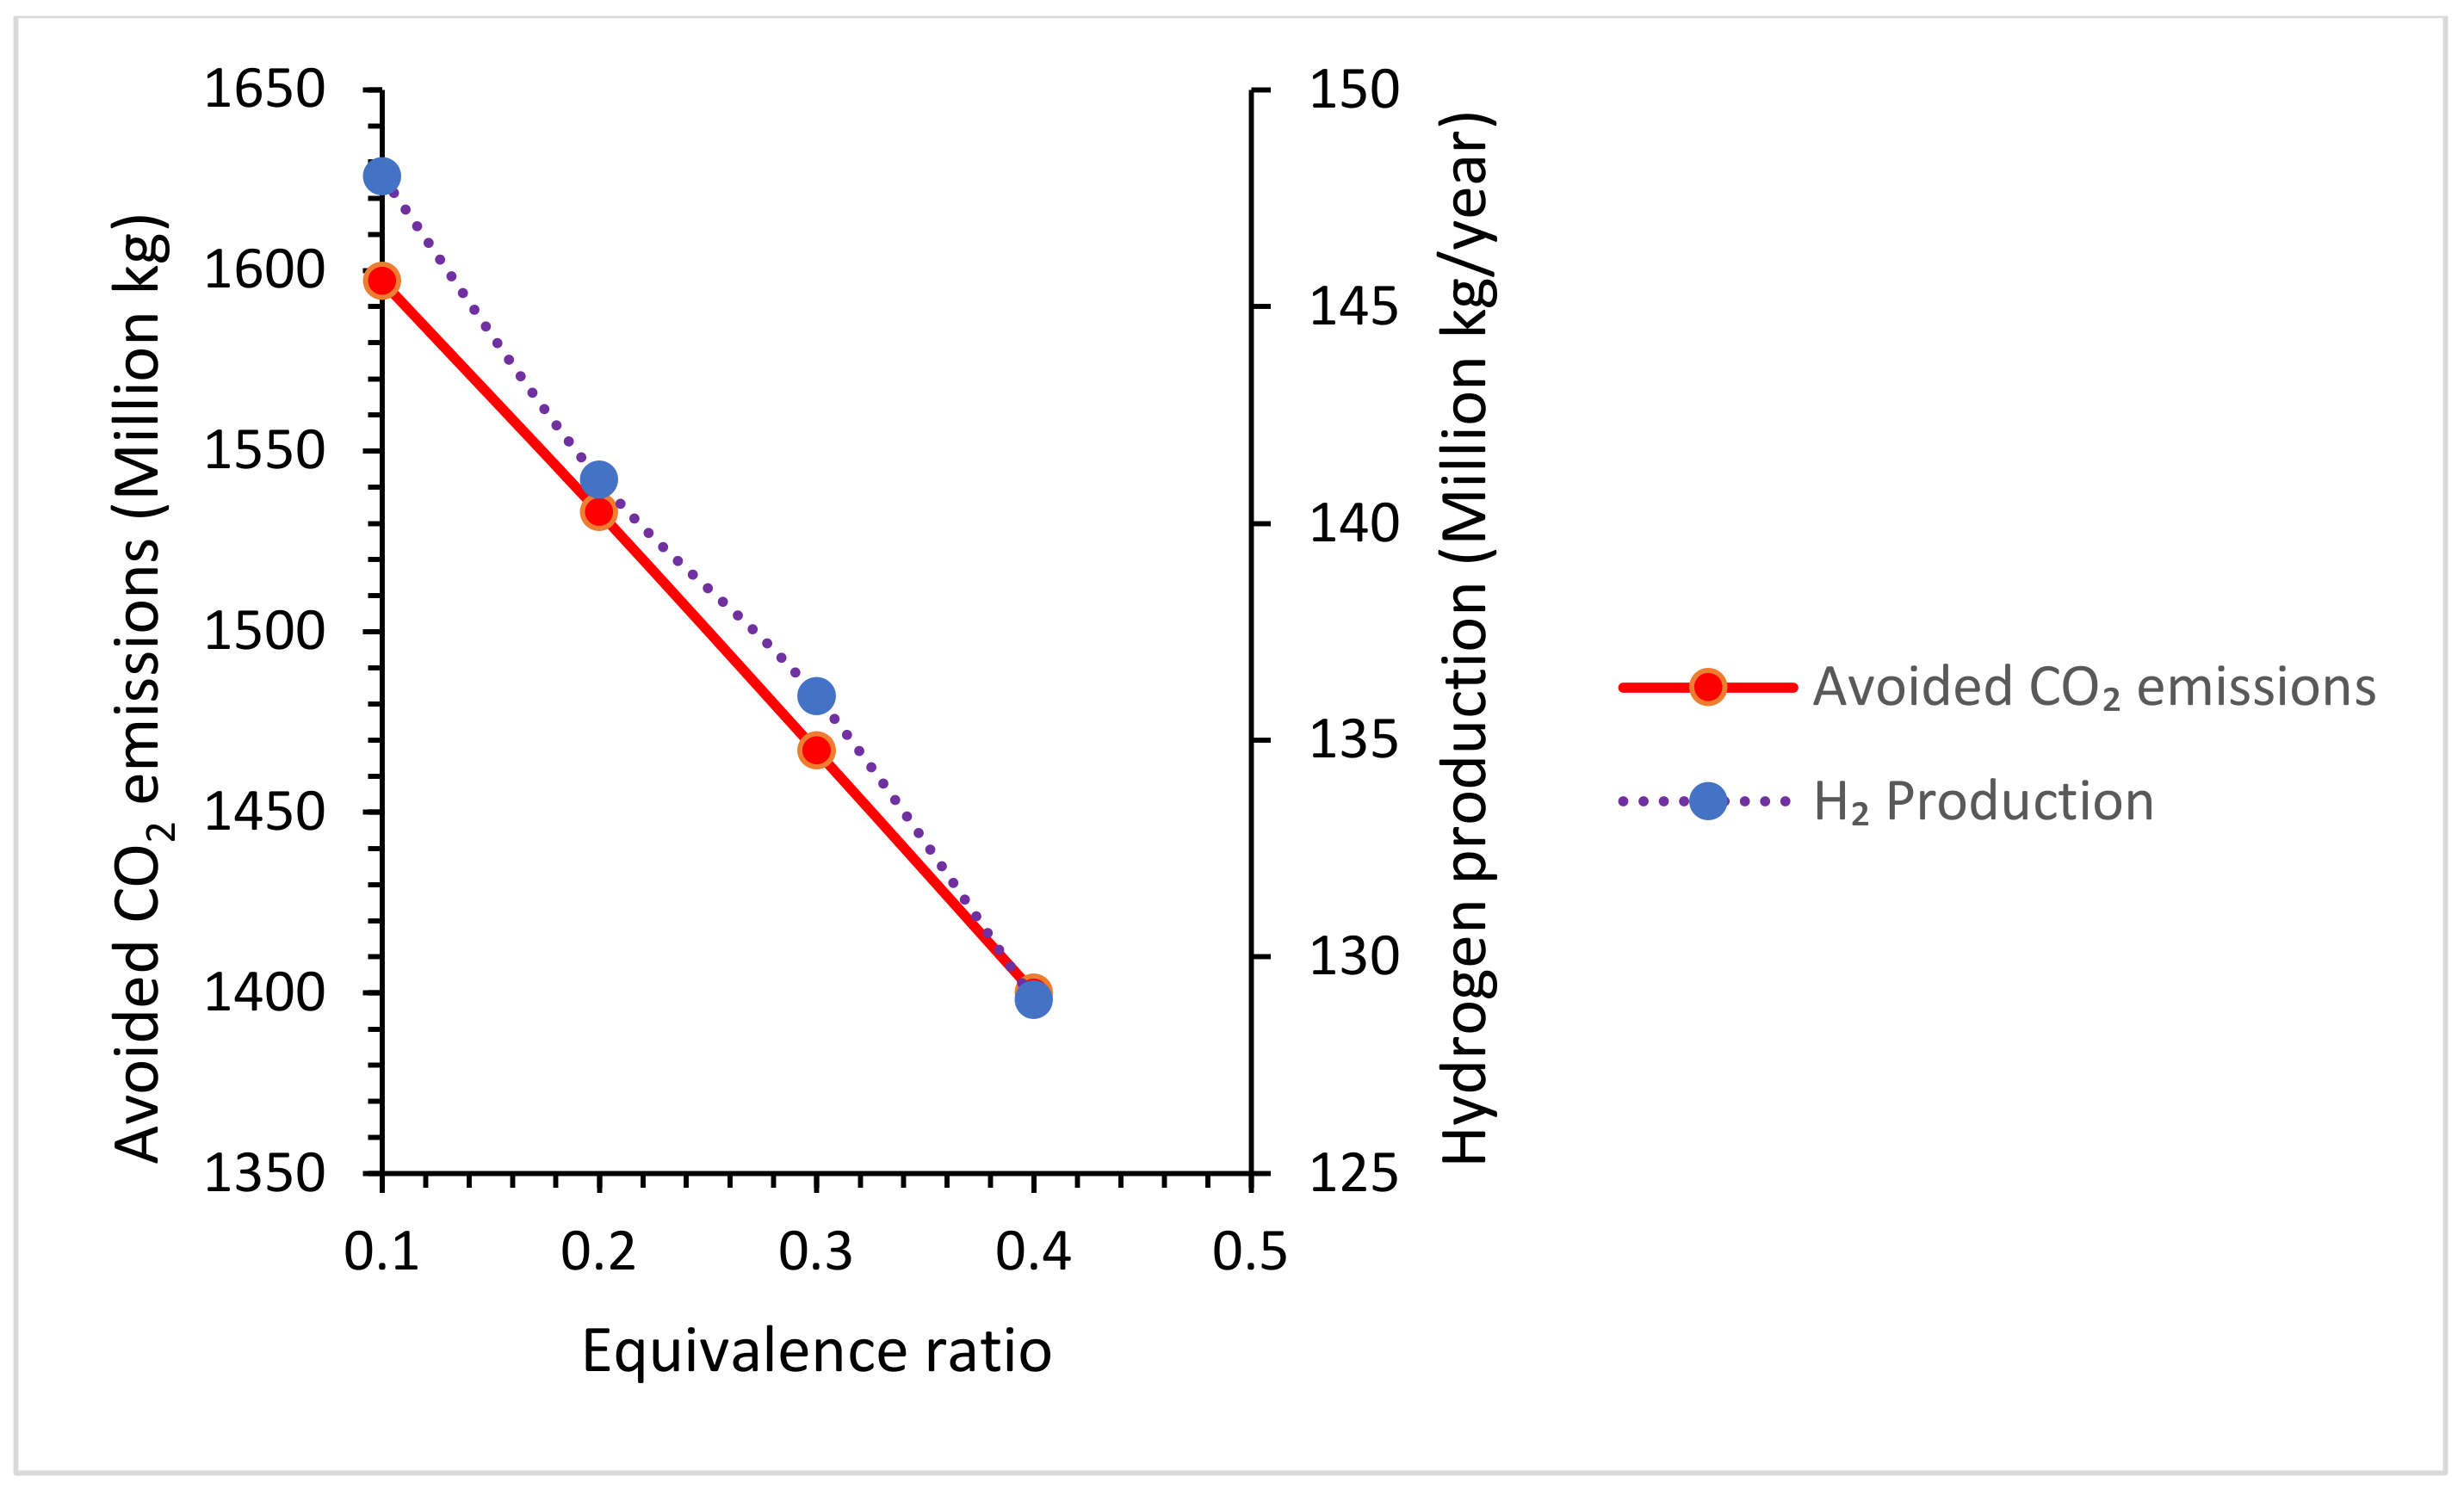
4.3.1. The Equivalence Ratio

The volumetric composition of hydrogen in the synthesis gas mixture was reduced by 6.1% when the equivalence ratio was varied from 0.1 to 0.4, as shown in Figure 6, while the CO2 composition in the syngas increased significantly by 20.8%. The increase in equivalence ratio improved the conversion of the combustible syngas products (CO, H2 and CH4) to CO2, thereby reducing their amounts in the reactions. The increase in equivalence ratio reduced the amount of CO2 emissions that could be avoided, due to a reduction in the volume of hydrogen produced from the location. The production flow rate of hydrogen was reduced from 148 million kg to 129 million kg, as shown in Figure 7. The percentage reduction in the amount of avoided CO2 emissions was about 12.5%.

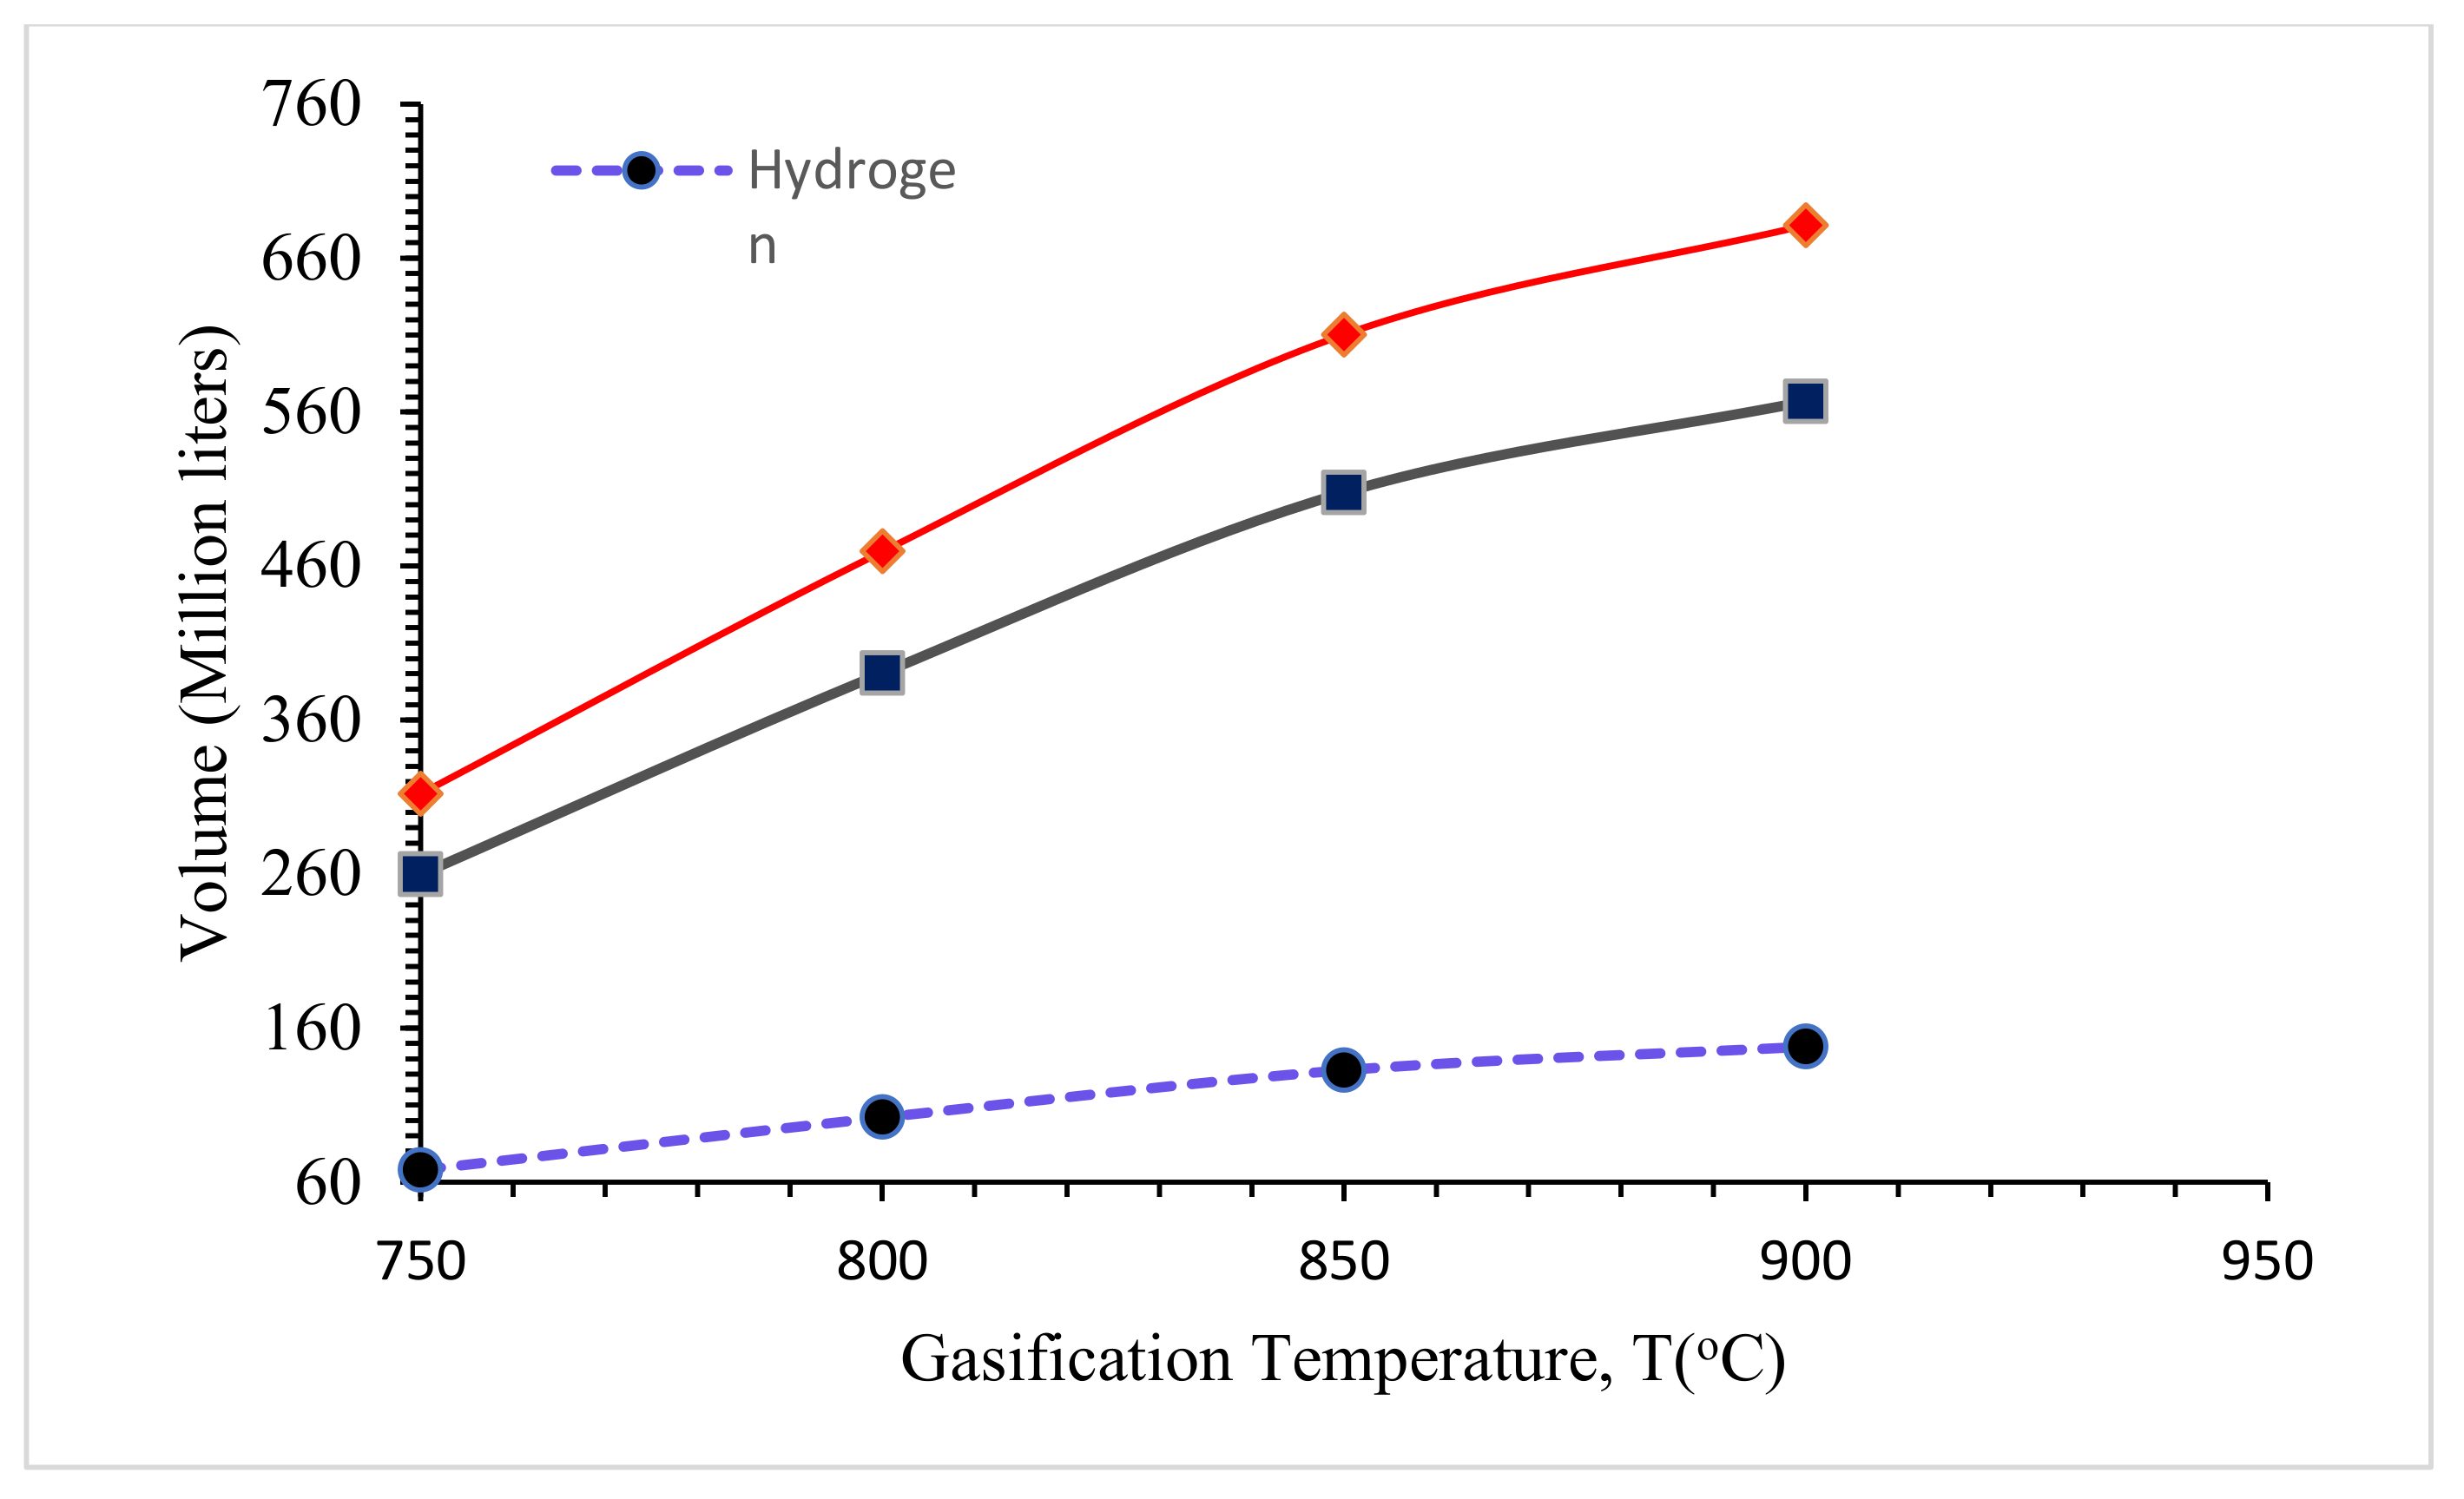
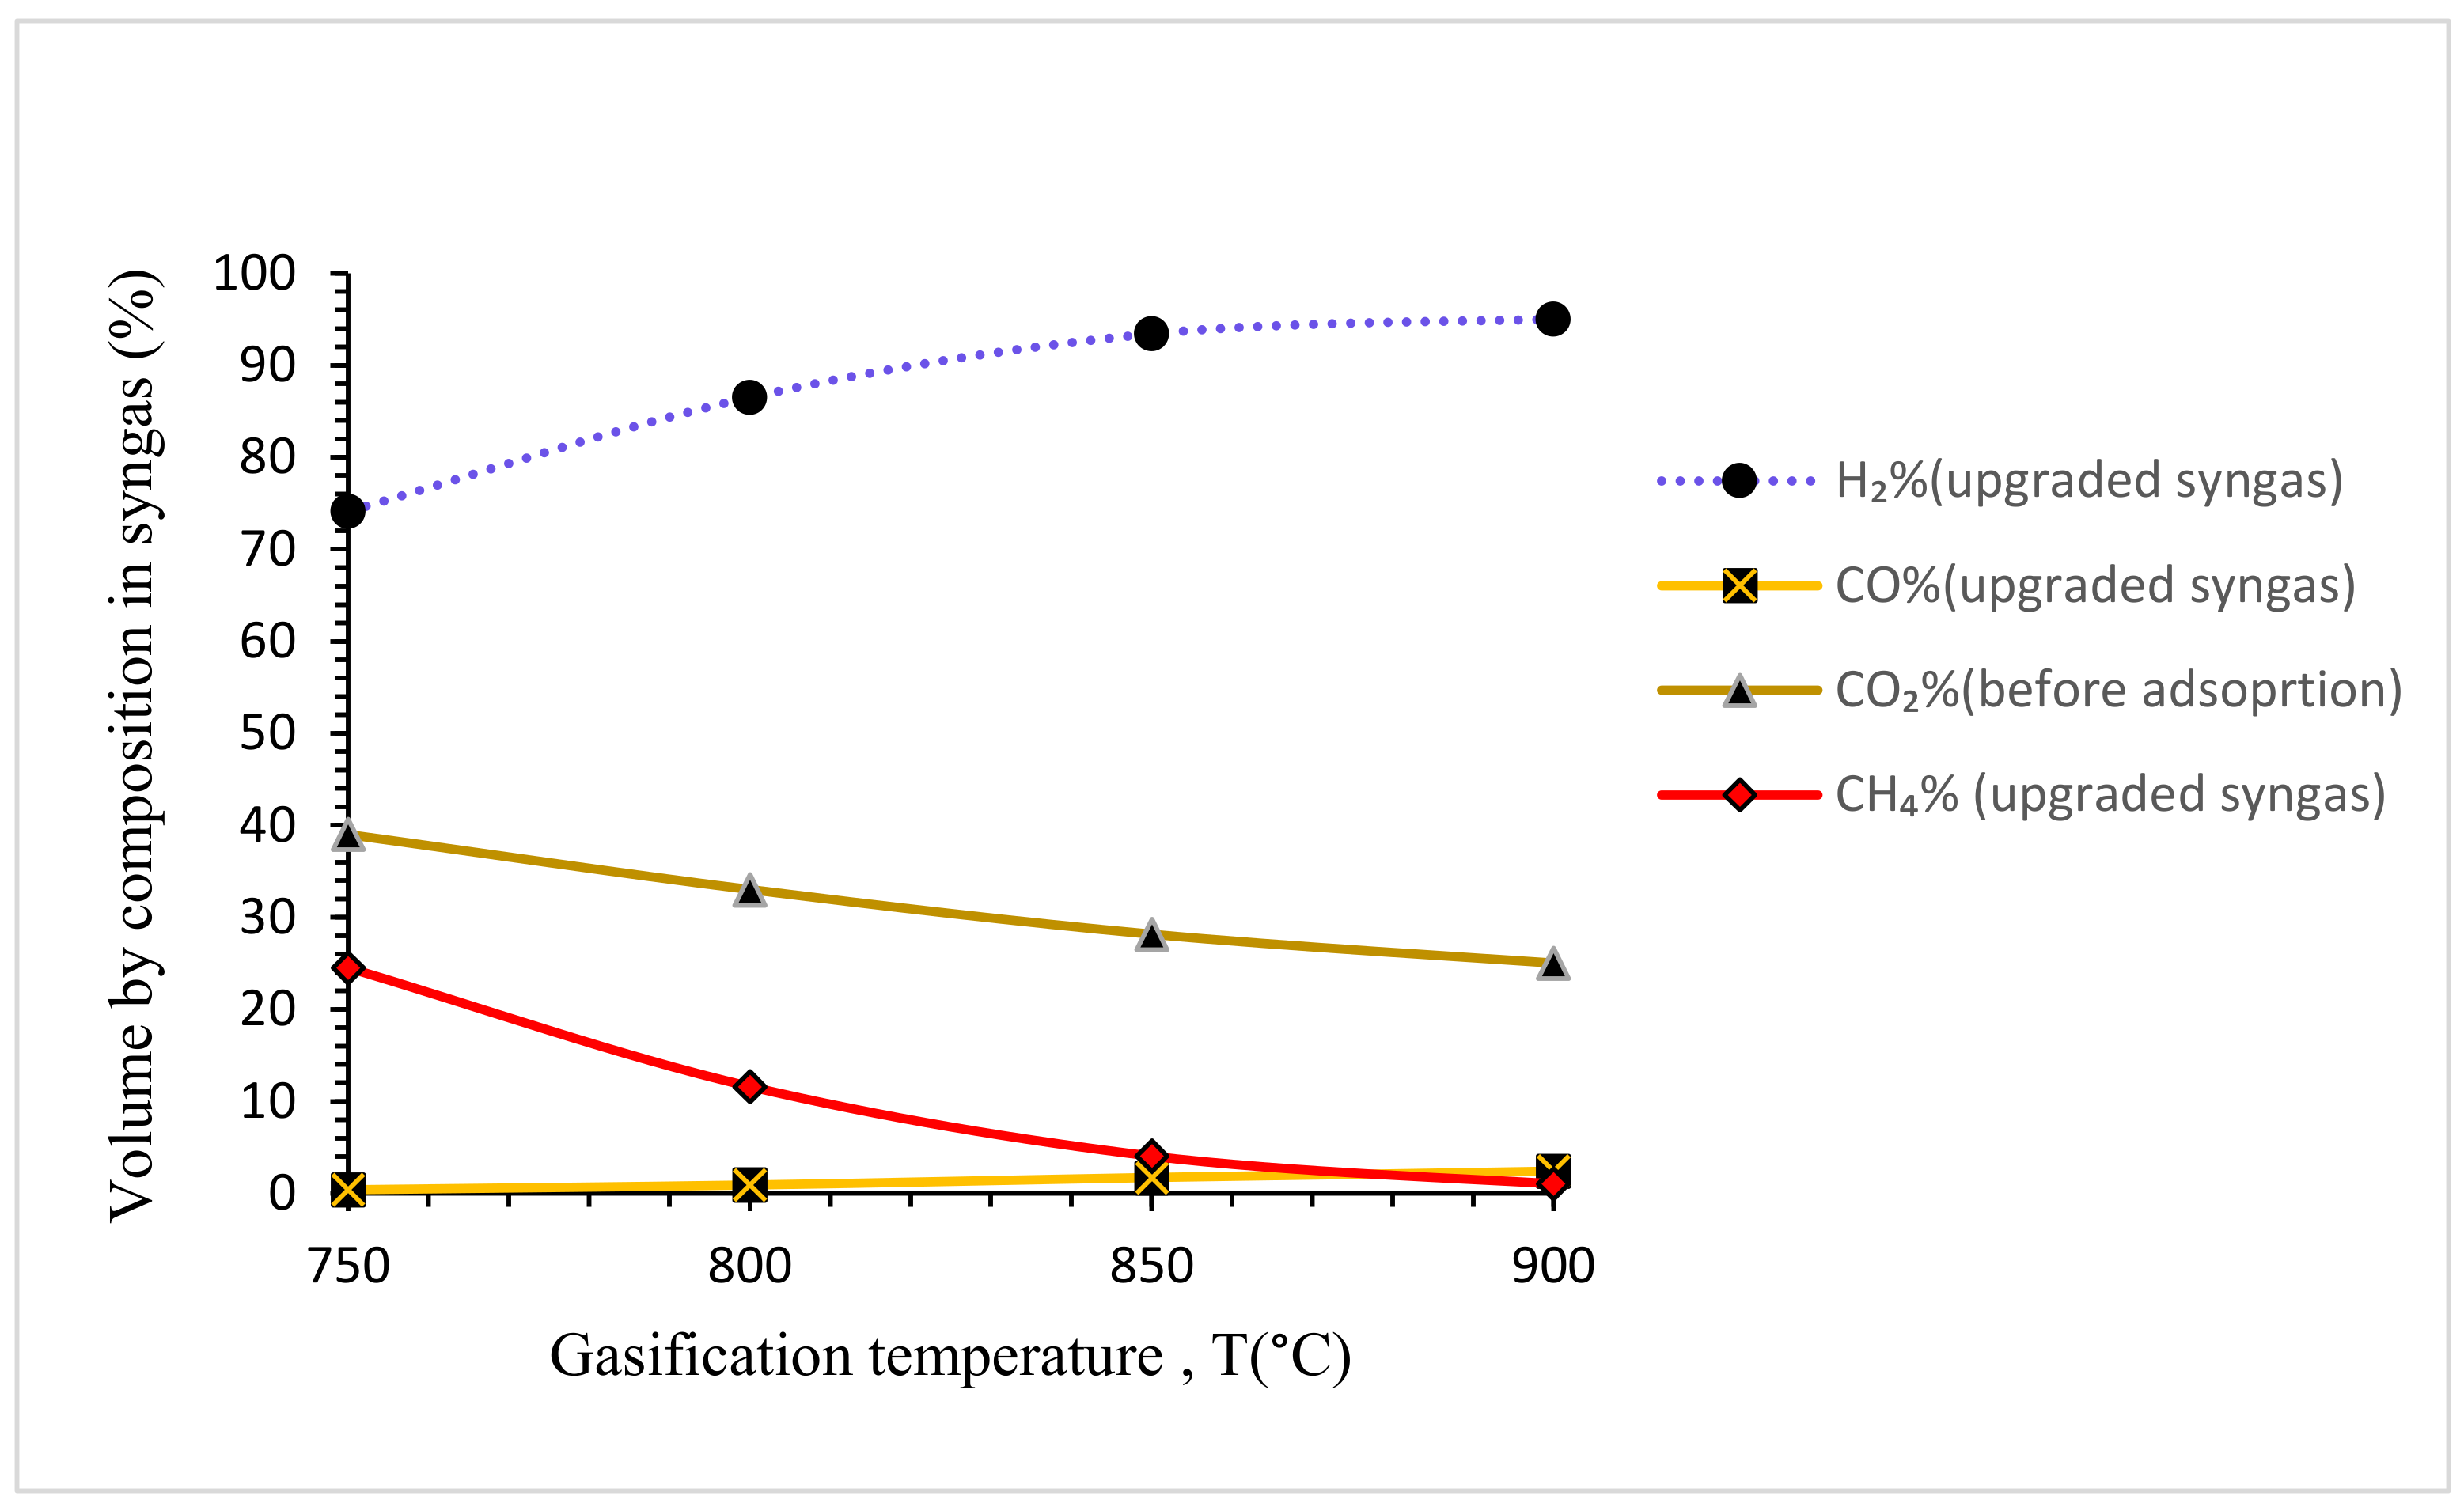
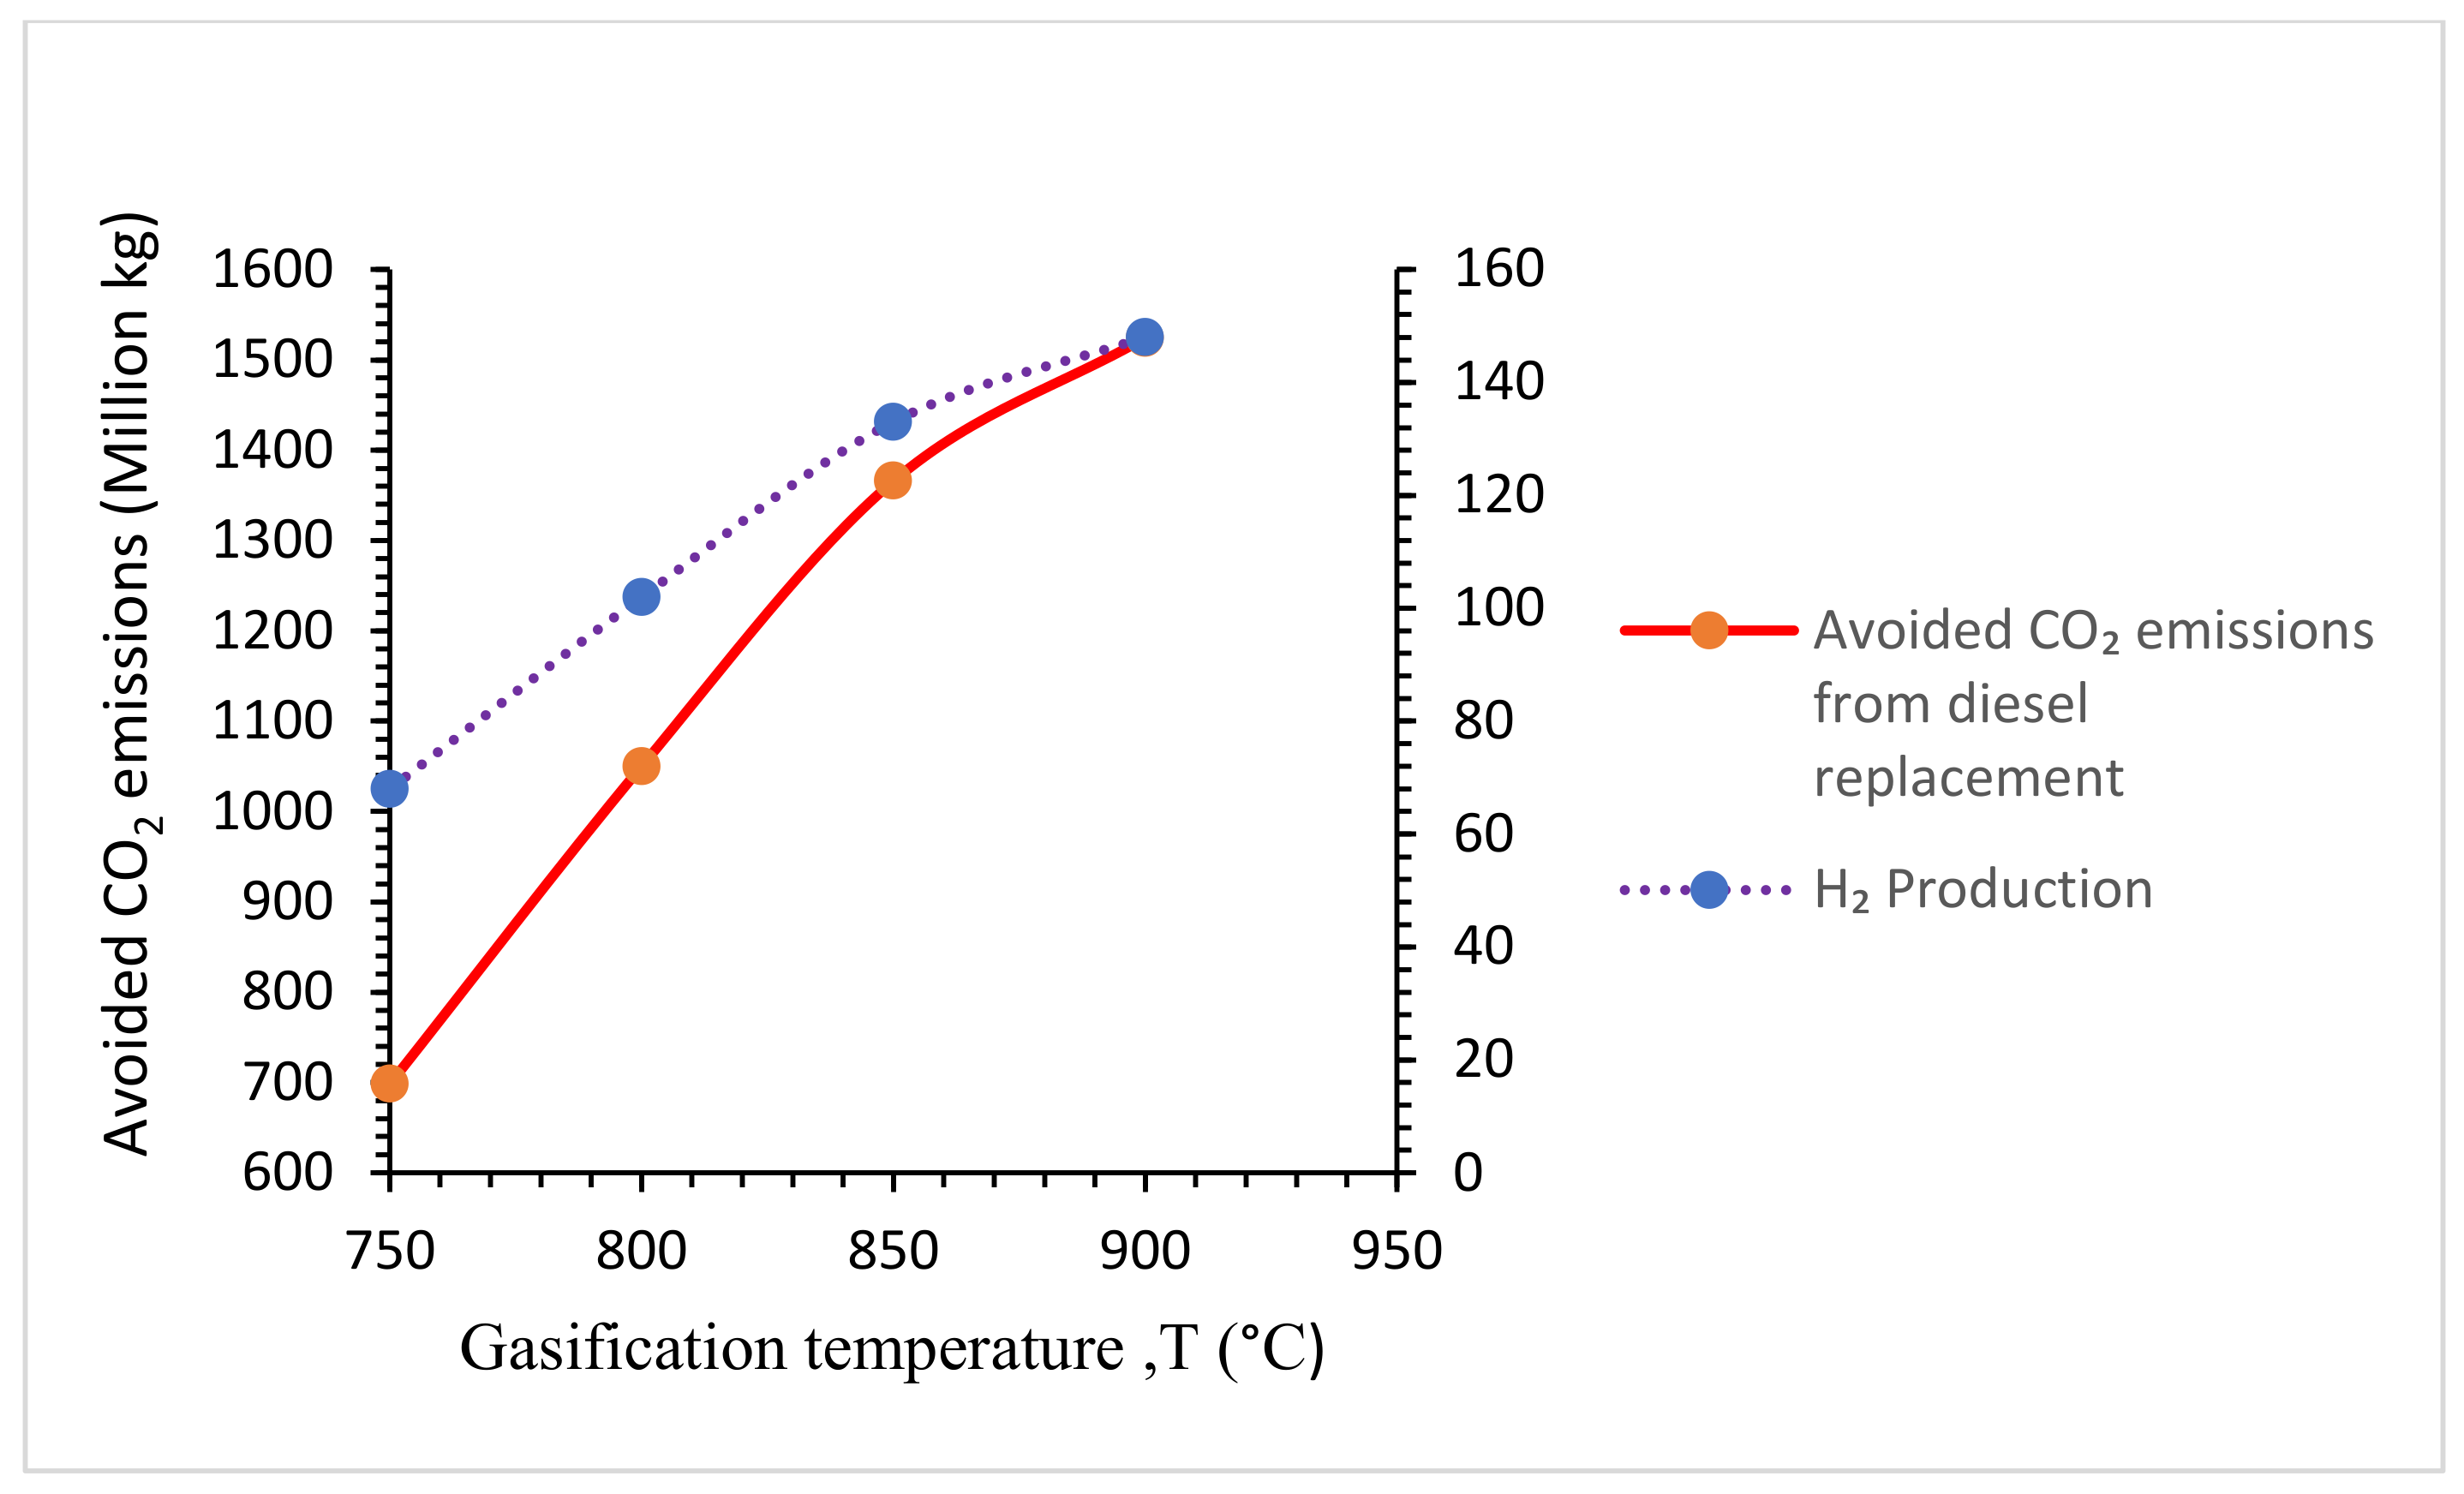
4.3.2. Gasification Temperature

The maximum hydrogen yield was obtained at 900 °C. At temperatures above 950, the gasification process runs the risk of accumulating ash, which can disrupt the operation. Figure 8 shows that by varying the gasification temperature from 750 °C to 900 °C, the amount of H2 was increased from 74.1% to 95%, and the amount of CO increased from 0.4% to 2.4%, while the amount of CH4 and CO2 decreased. This is as a result of the high temperature, which favors endothermic reactions in the gasifier. The high temperature favors the methane steam reforming reaction (see Equations (10) and (11)) and the Boudouard reaction (see Equation (12)). A high temperature also reduces the content of tar in the reaction [94,95].
CH 4 + H 2 O   CO + 3 H 2 = + 206   kJ / mol
CH 4 + 2 H 2 O     CO 2 + 4 H 2 = + 165   kJ / mol
CO 2 + C   2 CO = + 172   kJ / mol
The gasification temperature is positively correlated with the amount of CO2 emissions reduction (see Figure 9). The amount of CO2 avoided by replacing diesel with the hydrogen produced in Kaduna increased from 0.69 billion kg to 1.5 billion kg.

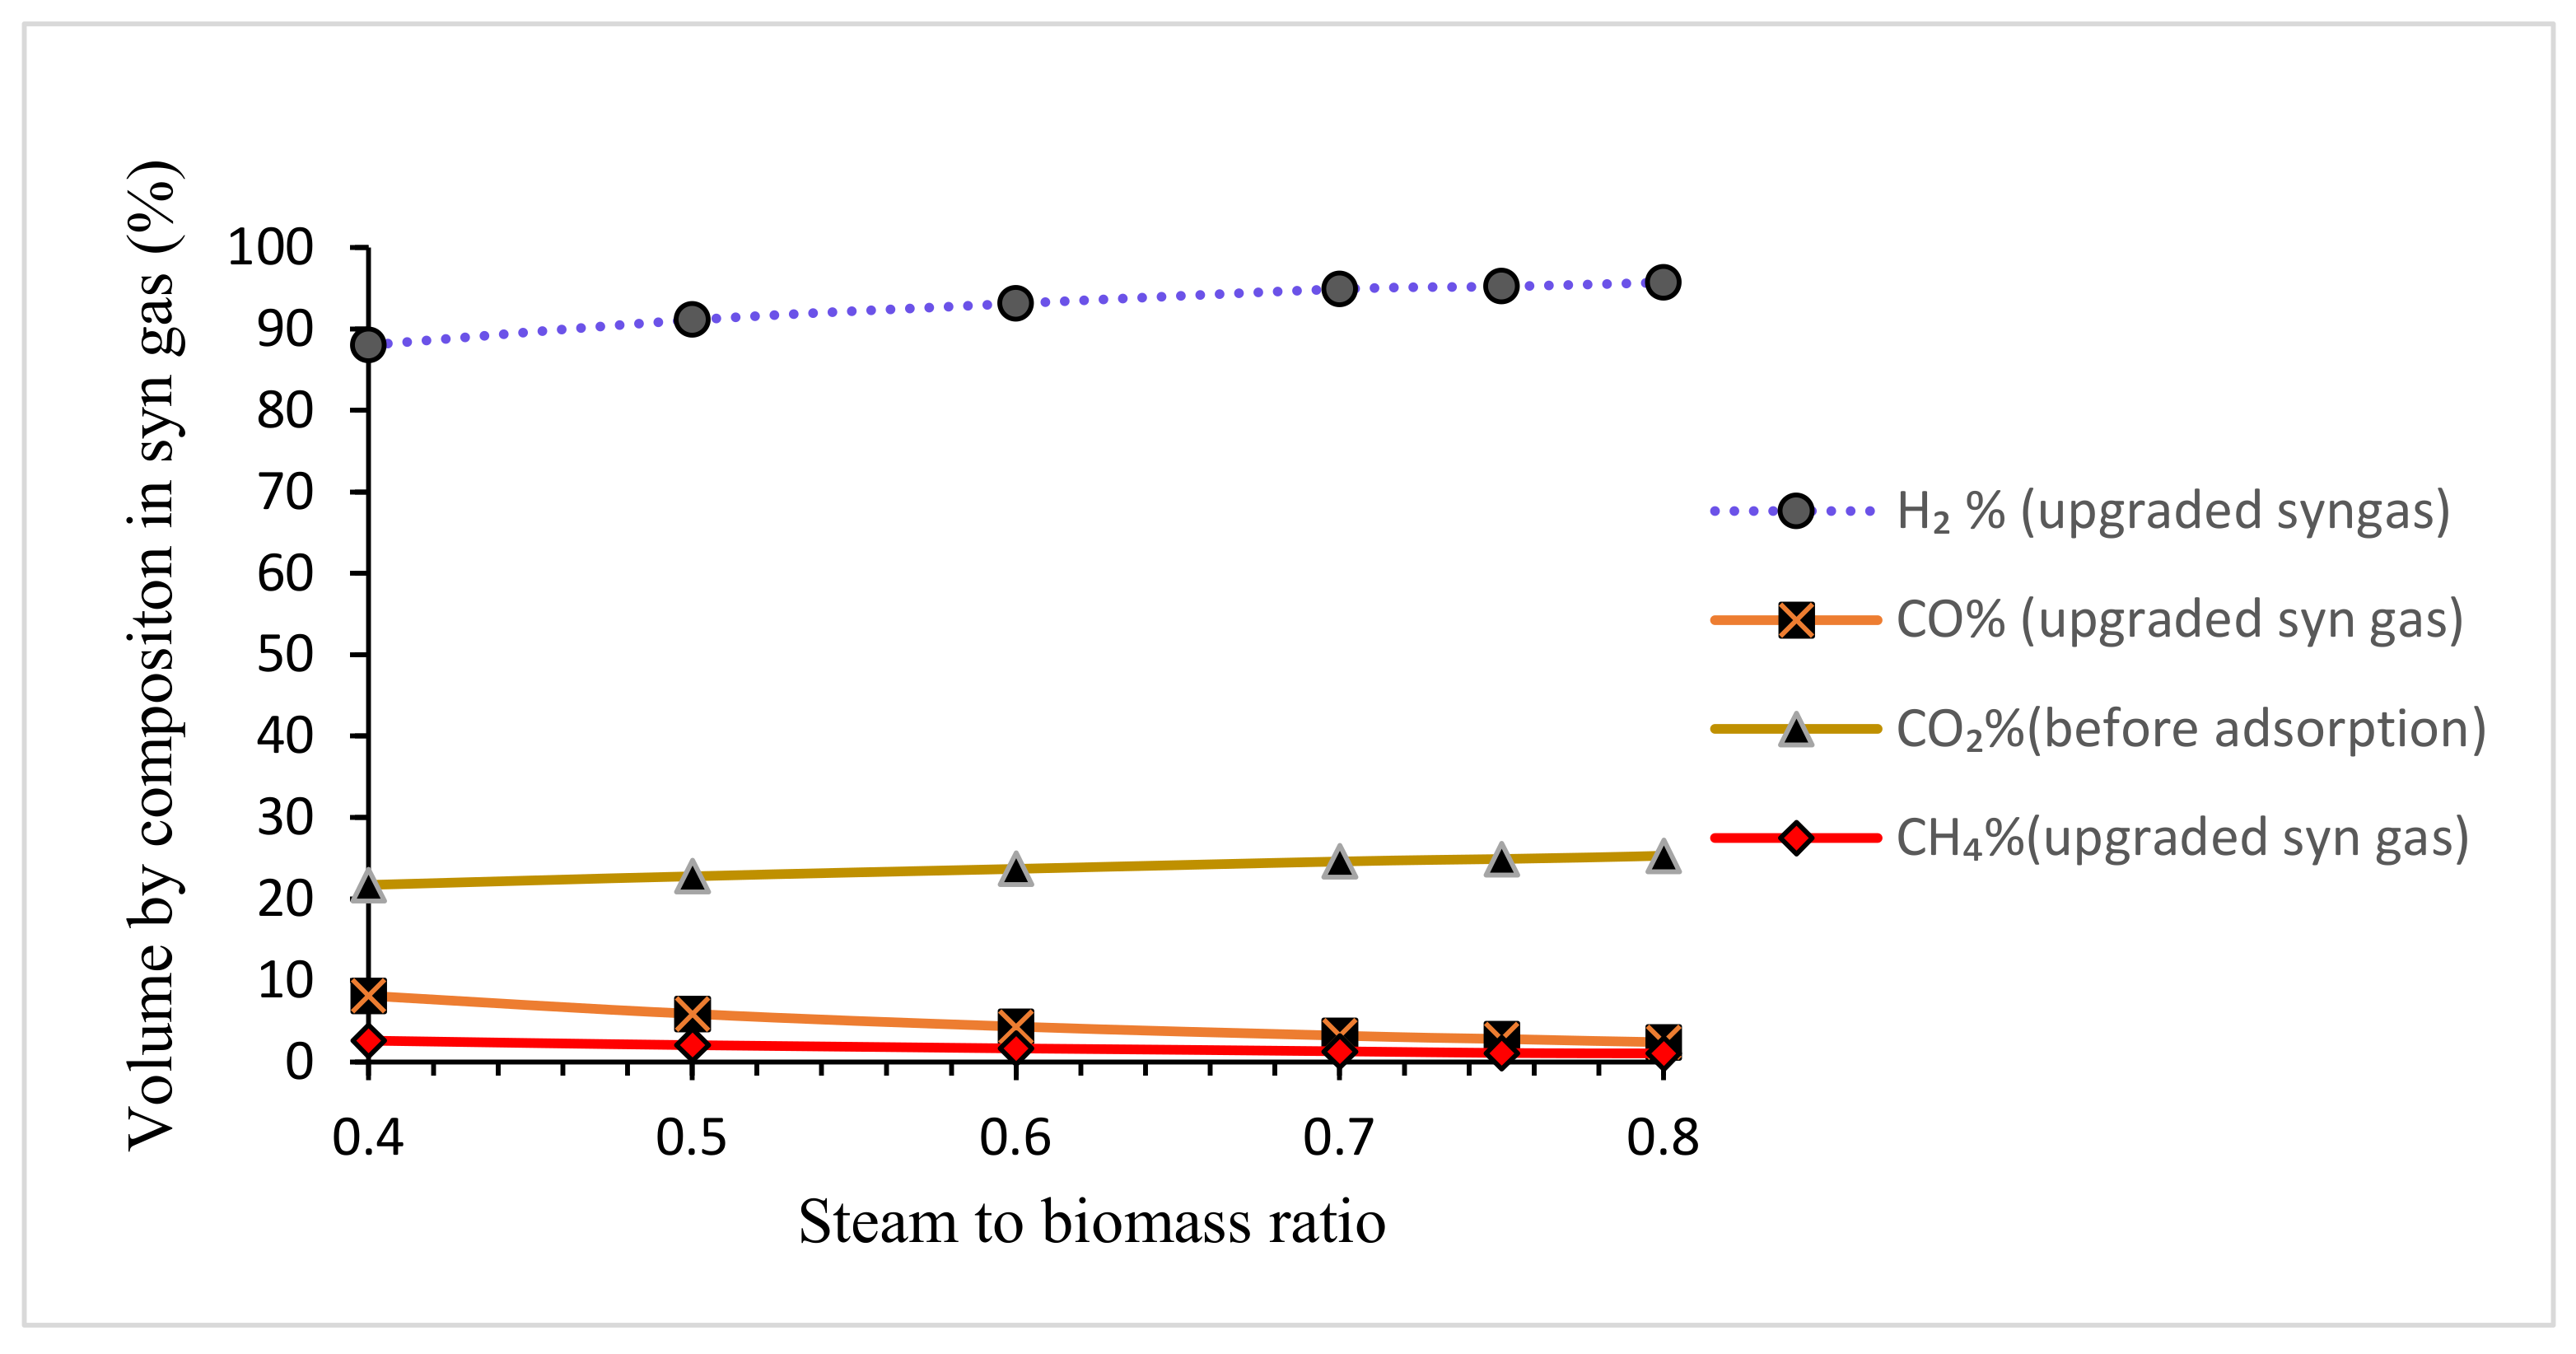
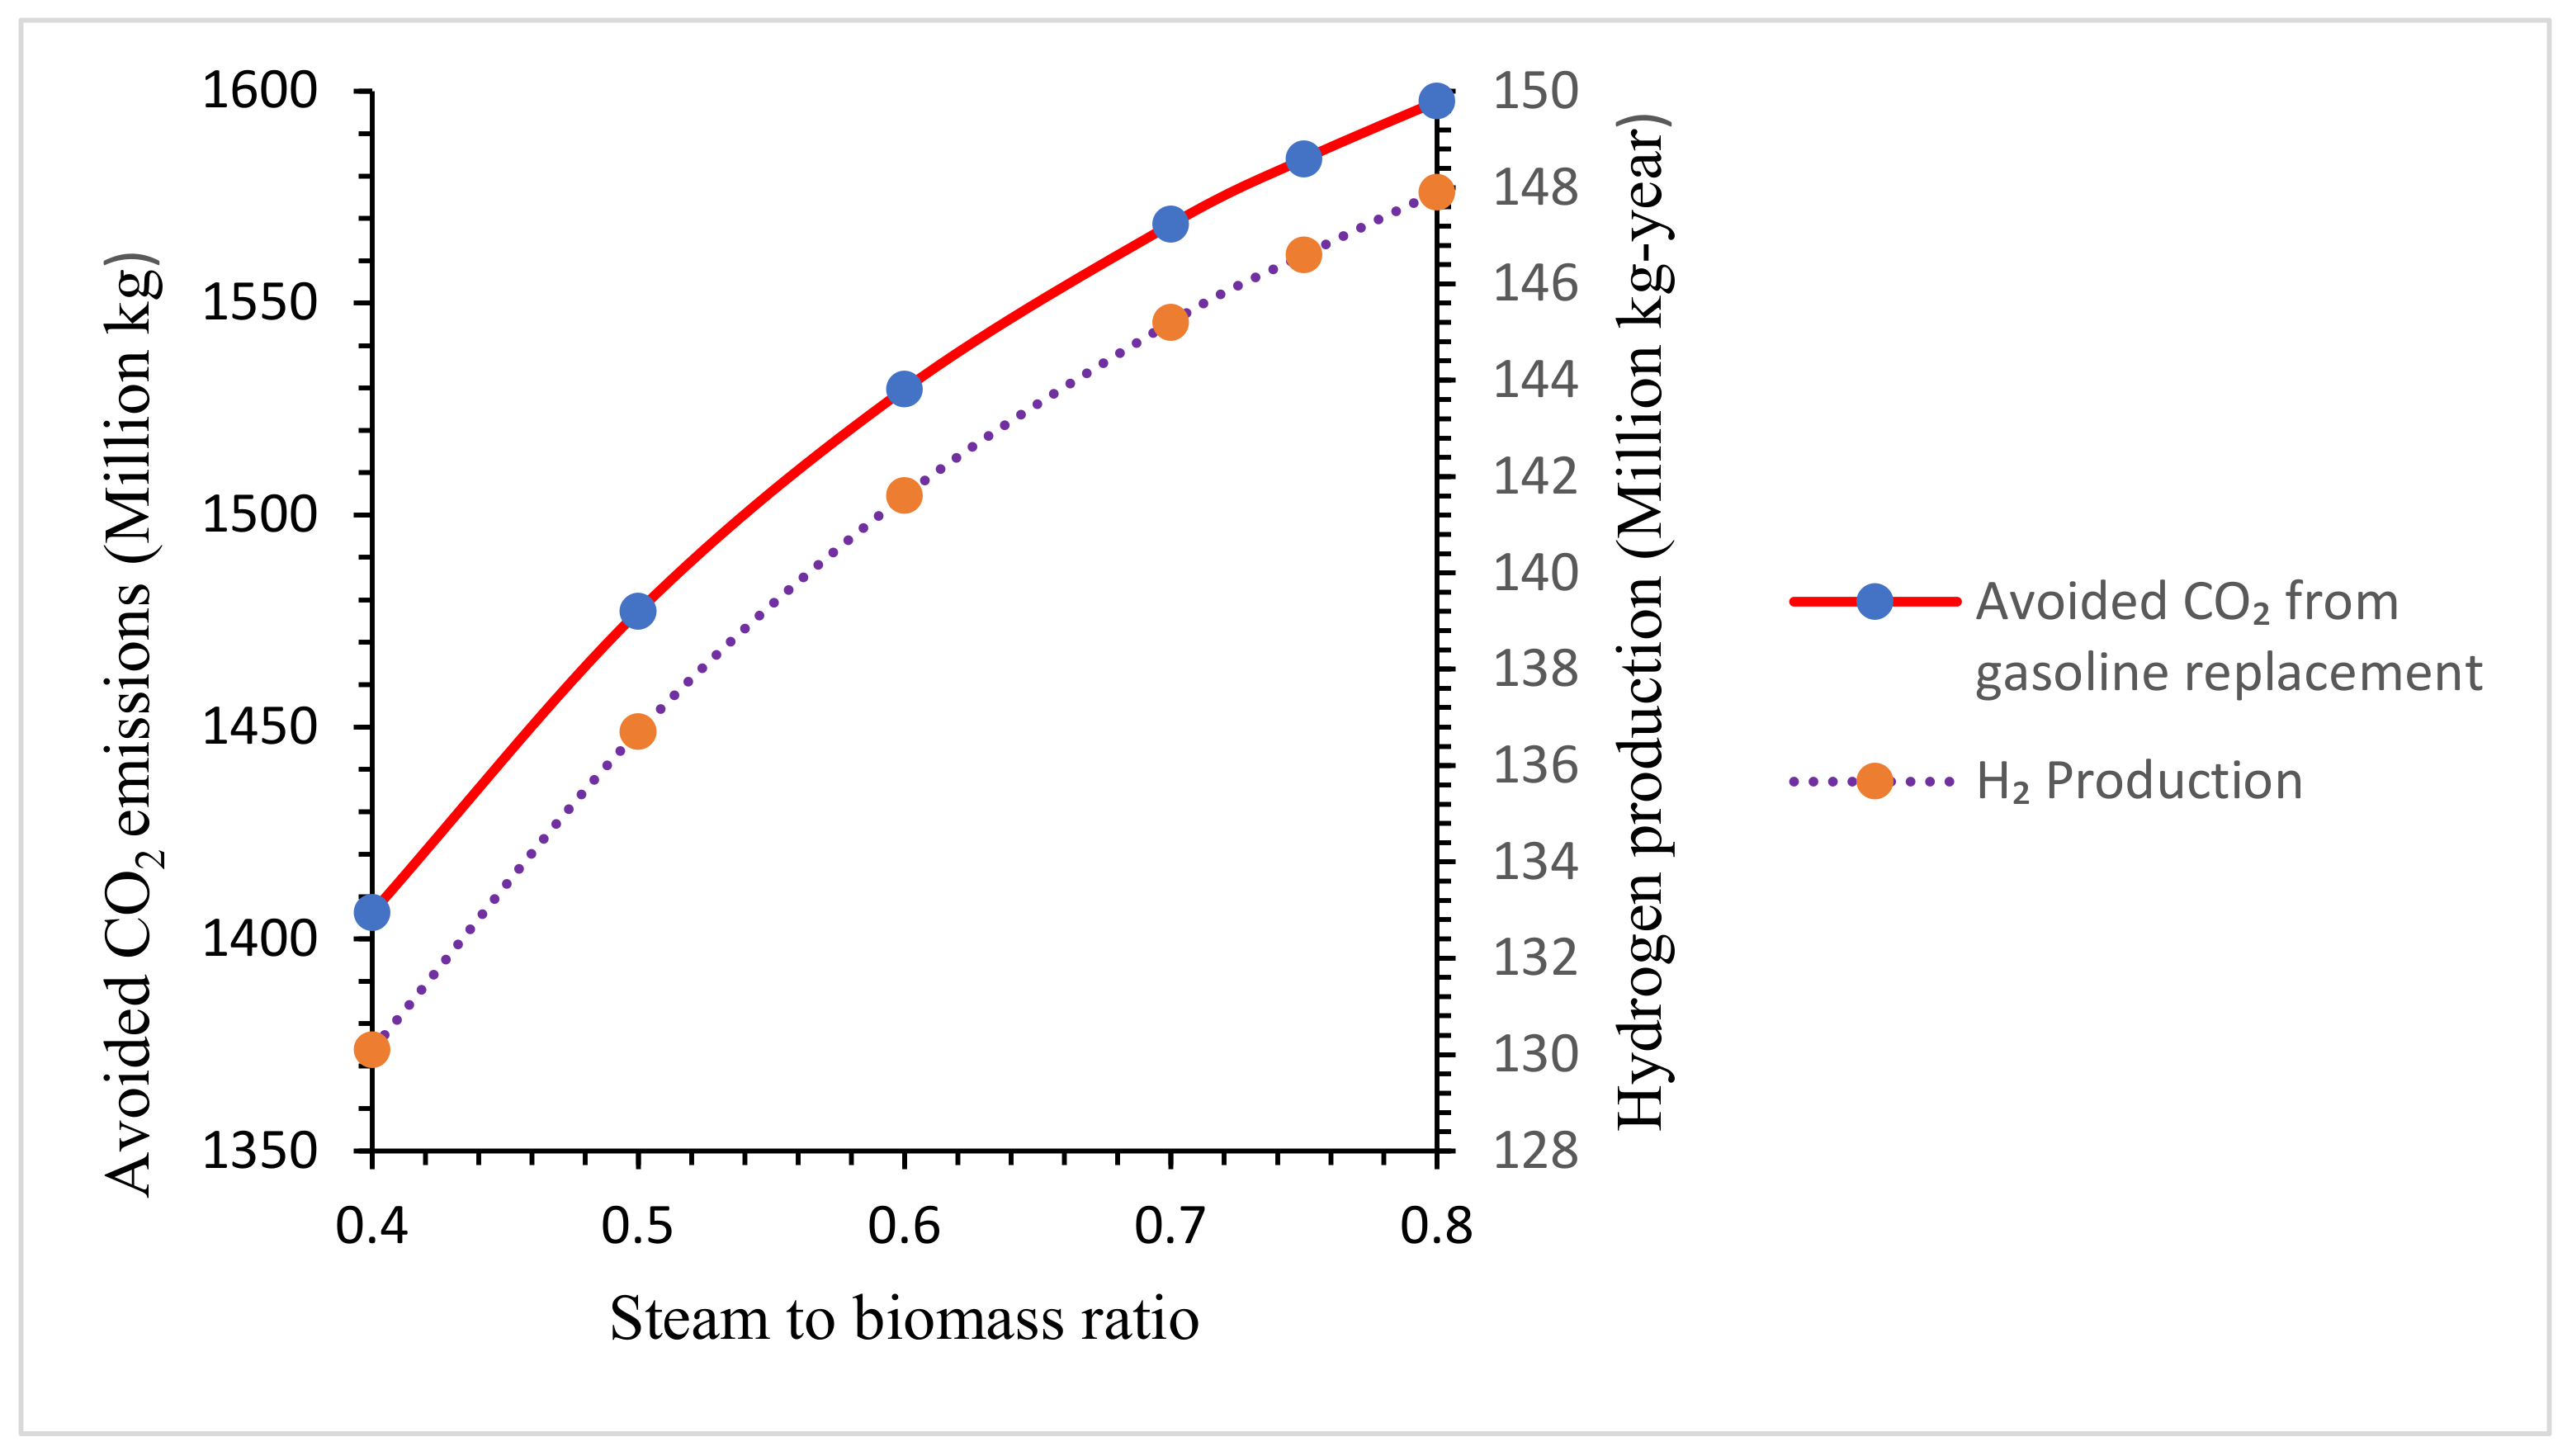
4.3.3. Steam-to-Biomass Ratio

Varying the steam-to-biomass ratio from 0.4 to 0.8 resulted in a rise in the percentages of hydrogen and carbon dioxide, as shown in Figure 10, while the concentration of carbon monoxide declined. This is because, at higher steam-to-biomass ratios, the water–gas shift reaction is supported, with the thermodynamic equilibrium shifting to the right to favor the production of more hydrogen and carbon dioxide. The water–gas shift reaction is an exothermic process: CO + H2O → CO2 + H2—41 kJ/mol. At very high steam-to-biomass ratios, the activity of the water–gas shift reaction is impeded, which consequently reduces the quality of the hydrogen in the syngas.
The steam-to-biomass ratio showed a positive correlation with the amount of CO2 emissions reduction, as shown in Figure 11. The amount of avoided CO2 emissions increased by 13.6%, from 1.4 billion kg to 1.59 billion kg, as a result of the production of a greater volume of hydrogen. The volume of hydrogen produced increased from 2.94 to 3.34 billion L as the steam-to-biomass ratio varied from 0.4 to 0.8. The amount of energy in 3.34 billion L of hydrogen is equivalent to that in 681 million L of gasoline, considering the losses due to the different fuel conversion efficiencies and the use of the density of compressed hydrogen. Ideally, 3.7 L of hydrogen is required to give the equivalent energy to that in 1 L of gasoline. At a gasoline price of NGN 165.77 per L, the total savings in the cost of gasoline was about NGN 112 trillion.

4.4. Technical Assessment of the Hydrogen Production Sites/Cities

A gasifier temperature of 900 °C, equivalence ratio of 0.1 and steam-to-biomass ratio of 0.8 provided optimum conditions for the gasification process. The molar composition by volume of the syngas and the hydrogen produced in tonnes per year is shown in Table 7. The total amount of hydrogen produced from the locations was 0.68 million tonnes, representing 0.971% of the global hydrogen produced in 2019, which was estimated to be 70 million tonnes [27].

4.5. Environmental Assessment of the Hydrogen Production Sites/Cities

The amount of diesel and gasoline consumption was determined using Equation (5). Table 8 and Table 9 show the amount of gasoline and diesel consumed in each of the selected cities. Lagos had the highest fuel consumption of 0.67 billion and 38.75 million L of gasoline and diesel, while Abuja had the lowest, at 0.1 billion L and 5.98, respectively.

4.5.1. Amount of CO2 Emitted in the Transport Sector

The amount of CO2 released from vehicular activity was obtained using Equation (6). The third and fourth columns of Table 10 show the amount of CO2 emissions released in the selected cities. A total of 0.27 billion kg and 1.67 billion kg of CO2 was released from gasoline and diesel consumption in Lagos, making this the city with the highest emissions. Abuja was the city with the lowest emissions. The total CO2 emissions were 6.35 billion kg (6.35 million metric tons). This represents 0.086% of the global transportation sector’s CO2 emissions, which is 7.3 billion metric tons.

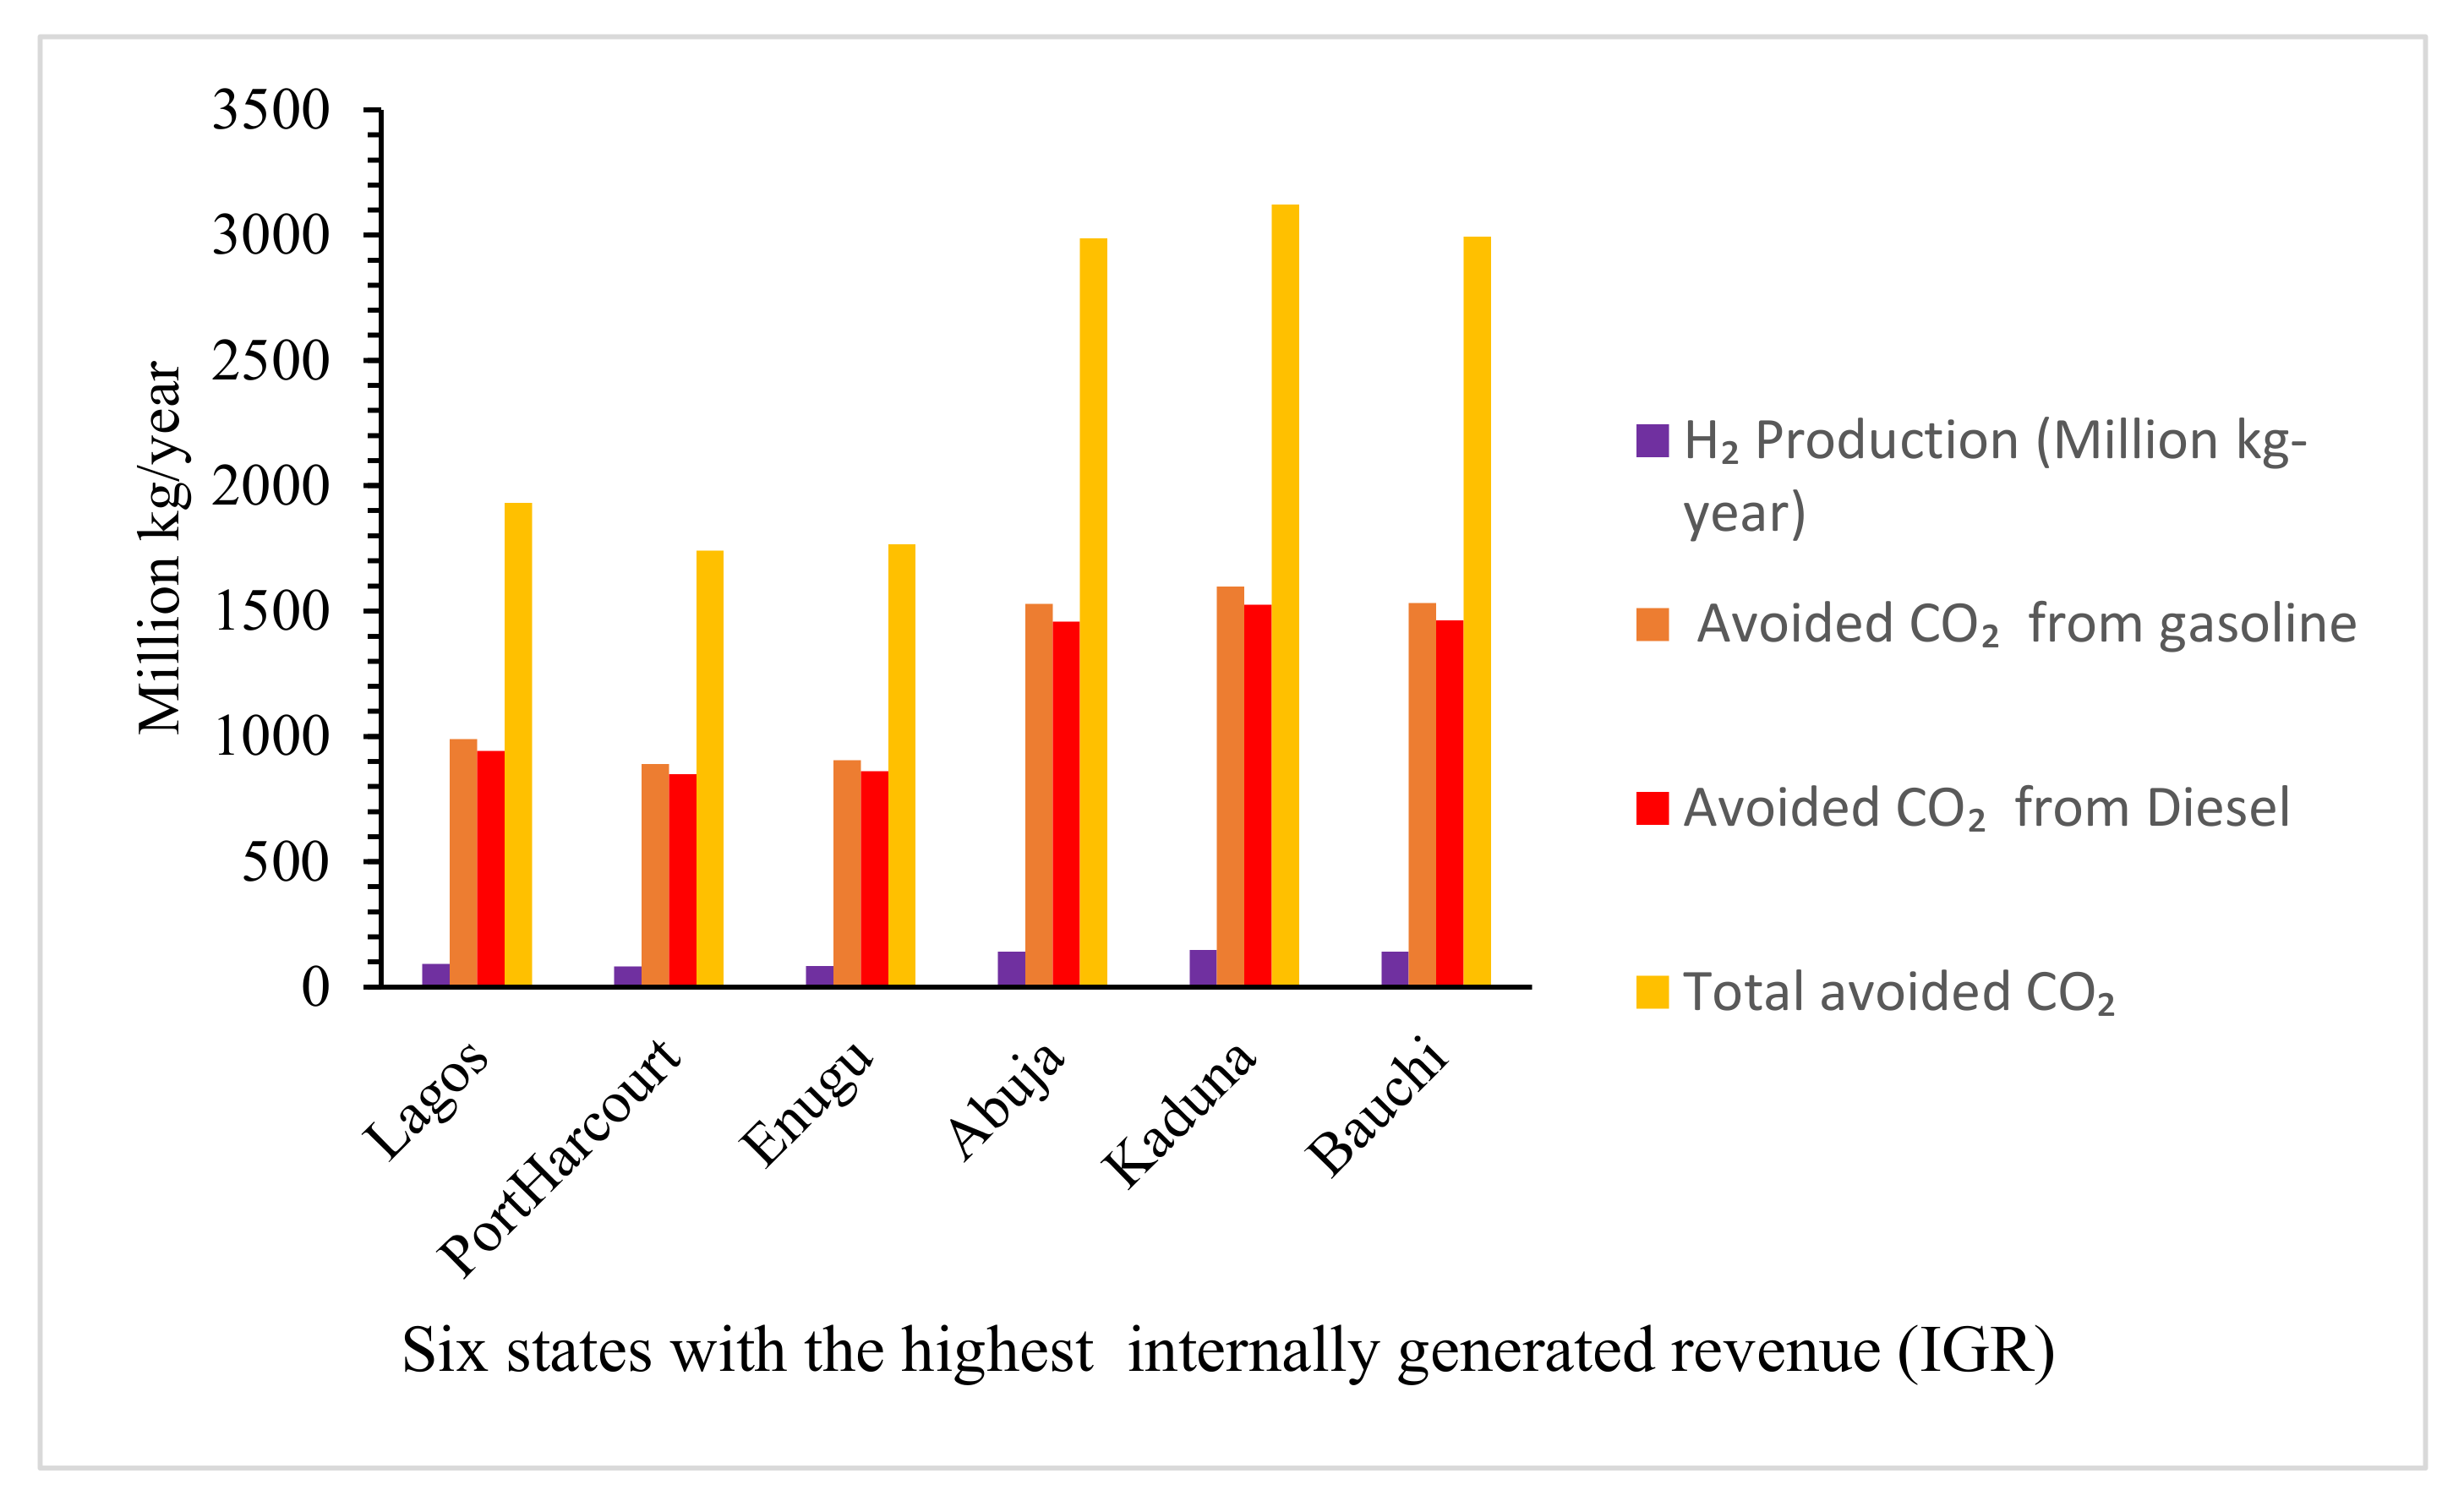
4.5.2. The Amount of Avoided CO2 Emissions

Hydrogen can serve as a replacement for diesel and gasoline consumption in vehicles for transportation purposes. Using Equations (7)–(9), the amount of diesel and gasoline that can be replaced was obtained, and the results are presented in Table 11 and Table 12.
The replacement contributes to a total reduction in CO2 emissions and cost savings in the purchase of gasoline and diesel. The total amount of diesel replaced in Lagos from Table 12 was 0.35 billion L, saving about NGN 101.5 billion. In addition, a total of 0.42 billion L of gasoline (see Table 11) could be replaced by 2.07 billion L of hydrogen produced in Lagos. This led to a cost saving of about NGN 70 billion. The prices for diesel and gasoline were taken as NGN 289.37 and 165.77 per L, according to the National Bureau of Statistics [66].

4.6. Managerial Implication of Research

The aim of this study was to provide valuable insight into the effective utilization of biomass waste for the purpose of providing a source of energy for road transport users. The study proposed a gasification model with a post-treatment water–gas shift reaction and a CO2 absorption process for obtaining hydrogen. The production of hydrogen was maximized at 900 °C and 0.8 for the gasification temperature and steam-to-biomass ratio. The maximum amount of hydrogen obtained was 147,918 tonnes per year from the Kaduna site. The key research findings are shown with respect to the fuel consumption preference for different categories of road users. The price variable is an essential driver of fuel consumption, influencing the aspect of buying behavior. The gasoline price in Nigeria is 170 NGN/L, which is equivalent to 0.376 USD/L. For an average four-wheeled car with moderate fuel economy, it is expected that 5 L of gasoline is consumed for every 100 km, which amounts to 11.2 USD/100 km. On the other hand, hydrogen gas is sold at an average cost of 3 to 6 USD/kg, and 6.1 kg of hydrogen is required per 100 km, which translates to an average cost of 24.4 USD/100 km. In comparison to gasoline, hydrogen is much more expensive for road users, and the implication is that unless the government invests in developing the infrastructures needed to drive down the cost of hydrogen, the consumption of gasoline will continue to grow. The findings are similar to those in other African countries. The cost of hydrogen will continue to remain higher than gasoline or diesel until there is enough evidence of financial, technical and political commitment from their respective governments. This is an insight for policymakers and hydrogen technology developers into the way forward for the development of a regional market that facilitates the logistics and proliferation of hydrogen technology.

5. Conclusions

The hydrogen generating potentials of cities with the highest internally generated revenues and vehicle ownership in the six geopolitical zones of Nigeria were examined. The results obtained revealed that the annual production of H2 gas from these locations was estimated to be 0.688 million metric tons. When the produced hydrogen gas is compressed and stored under high pressures of around 700 bar, it can be used as an energy carrier in vehicles, providing an equivalent amount of energy by replacing diesel and gasoline consumption by volume. A total of 15.5 billion L of hydrogen gas produced was used to displace 3.172 billion L of gasoline and 2.639 billion L of diesel, respectively, in these locations. The overall impact on the environment from the substitution of hydrogen gas for gasoline and diesel consumption was the avoidance of 7.4 million tonnes and 7.09 million tonnes of CO2 emissions. From an economical perspective, the savings from gasoline fuel expenses was NGN 525.6 billion. This is a huge reduction from the total gasoline consumption cost, recorded as NGN 3062 trillion, obtained from the nationwide consumption of 18.17 billion L in 2021. These savings could be used to cover other capital expenditures in the country. The sensitivity analysis revealed that varying the optimum condition for the steam-to-carbon ratio from 0.4 to 0.8 and the gasification temperature from 750 °C to 900 °C increased the amount of hydrogen available to achieve the reduction in CO2 emissions from vehicle activity in the road transport sector. The advancement of hydrogen technology enables its application in the industrial, electricity and transport sectors. In the industrial sector, hydrogen can be used in the production of ammonia, which is an essential feedstock for manufacturing fertilizers. It can also be used in methanol and steel production. Its applications also extend to the provision of electricity to the grid or off-grid applications using fuel cells.

Author Contributions

D.U. initiated the ideas, drafted the article and designed its structure, and J.T.-C. reviewed the results. All authors have read and agreed to the published version of the manuscript.

Funding

This research received no external funding.

Institutional Review Board Statement

Not applicable.

Informed Consent Statement

Not applicable.

Data Availability Statement

Not applicable.

Acknowledgments

Assistance in data provision and access to software and library resources from the Center for Advanced Studies in Energy and Environment, University of Jaen is hereby acknowledged.

Conflicts of Interest

The authors declare no conflict of interest.

References

  1. Statistical Review of World Energy/Energy Economics/Home. Available online: https://www.bp.com/en/global/corporate/energy-economics/statistical-review-of-world-energy.html (accessed on 28 February 2022).
  2. Khan, M.K.; Khan, M.I.; Rehan, M. The relationship between energy consumption, economic growth and carbon dioxide emissions in Pakistan. Financ. Innov. 2020, 6, 1. [Google Scholar] [CrossRef] [Green Version]
  3. Harvey, L.D.D. Resource implications of alternative strategies for achieving zero greenhouse gas emissions from light-duty vehicles by 2060. Appl. Energy 2018, 212, 663–679. [Google Scholar] [CrossRef]
  4. CO2 Emissions—Global Energy Review 2021—Analysis—IEA. Available online: https://www.iea.org/reports/global-energy-review-2021/co2-emissions (accessed on 28 February 2022).
  5. Transport—Topics—IEA. Available online: https://www.iea.org/topics/transport (accessed on 28 February 2022).
  6. Use of Energy for Transportation—U.S. Energy Information Administration (EIA). Available online: https://www.eia.gov/energyexplained/use-of-energy/transportation.php (accessed on 28 February 2022).
  7. Primary and Final Energy Consumption in Europe. Available online: https://www.eea.europa.eu/ims/primary-and-final-energy-consumption-1 (accessed on 28 February 2022).
  8. Sharpe, B.E.N.; Muncrief, R. Literature Review: Real-World Fuel Consumption of Heavy-Duty Vehicles in the United States, China, and the European Union; International Council on Clean Transportation: Washington, DC, USA, 2015. [Google Scholar]
  9. Lopp, S.; Wood, E.; Duran, A. Evaluating the Impact of Road Grade on Simulated Commercial Vehicle Fuel Economy Using Real-World Drive Cycles; National Renewable Energy Lab. (NREL): Golden, CO, USA, 2015. [Google Scholar]
  10. About the OECD—OECD. Available online: https://www.oecd.org/about/ (accessed on 20 March 2022).
  11. Čižinská, R.; Chládková, J. Selected Impacts of Regulation (EU) 2019/631 On Value Creation in the Automative Industry. Financ. Int. Q. 2021, 17, 76–87. [Google Scholar] [CrossRef]
  12. Commission, E.-E. Regulation (EU) 2019/631 of the European parliament and of the council of 17 April 2019 setting CO2 emission performance standards for new passenger cars and for new light commercial vehicles, and repealing Regulations (EC) No 443/2009 and (EU) No 510/201. Off. J. Eur. Union L 2019, 111, 13–53. [Google Scholar]
  13. Ntziachristos, L.; Samaras, Z. Air Pollutant Emission Inventory Guidebook Guidebook 2019 (1. A. 3. b); European Environmental Agency: Copenhagen, Denmark, 2019; Volume 8, pp. 1–58. [Google Scholar]
  14. European Commission. Choose your language/Choisir une langue/Wählen Sie eine Sprache. Available online: https://ec.europa.eu/ (accessed on 19 March 2022).
  15. The Road Vehicle Carbon Dioxide Emission Performance Standards (Cars and Vans) (Amendment) (EU Exit) Regulations 2020. Available online: https://www.legislation.gov.uk/ukdsi/2020/9780348213485 (accessed on 23 February 2022).
  16. Sun, S.; Zhao, G.; Wang, T.; Jin, J.; Wang, P.; Lin, Y.; Li, H.; Ying, Q.; Mao, H. Past and future trends of vehicle emissions in Tianjin, China, from 2000 to 2030. Atmos. Environ. 2019, 209, 182–191. [Google Scholar] [CrossRef]
  17. Brand, C.; Anable, J.; Ketsopoulou, I.; Watson, J. Road to zero or road to nowhere? Disrupting transport and energy in a zero carbon world. Energy Policy 2020, 139, 111334. [Google Scholar] [CrossRef]
  18. Trends and Developments in Electric Vehicle Markets—Global EV Outlook 2021—Analysis—IEA. Available online: https://www.iea.org/reports/global-ev-outlook-2021/trends-and-developments-in-electric-vehicle-markets (accessed on 14 April 2022).
  19. Rokicki, T.; Bórawski, P.; Bełdycka-Bórawska, A.; Żak, A.; Koszela, G. Development of Electromobility in European Union Countries under COVID-19 Conditions. Energies 2021, 15, 9. [Google Scholar] [CrossRef]
  20. Łuszczyk, M.; Sulich, A.; Siuta-Tokarska, B.; Zema, T.; Thier, A. The Development of Electromobility in the European Union: Evidence from Poland and Cross-Country Comparisons. Energies 2021, 14, 8247. [Google Scholar] [CrossRef]
  21. Mali, B.; Shrestha, A.; Chapagain, A.; Bishwokarma, R.; Kumar, P.; Gonzalez-Longatt, F. Challenges in the penetration of electric vehicles in developing countries with a focus on Nepal. Renew. Energy Focus 2022, 40, 1–12. [Google Scholar] [CrossRef]
  22. Ballo, A.; Valentin, K.K.; Korgo, B.; Ogunjobi, K.O.; Agbo, S.N.; Kone, D.; Savadogo, M. Law and Policy Review on Green Hydrogen Potential in ECOWAS Countries. Energies 2022, 15, 2304. [Google Scholar] [CrossRef]
  23. Ball, M.; Weeda, M. 11-The hydrogen economy—Vision or reality? Compend. Hydrog. Energy 2016, 4, 237–266. [Google Scholar]
  24. Akal, D.; Öztuna, S.; Büyükakın, M.K. A review of hydrogen usage in internal combustion engines (gasoline-Lpg-diesel) from combustion performance aspect. Int. J. Hydrog. Energy 2020, 45, 35257–35268. [Google Scholar] [CrossRef]
  25. González-Velasco, J.R.; Pereda-Ayo, B.; De-La-Torre, U.; Urrutxua, M.; López-Fonseca, R. NOx Storage and Reduction Coupled with Selective Catalytic Reduction for NOx Removal in Light-Duty Vehicles. ChemCatChem 2018, 10, 2928–2940. [Google Scholar] [CrossRef]
  26. Ayodele, T.R.; Alao, M.A.; Ogunjuyigbe, A.S.O.; Munda, J.L. Electricity generation prospective of hydrogen derived from biogas using food waste in south-western Nigeria. Biomass Bioenergy 2019, 127, 105291. [Google Scholar] [CrossRef]
  27. The Future of Hydrogen—Analysis—IEA. Available online: https://www.iea.org/reports/the-future-of-hydrogen (accessed on 23 February 2022).
  28. Hydrogen Production Cost Analysis/Hydrogen and Fuel Cells/NREL. Available online: https://www.nrel.gov/hydrogen/production-cost-analysis.html (accessed on 23 February 2022).
  29. Rezaei, M.; Mostafaeipour, A.; Qolipour, M.; Momeni, M. Energy supply for water electrolysis systems using wind and solar energy to produce hydrogen: A case study of Iran. Front. Energy 2019, 13, 539–550. [Google Scholar] [CrossRef]
  30. Mutlu, Ö.Ç.; Zeng, T. Challenges and opportunities of modeling biomass gasification in Aspen Plus: A review. Chem. Eng. Technol. 2020, 43, 1674–1689. [Google Scholar] [CrossRef]
  31. Molino, A.; Chianese, S.; Musmarra, D. Biomass gasification technology: The state of the art overview. J. Energy Chem. 2016, 25, 10–25. [Google Scholar] [CrossRef]
  32. Cerone, N.; Zimbardi, F. Effects of oxygen and steam equivalence ratios on updraft gasification of biomass. Energies 2021, 14, 2675. [Google Scholar] [CrossRef]
  33. Saleh, S.; Samad, N.A.F.A. Effects of Gasification Temperature and Equivalence Ratio on Gasification Performance and Tar Generation of Air Fluidized Bed Gasification Using Raw and Torrefied Empty Fruit Bunch. Chem. Eng. Trans. 2021, 88, 1309–1314. [Google Scholar]
  34. Fremaux, S.; Beheshti, S.-M.; Ghassemi, H.; Shahsavan-Markadeh, R. An experimental study on hydrogen-rich gas production via steam gasification of biomass in a research-scale fluidized bed. Energy Convers. Manag. 2015, 91, 427–432. [Google Scholar] [CrossRef]
  35. Keche, A.J.; Gaddale, A.P.R.; Tated, R.G. Simulation of biomass gasification in downdraft gasifier for different biomass fuels using ASPEN PLUS. Clean Technol. Environ. Policy 2015, 17, 465–473. [Google Scholar] [CrossRef]
  36. Han, J.; Liang, Y.; Hu, J.; Qin, L.; Street, J.; Lu, Y.; Yu, F. Modeling downdraft biomass gasification process by restricting chemical reaction equilibrium with Aspen Plus. Energy Convers. Manag. 2017, 153, 641–648. [Google Scholar] [CrossRef]
  37. Safarian, S.; Richter, C.; Unnthorsson, R. Waste Biomass Gasification Simulation Using Aspen Plus: Performance Evaluation of Wood Chips, Sawdust and Mixed Paper Wastes; Scientific Research Publishing: Wuhan, China, 2019. [Google Scholar]
  38. Timsina, R.; Thapa, R.K.; Eikeland, M.S. Aspen Plus simulation of biomass gasification for different types of biomass. Linköping Electron. Conf. Proc. 2019, 170, 151–157. [Google Scholar]
  39. Marcantonio, V.; Monarca, D.; Villarini, M.; Di Carlo, A.; Del Zotto, L.; Bocci, E. Biomass Steam Gasification, High-Temperature Gas Cleaning, and SOFC Model: A Parametric Analysis. Energies 2020, 13, 5936. [Google Scholar] [CrossRef]
  40. Kaushal, P.; Tyagi, R. Advanced simulation of biomass gasification in a fluidized bed reactor using ASPEN PLUS. Renew. Energy 2017, 101, 629–636. [Google Scholar] [CrossRef]
  41. Bijesh, R.; Arun, P.; Muraleedharan, C. Modified stoichiometric equilibrium model for sewage sludge gasification and its validation based on experiments in a downdraft gasifier. Biomass Convers. Biorefinery 2021, 1–21. [Google Scholar] [CrossRef]
  42. Pilar González-Vázquez, M.; Rubiera, F.; Pevida, C.; Pio, D.T.; Tarelho, L.A.C. Thermodynamic analysis of biomass gasification using aspen plus: Comparison of stoichiometric and non-stoichiometric models. Energies 2021, 14, 189. [Google Scholar] [CrossRef]
  43. Babatunde, O.M.; Munda, J.L.; Hamam, Y. Selection of a hybrid renewable energy systems for a low-income household. Sustainability 2019, 11, 4282. [Google Scholar] [CrossRef] [Green Version]
  44. Lan, W.; Chen, G.; Zhu, X.; Wang, X.; Liu, C.; Xu, B. Biomass gasification-gas turbine combustion for power generation system model based on ASPEN PLUS. Sci. Total Environ. 2018, 628, 1278–1286. [Google Scholar] [CrossRef]
  45. Salman, C.A.; Omer, C.B. Process modelling and simulation of waste gasification-based flexible polygeneration facilities for power, heat and biofuels production. Energies 2020, 13, 4264. [Google Scholar] [CrossRef]
  46. Niu, M.; Xie, J.; Liang, S.; Liu, L.; Wang, L.; Peng, Y. Simulation of a new biomass integrated gasification combined cycle (BIGCC) power generation system using Aspen Plus: Performance analysis and energetic assessment. Int. J. Hydrog. Energy 2021, 46, 22356–22367. [Google Scholar] [CrossRef]
  47. Hamrang, F.; Shokri, A.; Mahmoudi, S.M.; Ehghaghi, B.; Rosen, M.A. Performance analysis of a new electricity and freshwater production system based on an integrated gasification combined cycle and multi-effect desalination. Sustainability 2020, 12, 7996. [Google Scholar] [CrossRef]
  48. Kowsari, S.; Deymi-Dashtebayaz, M.; Karbasi, K.; Sheikhani, H. Optimal working conditions of various city gate stations for power and hydrogen production based on energy and eco-exergy analysis. Int. J. Hydrog. Energy 2020, 45, 22513–22533. [Google Scholar] [CrossRef]
  49. Hekmatshoar, M.; Deymi-Dashtebayaz, M.; Gholizadeh, M.; Dadpour, D.; Delpisheh, M. Thermoeconomic analysis and optimization of a geothermal-driven multi-generation system producing power, freshwater, and hydrogen. Energy 2022, 247, 123434. [Google Scholar] [CrossRef]
  50. AlNouss, A.; McKay, G.; Al-Ansari, T. Enhancing waste to hydrogen production through biomass feedstock blending: A techno-economic-environmental evaluation. Appl. Energy 2020, 266, 114885. [Google Scholar] [CrossRef]
  51. SDG Indicators. Available online: https://unstats.un.org/sdgs/report/2019/goal-11 (accessed on 11 March 2022).
  52. Trends in Solid Waste Management. Available online: https://datatopics.worldbank.org/what-a-waste/trends_in_solid_waste_management.html (accessed on 27 February 2022).
  53. Olanrewaju, F.O.; Andrews, G.E.; Li, H.; Phylaktou, H.N. Bioenergy potential in Nigeria. Chem. Eng. Trans. 2019, 74, 61–66. [Google Scholar]
  54. Nigeria at a glance/FAO in Nigeria/Food and Agriculture Organization of the United Nations. Available online: https://www.fao.org/nigeria/fao-in-nigeria/nigeria-at-a-glance/en/ (accessed on 23 February 2022).
  55. Africa Sustainable Livestock 2050. Available online: https://www.fao.org/documents/card/en/c/a2871dc7-7691-4779-94ae-3b10d22ad5fb/ (accessed on 23 February 2022).
  56. Ikuemonisan, E.S.; Mafimisebi, T.E.; Ajibefun, I.; Adenegan, K. Cassava production in Nigeria: Trends, instability and decomposition analysis (1970–2018). Heliyon 2020, 6, e05089. [Google Scholar] [CrossRef]
  57. Ben-Iwo, J.; Manovic, V.; Longhurst, P. Biomass resources and biofuels potential for the production of transportation fuels in Nigeria. Renew. Sustain. Energy Rev. 2016, 63, 172–192. [Google Scholar] [CrossRef] [Green Version]
  58. Adekunle, A.; Orsat, V.; Raghavan, V. Lignocellulosic bioethanol: A review and design conceptualization study of production from cassava peels. Renew. Sustain. Energy Rev. 2016, 64, 518–530. [Google Scholar] [CrossRef]
  59. Okike, I.; Samireddypalle, A.; Kaptoge, L.; Fauquet, C.; Atehnkeng, J.; Bandyopadhyay, R.; Kulakow, P.; Duncan, A.; Alabi, T.; Blummel, M. Technical innovations for small-scale producers and households to process wet cassava peels into high quality animal feed ingredients and aflasafeTM substrate. Food Chain 2015, 5, 71–90. [Google Scholar] [CrossRef]
  60. Ezeudu, O.B.; Agunwamba, J.C.; Ugochukwu, U.C.; Ezeudu, T.S. Temporal assessment of municipal solid waste management in Nigeria: Prospects for circular economy adoption. Rev. Environ. Health 2020, 36, 327–344. [Google Scholar] [CrossRef] [PubMed]
  61. Izah, S.C.; Angaye, T.C.N.; Ohimain, E.I. Environmental Impacts of Oil palm processing in Nigeria. Biotechnol. Res. 2016, 2, 132–141. [Google Scholar]
  62. Jekayinfa, S.O.; Orisaleye, J.I.; Pecenka, R. An assessment of potential resources for biomass energy in Nigeria. Resources 2020, 9, 92. [Google Scholar] [CrossRef]
  63. NNPC Reports—Audited Financial Statements, Monthly Performance Reports, FAAC Reports and More. Available online: https://nnpcgroup.com/NNPC-Business/Business-Information/Pages/Monthly-Performance-Data.aspx (accessed on 23 February 2022).
  64. Interrogating NNPC’s Fuel Consumption Figures/THISDAYLIVE. Available online: https://www.thisdaylive.com/index.php/2021/08/03/interrogating-nnpcs-fuel-consumption-figures/ (accessed on 20 March 2022).
  65. Daily Fuel Consumption Jumps to 72 Million Litres, Subsidy Hits N541.66bn—Punch Newspapers. Available online: https://punchng.com/daily-fuel-consumption-jumps-to-72-million-litres-subsidy-hits-n541-66bn/ (accessed on 20 March 2022).
  66. Elibrary | National Bureau of Statistics. Available online: https://nigerianstat.gov.ng/elibrary (accessed on 23 February 2022).
  67. Cervigni, R. Assessing Low-Carbon Development in Nigeria: An Analysis of Four Sectors; World Bank Publications: Washington, DC, USA, 2013; ISBN 082139973X. [Google Scholar]
  68. Omodero, C.O.; Ekwe, M.C.; Ihendinihu, J.U. The impact of internally generated revenue on economic development in Nigeria. Account. Financ. Res. 2018, 7, 103–114. [Google Scholar] [CrossRef] [Green Version]
  69. Census Enumeration—National Population Commission. Available online: https://nationalpopulation.gov.ng/core-activities/census-enumeration/ (accessed on 28 February 2022).
  70. Ogwueleka, T.C. Survey of household waste composition and quantities in Abuja, Nigeria. Resour. Conserv. Recycl. 2013, 77, 52–60. [Google Scholar] [CrossRef]
  71. Nwoke, O.A.; Okonkwo, W.I.; Echiegu, E.A.; Ugwuishiwu, B.O.; Okechukwu, C.H. Determination of the calorific value of municipal solid waste in enugu, nigeria and its potential for electricity generation. Agric. Eng. Int. CIGR J. 2020, 22, 86–97. [Google Scholar]
  72. Ibiebele, D.D. Rapid method for estimating solid wastes generation rate in developing countries. Waste Manag. Res. 1986, 4, 361–365. [Google Scholar] [CrossRef]
  73. Abah, S.O.; Ohimain, E.I. Assessment of dumpsite rehabilitation potential using the integrated risk based approach: A case study of Eneka, Nigeria. World Appl. Sci. J. 2010, 8, 436–442. [Google Scholar]
  74. Abd’Razack, N.T.A.; Medayese, S.O.; Shaibu, S.I.; Adeleye, B.M. Habits and benefits of recycling solid waste among households in Kaduna, North West Nigeria. Sustain. Cities Soc. 2017, 28, 297–306. [Google Scholar] [CrossRef]
  75. Ogunjuyigbe, A.S.O.; Ayodele, T.R.; Alao, M.A. Electricity generation from municipal solid waste in some selected cities of Nigeria: An assessment of feasibility, potential and technologies. Renew. Sustain. Energy Rev. 2017, 80, 149–162. [Google Scholar] [CrossRef]
  76. Babatunde, B.B.; Vincent-Akpu, I.F.; Woke, G.N.; Atarhinyo, E.; Aharanwa, U.C.; Green, A.F.; Isaac-Joe, O. Comparative analysis of municipal solid waste (MSW) composition in three local government areas in Rivers State, Nigeria. Afr. J. Environ. Sci. Technol. 2013, 7, 874–881. [Google Scholar]
  77. Fahim, M.A.; Alsahhaf, T.A.; Elkilani, A. Hydrogen production. In Fundamentals of Petroleum Refining; Elsevier: Amsterdam, The Netherlands, 2010; pp. 285–302. [Google Scholar]
  78. Ayodele, T.R.; Ogunjuyigbe, A.S.O.; Alao, M.A. Economic and environmental assessment of electricity generation using biogas from organic fraction of municipal solid waste for the city of Ibadan, Nigeria. J. Clean. Prod. 2018, 203, 718–735. [Google Scholar] [CrossRef]
  79. Ridha, F.N.; Manovic, V.; Macchi, A.; Anthony, E.J. CO2 capture at ambient temperature in a fixed bed with CaO-based sorbents. Appl. Energy 2015, 140, 297–303. [Google Scholar] [CrossRef]
  80. Doherty, W.; Reynolds, A.; Kennedy, D. Aspen Plus Simulation of Biomass Gasification in a Steam Blown Dual Fluidised Bed. Mendez-Vilas, A., Ed.; Formartex Research Centre: Badajoz, Spain, 2013. [Google Scholar]
  81. Shen, L.; Gao, Y.; Xiao, J. Simulation of hydrogen production from biomass gasification in interconnected fluidized beds. Biomass Bioenergy 2008, 32, 120–127. [Google Scholar] [CrossRef]
  82. Fonseca, J.; Albis, A.; Montenegro, A.R. Evaluation of zinc adsorption using cassava peels (Manihot esculenta) modified with citric acid. Contemp Eng. Sci 2018, 11, 3575–3585. [Google Scholar] [CrossRef] [Green Version]
  83. Yang, Y.; Heaven, S.; Venetsaneas, N.; Banks, C.J.; Bridgwater, A. V Slow pyrolysis of organic fraction of municipal solid waste (OFMSW): Characterisation of products and screening of the aqueous liquid product for anaerobic digestion. Appl. Energy 2018, 213, 158–168. [Google Scholar] [CrossRef]
  84. Akyürek, Z. Sustainable valorization of animal manure and recycled polyester: Co-pyrolysis synergy. Sustainability 2019, 11, 2280. [Google Scholar] [CrossRef] [Green Version]
  85. Maduekwe, M.; Akpan, U.; Isihak, S. Road transport energy consumption and vehicular emissions in Lagos, Nigeria: An application of the LEAP model. Transp. Res. Interdiscip. Perspect. 2020, 6, 100172. [Google Scholar] [CrossRef]
  86. United States, Environmental Protection Agency, Office of Mobile Sources, Emission Planning & Strategies Division. User’s Guide to MOBILE5:(Mobile Source Emission Factor Model); US Environmental Protection Agency: Washington, DC, USA, 1994.
  87. Andersson, J.; Grönkvist, S. Large-scale storage of hydrogen. Int. J. Hydrog. Energy 2019, 44, 11901–11919. [Google Scholar] [CrossRef]
  88. Alternative Fuels Data Center: Fuel Properties Comparison. Available online: https://afdc.energy.gov/fuels/properties (accessed on 28 February 2022).
  89. Niaz, S.; Manzoor, T.; Pandith, A.H. Hydrogen storage: Materials, methods and perspectives. Renew. Sustain. Energy Rev. 2015, 50, 457–469. [Google Scholar] [CrossRef]
  90. Gillingham, K. Hydrogen Internal Combustion Engine Vehicles: A Prudent Intermediate Step or A Step in the Wrong Direction; Department of Management Science & Engineering Global Climate and Energy Project Precourt Institute for Energy Efficiency of Stanford University: Stanford, CA, USA, 2007. [Google Scholar]
  91. Albatayneh, A.; Assaf, M.N.; Alterman, D.; Jaradat, M. Comparison of the overall energy efficiency for internal combustion engine vehicles and electric vehicles. Environ. Clim. Technol. 2020, 24, 669–680. [Google Scholar] [CrossRef]
  92. Hosseini, S.E.; Butler, B. An overview of development and challenges in hydrogen powered vehicles. Int. J. Green Energy 2020, 17, 13–37. [Google Scholar] [CrossRef] [Green Version]
  93. Fuel Gases—Heating Values. Available online: https://www.engineeringtoolbox.com/heating-values-fuel-gases-d_823.html (accessed on 23 February 2022).
  94. Lv, P.M.; Xiong, Z.H.; Chang, J.; Wu, C.Z.; Chen, Y.; Zhu, J.X. An experimental study on biomass air–steam gasification in a fluidized bed. Bioresour. Technol. 2004, 95, 95–101. [Google Scholar] [CrossRef] [PubMed]
  95. Liu, H.; Hu, J.; Wang, H.; Wang, C.; Li, J. Experimental studies of biomass gasification with air. J. Nat. Gas Chem. 2012, 21, 374–380. [Google Scholar] [CrossRef]
Figure 1. Vehicle fleet composition obtained from [67].
Energies 15 03200 g001
Figure 2. Map of Nigeria showing the cities’ locations.
Energies 15 03200 g002
Figure 3. Aspen Plus simulation diagram.
Energies 15 03200 g003
Figure 4. Results for six cities with the highest internally generated revenue (IGR).
Energies 15 03200 g004
Figure 5. Effect of gasification temperature on hydrogen production and the diesel and gasoline displaced.
Energies 15 03200 g005
Figure 6. Effect of equivalence ratio on syngas composition.
Energies 15 03200 g006
Figure 7. Effect of equivalence ratio on CO2 avoided and hydrogen production.
Energies 15 03200 g007
Figure 8. Evolution of syngas composition with gasification temperature.
Energies 15 03200 g008
Figure 9. Effect of gasification temperature on the level of hydrogen production and the CO2 emissions avoided.
Energies 15 03200 g009
Figure 10. Effect of STBR on syngas composition.
Energies 15 03200 g010
Figure 11. Effect of SBTR on CO2 avoided and hydrogen production.
Energies 15 03200 g011
Table 1. Statistical data for the selected cities.
Selected CityIGR [66]Population (p) [69]Vehicle Owners (v)
v = p × 0.06
Waste Generated per Capita (kg/Capita/Day)
Abuja69,072,879,6641,406,239546,8160.634 [70]
Enugu14,140,554,6763,267,837311,9220.48 [71]
Port-Harcourt57,324,672,3725,198,716196,0700.22 [72,73]
Lagos267,232,774,4349,113,60584,3740.47 [26]
Kaduna26,429,424,2196,113,50394,9260.56 [74]
Bauchi9,467,289,0204,653,066279,2180.22 [75]
Table 2. Input specifications and function of equipment/block utilized in the simulation.
Equipment ID
(Aspen Plus Block)
Input Conditions and ParametersFunction/Details
FEEDMIX (MIXER)-Combines the different streams of non-conventional feeds, i.e., biomass/waste.
DECOMPO (RYIELD)T = 25 °C, P = 1 barConverts the biomass feed into conventional components in the form of constituent elements, ash and water.
YIELDS
(CALCULATOR)
Fortran expressionAdjusts the percentage yield input in
RYIELD for each element, and for ash and water, according to the incoming mixed feed.
DECOMPO- (RSTOIC)T = 25 °C, P = 1 bar
N2 + 3H2 → 2NH3
S + H2 → H2S
Cl2 + H2 → 2HCl
Fractional conversion = 1 for S, N2 and Cl2
Converts all the sulfur, chlorine and nitrogen into H2S, HCl and NH3, respectively.
GASIF (RGIBBS)Restrict chemical equilibrium—specify temperature approach or reaction extent; T = 850 °C, P = 0 bar (no pressure drop); set H2S, NH3 and HCl as inerts with fraction = 1
C + 2H2 ↔ CH4 (Temp. approach = 0 °C)
C + H2O ↔ CO + H2 (Temp. approach = 0 °C)
C + CO2 ↔ 2CO (Temp. approach = 0 °C)
CH4 + H2O ↔ CO + 3H2 (Temp. approach = −265 °C)
CO + H2O↔ CO2 + H2 (Temp. approach = −90 °C)
Carries out steam–air gasification. The reactor predicts products by the principle of minimization of Gibb’s energy, while carrying out the specified equilibrium reactions with input temperature approach to equilibrium.
ASU (SEPARATOR)For O2 stream, split fraction = 1 for component O2, while all the rest of the components are set to zero Splits ambient air into N2 and O2 assuming 100% separation (not modelled in detail).
AFRATIO
(CALCULATOR)
Fortran expressionSets the flowrate of AIR stream “equivalence ratio (ER)” times the stoichiometric required air for combustion of same biomass/waste.
SYNCOMP
(MCOMPRESSOR)
Isentropic; 2 stages
Equal pressure ratio
Fixed discharge pressure from last stage = 24 bar
Cooler outlet temperature = 230 °C
Carries out multi-stage isothermal compression so that cooled syngas is at the reported pressure for WGS.
WHB (HEATX)Hot/cold outlet temperature approach = 5 K Recovers waste heat from the outlet of the gasifier to generate process steam (at 1 bar) from boiler feed water (BFW) at T = 25 °C.
SC-RATIO
(CALCULATOR)
Fortran expressionSets the molar flow rate of BFW “steam-carbon ratio” times the flow rate of methane in the feed.
WGS (REQUIL)P = 0 bar (no pressure drop)
Duty = 0 cal/s
CO + H2O↔ CO2 + H2
Carries out the water–gas shift reaction by taking equilibrium conversion at the specified conditions.
AFCOOLER (HEATER)T = 25 °C
P = 0 bar (no pressure drop)
Cools the syngas to ambient temperature so that nearly all the water is condensed out.
KNOCKOUT (FLASH2)Duty = 0 cal/s
P = 0 bar (no pressure drop)
Acts as an adiabatic two-phase separator.
ADSORBER (RSTOIC)P = 0 bar (no pressure drop)
T = 40 °C
CaO (solid) + CO2 → CaCO3 (solid)
Presents simple modelling of chemical adsorption of CO2 on CaO to form carbonate, assuming complete conversion with an excess of sorbent going into the reactor.
DUPLICAT
(DUPLICATE)
-Duplicates a stream into its multiple copies.
ANALYSIS
(SEPARATOR)
For H2O + IMPU stream, split fraction = 1 for water, H2S, HCl and NH3 components, while the rest of the components are set to zeroGenerates dry and contaminant free stream of syngas for comparison with results in the literature.
Table 3. Proximate and ultimate analyses of the biomass feedstocks.
%Cassava Peel [82]MSW [83]Cow Dung [84]
Carbon47.2135.133.07
Hydrogen7.444.74.87
Nitrogen1.351.42.90
Oxygen43.7016.158.33
Sulphur0.040.20.63
Moisture 7.2945.87.75
Ash1,9242.625.3
Volatile68.1651.154.55
Fixed Carbon22.636.312.40
Table 4. Disaggregated vehicle composition and fuel type.
Vehicle TypeFuel TechnologyFuel Technology (%)Mileage (km) [67]Fuel Economy
(L/100 km) [85]
Car/SaloonGasoline9917,0009.08
Diesel1 9.08
MotorcycleGasoline10070003.25
Minibus/OmnibusGasoline8530,00025.64
Diesel15
Van and PickupDiesel2530,00013.15
Gasoline75
Truck/TankerDiesel10033,50028.57
Table 5. Estimated flow rates of biomass feedstock.
Selected CityFood Waste
(Metric Tons/Year)
Cassava Peel
(Metric Tons/Year)
Cow Dung
(Metric Tons/Year)
Abuja30,604555,0001,264,280
Enugu53,844555,000175,594
Port-Harcourt39,260555,000175,594
Lagos147,034555,000175,594
Kaduna117,519555,0001,264,280
Bauchi35,139555,0001,264,280
Table 6. The validation of the simulation model using RDF and wood chips as feedstock.
Feedstock: RDF; ER= 0.1 STBR = 0.4Feedstock: Wood Chips; No Air Introduced STBR = 0.75
Syngas Composition
(vol % Dry and NH3, H2S and HCl Free)
Literature [45]Model (This Study)Literature [50,80]Model (This Study)
H242.443.945.842.44
CO33.823.4220.7924.3
CO213.518.9920.1919.80
CH410.313.6811.2213.5
Syngas LHV (dry at 0 °C and 1 atm)16.2 MJ/kg15.6 MJ/kg11.6 MJ/m311.85 MJ/m3 at 15.6 °C (15.3 MJ/kg)
CGE (LHV and mass basis)83.380.075.380.12
Table 7. Results of the Aspen Plus simulations for the selected cities.
Selected CityMethane Content in Syngas (%)H2 Content in Syngas (%)CO Content in Syngas (%)Hydrogen Gas Produced (Tonnes/Year)
Abuja1.1962.6141,511
Enugu2.7915.583,677
Port-Harcourt2.8915.782,433
Lagos2.4924.791,458
Kaduna1.0952.4147,918
Bauchi1.1952.6141,841
Table 8. Gasoline consumption from the disaggregated vehicle composition.
Selected CityGasoline Consumption (Billion L)Cars/Saloons (N)Motorcycles (N)Vans (N)Minibuses/Omnibuses (N)
Abuja0.10451032,06216873585
Enugu0.24104,81974,50639218332
Port Harcourt0.38166,754118,530623813,256
Lagos0.67292,328207,79010,93623,240
Kaduna0.46196,097139,387733615,589
Bauchi0.34149,251106,089558311,865
Table 9. Diesel consumption from the disaggregated vehicle composition.
Selected CityDiesel Consumption (Million L)Cars/Saloons (N)Mini/Omnibuses (N)Heavy Trucks (N)Vans (N)
Abuja5.98456632843422
Enugu13.89105914701961980
Port Harcourt22.101684233931191559
Lagos38.752952410154682734
Kaduna26.001980275136681834
Bauchi19.781507209327911396
Table 10. CO2 emissions from gasoline and diesel.
Selected CityStock of Vehicles (N)CO2 Emissions from Diesel (Billion kg)CO2 Emissions from Gasoline (Billion kg)
Abuja84,3740.040.26
Enugu196,0700.090.59
Port-Harcourt311,9220.150.94
Lagos546,8160.271.67
Kaduna366,8100.181.11
Bauchi279,1830.140.84
Table 11. Avoided CO2 emissions from replacing gasoline consumption with the equivalent volume of hydrogen.
Selected CityVolume of Hydrogen Gas Produced (Billion L)Volume of Gasoline Replaced (Billion L)Avoided CO2 Emissions from Replacing Gasoline Consumption (Billion kg)
Abuja3.200.651.52
Enugu1.890.380.90
Port Harcourt1.860.370.89
Lagos2.070.420.98
Kaduna3.340.681.59
Bauchi3.210.651.53
Table 12. Avoided CO2 emissions from the replacement of diesel consumption with the equivalent volume of hydrogen.
Selected CityVolume of Hydrogen Gas Produced (Billion L)Volume of Diesel Replaced (Billion L)Avoided CO2 Emissions from Replacing Diesel Consumption (Billion kg)
Abuja3.200.541.45
Enugu1.890.320.86
Port Harcourt1.860.320.85
Lagos2.070.350.94
Kaduna3.340.561.52
Bauchi3.210.541.46
Publisher’s Note: MDPI stays neutral with regard to jurisdictional claims in published maps and institutional affiliations.

