1. Introduction
Concerns over climate change, constraints on energy resources, stringent regulations on emissions and poor energy efficiency are all pushing the transportation industry to focus more on alternative technologies, such as hybrid electric vehicles (HEVs) [
1]. Plugin HEVs (PHEVs) have become the prime focus in recent times. The key goal for using the full potential of hybridisation is by developing an intelligent real-time implementable energy management strategy (EMS).
Studies have suggested that energy management controllers for HEVs can be divided into rule-based controllers and optimisation-based controllers [
2,
3,
4]. Rule-based controllers are based on predefined rules based on experience, calibration and tuning of controllers for the desired output without prior knowledge of the trip [
5,
6]. A hybrid electric vehicle is more sensitive to a driving cycle than an internal combustion vehicle when fuel consumption and tailpipe emissions are concerned [
7]. Studies show that real-world drive cycles and driving trends have a large negative impact on fuel consumption and exhaust emissions with a traditional rule-based EMS used in hybrid vehicles [
8]. Optimisation controllers overcome the inherent rigidity of rule-based controllers by using an optimal control strategy that minimises a cost function [
9,
10].
One of the most popular solutions for the real-time optimisation of the energy management controller is the equivalent fuel-consumption minimisation strategy (ECMS) and it is generally accepted to be a promising real-time controller because of its feasibility and optimality [
4,
11,
12]. The equivalent consumption minimisation strategy is an instantaneous approach derived from Pontryagin’s Minimum Principle [
11]. Unlike many optimisation strategies, the ECMS does not require an a priori driving profile to exist before optimisation. Feasibility along with fast computation makes ECMS a potentially real-time implementable strategy. However, one of the most important challenges in implementing an ECMS in the production of hybrid electric vehicles is the estimation and adaptation of equivalence factor for real-world driving because the optimal equivalence factor is not readily available without the trip information. Using an optimally tuned equivalence factor for a specific drive cycle does not guarantee the optimality of the ECMS controller for other driving data and by doing so, the actual purpose of using optimal control is completely lost. Adapting the equivalence factor for on-road driving conditions accurately is essential for the optimal working of ECMS. The optimal equivalence factor significantly affects the fuel economy, and the size of this effect varies with the drive cycle [
12]. Therefore, precise estimation of the equivalence factor is crucial for the performance of the ECMS and a challenge for successful implementation on the production vehicle.
Unlike a four-wheeler, with a two-wheeler, the cost for hybridisation causes a larger change of marginal cost in the production of the vehicle [
13]. This drives a need for a cost-effective, adaptive ECMS controller, which has a low offline and online computational load. The real-world drive data would not necessarily be like any of the standardised drive cycles or previously collected on-road driving data sets. Storage of thousands of potential drive cycles on board a two-wheeler is not feasible. Thus, the hybrid two-wheeler platform requires a cost-effective solution, and this manuscript reports a methodology based on drive cycle recognition to adapt the equivalence factor with precision and efficient computation for the hybrid two-wheeler.
There is limited literature found for online adaptation of equivalence factors based on driving cycle or pattern recognition for ECMS implementation. In the paper [
14], a similarity weight is assigned to each reference driving cycle using a fuzzy clustering method. Fuzzy weights represent the similarity of an unknown driving cycle to each of the reference driving cycles. Thus, drive cycle recognition is used for estimating the drive cycle and thereby estimating the equivalence factor online for ECMS. Musardo et al. implemented an adaptive ECMS method by updating the equivalence factor online by predicting the future driving cycles using a neural network. This method provided an online estimation of the equivalence factor [
11]. This method showed results very close to those obtained using a global optimal solution; dynamic programming (DP). However, the method required additional computation load to implement the predictor, which would not be a suitable solution for a low-cost energy management application. Jeon et al. first generated five representative driving patterns (RDP) by rules. A rule-based control algorithm was extracted from the result of the optimal solution provided by dynamic programming (DP) on each RDP. Finally, a multi-mode driving control was realised by switching the control parameters in each RDP [
15]. However, this method requires large computational capability. In 2009, Huang et al. used four features of drive cycle characteristics for distinguishing between the driving cycle types for the equivalence factor adaptation for ECMS implementation. However, the fuel benefit of this method was not evaluated [
5]. The study considered only two standardised driving cycle types with two non-fuzzy rule-based control strategies for each of the driving cycles. Most of the research in the literature focuses on the fuzzy logic algorithm to predict the driving cycle, the driving intention, or the driving patterns for adaptive equivalence factors for online ECMS implementation. Most of the considered literature used statistical and stochastic velocity forecast approaches for energy management optimisation. However, a study done by Chao et al. [
16] demonstrates that a data-driven neural network (NN) exhibits better performance when compared to statistical and stochastic prediction approaches concerning the prediction precision and computational cost.
Neural networks (NNs) have been used successfully for many applications such as pattern classification, decision-making, predicting and adaptive control [
17]. The data-driven type classifiers exhibit the best performance as they can learn the short-term driving behaviour of a vehicle and capture its nonlinearity with low computation and high precision [
18]. A well-designed NN can fit into a look-up table and can adapt itself by training to update the table data. It is a powerful computational method, which learns and generalises from training data. Therefore, it would be very beneficial to use NN for the drive cycle recognition and estimation of equivalence factors for the successful implementation of ECMS online. Langari and Won proposed an intelligent energy management agent (IEMA) which is based on a fuzzy rule-based energy management strategy for parallel hybrid vehicles, which contained a learning vector quantisation (LVQ) network roadway type identifier [
9]. During their research, 47 parameters were selected for LVQ classification and most of the drive cycle segments could be correctly classified. Lei et al. analysed the impacts on identification results caused by the dissimilarity measures used in driving pattern recognition (DPR). A micro-trip extraction method is used to optimise the training of the LVQ identifier [
19]. Research results show that realizing DPR through calculating the Euclidean distance is more adaptable. The LVQ neural network recognition algorithms are exactly based on the calculation of Euclidean distances. In the paper [
20], an automated feature extraction scheme based on convolution neural networks (CNNs) and Kernel PCA (KPCA) for real-time driving pattern recognition (RTDPR) is proposed to achieve the consistent performance of the energy management. Simulation and experimental results show that the proposed automated feature extraction strategy outperforms the conventional driving pattern recognition algorithms based on manual feature extraction. In the research study [
21], the authors propose an improved adaptive equivalent consumption minimisation strategy (A-ECMS) based on long-term target driving cycle recognition and short-term vehicle speed prediction, and adapt it to personalised travel characteristics. In the offline part, typical driving cycles of a specific driver is constructed by analysing personalised travel characteristics in the historical driving data, and optimal SOC consumption under each typical driving cycle is optimised by DP. In the online part, the SOC reference trajectory is obtained by recognizing the target driving cycle from intelligent traffic system, and short-term vehicle speed is predicted by nonlinear auto-regressive (NAR) neural network which both adjust EF together. Simulation results show that compared with CD-CS, the fuel consumption of A-ECMS proposed in the paper is reduced by 8.7%. However, this method needs additional information from the Intelligent traffic system which adds cost to the vehicle.
There is no literature found which uses the data-driven LVQNN for drive cycle recognition using limited past drive cycle information for online equivalence factor estimation. In this study, a data-driven LVQNN-based drive cycle recognition based on past data of the driving cycle for online estimation of equivalence factor for ECMS implementation is proposed in this paper. In this study, an advanced adaptive equivalent fuel consumption minimisation strategy, (AECMS) is proposed and developed for the hybrid two-wheeler considered, based on the previously reported ECMS strategy [
22]. An NN-based controller is used for drive cycle recognition and thereby the online estimation of equivalence factor for the adaptive ECMS implementation.
This paper reports the development of a novel control approach to estimate the equivalence factor by classifying the present drive cycle against a range of standardised and real-world drive cycles using the learning vector quantitative neural network (LVQNN) algorithm. This classification is based on eight parameters chosen to characterise the drive cycle. A lookup table is used to estimate the equivalence factor for the modified ECMS optimal controller based on the output from the supervisory controller.
This paper is organised as follows: In
Section 2, the hybrid powertrain configuration is briefly introduced, and a mathematical model is developed for further investigation. In
Section 3, the modified ECMS implementation is explained. In
Section 4, the LVQNN-based control strategy is constructed and optimised using trained data. In
Section 5 the simulation test results are presented and discussed, and the concluding remarks are provided in
Section 6.
2. Vehicle Configuration and Modelling
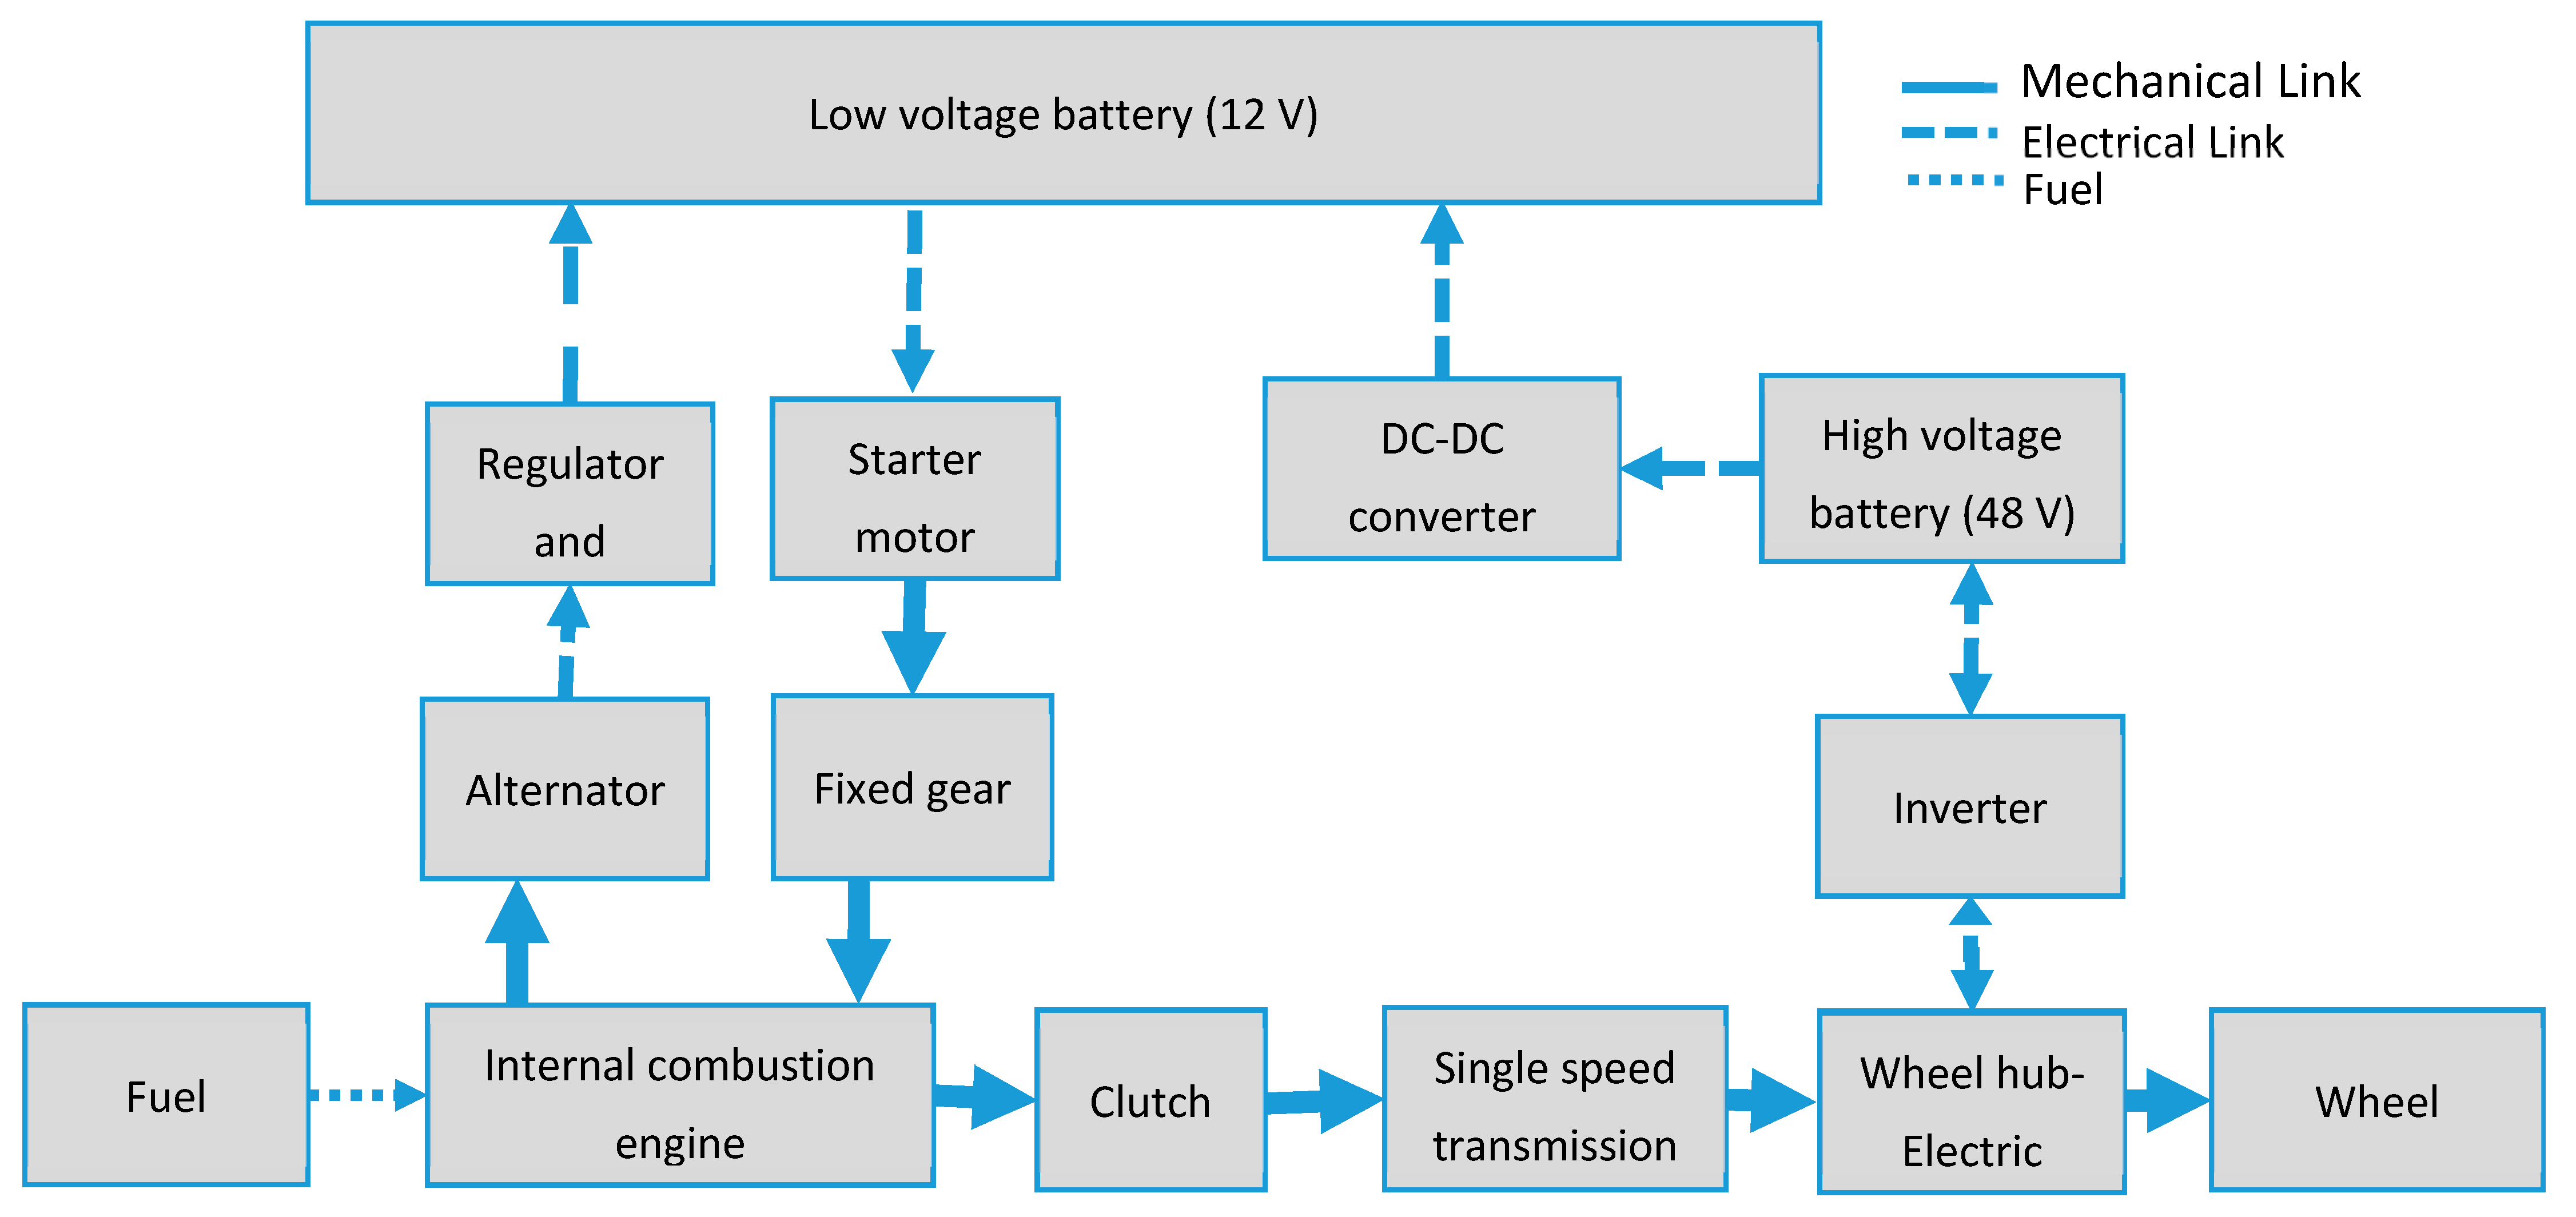
The vehicle considered for this study is a full parallel plugin hybrid concept two-wheeler and the powertrain architecture for the vehicle is as shown in
Figure 1. The system is composed of an engine, a centrifugal clutch, an electric machine, mechanical transmission and an energy storage device (high voltage battery).
Figure 1 shows the mechanical and electrical power flow between the powertrain components. The electric machine is capable of power assist and charging from the engine along with pure electric drive depending on the wheel power requirement and the battery SOC (state of charge). Hard constraints corresponding to the physical limits of the powertrain components are applied to the control input.
Two different approaches to HEV modelling can be adopted: backward or forward-facing modelling concerning the physical causality principles [
23,
24]. The powertrain data for the two-wheeler hybrid available drives this study to use a simplified appropriate backward-facing model for this purpose [
22]. A backward model developed by sourcing the detailed technical specifications and experimental data of engine, electric machine, and battery from the hybrid two-wheeler considered for this study is explained in detail in the previous work by the author published in Energies journal
‘Evaluation of a Modified Equivalent Fuel-Consumption Minimization Strategy Considering Engine Start Frequency and Battery Parameters for a Plugin Hybrid Two-Wheeler—Section 2: Vehicle model and system configuration’ [
22]. The power sources, transmission and control system were developed using MATLAB/Simulink/State flow environment. Since the vehicle is a concept two-wheeler and not production-ready, the actual technical details of the powertrain components are not disclosed. In turn, the normalised values are displayed wherever necessary.
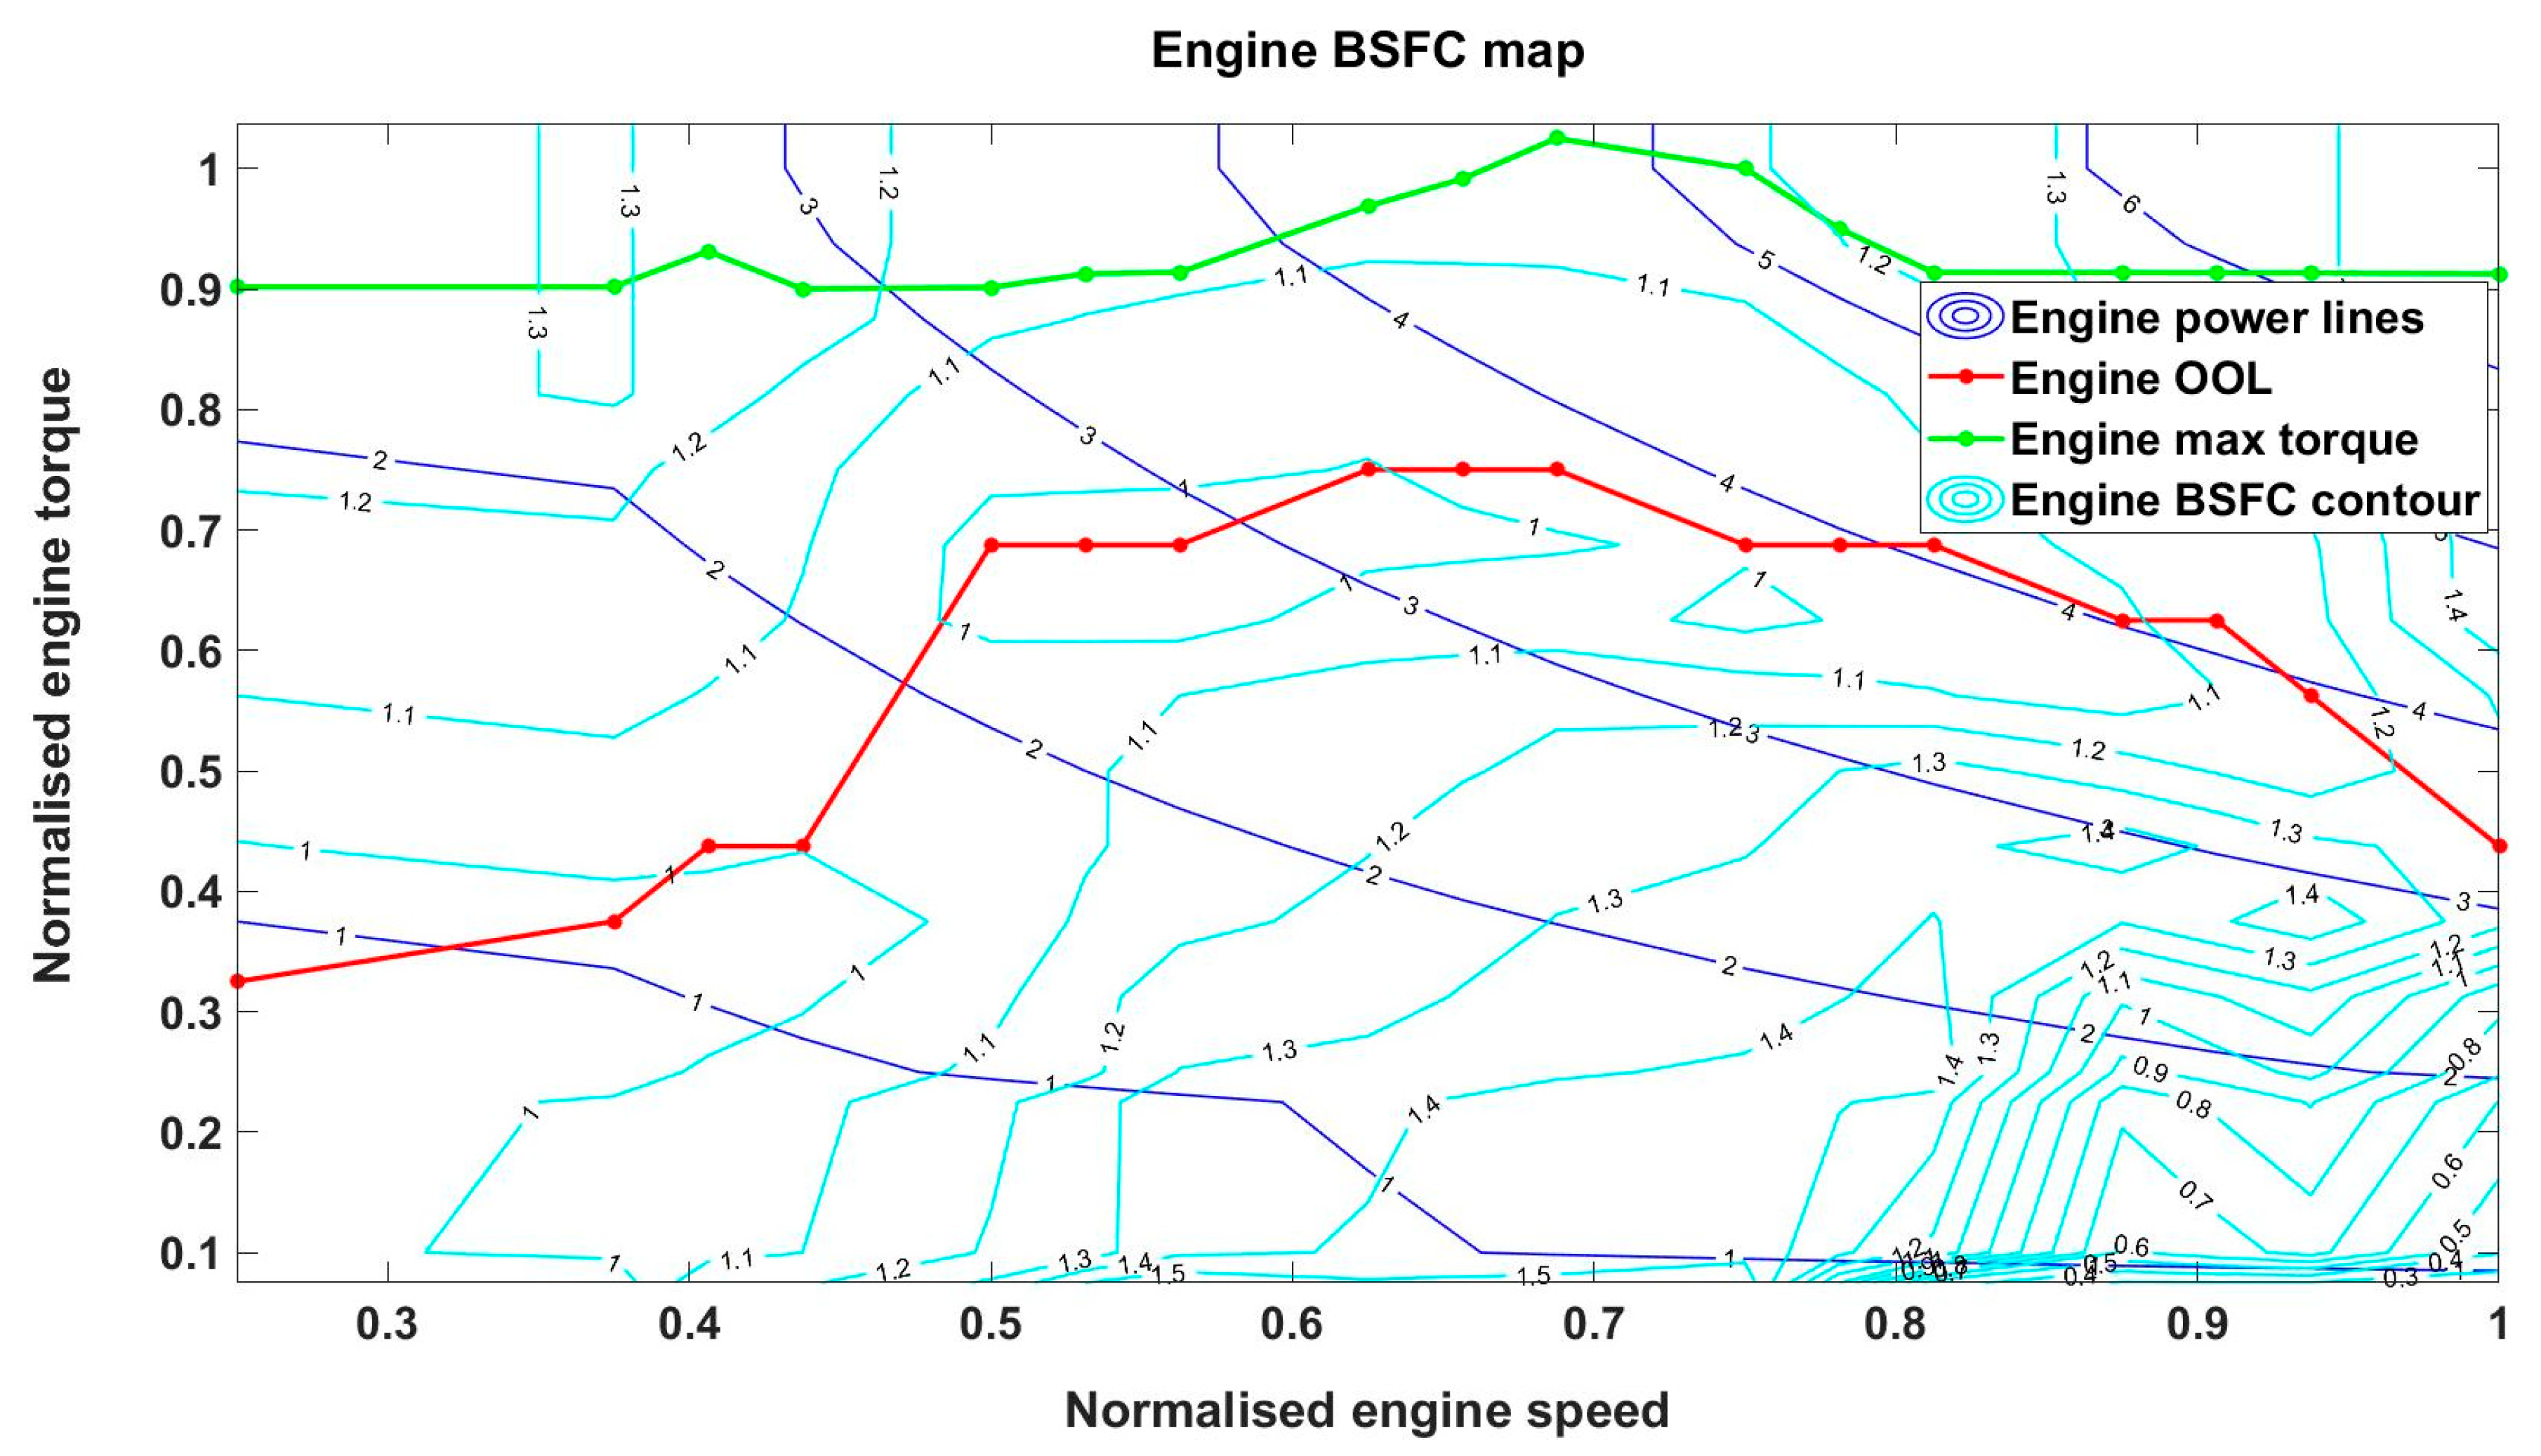
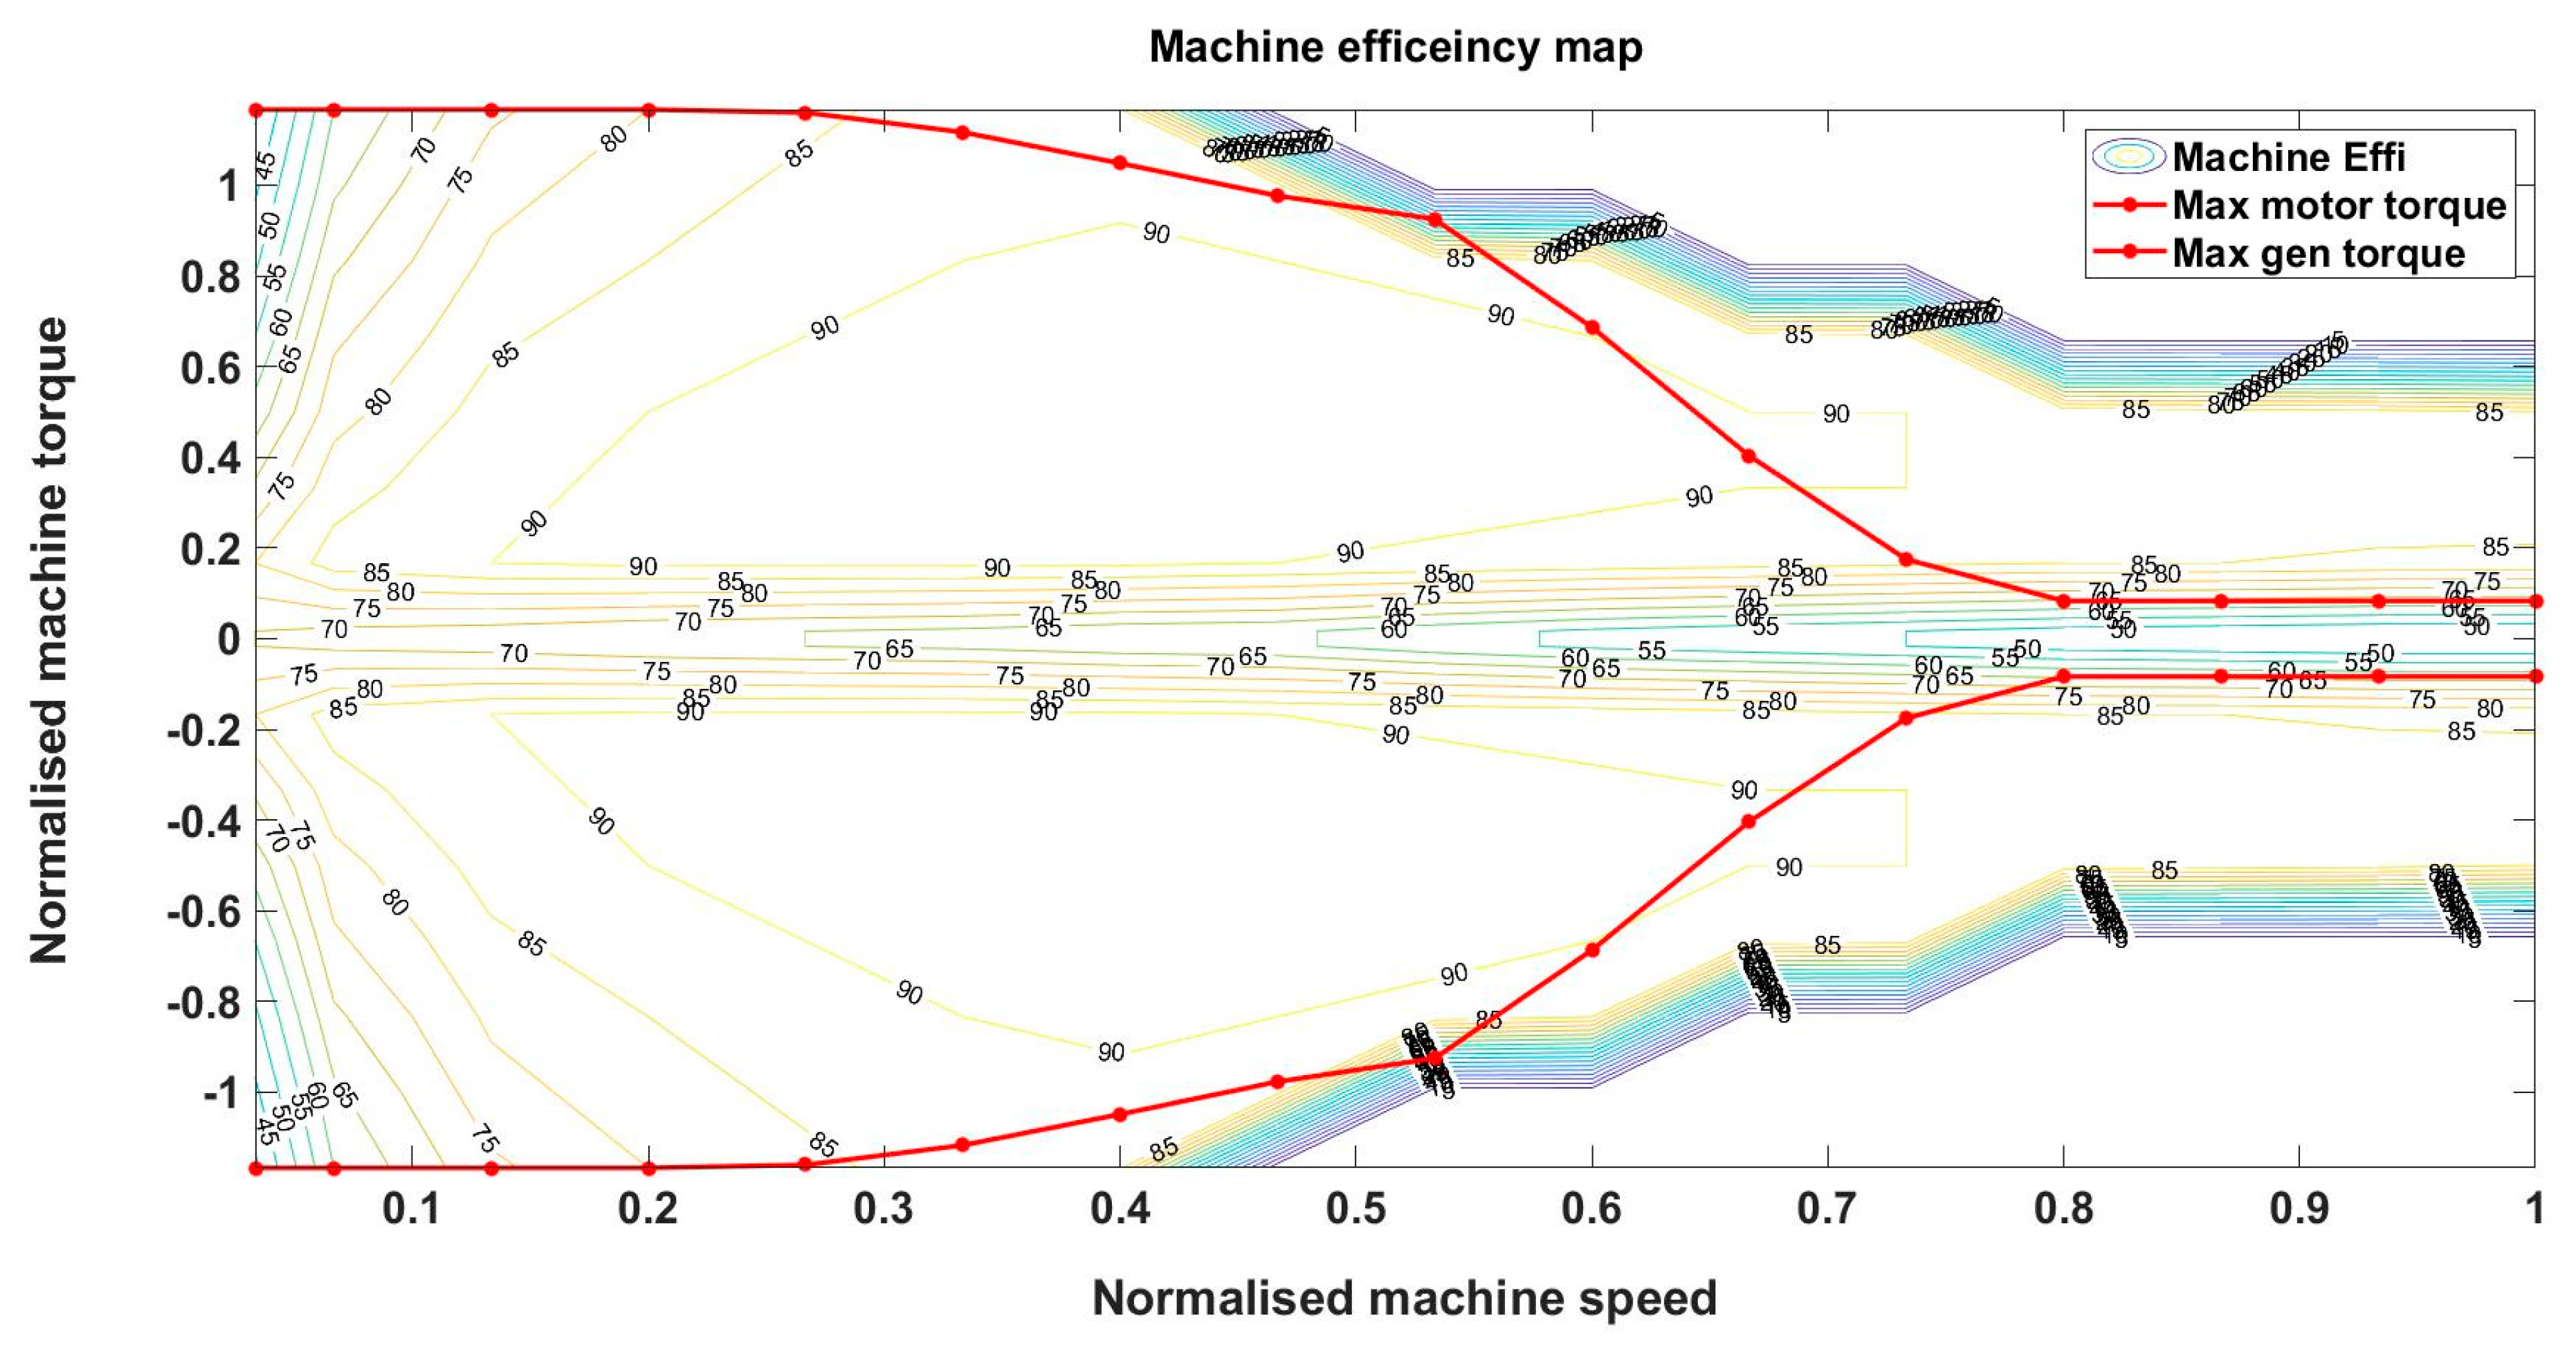
Figure 2 shows the engine characteristics. It shows the engine’s BSFC map, engine power lines, engine max torque and engine optimum operating line. The
Figure 3 shows the efficiency map of the traction machine along with max motor and generator torque.
3. Novel Adaptive Equivalent Fuel Consumption Minimisation Strategy (ECMS_LL)
Previously, a modified novel equivalent fuel consumption minimisation strategy referred to as ECMS_LL has been designed and developed, which is published in [
22]. The proposed modified ECMS attempts its maximum possibility to bring the engine operating points toward the engine optimum operating region by deriving a penalty function and implementing it into the cost function evaluation. The penalty function depends on engine operating points and their deviation from the engine optimum operating line at every time instant. The addition of this penalty function enhances the engine operating towards the engine optimum operating line, thereby improving the mean engine efficiency for the drive cycle considered.
The cost function for the conventional ECMS is represented as follows [
22]:
where
is the instantaneous equivalent fuel consumption,
is the instantaneous fuel consumption from the engine,
is the instantaneous equivalent fuel consumption from the battery power (both in charging and discharging),
s is the equivalence factor, which represents the conversion of electric power into fuel consumption and
is the battery power,
is the low heating value of the fuel. All the parameters in the equations are in SI units.
The novel modified ECMS, ECMS_LL has been developed where the cost function is modified with a new penalty factor based on the deviation of engine operating points from engine optimum operating line (OOL) [
22].
The cost function for the modified ECMS_LL is represented as follows [
22]:
where
is the new penalty factor in the cost function that is based on deviation engine operating point from optimum operating point.
is the fuel efficiency of the engine operating point at a particular time instant, and
is the fuel efficiency of the engine’s optimum operating point at that time instant. The addition of
affects the equivalence factor of conventional ECMS for the charge-sustained requirement. Therefore, while implementing this modified ECMS_LL in real-time, along with the challenge of estimating the equivalence factor ‘
γS’ accurately, there is added task of estimating the penalty weight ‘
β’.
The hybrid electric vehicle is more sensitive to a driving cycle than an internal combustion vehicle when it comes to fuel consumption and tailpipe emissions [
7]. Studies show that real-time drive cycles and driving trends have a large impact on fuel consumption and exhaust emissions of a vehicle [
8]. The optimal equivalence factor significantly influences the fuel economy, and its influence varies with the drive cycle [
12]. This makes it very important to estimate the equivalence factor accurately so that it could have a benefit on the fuel economy. One of the most important challenges in implementing an ECMS in the production of Hybrid electric vehicles is the estimation and adaptation of equivalence factors for real-world driving. Thus, the development of an adaptive ECMS control strategy, which is adaptable, robust and intelligent concerning real-time driving conditions, is required for real-world applications.
5. Evaluation of the Proposed Method for Different Drive Cycles
In this section, the capability of the proposed LVQNN_DCR controller for estimating the equivalence factor is evaluated. LVQNN_DCR is tested and evaluated for all ten-drive cycles shown in
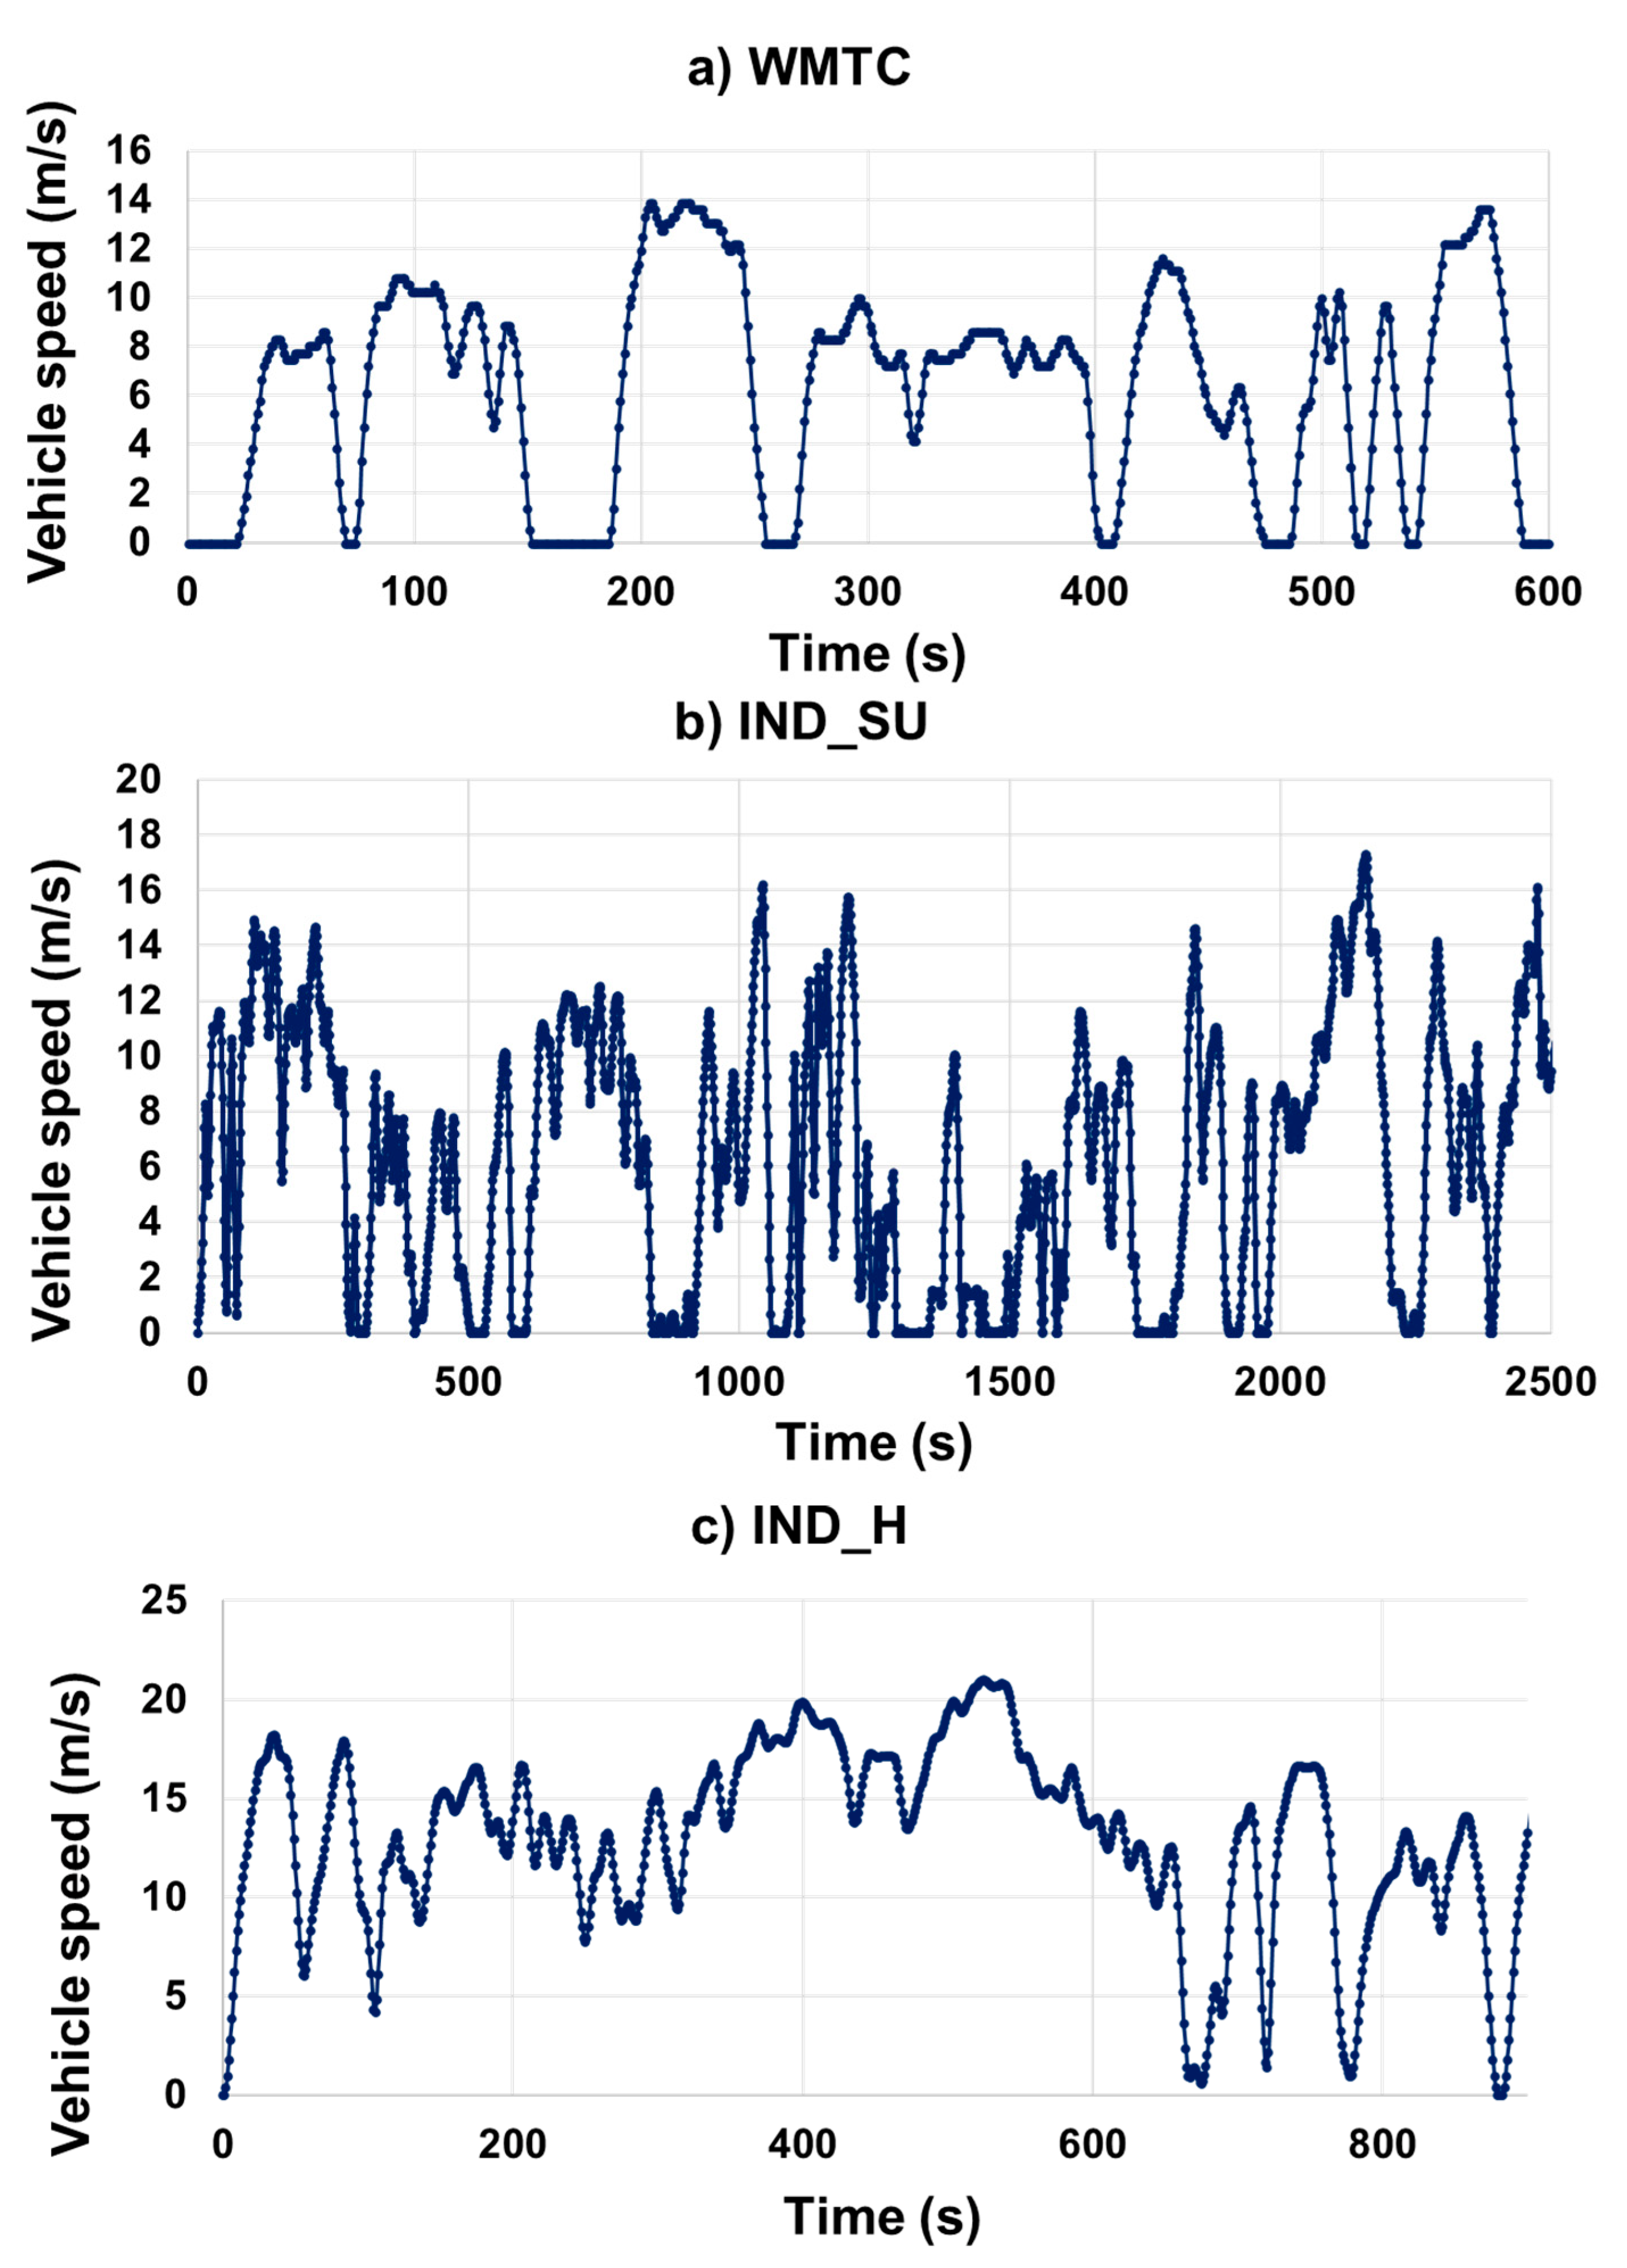
Table 1. From the results obtained from the LVQNN learning, the block LVQNN_DCR is constructed and used for the estimation of the equivalence factor in real-time. The LVQNN_DCR block recognises the candidate/new drive cycle and classifies the drive cycle to the nearest of the standardised drive cycles used for training (WMTC (urban), IND_SU drive cycle (suburban) and IND_H (highway)) as shown in
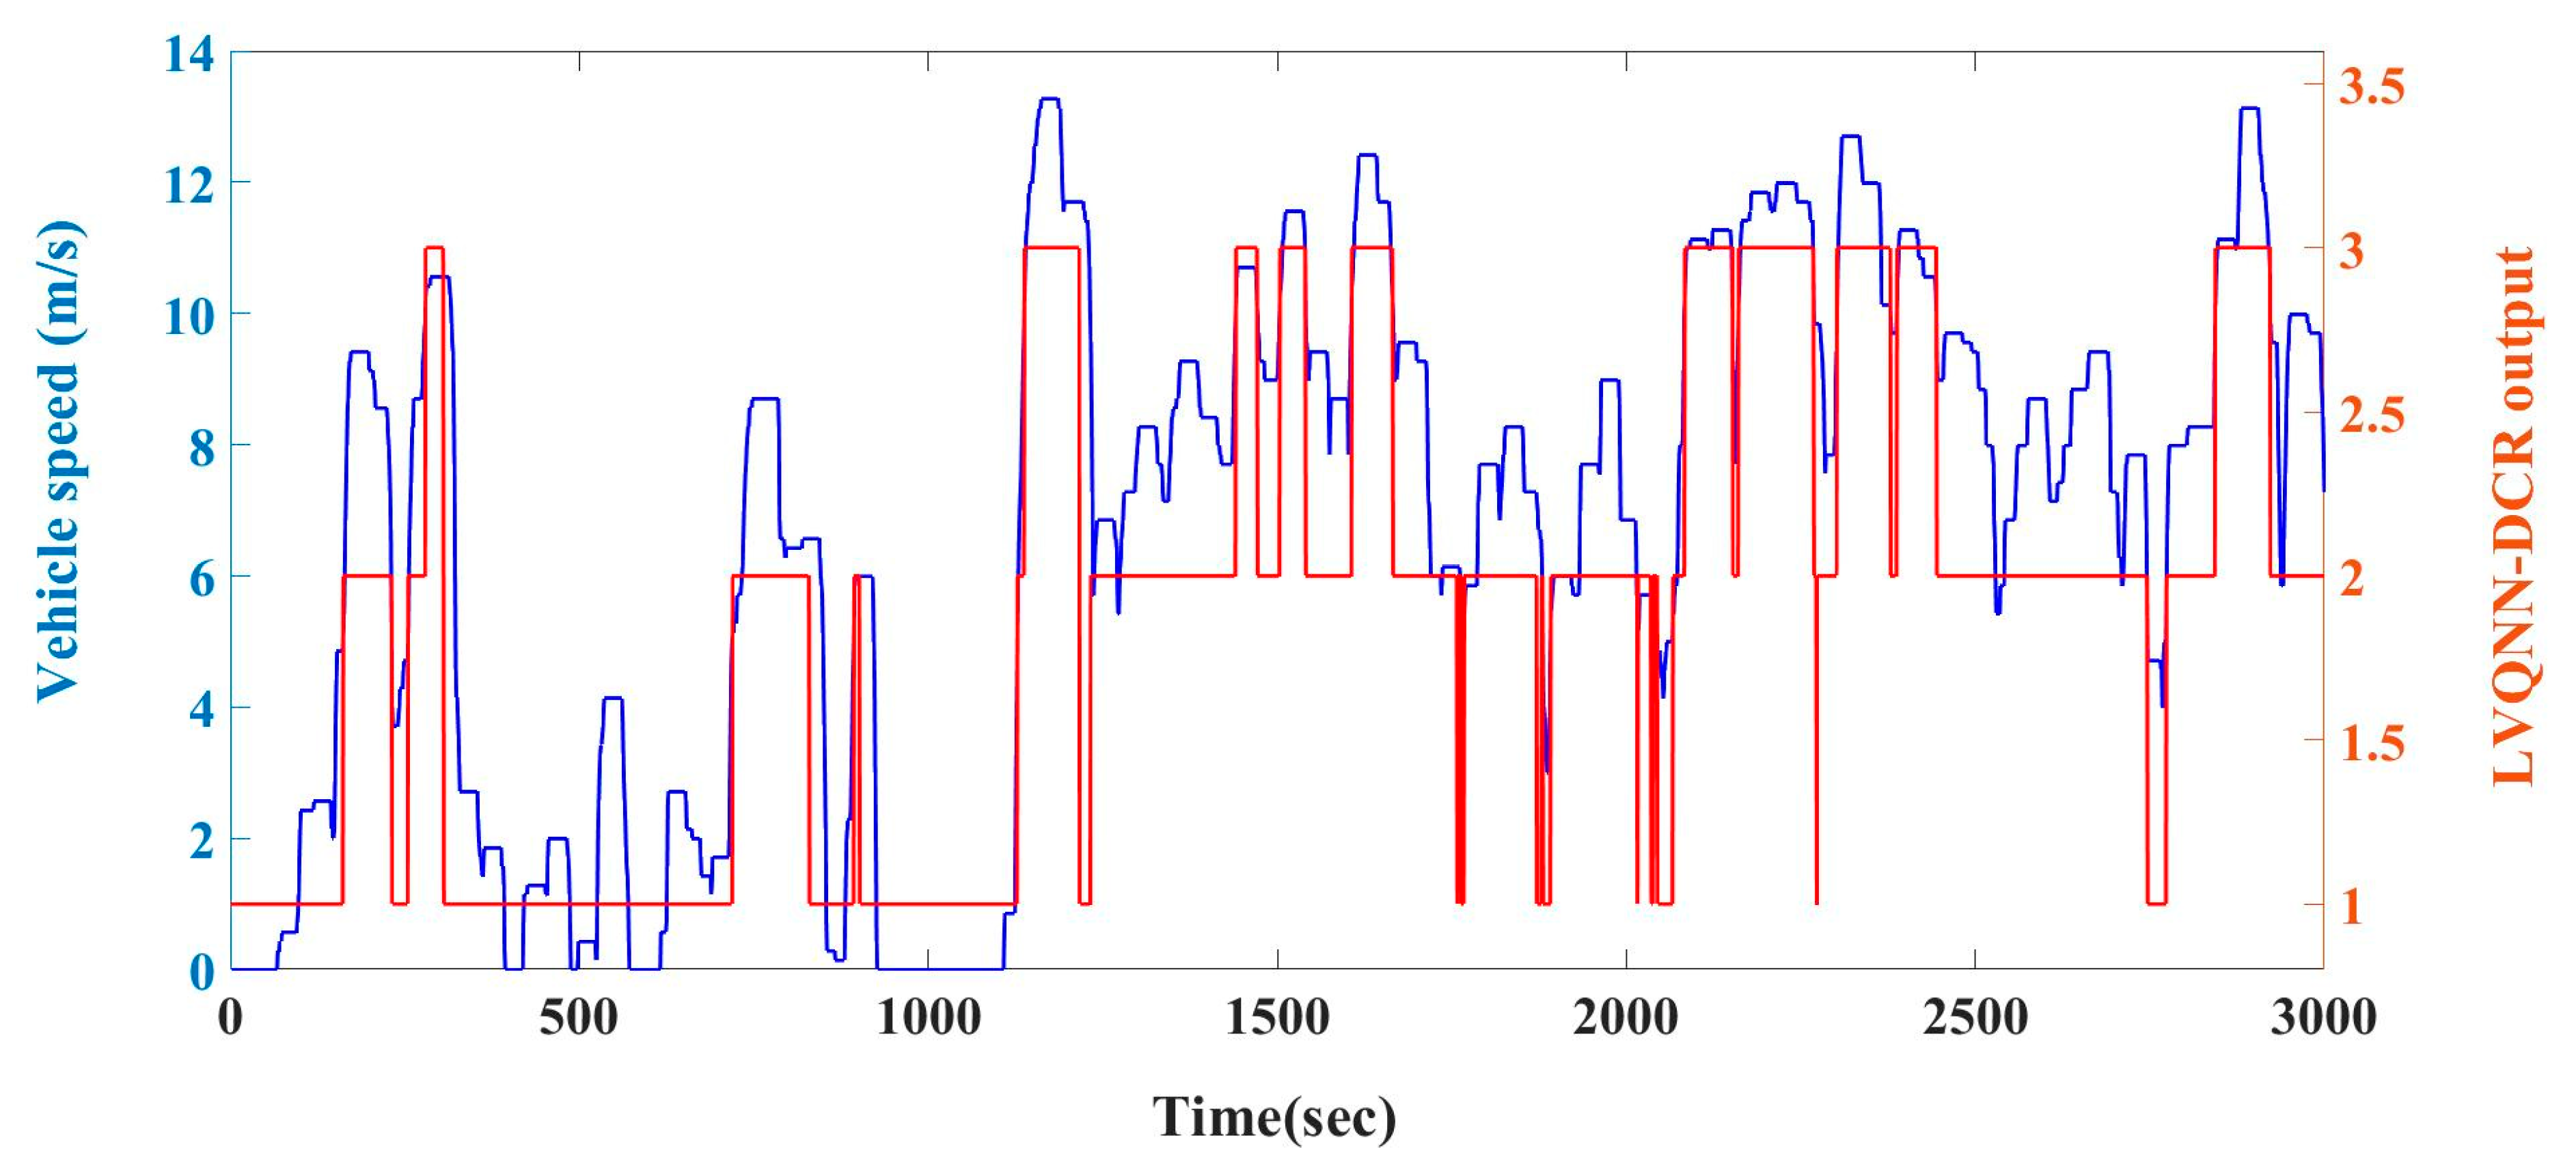
Figure 8. In every time instant, the LVQNN_DCR block evaluates instantaneous equivalence factor based on the drive cycle parameters analysed for previous time windows of 25 s.
Figure 8 shows the LVQNN_DCR block output for the IND_CD input drive cycle; this is an ‘unseen’ real-time drive cycle. The output of LVQNN_DCR varies between 1, 2 and 3. Each number implies the match of the present drive cycle to the respective standardised drive cycles; 1, 2 and 3 correspond to the WMTC, IND_SU and IND_H drive cycles which were used during the LVQNN training respectively. Based on LVQNN_DCR output, the pre-optimised values of equivalence factor stored in a map are used correspondingly.
5.1. Performance Evaluation of LVQNN for Different Drive Cycles
The performance evaluation of the LVQNN is done using root mean square error (RMSE) and R-squared (R
2). The performance of LVQNN was tested for all the ten drives cycles considered for testing and evaluation. The RMSE and R
2 values for different drive cycles are as shown in
Table 4.
R
2 represents the proportion of variance explained by the model. R
2 is formulated as:
SSE is the sum of squared errors, the sum of the squared differences between the actual values and predicted values. SST is the total sum of squares, the sum of the squared differences between the actual values and the mean of the actual values. A model that explains no variance would have an R
2 of 0. A model with an R
2 of 1 would explain all of the variances. Higher scores show better results. Most of the R-squared values in the
Table 4 tested for various drive cycles show that the model covers nearly 98% variance on average.
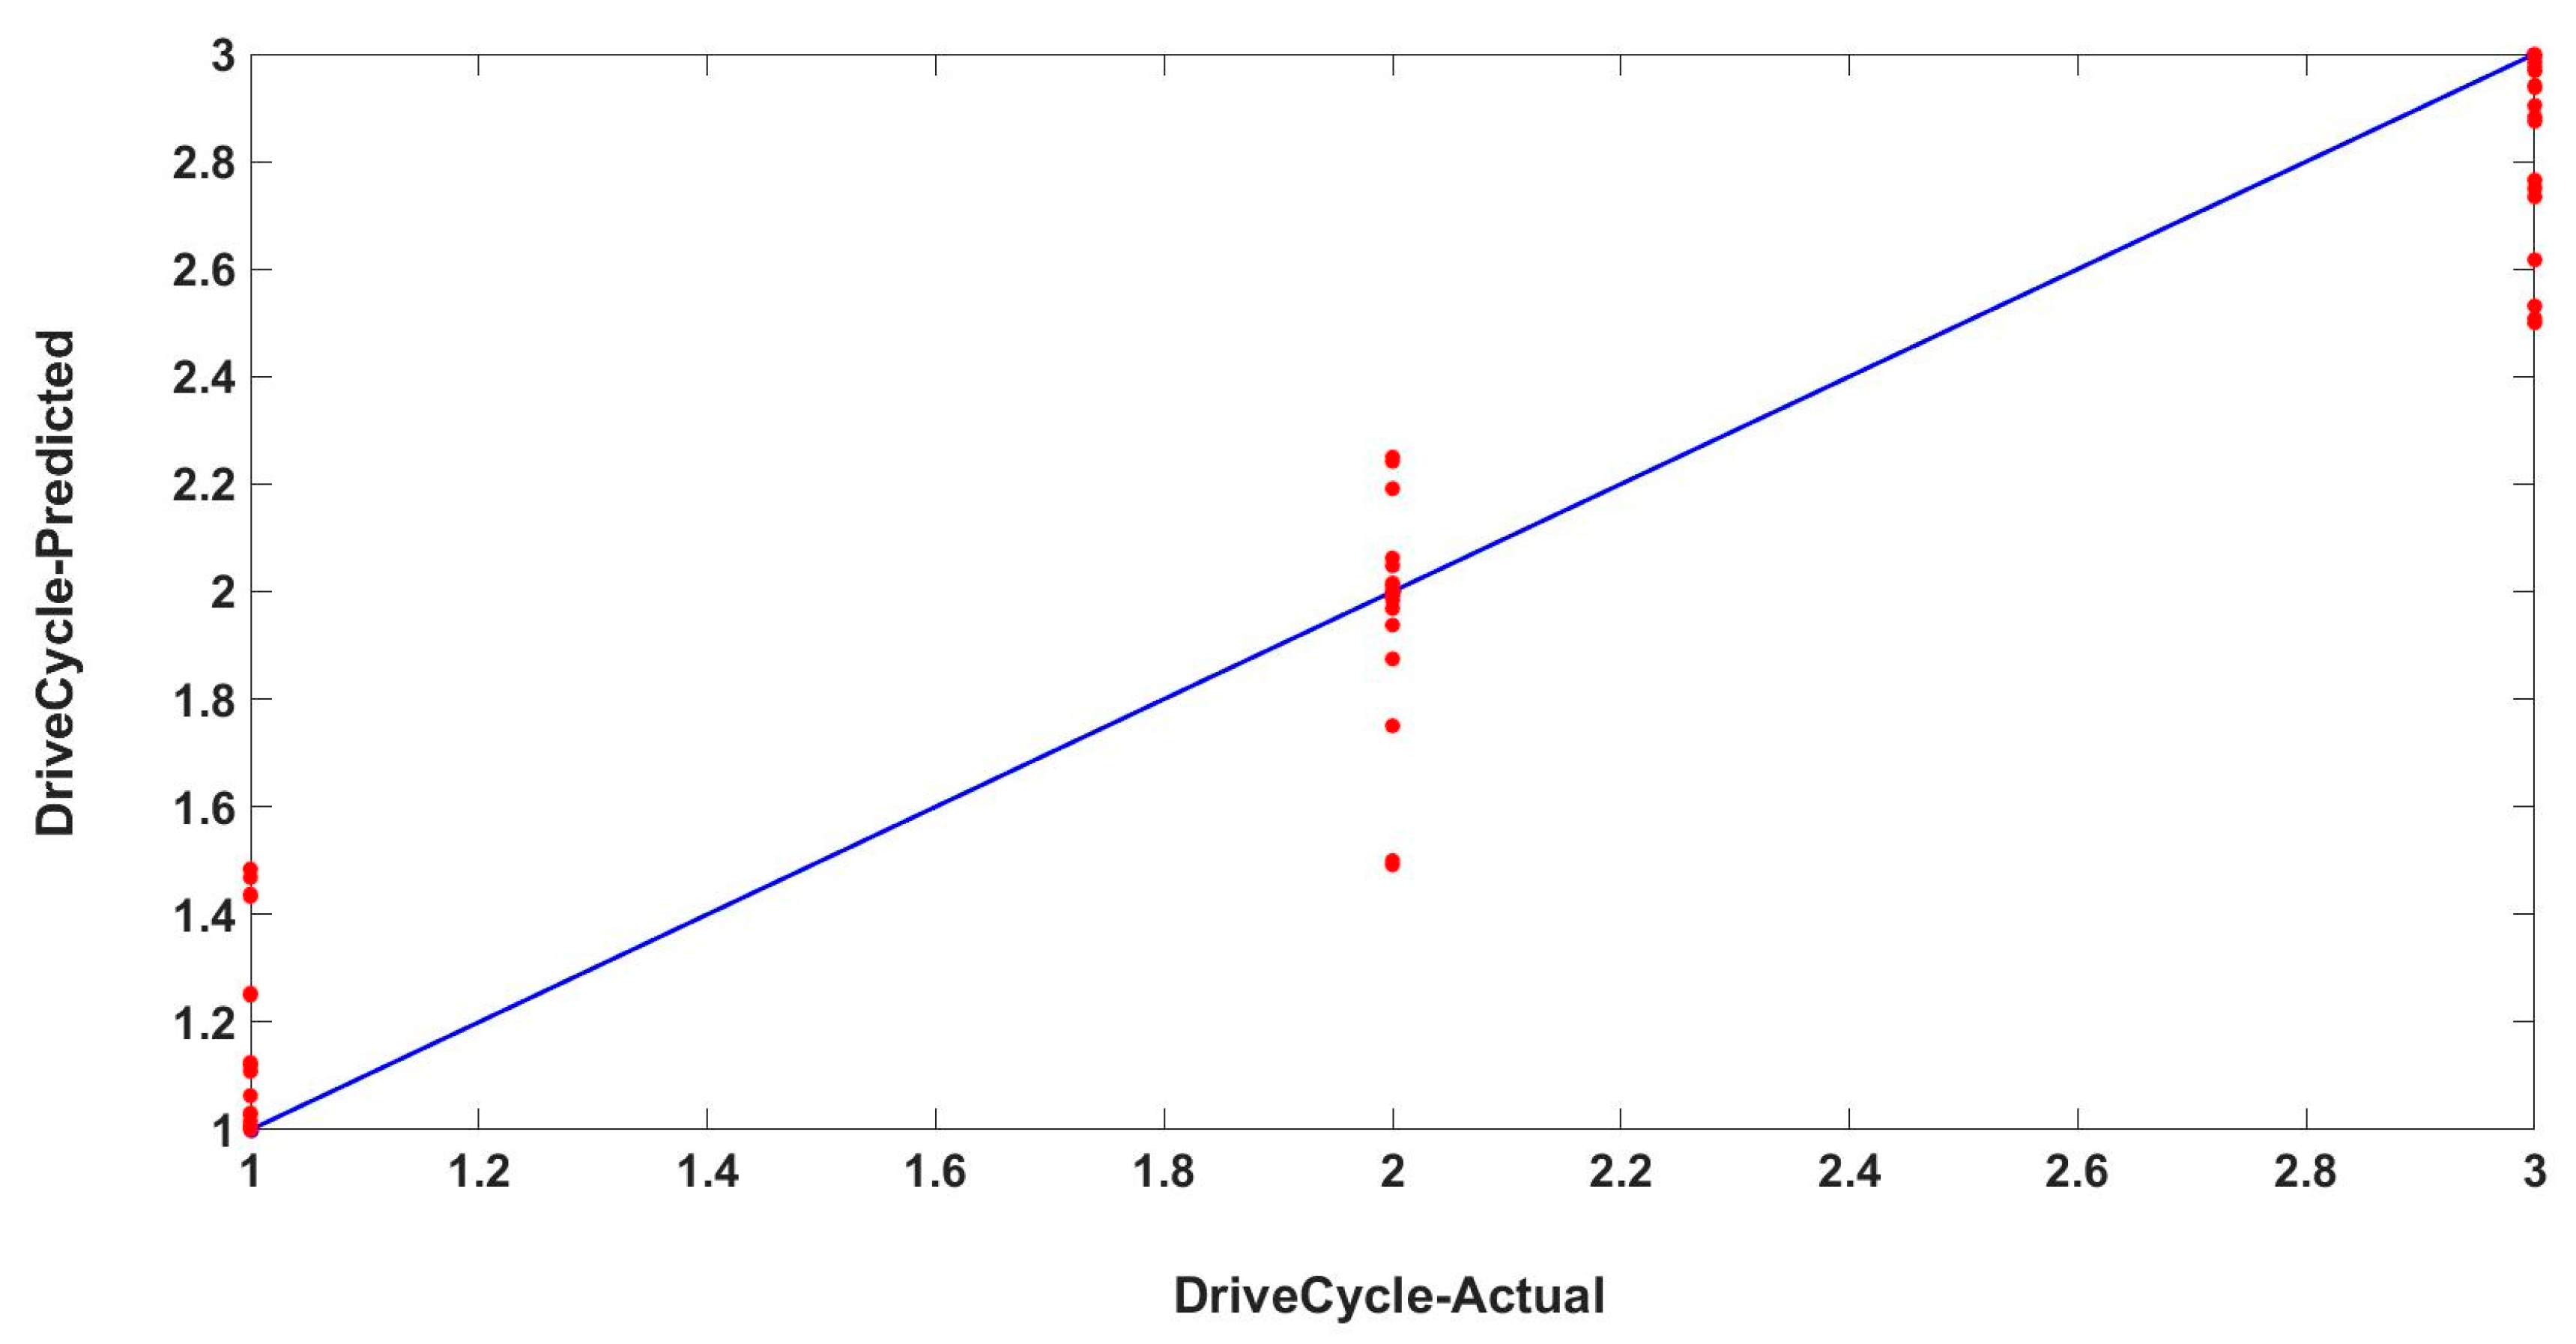
The predicted drive cycles versus the actual drive cycle were plotted for all the drive cycles considered.
Figure 9 shows the plot between the predicted and the actual drive cycle values for real-world test data.
The actual drive cycle data matches one of the three drive cycles used for training and validation (1, 2 and 3 each referring to a particular drive cycle used for training). The predicted drive cycle data are as shown in the figure as red dots. Though there is some variation in the predicted drive cycle, it can predict most of the time within the limits of error.
5.2. FC Comparison for Optimal and Adaptive Equivalence Factor
The ten drive cycles considered for this study were tested with two controllers. First, the manually tuned equivalence factor (EQ
WMTC) in EMCS_LL was optimised for the WMTC drive cycle. Second, the equivalence factor (EQ
LVQNN) in AECMS was derived from the LVQNN-based estimation. The test cycles were run for a standard time of 3000 s, approximately equivalent to 16 km of driving.
Table 5 shows the normalised fuel consumption of both the controllers ECMS_LL and AECMS for ten different drive cycles considered. As seen in
Table 5, a noticeable benefit in fuel savings was achieved with AECMS when compared to ECMS_LL for almost all the drive cycles considered. However, in the case of the WMTC drive cycle, there is a reduction in the fuel benefit when tested with AECMS when compared to using ECMS_LL for obvious reasons.
A maximum of 10.70% fuel benefit was seen by using the LVQNN-based estimation of equivalence factor in AECMS overusing an optimally tuned equivalence factor in ECMS_LL for the IND_CD drive cycle. The fuel economy benefit percentage varies with the drive cycle considered because the equivalence factor estimation is based on the nearest classification of the drive cycle to the standardised drive cycle. The average fuel economy benefits, when tested over the ten drive cycles considered for this study, was 3.93% demonstrating a consistent tangible benefit of this optimisation and adaptation strategy.
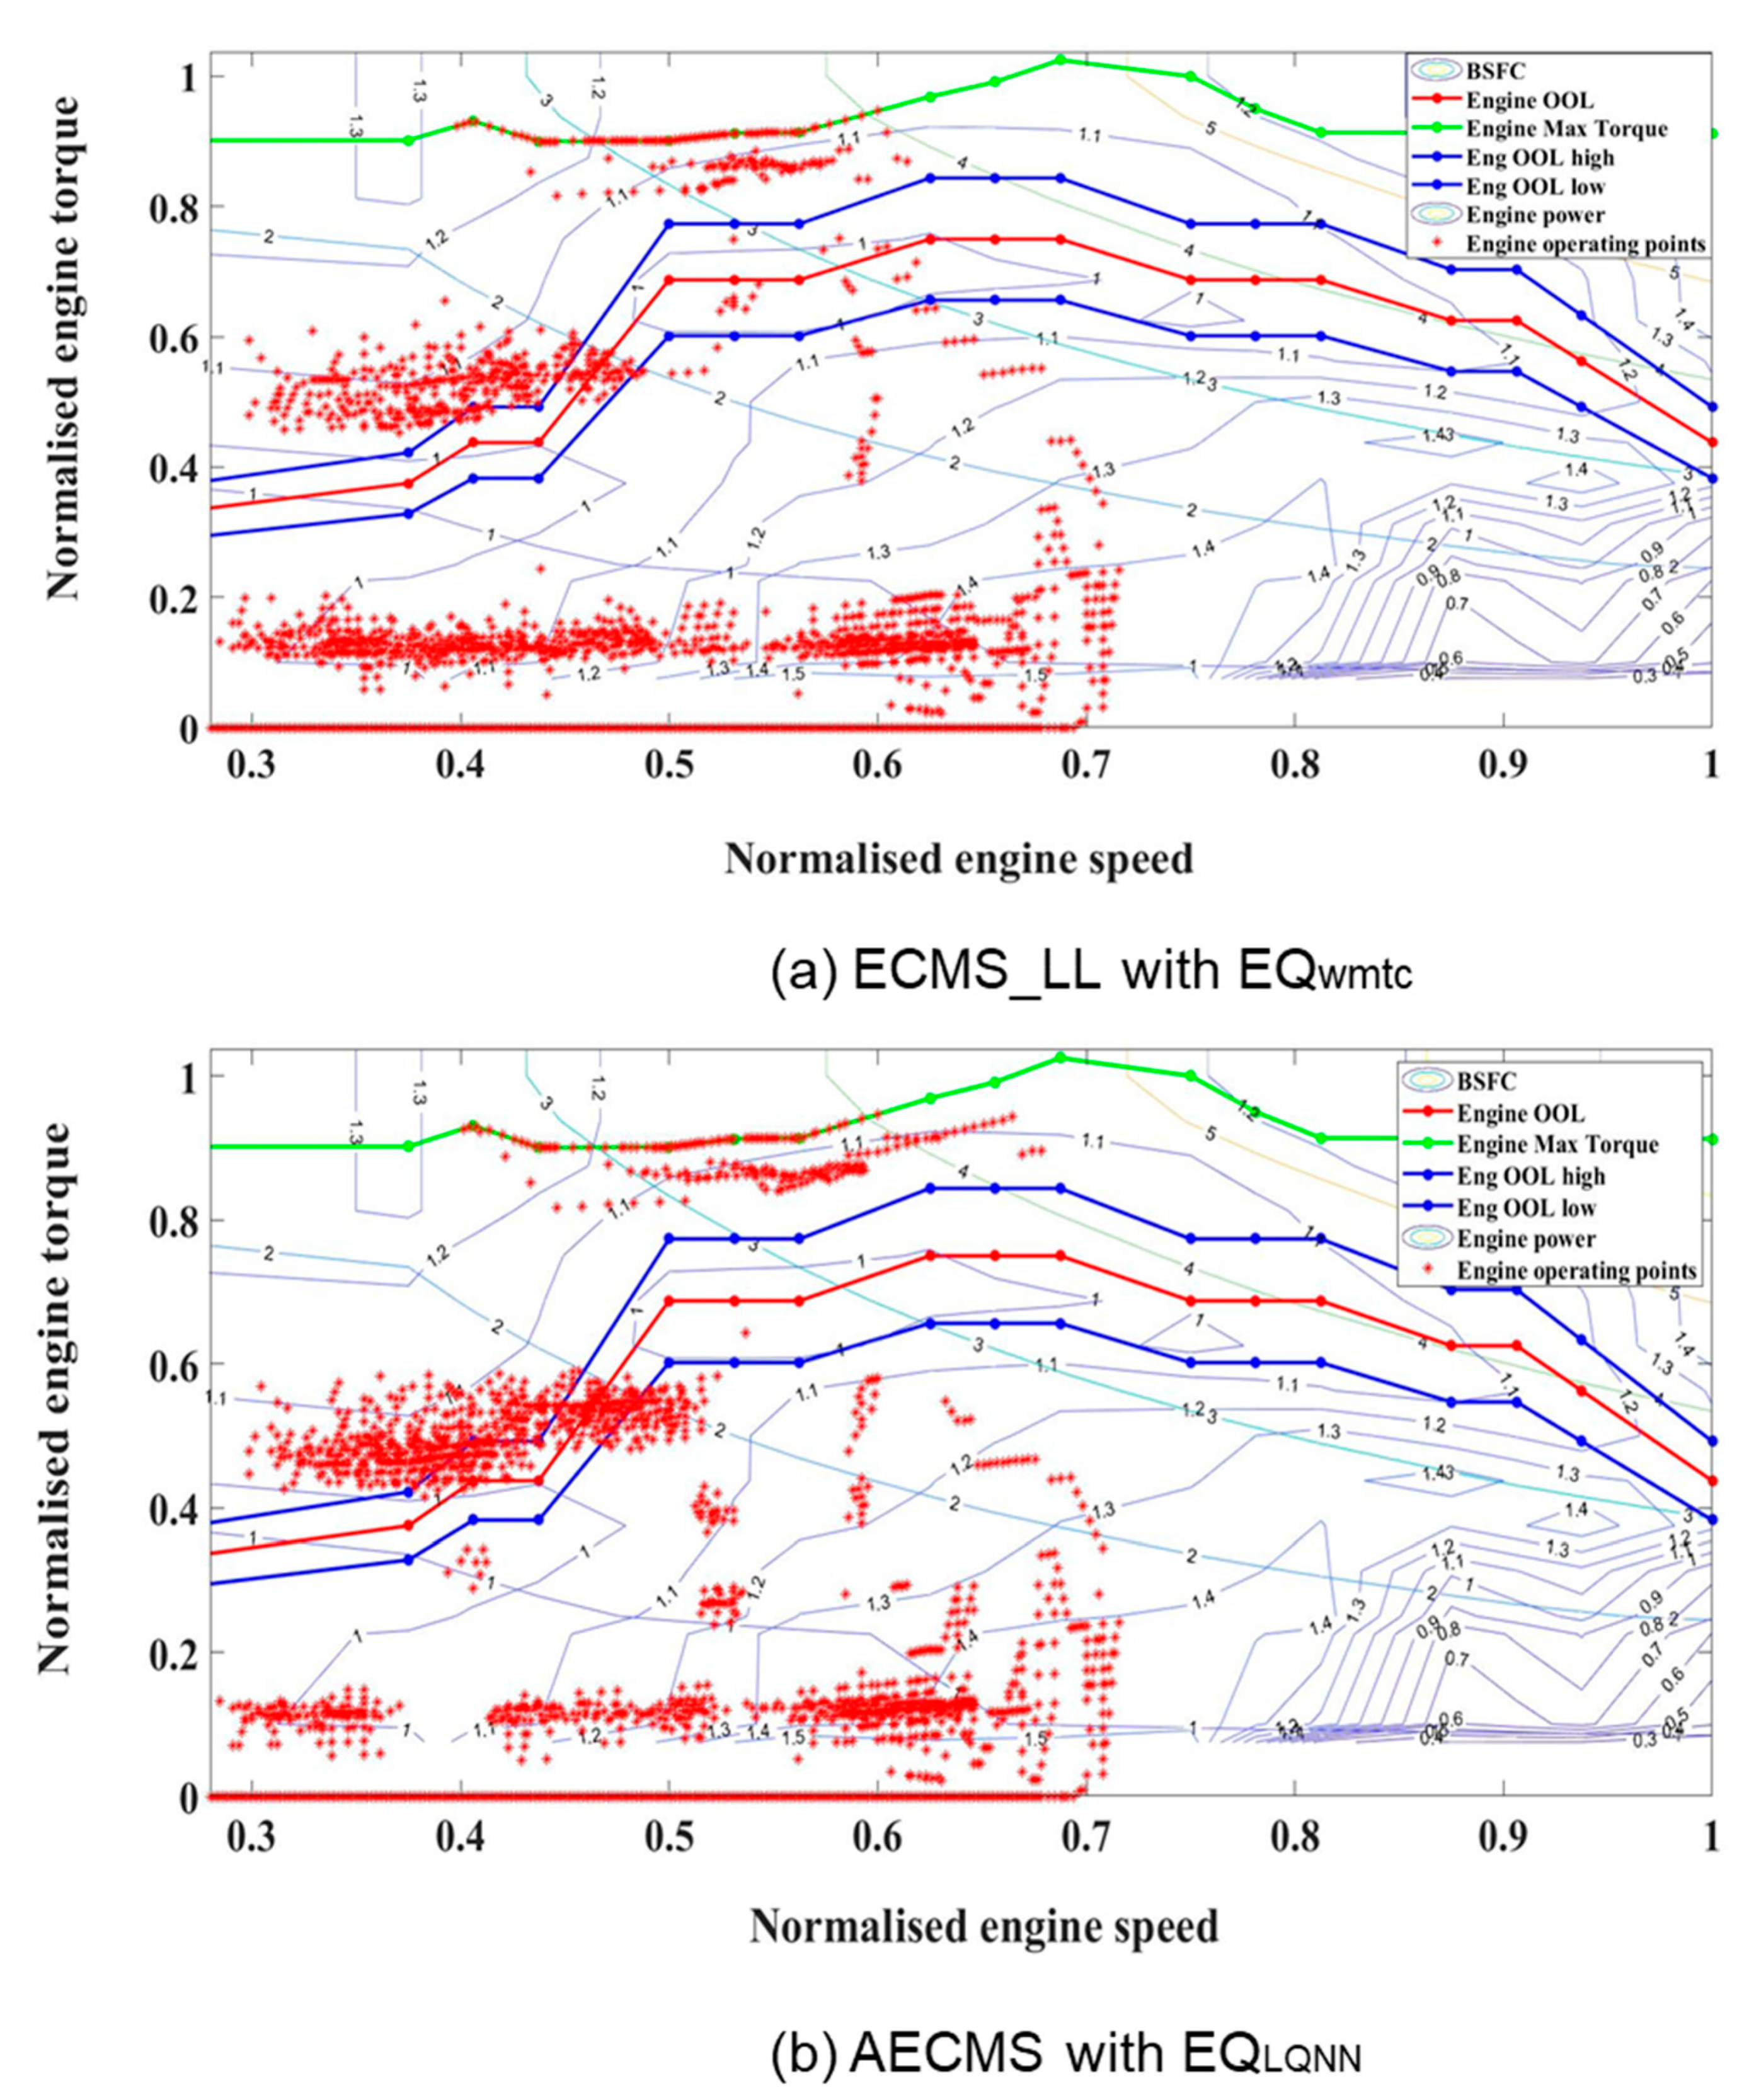
Figure 10 shows the engine operating points for the ECMS_LL (a) and AECMS (b) controllers for the real-world driving data; IDC_CD. The AECMS controller uses the adaptive equivalence factor estimation using LVQNN, and ECMS_LL uses the equivalence factor optimised for the WMTC drive cycle. Thus, because of the better estimation of the equivalence factor with AECMS, the engine operating points are more optimally placed for the entire drive cycle thereby increasing the average engine efficiency.
6. Discussion
The usual methodology of using a conventional ECMS is to manually tune the equivalence factor concerning the drive cycle considered. However, this does not work for a real-world application where the future drive cycles are unknown. Thus, an Adaptive Equivalent fuel Consumption Minimisation Strategy (A-ECMS) is essential to be developed and integrated to obtain a better estimation of the equivalence factor in real-time.
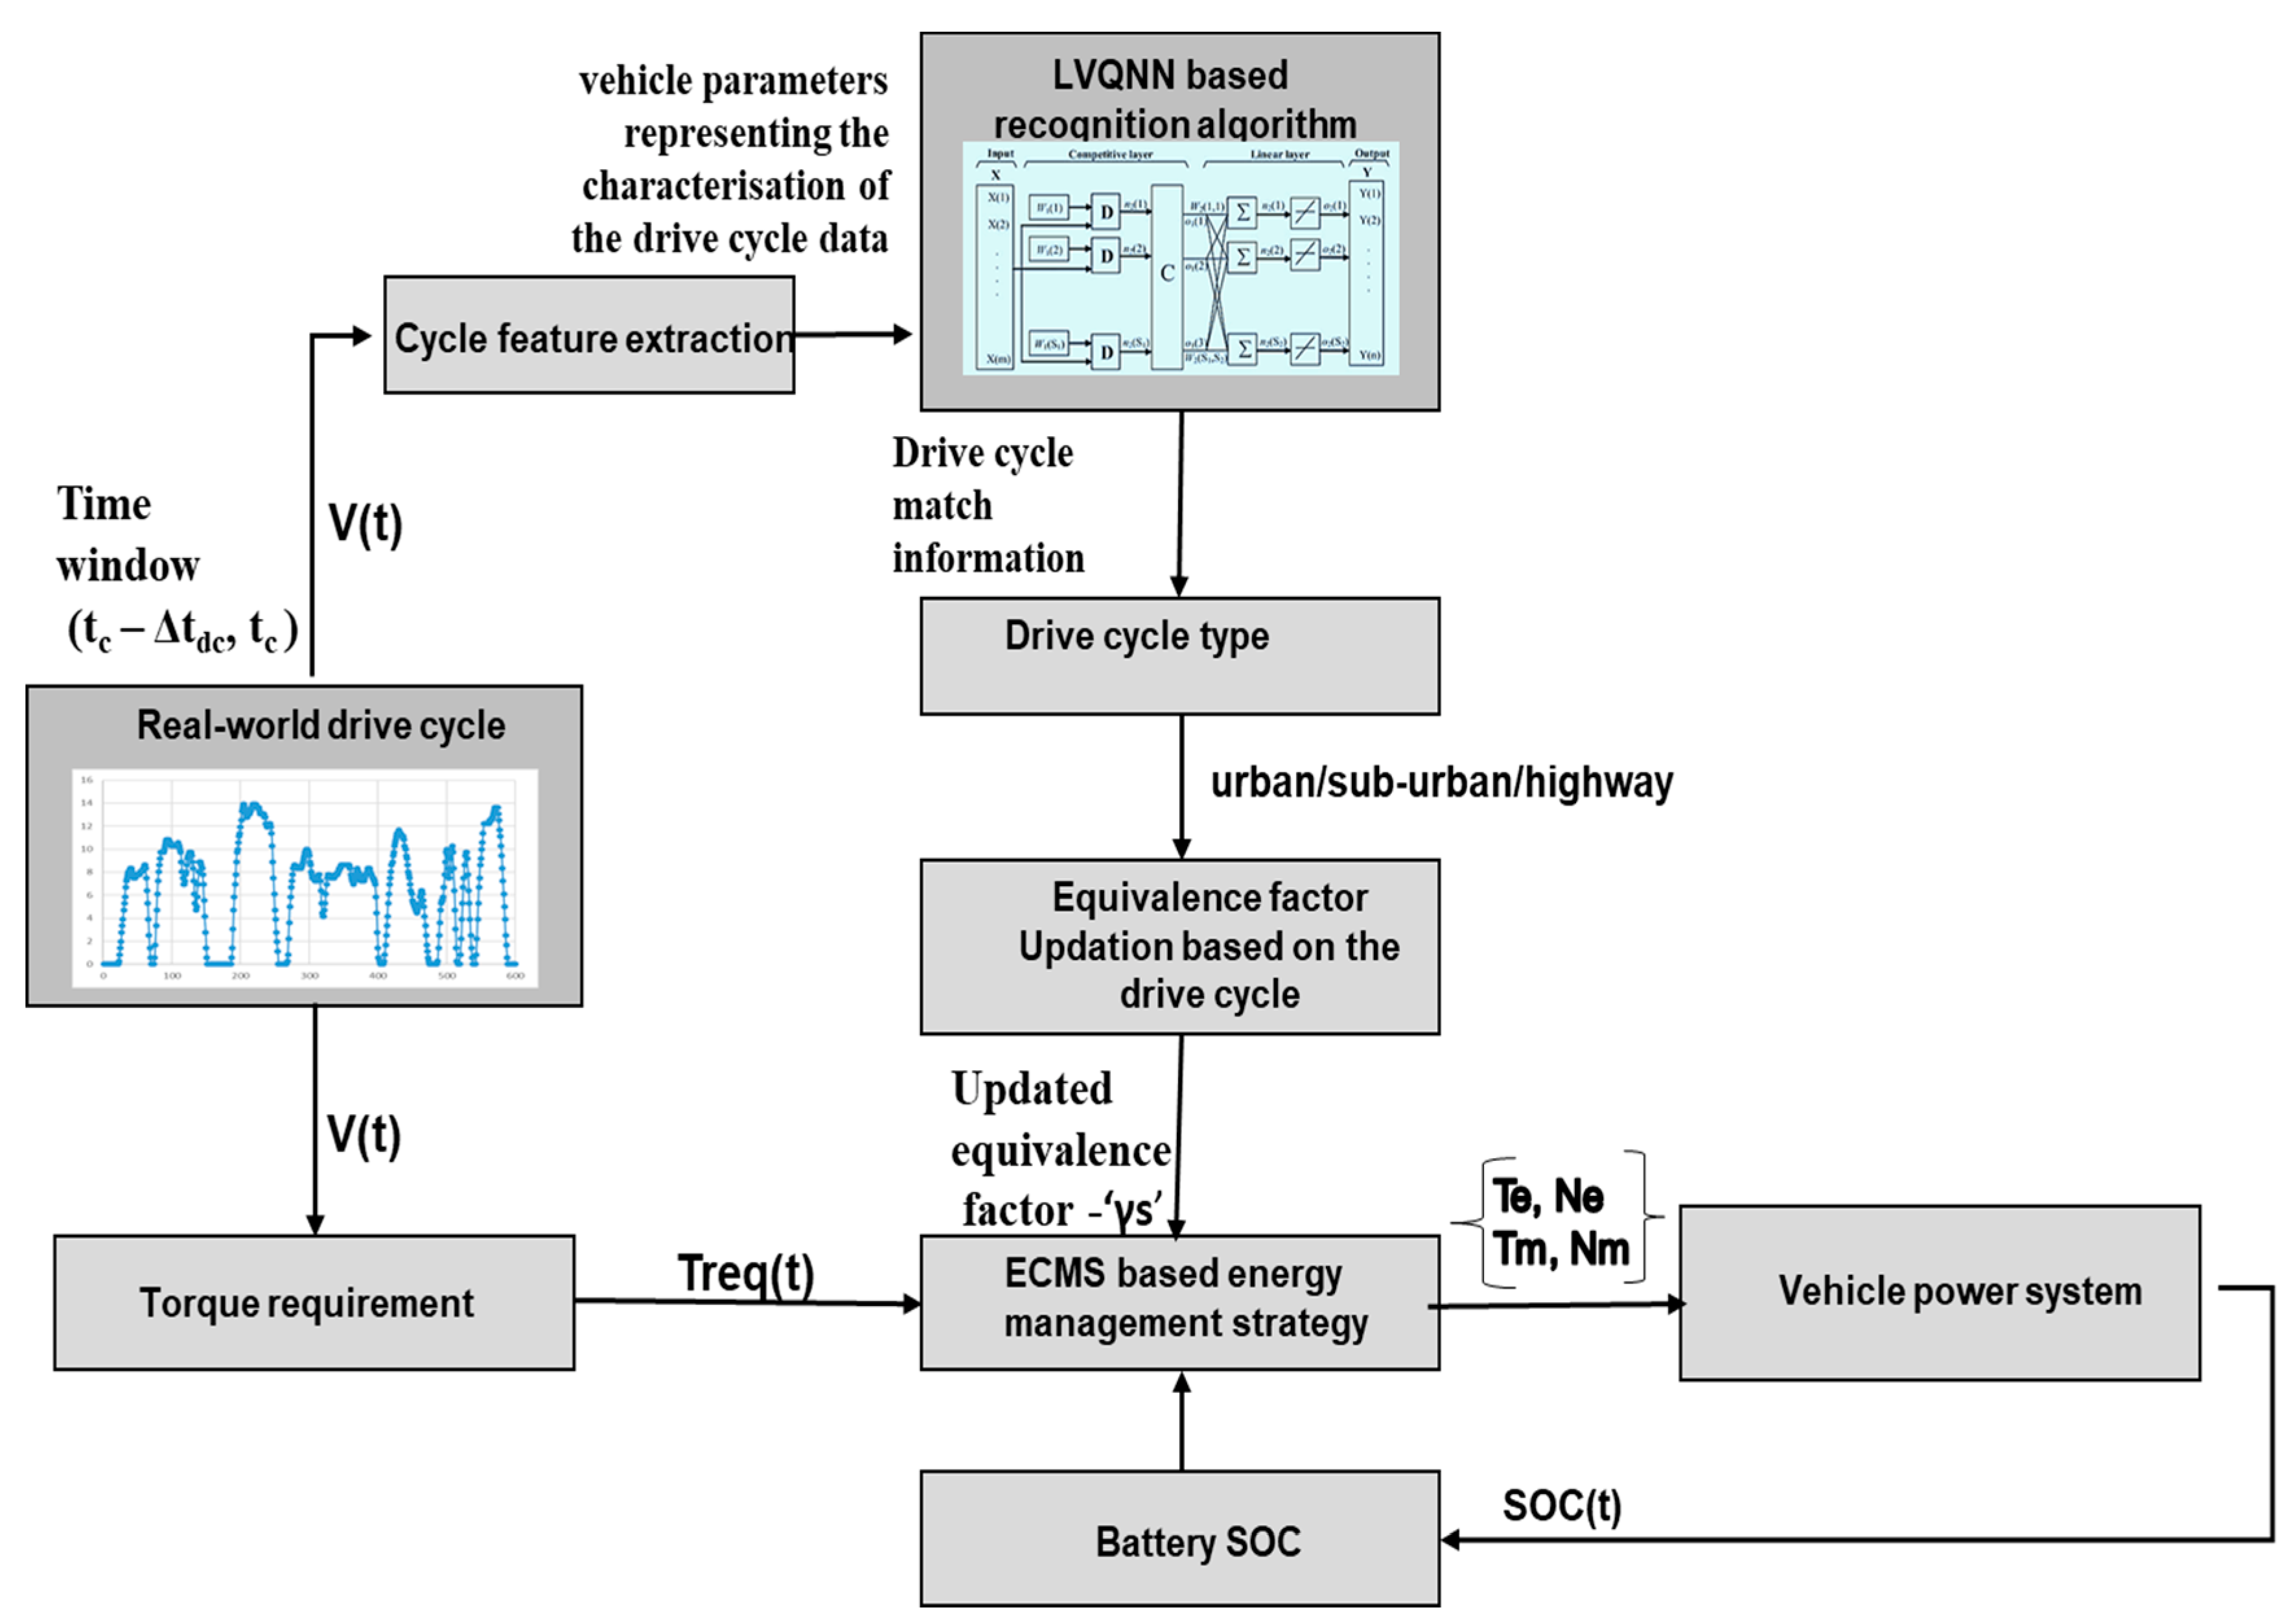
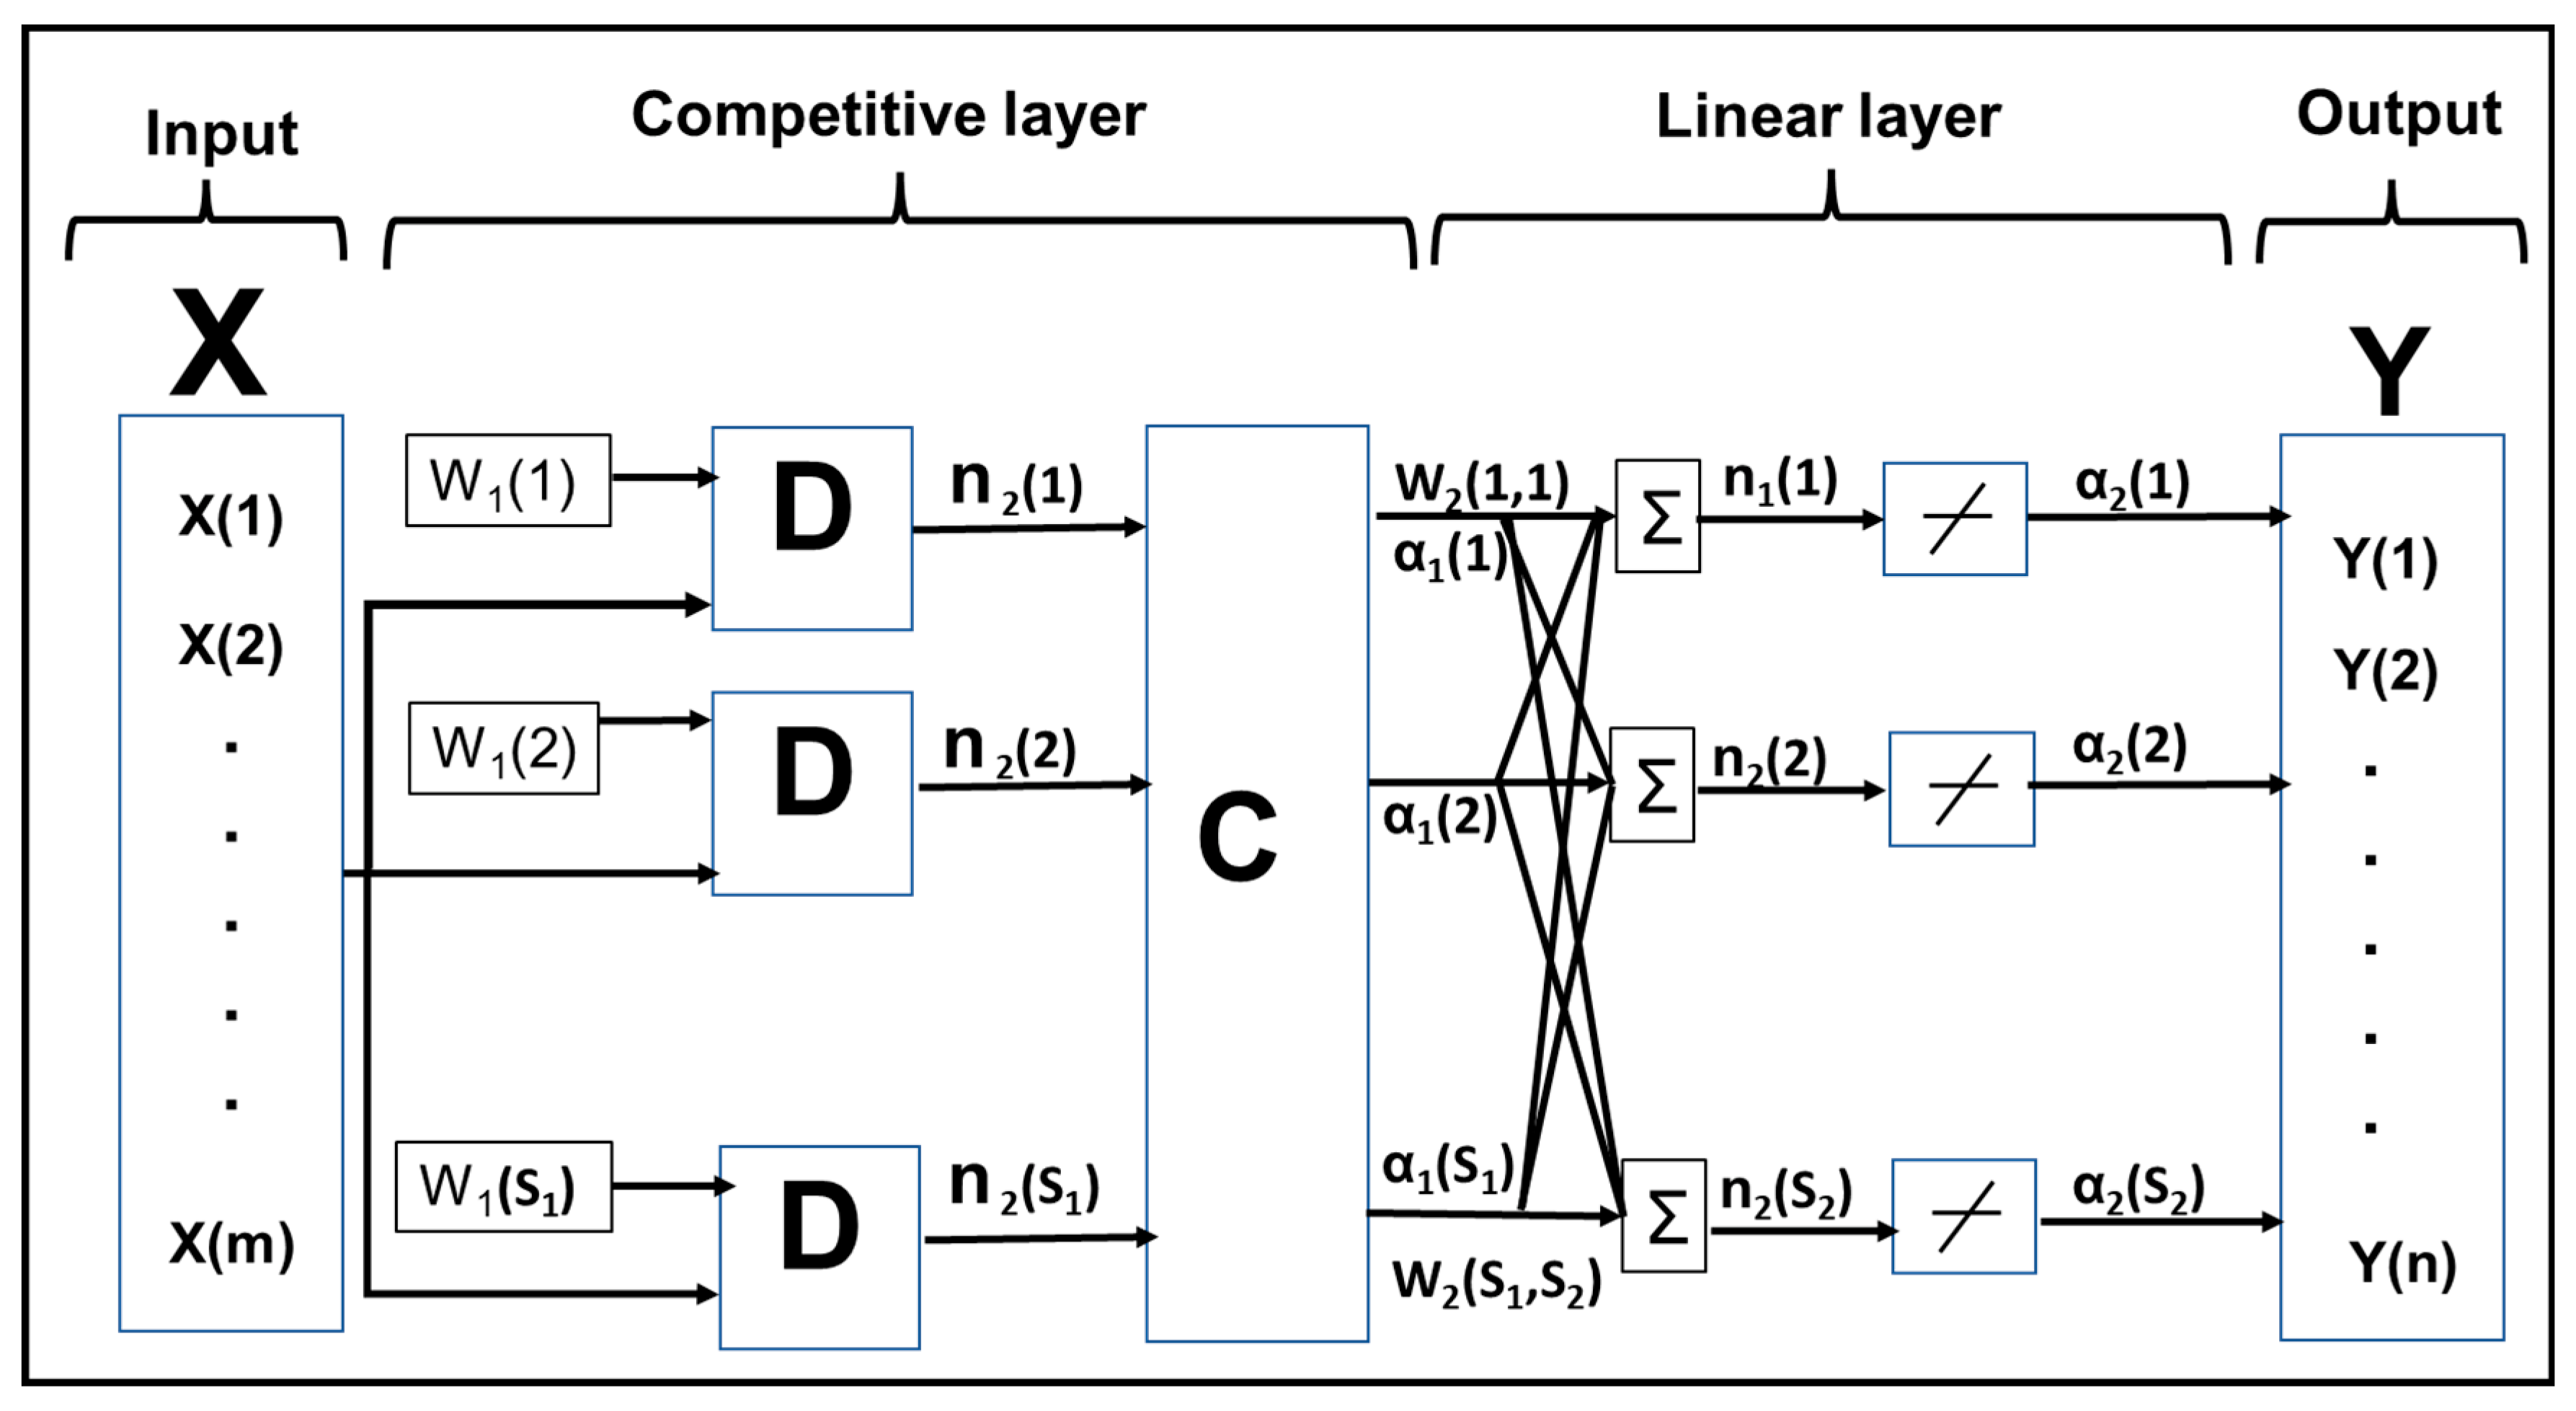
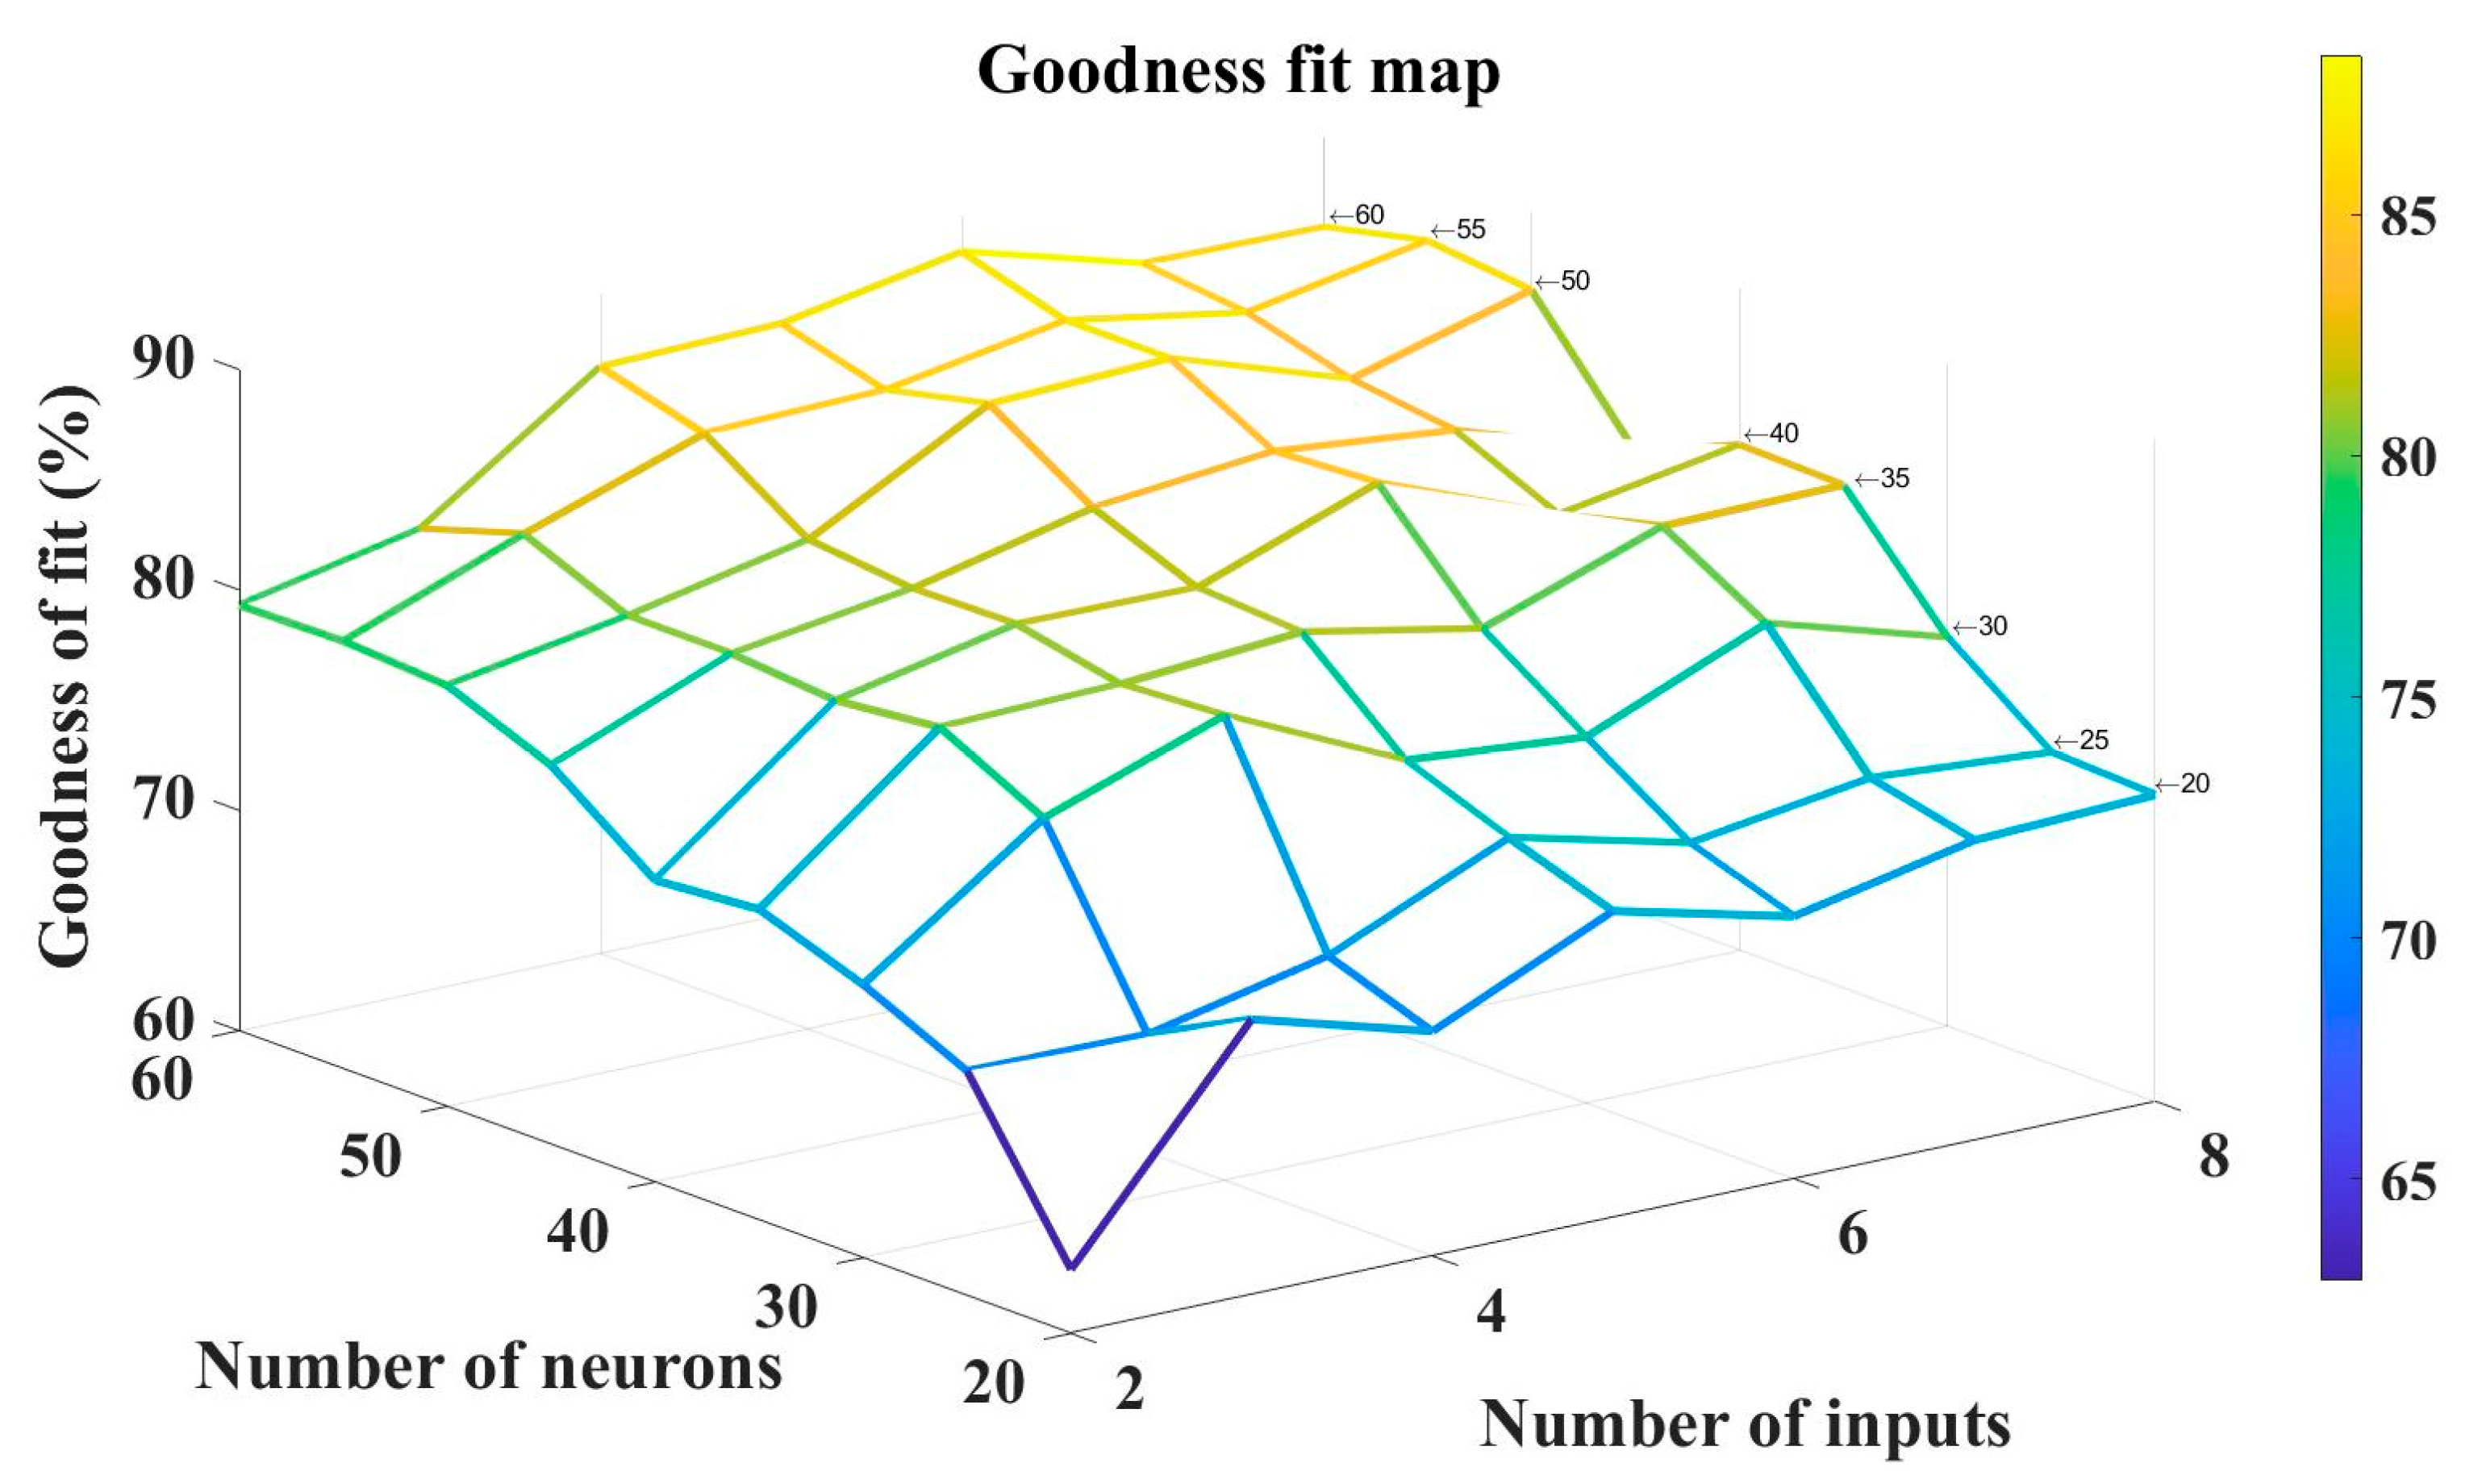
In this paper, a novel NN-based controller with better prediction precision and low computational load for cost-sensitive applications such as a hybrid two-wheeler has been developed. In this study, a learning vector quantitative neural network-based classifier was proposed, designed and implemented which was trained and tested on several standardised drive cycles and on-road driving data. The implementation of NN-based drive cycle recognition method involved a two-step process. The first step involved a learning process, where the system behaviour data, which was the drive cycle characterisation data, was used for the training process. To perform the investigation, three different categories of drive cycle were considered for the NN learning. The categorisation of driving patterns into urban, suburban and highway for training, eliminates the similar type of driving patterns to be used for training and thereby reduces the computational time for optimisation. The categories considered were urban, suburban and highway. Each of these drive cycles considered was characterised by eight drive cycle parameters. A detailed training process by varying the number of the inputs (drive cycle characterisation parameters) and the number of neurons (20–60) were run for all the combinations to get the best-fit matrix (weights W1 and W2). These weights are further used in the LVQNN-based drive cycle recognition controller LVQNN_DCR.
The LVQNN-based classifier dynamically identifies the present driving cycle and matches it to one of the nearest representative standardised drive cycles, based on the past driving information. During the operation, a predefined time window of 25 s past driving information of critical parameters defining the drive cycle was updated every second. A simple interpolated curve is used to estimate the equivalence factor and penalty weights based on the output of the LVQNN_DCR block.
Simulation results show that the real-time driving information can be matched to standardise drive cycles and provide better fuel economy compared to using conventional ECMS_LL while sustaining battery SOC within desired limits of target SOC. A maximum of 10.70% fuel benefit was seen by using the LVQNN-based estimation of equivalence factor in AECMS overusing a traditional ECMS_LL with equivalence factor optimised for WMTC. The average FE benefit over the ten drive cycles considered was 3.93%. However, the fuel benefit percentage depends on the driving data set considered. Along with this fuel benefit, the final SOC values also showed an acceptable limit of the SOC target. The simulation results showed that the final SOC values with adaptive ECMS_LL-based estimation were much closer to the target final SOC when compared to the ECMS_LL for a single drive cycle.
Unlike in the previous research [
14], which uses the statistical and stochastic velocity forecast approaches for energy management optimisation, the proposed research is based on data-driven using Euclidean distance approach for drive cycle classification. Therefore, there is an advantage over prediction precision and computational load with the proposed method. In the previous study [
11], an adaptive ECMS was implemented by updating the equivalence factor using prediction future cycles. Whereas in the proposed research, the past data over a fixed time window was used which prevents additional computational load, and adding a classifier would thereby make it a low computational solution in comparison. Similarly, In study [
15], a rule-based control algorithm was extracted from the result of the optimal solution provided by dynamic programming (DP) on each RDP. Finally, a multi-mode driving control was realised by switching the control parameters in each RDP which required high computational capability making it non-suitable for cost-effective applications. Unlike the previous research, the results show that the proposed method based on LVQNN not only has a good prediction precision leading to significant fuel benefit but also has the advantage of low computational load. This makes the proposed method suitable for cost-sensitive applications such as the hybrid two-wheeler considered for this study.
The primary improvement of the proposed A-ECMS over other algorithms with similar objectives is that it does not require the knowledge of future driving cycles through external systems (GPS) or sensors or predictive models. The proposed adaptive strategy is designed and developed to achieve low computational burden on the controller. Results obtained in this research show that the driving conditions can be successfully recognised with better performance and can be achieved in various driving conditions while sustaining battery SOC within desired limits. The study uses real driving data set for training and testing along with the standardised drive cycles, unlike previous research which considers only standardised drive cycles. Thus, the proposed methodology has further enhanced the training and testing process making it much more suitable for real-world applications when compared to traditional methodologies.
This study emphasises that the potential implementation of ECMS in a production vehicle for a near to optimal solution is incomplete without estimating the equivalence factor accurately. The simulation results presented in this study provide insights that the equivalence factor is very sensitive and has a high influence when it comes to fuel economy and charge sustenance. The LVQNN-based estimation method developed and implemented shows improvement in fuel benefit and charge sustenance when compared to traditional ECMS_LL with equivalence factor optimised to a single drive cycle.
7. Conclusions and Future Work
In the previous paper [
21] a novel equivalent ECMS strategy was developed, and which showed an improvement in the fuel consumption w.r.t to the traditional ECMS. However, to make the novel ECMS real-time capable, a method for online estimation of equivalence factor was necessary. In this research work, a novel LVQNN-based drive cycle recognition strategy has been developed and implemented for the online adaptation of the equivalence factor for ECMS. In this study, a learning vector quantitative neural network-based classifier was proposed, designed and implemented.
For this investigation, three different categories of drive cycles were considered for the NN learning. The driving cycle categories considered were one of each urban, sub-urban and highway. Unlike previous research, the proposed methodology has considered both standardised and real-world driving data for the training and testing of the drive cycle recognition, which makes this methodology more robust for the real world. Each of these drive cycles considered was characterised by eight drive cycle parameters. Keeping the prerequisite for production-ready solution, one of the requirements was to design a cost-effective EMS solution. Thus, the number and choice of the drive cycle used for training, the time window range, and the number of drive cycle characteristics considered for this adaptation methodology were consciously selected keeping the computation load in consideration. There was considerable improvement in the fuel economy with the proposed methodology when compared to the standard ECMS, optimised for a single drive cycle. The maximum FE benefit achieved with the novel adaptive strategy over the ECMS strategy optimised for a single drive cycle was around 10.7%. The average improvement in FE over the ten drive cycles considered for this study was found to be 3.93%.
The proposed method of adaptive equivalence factor is not only precise and efficient but also provides a low computational load suitable for cost-sensitive applications.


