Abstract
Speeding is one of the most relevant risk behaviours for serious and fatal road traffic accidents, particularly among young drivers, being the cause of approximately every third road traffic accident. Due to this background, many road traffic safety campaigns are aimed at reducing speeding among young drivers. However, the effects of campaigns aimed at complying with speed limits for young drivers have significantly fewer effects than other campaigns. For these reasons, an experimental study was conducted to examine how young drivers react to the speeding campaign, which was shown to them on a smartwatch while driving in a driving simulator. Speeding results were compared for three scenarios: no campaign, a billboard campaign and a smartwatch campaign. The experiment involved 102 participants with an average age of 21 years. The results showed that participants were six times more likely to comply with the speed limit if a campaign was shown on a smartwatch than when shown on billboards.
Keywords:
road traffic safety campaign; young drivers; speeding; driving simulator; logistic regression model MSC:
62J12; 62P30
1. Introduction
Excess and inappropriate speed is one of the main contributors to road traffic crashes and road traffic injuries. It is often reported that approximately one-third of fatal crashes are related to excess or inappropriate speed [1,2,3,4,5]. Because speed at the time of collision is the key determinant of the kinetic energy the human body sustains in a crash, speed is a risk factor for absolutely all injury accidents. The effect of speed is found to be greater for serious-injury and fatal road traffic accidents than for minor-injury road traffic accidents and property damage [6]. Speed not only influences the risk of a crash, but also largely determines the injury’s severity if a crash occurs [5,6,7,8]. This fact especially refers to road traffic accidents between motor vehicles and vulnerable road users (pedestrians, cyclists, e-scooter drivers etc.).
In the United States, at least one driver was speeding in 26% of road traffic fatalities [9]. In the state of Queensland (Australia), 20.4% of crashes in 2018 involved a speeding driver or rider [10], while in the state of New South Wales at least 39% of fatal road traffic injuries in 2019 were found to be related to speeding [10]. Among the European countries that monitor levels of speed compliance on urban roads countrywide, between 35% and 75% of vehicle speed observations are higher than the legal speed [11]. Speeding is a key factor in around 30% of fatal road crashes in Europa [10,11]. Preliminary data from 2020 indicate that the proportion of deaths due to speeding increased during the early months of the COVID-19 pandemic, due to reduced roadway traffic and a reduction in law enforcement activity [12,13]. For every 1% increase in a driver’s average speed, their risk of fatal injury increases by 4% [14]. In addition, speeding has significant impacts on the economy and the environment. In the United States, the economic costs of speed-related crashes were about $50 billion per year [9,15].
Speed has been found to have a very large effect on road traffic safety, probably larger than any other known risk factor, especially among young drivers. Examining the cause of speeding among young drivers, as well as creating preventive measures to comply with speed limits, is a great challenge for research, especially in recent years [9,16,17]. A study conducted by Truelove et al. (2021) examined which factors most influence the fear of speeding in a sample of 200 young drivers (aged between 17 and 25). The variables included were fear of physical loss, material loss and perceived social sanctions, as well as the perception that it is safe to engage in the behaviour without being involved in a crash, etc. The most important factor was the fear of high fines [10].
Many countries are struggling to improve road traffic safety through speed management. One of the important measures related to speed management is the campaign. Delhomme et al. (2009) report evidence that road traffic campaigns at local levels are more effective than campaigns at the national level [18]. The means of transmitting the campaign are very important for the success of the campaign [19]. The specificity of this fact is especially reflected in road traffic, because campaign messages shown on television (while the driver is at home and will not drive for the next few days) do not have the same effect as campaign messages communicated to drivers while driving (e.g., radio, billboards etc.). A road traffic safety campaign will only be effective in terms of behavioural change and road traffic accident reduction if it addresses the underlying motivational determinants of risk behaviour and reaches the target audience by suitable communication efforts [20,21]. Single-theme campaigns significantly reduced the number of road traffic accidents by approximately 10%, while multi-theme campaigns did not. Campaigns with police enforcement, and police enforcement plus education, reduced accidents by 13% to 14%, which is statistically significant. On the other hand, personally-directed campaigns showed the largest effect of all campaign types, with an impact of nearly 40% [18]. A study conducted in 2019 in Slovenia analysed education campaigns for young drivers and concluded that the campaign had a positive effect on the behaviour of young people, and that more personal contact based on empathy, emotions and mutual understanding may be more efficient in increasing awareness of young drivers [22].
Only limited success, with an average effect of 9% reduction in road traffic accidents, was found in a meta-analysis of 67 studies evaluating the effect of road safety campaigns [20,21]. Compared to drunk driving, for example, speed has been found to be quite resilient to change through public campaigns. In a meta-analysis of the effects of a road traffic safety campaign, Phillips & Torquato (2009) found that drunk driving campaigns were generally associated with significantly greater effects than speeding campaigns. They reported an average 18% crash reduction in drunk driving campaigns and a negligible 4% crash reduction for speeding campaigns [23]. On the other hand, some authors share the opinion that the effect of the campaign cannot be reliably measured by the number of road traffic accidents in a territory before and after the launch of the campaign [24,25,26].
Developing countermeasures to reduce speeding is worth the efforts required for public traffic safety. As young drivers today like to use modern technologies (smart phones, smartwatches) [27,28], it is necessary to examine the application of new technologies (smart watches) to improve traffic safety. For these reasons, an experimental study was conducted using the driving simulator, which aimed to examine how young drivers react to the speeding campaign, which was shown to them on billboards and smartwatches.
2. Materials and Methods
In this paper, an experiment was conducted in the Laboratory for Traffic Psychology and Ergonomics (Faculty of Transport and Traffic Engineering—the University of Belgrade) in order to examine the potential differences between the means of displaying campaigns (billboards and smartwatches).
102 respondents participated in the experiment. One group of respondents consists of young drivers who have a driver’s license, while the second group consists of respondents who are currently attending driver training program in driving schools. Participants did not receive any compensation for participation. Furthermore, all ethical measures, rights and discretion of the respondents were respected during the research. Each participant was tested individually, and underwent preliminary trials.
2.1. Conducting an Experiment
For the purposes of this experiment, a driving simulator was used to examine the effects of a speeding campaign on compliance with speed limits for young drivers and candidate drivers who are in the process of training in driving schools. The participants were given clear instructions about the simulator before the experiment, and had a test drive in order to use the set-up comfortably. All participants were given instructions about the use of the driving simulator (changing gears with a manual transmission, giving direction indicators, seat belts, etc.). Respondents were not provided with information on the purpose of the research, to avoid the impact on the results obtained. In addition to the simulator, smartwatches were used for the purposes of the experiment, which the participants received for use before the experiment in order to get used to using them. The participants had the task to drive the given routes on the driving simulator and behave the same way as they would behave in a real traffic environment. For the purposes of the experiment three similar routes were created in urban and rural traffic conditions. With the random number generator, each of the routes could have a “No campaign” scenario, a “Billboard campaign” scenario and a “Smartwatch campaign” scenario. Regardless of the route, participants always drove the first scenario without a campaign, while the other two scenarios (“Billboard campaign” and “Smartwatch campaign”) were generated in a random order. The appearance of the campaign on billboards and on the smartwatch is shown in Figure 1 and Figure 2. The message of the campaign was “Mind on the road—Slow down” (Serbian—“Um na drum—Uspori”).
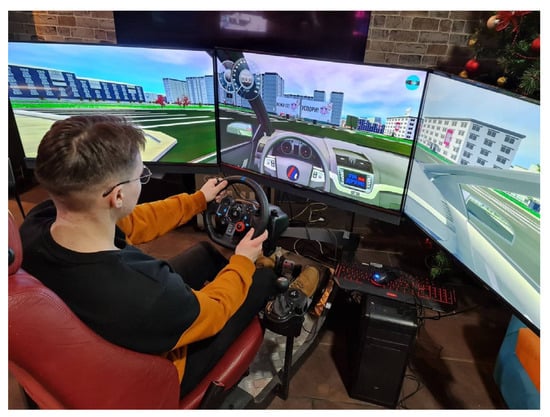
Figure 1.
Driving simulator—billboard.
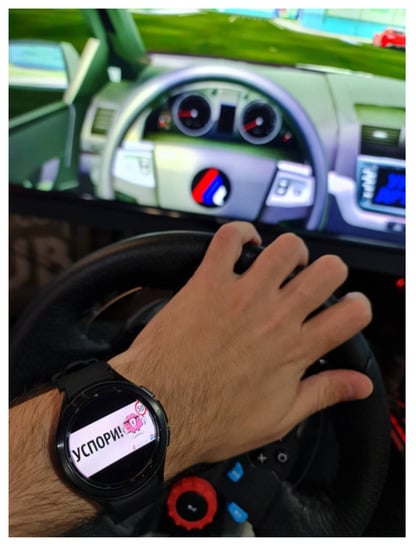
Figure 2.
Driving simulator—smartwatch.
After driving in the simulator, participants completed an online questionnaire. The questionnaire also contained demographic questions about gender, age and issues related to the possession of a driving license (category of driving license, the number of years holding a driver’s license), as well as questions about the frequency of driving, and about how much the driving simulator used in the experiment faithfully simulates real road traffic situations.
2.2. Characteristics of Driving Simulator and Smartwatch
The driving simulator incorporates three 4200 plasma displays that give the participants a 180° horizontal and 50° vertical field of view of the simulated environment. Each display has resolution of 1360 × 768 pixels and a refresh rate of 60 Hz [4,29,30,31,32,33].
The smartwatch used in the experiment is a Samsung Galaxy Watch 3 (black), dimensions 46.2 × 45 × 11.1 mm (1.82 × 1.77 × 0.44 in), size 1.4 inches and resolution 360 × 360 pixels (~364 ppi density). The driving simulator had a five-speed manual transmission.
For the purposes of this experiment, the driving simulator and the smartwatch are software-paired, so that while driving in specific situations (on a certain part of the road, along the route), the participants receive a campaign message about speed on a smartwatch.
2.3. Collecting and Processing Data
All data on driving characteristics from the driving simulator were collected by the data extraction program which was developed. At the same time, driving data of each particular driving scenario for each participant was recorded, and can be reproduced for analysis. On the other hand, data from the questionnaire were collected and exported in an Excel application.
Statistical analysis was carried out in the statistical software package IBM SPSS Statistics v. 22. Normality of distribution was tested by inspection of histograms and the Kolmogorov-Smirnov test. Since the data for all measured variables distribution were no normally distributed, we used non-parametric methods. To assess the significance of differences, the Mann-Whitney U test, Kruskal–Wallis test and Friedman test were used. We used binary logistic regression for predicting the outcome variables.
3. Results
This chapter contains analysis of the results collected during the experiment in order to show the potential differences in the effects of speeding campaigns when the message is placed using a billboard versus on smartwatch. In order to facilitate the presentation of the results, the following terms and abbreviations have been defined:
Percentage of non-compliance with the speed limit (PncSL)—the average value of the ratio of the number of speed limits exceeded and the total number of speed limits in one driving scenario for all participants;
Percentage of speeding time (PST)—the average value of the ratio of driving time at a speed higher than the limited and the total driving time in one scenario for all participants;
Average Maximum Speeding (AMS)—the average maximum speed of all participants for all speeding;
Average speeding (AS)—the average driving speed above the speed limit for all restrictions and all participants.
3.1. Demographic Data
The experiment involved 102 participants with an average age of 21 years (min-16, max-25, SD-2,37), which indicates that the emphasis is on young drivers and drivers who are in the process of training in driving schools. The share of men in the population that participated in the assessment of vehicle speed was 68.9%, while females participated in 31.4% of the total population. Of the total number of participants, 35.5% are in the process of training in a driving school, while 64.7% of participants have a driver’s license (from the entire number of participants who have a driver’s license, 88.9% have a driver’s license for category B). From the total number of participants, 46.6% drive a motor vehicle every day, 16.7% several times a week, while fewer than 1% of participants are not active drivers. The largest proportion of participants lives in an urban area (79.4%), while 20.6% of participants live in a rural area.
3.2. Gender Differences
Male participants did not respect the speed limit in 30.48% of situations, while female participants did not respect the speed limit in 20.3% of situations while driving on a given route where a speeding campaign was not presented. When billboard was displayed while driving, the percentage of speeding decreased in participants of both genders. Male participants exceeded the speed limit in 23.02% of the set limits, while female participants exceeded the speed limit in 18.4% of cases. The lowest percentage of speeding while driving was recorded by participants when the campaign message was sent on a smartwatch. In such a situation, male participants exceeded the speed limit in an average of 14.13% of cases, while female participants exceeded the speed limit in 12.5% of cases (Figure 3a). Statistically significant gender differences exist for the first two situations (Z = −4.137; p < 0.001, Z = −2.719; p = 0.007 for no campaign and for billboard campaigns, respectively), while statistically significant gender differences do not exist for the campaign message in smartwatches (Z = −0.221; p = 0.825).
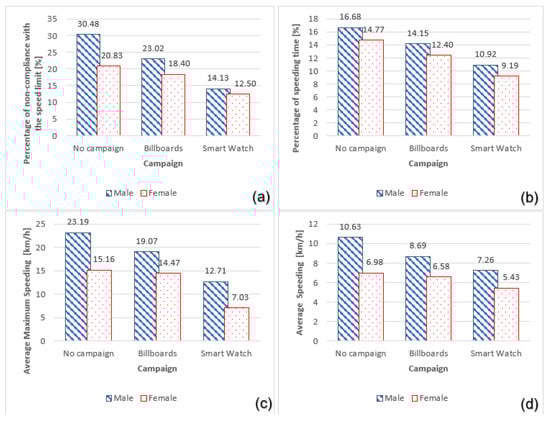
Figure 3.
Results by gender for: (a) PncSL; (b) PST; (c) AMS; and (d) AS.
Males drive at a speed higher than the limit 16.68% of the time while driving in a scenario where there is no campaign, while females drive at speeds exceeding the limit 14.77% of the time. In the scenario where participants were shown a speed campaign on billboards, male participants drive 14.15% of the time at a speed higher than the limited one, while female participants drive 12.4% of the time. When it comes to the percentage of time that participants drive at speeds higher than allowed for the scenario where the message is sent to respondents via a smartwatch (Figure 3b), 10.92% of the time male participants drive faster than allowed, while female participants drive faster than allowed 9.19% of the time. There are no statistically significant gender differences for these data.
The average maximum speeding (AMS) for male participants is 23.19 km/h, while for female participants it is 15.6 km/h, in the scenario without a campaign. In the scenario when the campaign was shown on billboards, male participants recorded an average maximum speed of 23.01 km/h and female participants of 18.4 km/h. When participants were shown the campaign on a smartwatch, the AMS of male participants is 12.71 km/h, while the AMS of female participants is 7.03 km/h (Figure 3c). For all three scenarios, there are statistically significant gender differences (Z = −3.704; p < 0.001, Z = −2.543; p = 0.011, Z = −4.498; p < 0.001, respectively for the scenario without a campaign, the billboard campaign and a campaign on a smartwatch).
The average speed above the limited speed for the scenario of driving without a campaign, for male participants is 10.63 km/h, while for female participants is 6.98 km/h. When analysing the average speed above the limited speed for the scenario with the campaign on billboards, for male participants it is 8.69 km/h, while for female participants it is 6.58 km/h. In the scenario when the campaign is presented on a smartwatch, the average driving speed above the speed limit for male participants is 7.26 km/h, while for female participants it is 5.43 km/h (Figure 3d). When it comes to the average speed above the speed limit, the results of the Mann-Whitney test show statistically significant gender differences (Z = −3.723; p < 0.001, Z = −2.645; p = 0.008, Z = −2.757; p = 0.006, respectively for a no-campaign scenario, a billboard campaign and a smartwatch campaign).
3.3. Differences between Drivers with a Driver’s License and Drivers in the Process of Training in Driving Schools
Participants who have a driver’s license do not respect the speed limit in 30.64% of cases, while participants who are in the process of training at a driving school do not respect the speed limit in 21.60% of cases while driving on a route without a campaign. When respondents drive along the route at which the campaign is shown on billboards, participants who have a driver’s license do not respect the speed limit in 22.56% of cases, unlike participants who are in the process of training (19.75%). The smallest difference between these two categories of participants in respecting the speed limit is when the campaign is shown on a smartwatch (13.89% and 13.47% of non-compliance with the speed limit, respectively for drivers and drivers in the process of training) (Figure 4a). The results of the Mann-Whitney test show statistically significant differences between participants who have a driver’s license and participants in the process of training only for a scenario with no campaign (Z = −3.733; p < 0.001).
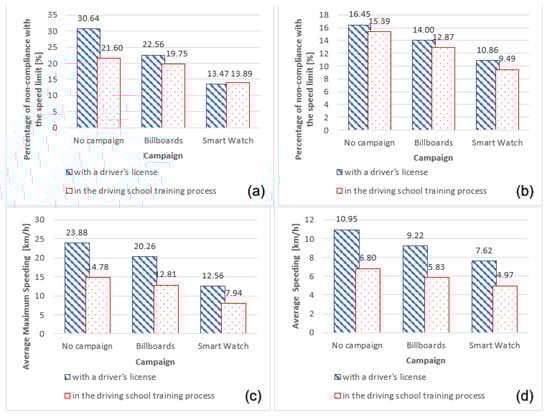
Figure 4.
Results for respondents who have a driver’s license and for respondents who are in the process of training in driving schools for: (a) PncSL; (b) PST; (c) AMS; and (d) AS.
In the scenario where the campaign is absent, participants who have a driver’s license drive at a speed higher than the limit 16.45% of the time, while participants who are in the process of training drive at a speed higher than the limit 15.39% of the time. In the scenario when participants were shown a speed campaign on billboards, participants who have a driver’s license drive faster than the limit 14% of the time, while participants who are in the process of training do so 12.87% of the time. For the scenario in which the message is sent to the participants via smartwatch, participants who have a driver’s license drive faster than allowed 10.86% of the time, while participants who are in the training process drive faster than allowed 9.49% of the time (Figure 4b). For these results, there are no statistically significant differences between participants who have a driver’s license and participants in the process of training at a driving school.
Participants who have a driver’s license exceed the maximum speed limit by 23.88 km/h on average, while participants who are in the process of training exceed the speed limit by 14.78 km/h on average, in the scenario when they were not shown the campaign. The average maximum speed exceeded for participants who have a driver’s license, in the scenario when the campaign is shown on billboards, is 23.19 km/h, while for participants in the process of training it is 15.6 km/h. When participants are shown the campaign on a smartwatch, the AMS of participants who have a driver’s license is 12.71 km/h, while the AMS of participants in the process of training is 7.03 km/h (Figure 4c). For all three scenarios, there are statistically significant differences (Z = −4.464; p < 0.001, Z = −3.853; p < 0.011, Z = −3.455; p = 0.001, respectively for the scenario without a campaign, the billboard campaign and the campaign on a smartwatch).
The average driving speed above the speed limit, for the scenario of driving without a campaign, is 10.95 km/h for participants who have a driver’s license, while for participants in the process of training it is 6.80 km/h. When analysing the average speed above the speed limit, for the scenario with the campaign on billboards, for participants who have a driver’s license exceeding it amounts to 9.22 km/h, while for participants who are in the process of training it amounts to 5.83 km/h. In the scenario when the campaign is shown on a smartwatch, the average driving speed above the speed limit is 7.62 km/h for participants with a driver’s license, while it amounts to 4.97 km/h for participants in the training process (Figure 4d). When it comes to the average speed above the speed limit, there are statistically significant gender differences between participants who have a driver’s license and respondents who are in the process of training in driving school, for all three driving scenarios (Z = −4.445; p < 0.001, Z = −3.872; p < 0.001, Z = −3.164; p = 0.002, respectively).
3.4. Campaign Perception—Billboards vs. Smartwatch
When participants were not shown the campaign, they do not respect the speed limit in 27.45% of traffic situations. On the other hand, if participants are shown speeding campaigns on billboards, the percentage of non-compliance with speed limits is significantly reduced (21.57%), while participants do not respect the speed limit in 13.62% of traffic situations if their speed campaign is displayed on a smartwatch (Figure 5a). The results of the Friedman test also show that there are differences between the impact of the campaign and the way the speed campaign is presented (χ2 = 112.027; p < 0.001).
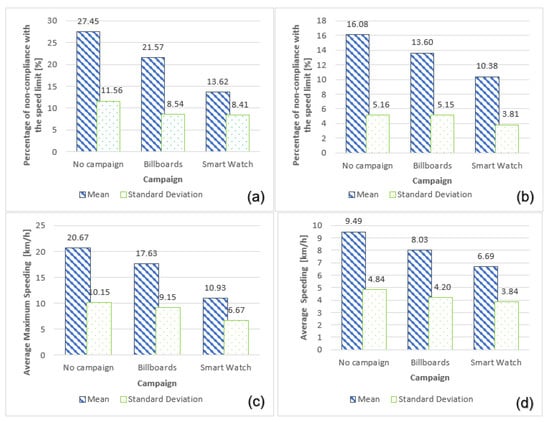
Figure 5.
Results of three driving scenarios: no campaign, billboards, smart watch, for: (a) PncSL; (b) PST; (c) AMS; and (d) AS.
In the scenario in which the participants were not shown the campaign, they drive 16.08% of the time at a speed higher than the limited one. When participants are shown a campaign on billboards, 13.6% of the time they drive faster than the limited speed, while in situations where participants are shown a campaign on a smartwatch, they drive 10.38% of the time faster than allowed (Figure 5b). There are also statistically significant differences between the three scenarios (χ2 = 144.799; p < 0.001).
Participants record the highest maximum average speed in situations where campaigns are not shown (AMS—20.67 km/h). When participants are shown the campaign on billboards, they record an average maximum speed of 17.63 km/h, while when the campaign is shown on a smartwatch, they record a maximum average speed of 10.93 km/h. The differences between these three scenarios are confirmed by the results of Friedman’s test (χ2 = 135.312; p < 0.001).
Participants record the highest average speed above the limit in the scenario in which no campaign is shown (9.49 km/h), followed by in situations where campaigns are displayed on billboards (8.03 km/h), while participants recorded the lowest average speed above the limit when the campaign was on a smartwatch (6.69 km/h). There are statistically significant differences between the three scenarios (χ2 = 66.503; p < 0.001).
3.5. Logistic Regression Model—Billboards vs. Smartwatch
For predicting the impact of the smartwatch on compliance with the speed limits of young drivers, logistic regression analyses were used (χ2 = 60.639, df = 1, p < 0.001), which accurately classified 71.3% of cases. When participants are presented with a speed limit campaign using a smartwatch, they are 6.068 times more likely to respect the speed limit than if the campaign is displayed on a billboard, and 21.801 times more likely to respect a speed limit than if the campaign is absent.
4. Discussion
When analysing compliance with the speed limit for both genders, in the no-campaign scenario, male participants did not respect the speed limit in 30.48% of situations, while female participants did not respect the speed limit in 20.83% of situations. The percentage of non-compliance with speed decreases for both genders in the scenario when the campaign was shown on billboards (men—23.02%, women—18.4%), while respondents of both genders exceeded the speed limit in the scenario when their campaign message was displayed on a smartwatch (men—14.13%, women—12.5%). These results are consistent with a study conducted by Etika et al. (2021), showing that male drivers are more willing to exceed the speed limit than females. When analysing PST, AMS and AS, a similar conclusion can be drawn, that male participants drive in longer time intervals above the speed limit, have a higher top speed over the speed limit and have higher average overspeed values, unlike female participants. The presented results are in line with many studies, which showed that male participants are prone to risky behaviour in road traffic and speeding [34,35,36]. However, the use of a smartwatch in a campaign to respect speed limits has an impact on safe behaviour in road traffic for both genders. These results show that young drivers of both genders are happy to use and “believe” in new technologies, in this case a smartwatch which gives great opportunities to use it for campaigns in the field of transport. Although it is known that female drivers are more receptive to road traffic safety campaigns aimed at respecting speed limits and that female drivers accept the campaign while driving [24], the effects of the campaign shown on the smartwatch are visible in both genders, and even in some situations has a greater effect on the behaviour of male participants.
The analysis of the obtained results related to compliance with the speed limit for drivers with a driver’s license and drivers who are in the process of training in a driving school, from which it can be concluded that drivers who already have a driver’s license do not respect the speed limit and have higher speed limits (maximum and average), unlike drivers who are in the process of training at a driving school. These results are in line with numerous studies, that drivers are more careful during training at a driving school [2,29,37,38]. However, the implementation of the campaign, being shown to participants on a smartwatch, had effects on both drivers who have a driver’s license and drivers who are in the process of training at a driving school.
An analysis of the results when participants are divided by gender, and whether they have a driver’s license or are in the process of training in a driving school, leads to the conclusion that speed campaigns shown on a smartwatch have an effect in terms of safer behaviour in all groups. Some authors singled out the division of a group of young drivers into different homogeneous groups as a recommendation for creating a campaign aimed at young drivers [21,35,39]. The results presented in this study support the fact that smartwatches have become a medium that makes young drivers a homogeneous group, as well as the means which campaign content can be placed, and that this content affects a change in the behaviour of young drivers, which in turn improved the safety of young people in road traffic, but also other categories of road traffic participants (indirectly).
The results of the presented study show that the participants drive an average of about 30 km/h over the speed limit. These results are consistent with the results of a study conducted by Preece et al. (2018), which showed that young drivers most often exceed the speed limit by more than 10 km/h [40], while only 28% of young drivers admit that they exceed the speed limit while driving [41,42]. By applying the campaign on smartwatches, the average speeding was reduced to about 10 km/h. Some authors believe that participants drive at higher speeds in the driving simulator than they would in a real environment [43,44,45], primarily due to the lack of consequences of a road traffic accident in the driving simulator. Based on the stated facts, it can be assumed that the effect of the smartwatch campaign in real road traffic situations could be even greater. The unequivocal effects of using a smartwatch as a means of presenting a campaign are shown by the results that a large percentage of young drivers improved their behaviour between the two scenarios, when they drove without a campaign and when the campaign was shown on a smartwatch. Displaying the campaign message to drivers on the smartwatch while driving reminds them to change their behaviour. The results of our study are in line with the findings that campaigns can affect the mention of driver speeding behaviour by about 40% [18,46,47].
5. Conclusions
Based on the data collected and analysed, the conclusions of this research are as follows:
- -
- There are statistically significant gender differences in the perception of the campaign depending on the driving scenario (a higher percentage of male participants than female do not respect the speed limit);
- -
- The campaign shown on the smartwatch shows the effects on both, female and male participants;
- -
- There is a statistically significant difference in the perception of the campaign between participants who have a driver’s license and those who are in the process of training in driving schools (participants who have a driver’s license do not respect speed limits at a higher percentage);
- -
- When respondents are presented with a speed limit campaign using a smartwatch, this can increase the number of people respecting the speed limit by 6.068 times than having a campaign displayed on a billboard, and 21.801 times more likely than in a non-campaign scenario.
From the above results, it can be concluded that there is a great potential for using a smartwatch to present a campaign against speeding, although some studies claim that drivers behave very unsafely in road traffic while using a smartwatch to make phone calls while driving [28]. On the other hand, a message sent on a smartwatch, as well as the vibration, can disturb the driver. These are new questions that should be answered in future research, which would examine the distraction of drivers caused by messages and vibrations on the smartwatches. Furthermore, further directions of research should be aimed at examining a larger number of respondents, different age groups, conducting experiments in a real environment, in different weather conditions and time of day, as well as using different smart watches (shape, design, screen size, etc.), but also examining different types of campaigns (alcohol, belt, etc.).
5.1. Limitations of the Study
The limitation of this study is primarily focused on the fact that the results were obtained on a driving simulator and not in the real environment, so it is necessary to do research in a real traffic environment to implement the obtained results. Additionally, other limitations of this study are the sample size, as well as the difference in sample size between the number of respondents who are in the process of training in driving schools, on the one hand, as well as drivers who have a driver’s license.
5.2. Recommendations
This study shows the significant effects of the application of the smartwatch in the campaign on compliance with the speed limit. Young drivers significantly changed their behaviour when a smartwatch was used as a means of conveying the message, and they enthusiastically accepted the new solution of presenting the campaign in road traffic safety. Additionally, based in part on the results of this paper, the use of a smartwatch to place a road traffic safety campaign against speeding (e.g., displaying a campaign image or message at a certain time interval while driving, vibrating and/or sound effect on the watch due to information via GPS on exceeding the current speed of the vehicle), as well as in other aspects of traffic safety (e.g., seat belt warning—receiving information from the vehicle and starting to light, vibrate and send beeps, etc.), was presented as a recommendation.
Author Contributions
Conceptualisation, D.P. (Duško Pešić) and D.P. (Dalibor Pešić); methodology, S.Č. and A.T.; software, A.T.; validation, D.P. (Duško Pešić) and D.P. (Dalibor Pešić); formal analysis, A.T.; investigation, S.Č.; resources, D.P. (Duško Pešić) and D.P. (Dalibor Pešić); data curation, S.Č.; writing—original draft preparation, D.P. (Duško Pešić) and D.P. (Dalibor Pešić); visualisation, A.T.; supervision, S.Č.; project administration, A.T.; and writing—review & editing, A.T. and S.Č. All authors have read and agreed to the published version of the manuscript.
Funding
This research received no external funding.
Institutional Review Board Statement
Not applicable.
Informed Consent Statement
Informed consent was obtained from all subjects involved in the study.
Acknowledgments
The authors would like to thank the Road Traffic Safety Agency of the Republic of Serbia for their assistance in drafting this paper.
Conflicts of Interest
The authors declare no conflict of interest.
References
- Čubranić-Dobrodolac, M.; Švadlenka, L.; Cičević, S.; Trifunović, A.; Dobrodolac, M. Using the Interval Type-2 Fuzzy Inference Systems to Compare the Impact of Speed and Space Perception on the Occurrence of Road Traffic Accidents. Math. 2020, 8, 1548. [Google Scholar] [CrossRef]
- Čubranić-Dobrodolac, M.; Švadlenka, L.; Čičević, S.; Trifunović, A.; Dobrodolac, M. A bee colony optimization (BCO) and type-2 fuzzy approach to measuring the impact of speed perception on motor vehicle crash involvement. Soft Comput. 2021, 2021, 1–24. [Google Scholar] [CrossRef]
- Nouvier, J. Speed Management; Organisation for Economics Co-Operation and Development: Paris, France, 2006; ISBN 92-821-0377. [Google Scholar]
- Pešić, D.; Trifunović, A.; Ivković, I.; Čičević, S.; Žunjić, A. Evaluation of the effects of daytime running lights for passenger cars. Transp. Res. Part F Traffic Psychol. Behav. 2019, 66, 252–261. [Google Scholar] [CrossRef]
- van Schagen, I.; Commandeur, J.J.F.; Goldenbeld, C.; Stipdonk, H. Monitoring speed before and during a speed publicity campaign. Accid. Anal. Prev. 2016, 97, 326–334. [Google Scholar] [CrossRef]
- Elvik, R. A re-parameterisation of the Power Model of the relationship between the speed of traffic and the number of accidents and accident victims. Accid. Anal. Prev. 2013, 50, 854–860. [Google Scholar] [CrossRef] [Green Version]
- Elvik, R. The Power Model of the Relationship between Speed and Road Safety: Update and New Analyses; Transportøkonomisk Institutt (Norway): Oslo, Norway, 2009; Volume 1034, p. 64. [Google Scholar]
- Wu, Y.; Abdel-Aty, M.; Wang, L.; Rahman, M.S. Combined connected vehicles and variable speed limit strategies to reduce rear-end crash risk under fog conditions. J. Intell. Transp. Syst. 2019, 24, 494–513. [Google Scholar] [CrossRef]
- Porter, B.E.; Berry, T.D.; Johnson, K.L. Speeding: A Tragedy of the Commons’ Behavior. Int. Encycl. Transp. 2021, 7, 130–135. [Google Scholar] [CrossRef]
- Truelove, V.; Freeman, J.; Kaye, S.A.; Watson, B.; Mills, L.; Davey, J. A unified deterrence-based model of legal and non-legal factors that influence young driver speeding behaviour. Accid. Anal. Prev. 2021, 160, 106327. [Google Scholar] [CrossRef]
- Dovile Adminaité-Fodor and Graziella Jost; Reducing Speeding in Europe: Brussels, Belgium, 2019.
- Peterson, C.M.; Nelson, T.F.; Pereira, M.A. Driver speeding typologies by roadway behaviours and beliefs: A latent class analysis with a multistate sample of U.S. adults. Transp. Res. Part F Traffic Psychol. Behav. 2021, 81, 373–383. [Google Scholar] [CrossRef]
- Wagner, E.; Atkins, R.G.; Berning, A.; Robbins, A.; Watson, C.; Anderle, J. Examination of the Traffic Safety Environment During the Second Quarter of 2020: Special Report; National Highway Traffic Safety Administration: Washington, DC, USA, 2020. [Google Scholar] [CrossRef]
- World Health Organisation. Road Traffic Injuries; World Health Organisation: Geneva, Switzerland, 2020; Available online: https://www.who.int/news-room/fact-sheets/detail/road-traffic-injuries (accessed on 28 November 2021).
- Blincoe, L.; Miller, T.R.; Zaloshnja, E.; Lawrence, B.A. The Economic and Societal Impact of Motor Vehicle Crashes (Revised); National Center for Statistics and Analysis: Washington, DC, USA, 2010. [Google Scholar]
- Etika, A.; Merat, N.; Carsten, O. Identifying salient beliefs underlying speeding behaviour: An elicitation study of nigerian drivers. Transp. Res. Interdiscip. Perspect 2021, 9, 100279. [Google Scholar] [CrossRef]
- Kosslyn, S.M.; Margolis, J.A.; Barrett, A.M.; Goldknopf, E.J.; Daly, P.F. Age Differences in Imagery Abilities. Child. Dev. 1990, 61, 995. [Google Scholar] [CrossRef] [PubMed]
- Delhomme, P.; De Dobbeleer, W.; Forward, S.; Simões, A. Manual for Designing, Implementing, and Evaluating Road Safety Communication Campaigns: Part I.; Belgian Road Safety Institute: Brussels, Belgium, 2009. [Google Scholar]
- Ward, N.J.; Finley, K.; Townsend, A.; Scott, B.G. The effects of message threat on psychological reactance to traffic safety messaging. Transp. Res. Part F Traffic Psychol. Behav. 2021, 80, 250–259. [Google Scholar] [CrossRef]
- Geber, S.; Baumann, E.; Klimmt, C. Tailoring in risk communication by linking risk profiles and communication preferences: The case of speeding of young car drivers. Accid. Anal. Prev. 2016, 97, 315–325. [Google Scholar] [CrossRef] [PubMed]
- Phillips, R.O.; Ulleberg, P.; Vaa, T. Meta-analysis of the effect of road safety campaigns on accidents. Accid. Anal. Prev. 2011, 43, 1204–1218. [Google Scholar] [CrossRef]
- Topolšek, D.; Babić, D.; Fiolić, M. The effect of road safety education on the relationship between Driver’s errors, violations and accidents: Slovenian case study. Eur. Transp. Res. Rev. 2019, 11, 1–8. [Google Scholar] [CrossRef] [Green Version]
- Phillips, R.; Torquato, R. A Review of 45 Anti-Speeding Campaigns. 2009. Available online: https://www.toi.no/getfile.php?mmfileid=11538 (accessed on 28 November 2021).
- Lewis, I.; Watson, B.; Tay, R. Examining the effectiveness of physical threats in road safety advertising: The role of the third-person effect, gender, and age. Transp. Res. Part F Traffic Psychol. Behav. 2007, 10, 48–60. [Google Scholar] [CrossRef] [Green Version]
- Tay, R. The effectiveness of enforcement and publicity campaigns on serious crashes involving young male drivers: Are drink driving and speeding similar? Accid. Anal. Prev. 2005, 37, 922–929. [Google Scholar] [CrossRef]
- Tay, R. The Relationship Between Public Education And Law Enforcement Campaigns And Their Effectiveness In Reducing Speed-Related Serious Crashes. Int. J. Transp. Econ. Riv. Internazionale Econ. Trasp. 2004, 31, 1000–1004. [Google Scholar]
- Eren, H.; Gauld, C. Smartphone use among young drivers: Applying an extended Theory of Planned Behaviour to predict young drivers’ intention and engagement in concealed responding. Accid. Anal. Prev. 2021, 164, 106474. [Google Scholar] [CrossRef]
- Perlman, D.; Samost, A.; Domel, A.G.; Mehler, B.; Dobres, J.; Reimer, B. The relative impact of smartwatch and smartphone use while driving on workload, attention, and driving performance. Appl. Ergon. 2019, 75, 8–16. [Google Scholar] [CrossRef]
- Üzümcüoğlu, Y.; Öz, B.; Özkan, T.; Lajunen, T. Investigating driving instructors: The mediating roles of driving skills in the relationship between organizational safety strategies and driver behaviours. Transp. Res. Part F Traffic Psychol. Behav. 2021, 76, 38–46. [Google Scholar] [CrossRef]
- Bıçaksız, P.; Öztürk, İ.; Özkan, T. The differential associations of functional and dysfunctional impulsivity with driving style: A simulator study. Transp. Res. Part F Traffic Psychol. Behav. 2019, 63, 1–11. [Google Scholar] [CrossRef]
- Lubbe, N. Brake reactions of distracted drivers to pedestrian Forward Collision Warning systems. J. Saf. Res. 2017, 61, 23–32. [Google Scholar] [CrossRef] [PubMed]
- Sadia, R.; Bekhor, S.; Polus, A. Speed variation for different drivers, situations, and road geometry: Simulator and survey analysis. J. Transp. Saf. Secur. 2017, 10, 25–44. [Google Scholar] [CrossRef]
- Taheri, S.M.; Matsushita, K.; Sasaki, M. Virtual Reality Driving Simulation for Measuring Driver Behavior and Characteristics. J. Transp. Technol. 2017, 7, 123–132. [Google Scholar] [CrossRef] [Green Version]
- Horvath, C.; Lewis, I.; Watson, B. The beliefs which motivate young male and female drivers to speed: A comparison of low and high intenders. Accid. Anal. Prev. 2012, 45, 334–341. [Google Scholar] [CrossRef] [PubMed] [Green Version]
- Glendon, A.I.; McNally, B.; Jarvis, A.; Chalmers, S.L.; Salisbury, R.L. Evaluating a novice driver and pre-driver road safety intervention. Accid. Anal. Prev. 2014, 64, 100–110. [Google Scholar] [CrossRef] [Green Version]
- Masuri, M.G.; Mustaffa, D.N.A.; Dahlan, A.; Isa, K.A.M. The Intention in Speeding Behavior between Low and High Intended Young Driver in Urban University. Environ. Proc. J. 2016, 1, 330. [Google Scholar] [CrossRef] [Green Version]
- Babić, D.; Babić, D.; Sucha, M.; Stanić, V.; Toman, M. The influence of music genres on the driving behaviour of young drivers and their visual scanning of the environment. Transp. Res. Part F Traffic Psychol. Behav. 2021, 81, 396–407. [Google Scholar] [CrossRef]
- Endriulaitienė, A.; Šeibokaitė, L.; Markšaitytė, R.; Slavinskienė, J.; Arlauskienė, R. Changes in beliefs during driver training and their association with risky driving. Accid. Anal. Prev. 2020, 144, 105583. [Google Scholar] [CrossRef]
- Ulleberg, P. Personality subtypes of young drivers. Relationship to risk-taking preferences, accident involvement, and response to a traffic safety campaign. Transp. Res. Part F Traffic Psychol. Behav. 2001, 4, 279–297. [Google Scholar] [CrossRef]
- Preece, C.; Watson, A.; Kaye, S.A.; Fleiter, J. Understanding the psychological precursors of young drivers’ willingness to speed and text while driving. Accid. Anal. Prev. 2018, 117, 196–204. [Google Scholar] [CrossRef] [PubMed]
- Logan, E.; Kaye, S.A.; Lewis, I. The influence of the revised reinforcement sensitivity theory on risk perception and intentions to speed in young male and female drivers. Accid. Anal. Prev. 2019, 132, 105291. [Google Scholar] [CrossRef]
- Vankov, D.; Schroeter, R.; Twisk, D. Understanding the predictors of young drivers’ speeding intention and behaviour in a three-month longitudinal study. Accid. Anal. Prev. 2021, 151, 105859. [Google Scholar] [CrossRef] [PubMed]
- Calvi, A.; D’Amico, F.; Ferrante, C.; Ciampoli, L.B. Effectiveness of augmented reality warnings on driving behaviour whilst approaching pedestrian crossings: A driving simulator study. Accid. Anal. Prev. 2020, 147, 105760. [Google Scholar] [CrossRef]
- Hussain, Q.; Alhajyaseen, W.K.M.; Pirdavani, A.; Reinolsmann, N.; Brijs, K.; Brijs, T. Speed perception and actual speed in a driving simulator and real-world: A validation study. Transp. Res. Part F Traffic Psychol. Behav. 2019, 62, 637–650. [Google Scholar] [CrossRef]
- Hussain, Q.; Almallah, M.; Alhajyaseen, W.K.M.; Dias, C. Impact of the geometric field of view on drivers’ speed perception and lateral position in driving simulators. Procedia Comput. Sci. 2020, 170, 18–25. [Google Scholar] [CrossRef]
- Rowe, R.; Andrews, E.; Harris, P.R.; Armitage, C.J.; McKenna, F.P.; Norman, P. Identifying beliefs underlying pre-drivers’ intentions to take risks: An application of the Theory of Planned Behaviour. Accid. Anal. Prev. 2016, 89, 49–56. [Google Scholar] [CrossRef] [Green Version]
- Stead, M.; Tagg, S.; MacKintosh, A.M.; Eadie, D. Development and evaluation of a mass media Theory of Planned Behaviour intervention to reduce speeding. Health Educ. Res. 2005, 20, 36–50. [Google Scholar] [CrossRef] [Green Version]
Publisher’s Note: MDPI stays neutral with regard to jurisdictional claims in published maps and institutional affiliations. |
© 2022 by the authors. Licensee MDPI, Basel, Switzerland. This article is an open access article distributed under the terms and conditions of the Creative Commons Attribution (CC BY) license (https://creativecommons.org/licenses/by/4.0/).